
Mortality Trends and Characteristics in a Tertiary Hospital in Southwest Saudi Arabia: A 5-Year Retrospective Study

 , , , , and
Abstract
1. Introduction
2. Materials and Methods
2.1. Study Design, Data Sources, and Setting
2.2. Study Variables and Operational Definitions
2.3. Statistical Analysis
2.4. GenAI Use in the Manuscript
2.5. Ethical Consideration
3. Results
4. Discussion
5. Conclusions
Author Contributions
Funding
Institutional Review Board Statement
Informed Consent Statement
Data Availability Statement
Acknowledgments
Conflicts of Interest
Abbreviations
| ICU | intensive care unit |
| LOS | length of stay |
| CI | confidence interval |
| ICD | International Classification of Diseases |
| KFCH | King Fahad Central Hospital |
References
- English, M.; Mwaniki, P.; Julius, T.; Chepkirui, M.; Gathara, D.; Ouma, P.O.; Cherutich, P.; Okiro, E.A.; Snow, R.W. Hospital Mortality—A neglected but rich source of information supporting the transition to higher quality health systems in low- and middle-income countries. BMC Med. 2018, 16, 32. [Google Scholar] [CrossRef] [PubMed]
- Griffiths, C.; Brock, A. Mortality trends in England and Wales. Health Stat. Q. 2003, 18, 5–24. [Google Scholar]
- Rey, G.; Aouba, A.; Pavillon, G.; Hoffmann, R.; Plug, I.; Westerling, R.; Jougla, E.; Mackenbach, J. Cause-specific mortality time series analysis: A general method to detect and correct for abrupt data production changes. Popul. Health Metr. 2011, 9, 52. [Google Scholar] [CrossRef] [PubMed] [PubMed Central]
- Ansary, L.A.; Esmaeil, S.A.; Adi, Y.A. Causes of death certification of adults: An exploratory cross-sectional study at a university hospital in Riyadh, Saudi Arabia. Ann. Saudi Med. 2012, 32, 615–622. [Google Scholar] [CrossRef] [PubMed] [PubMed Central]
- Stewart, K.; Choudry, M.I.; Buckingham, R. Learning from hospital mortality. Clin. Med. 2016, 16, 530. [Google Scholar] [CrossRef] [PubMed]
- Oyebode, F. Clinical errors and medical negligence. Med. Princ. Pract. 2013, 22, 323–333. [Google Scholar] [CrossRef] [PubMed] [PubMed Central]
- Pitocco, C.; Sexton, T.R. Measuring Hospital Performance Using Mortality Rates: An Alternative to the RAMR. Int. J. Health Policy Manag. 2018, 7, 308–316. [Google Scholar] [CrossRef] [PubMed] [PubMed Central]
- Hibbard, J.H.; Stockard, J.; Tusler, M. Does publicizing hospital performance stimulate quality improvement efforts? Health Aff. 2003, 22, 84–94. [Google Scholar] [CrossRef] [PubMed]
- Hines, A.L.; Heslin, K.C.; Jiang, H.J.; Coffey, R. Trends in Observed Adult Inpatient Mortality for High-Volume Conditions, 2002–2012. In Statistical Brief #194 Healthcare Cost and Utilization Project (HCUP) Statistical Briefs [Internet]; Agency for Healthcare Research and Quality: Rockville, MD, USA, 2015; Volume 22, pp. 2005–2009. [Google Scholar]
- Aljuaid, M.; Alotair, H.; Alnajjar, F.; Alonazi, W.; Sharaf, H.; Sheshah, E.; Alashgar, L.; Alshaikh, M. Risk factors associated with in-hospital mortality patients with COVID-19 in Saudi Arabia. PLoS ONE 2022, 17, e0270062. [Google Scholar] [CrossRef] [PubMed]
- Abohamr, S.I.; Abazid, R.M.; Aldossari, M.A.; Amer, H.A.; Badhawi, O.S.; Aljunaidi, O.M.; Alzarzour, S.H.; Saadeddin, H.M.; Bhat, F.A.; Elsheikh, E. Clinical characteristics and in-hospital mortality of COVID-19 adult patients in Saudi Arabia. Saudi Med. J. 2020, 41, 1217–1226. [Google Scholar] [CrossRef] [PubMed]
- Badedi, M.; Darraj, H.; Alnami, A.Q.; Makrami, A.; Mahfouz, M.S.; Alhazmi, K.; Mahmoud, N.; Mosa, H. Epidemiological and Clinical Characteristics of Deceased COVID-19 Patients. Int. J. Gen. Med. 2021, 14, 3809–3819. [Google Scholar] [CrossRef] [PubMed]
- Rushovich, T.; Boulicault, M.; Chen, J.T.; Danielsen, A.C.; Tarrant, A.; Richardson, S.S.; Shattuck-Heidorn, H. Sex Disparities in COVID-19 Mortality Vary Across US Racial Groups. J. Gen. Intern. Med. 2021, 36, 1696–1701. [Google Scholar] [CrossRef] [PubMed] [PubMed Central]
- Woolf, S.H.; Chapman, D.A.; Sabo, R.T.; Zimmerman, E.B. Excess Deaths From COVID-19 and Other Causes in the US, March 1, 2020, to January 2, 2021. JAMA 2021, 325, 1786–1789. [Google Scholar] [CrossRef] [PubMed] [PubMed Central]
- WHO Global Excess Mortality Report (2022)—Estimates 14.9 Million Excess Deaths Globally (2020–2021), Including Indirect Effects. Available online: https://www.who.int/news/item/05-05-2022-14.9-million-excess-deaths-were-associated-with-the-covid-19-pandemic-in-2020-and-2021 (accessed on 5 April 2025).
- New Analysis Shows Hospitals Improving Performance on Key Patient Safety Measures Surpassing Pre-pandemic Levels 2024 American Hospital Association. Available online: https://www.aha.org/guidesreports/2024-09-12-new-analysis-shows-hospitals-performance-key-patient-safety-measures-surpassing-pre-pandemic-levels (accessed on 17 July 2025).
- GBD 2021 Demographics Collaborators. Global age-sex-specific mortality, life expectancy, and population estimates in 204 countries and territories and 811 subnational locations, 1950–2021, and the impact of the COVID-19 pandemic: A comprehensive demographic analysis for the Global Burden of Disease Study 2021. Lancet 2024, 403, 1989–2056. [Google Scholar]
- Shang, W.; Wang, Y.; Yuan, J.; Guo, Z.; Liu, J.; Liu, M. Global Excess Mortality during COVID-19 Pandemic: A Systematic Review and Meta-Analysis. Vaccines 2022, 10, 1702. [Google Scholar] [CrossRef] [PubMed] [PubMed Central]
- Lingsma, H.F.; Bottle, A.; Middleton, S.; Kievit, J.; Steyerberg, E.W.; Marang-van de Mheen, P.J. Evaluation of hospital outcomes: The relation between length-of-stay, readmission, and mortality in a large international administrative database. BMC Health Serv. Res. 2018, 18, 116. [Google Scholar] [CrossRef] [PubMed] [PubMed Central]
- Quah, P.; Li, A.; Phua, J. Mortality rates of patients with COVID-19 in the intensive care unit: A systematic review of the emerging literature. Crit. Care 2020, 24, 285. [Google Scholar] [CrossRef] [PubMed] [PubMed Central]
- Bravata, D.M.; Perkins, A.J.; Myers, L.J.; Arling, G.; Zhang, Y.; Zillich, A.J.; Reese, L.; Dysangco, A.; Agarwal, R.; Myers, J.; et al. Association of Intensive Care Unit Patient Load and Demand with Mortality Rates in US Department of Veterans Affairs Hospitals During the COVID-19 Pandemic. JAMA Netw. Open 2021, 4, e2034266. [Google Scholar] [CrossRef] [PubMed] [PubMed Central]
- Kim, S.; Choi, H.; Sim, J.K.; Jung, W.J.; Lee, Y.S.; Kim, J.H. Comparison of clinical characteristics and hospital mortality in critically ill patients without COVID-19 before and during the COVID-19 pandemic: A multicenter, retrospective, propensity score-matched study. Ann. Intensive Care 2022, 12, 57. [Google Scholar] [CrossRef] [PubMed] [PubMed Central]


| Characteristic | Year of Admission | All Years | |||||||||||
|---|---|---|---|---|---|---|---|---|---|---|---|---|---|
| 2018 | 2019 | 2020 | 2021 | 2022 | |||||||||
| N | % | N | % | N | % | N | % | N | % | N | % | ||
| Gender | Male | 4339 | (37.9) | 3607 | (35.6) | 4938 | (41.1) | 6013 | (43.2) | 6646 | (44.3) | 25,543 | (40.9) |
| Female | 7109 | (62.1) | 6516 | (64.4) | 7068 | (58.9) | 7918 | (56.8) | 8360 | (55.7) | 36,971 | (59.1) | |
| Age groups | <1 year | 3428 | (29.9) | 2978 | (29.4) | 3173 | (26.4) | 3278 | (23.5) | 3271 | (21.8) | 16,128 | (25.8) |
| 1–4 years | 588 | (5.1) | 433 | (4.3) | 586 | (4.9) | 793 | (5.7) | 1089 | (7.3) | 3489 | (5.6) | |
| 5–14 years | 825 | (7.2) | 687 | (6.8) | 835 | (7.0) | 1130 | (8.1) | 1509 | (10.1) | 4986 | (8.0) | |
| 15–29 years | 2953 | (25.8) | 2536 | (25.0) | 2710 | (22.6) | 2888 | (20.7) | 3069 | (20.4) | 14,156 | (22.6) | |
| 30–44 years | 2442 | (21.3) | 2353 | (23.2) | 2662 | (22.2) | 2987 | (21.4) | 3237 | (21.6) | 13,681 | (21.9) | |
| 45–59 years | 526 | (4.6) | 507 | (5.0) | 836 | (7.0) | 1140 | (8.2) | 1113 | (7.4) | 4122 | (6.6) | |
| 60 + Years | 688 | (6.0) | 633 | (6.3) | 1207 | (10.1) | 1719 | (12.3) | 1725 | (11.5) | 5972 | (9.6) | |
| Nationality | Saudi | 8950 | (78.2) | 7736 | (76.4) | 9495 | (79.1) | 11,349 | (81.4) | 12,308 | (82.0) | 49,838 | (79.7) |
| Non-Saudi | 2500 | (21.8) | 2391 | (23.6) | 2514 | (20.9) | 2586 | (18.6) | 2705 | (18.0) | 12,696 | (20.3) | |
| Department | General Bed | 10,252 | (89.5) | 9021 | (89.1) | 10,142 | (84.5) | 11,588 | (83.2) | 12,496 | (83.2) | 53,499 | (85.6) |
| ICU | 1198 | (10.5) | 1106 | (10.9) | 1867 | (15.5) | 2347 | (16.8) | 2517 | (16.8) | 9035 | (14.4) | |
| Descriptive measures | Measure | Mean | SD | Mean | SD | Mean | SD | Mean | SD | Mean | SD | Mean | SD |
| Age | 21.3 | 20.6 | 22.2 | 20.8 | 25.1 | 22.9 | 26.9 | 24.2 | 26.2 | 23.7 | 24.6 | 22.8 | |
| LOS | 7.8 | 24.6 | 8.1 | 21.4 | 7.7 | 18.2 | 7.5 | 14.8 | 6.6 | 10.6 | 7.5 | 18.0 | |
| All patients | N | 11,450 | 10,127 | 12,009 | 13,935 | 15,013 | 62,534 | ||||||
| Characteristic | Rate Per 100 Persons Hospitalized | p-Value | Effect Size Phi φ/Cramer’s V | ||||
|---|---|---|---|---|---|---|---|
| Deaths | Mortality Rate | 95% CI | |||||
| Lower Limit | Upper Limit | ||||||
| Gender | Male | 1790 | 7.0 | 6.7 | 7.3 | <0.001 | 0.09 |
| Female | 1195 | 3.2 | 3.1 | 3.4 | |||
| Nationality | Saudi | 2137 | 4.3 | 4.1 | 4.5 | <0.001 | 0.04 |
| Non-Saudi | 859 | 6.8 | 6.3 | 7.2 | |||
| Age groups | Less than 1 year | 757 | 4.7 | 4.4 | 5.0 | <0.001 | 0.21 |
| 1–4 years | 114 | 3.3 | 2.7 | 3.9 | |||
| 5–14 years | 132 | 2.6 | 2.2 | 3.1 | |||
| 15–29 years | 267 | 1.9 | 1.7 | 2.1 | |||
| 30–44 years | 333 | 2.4 | 2.2 | 2.7 | |||
| 45–59 years | 364 | 8.8 | 8.0 | 9.7 | |||
| 60 years and above | 1029 | 17.2 | 16.3 | 18.2 | |||
| LOS | Short stay | 492 | 2.0 | 1.8 | 2.1 | <0.001 | 0.17 |
| Medium stay | 652 | 3.3 | 3.1 | 3.6 | |||
| Long stays | 1852 | 10.3 | 9.9 | 10.8 | |||
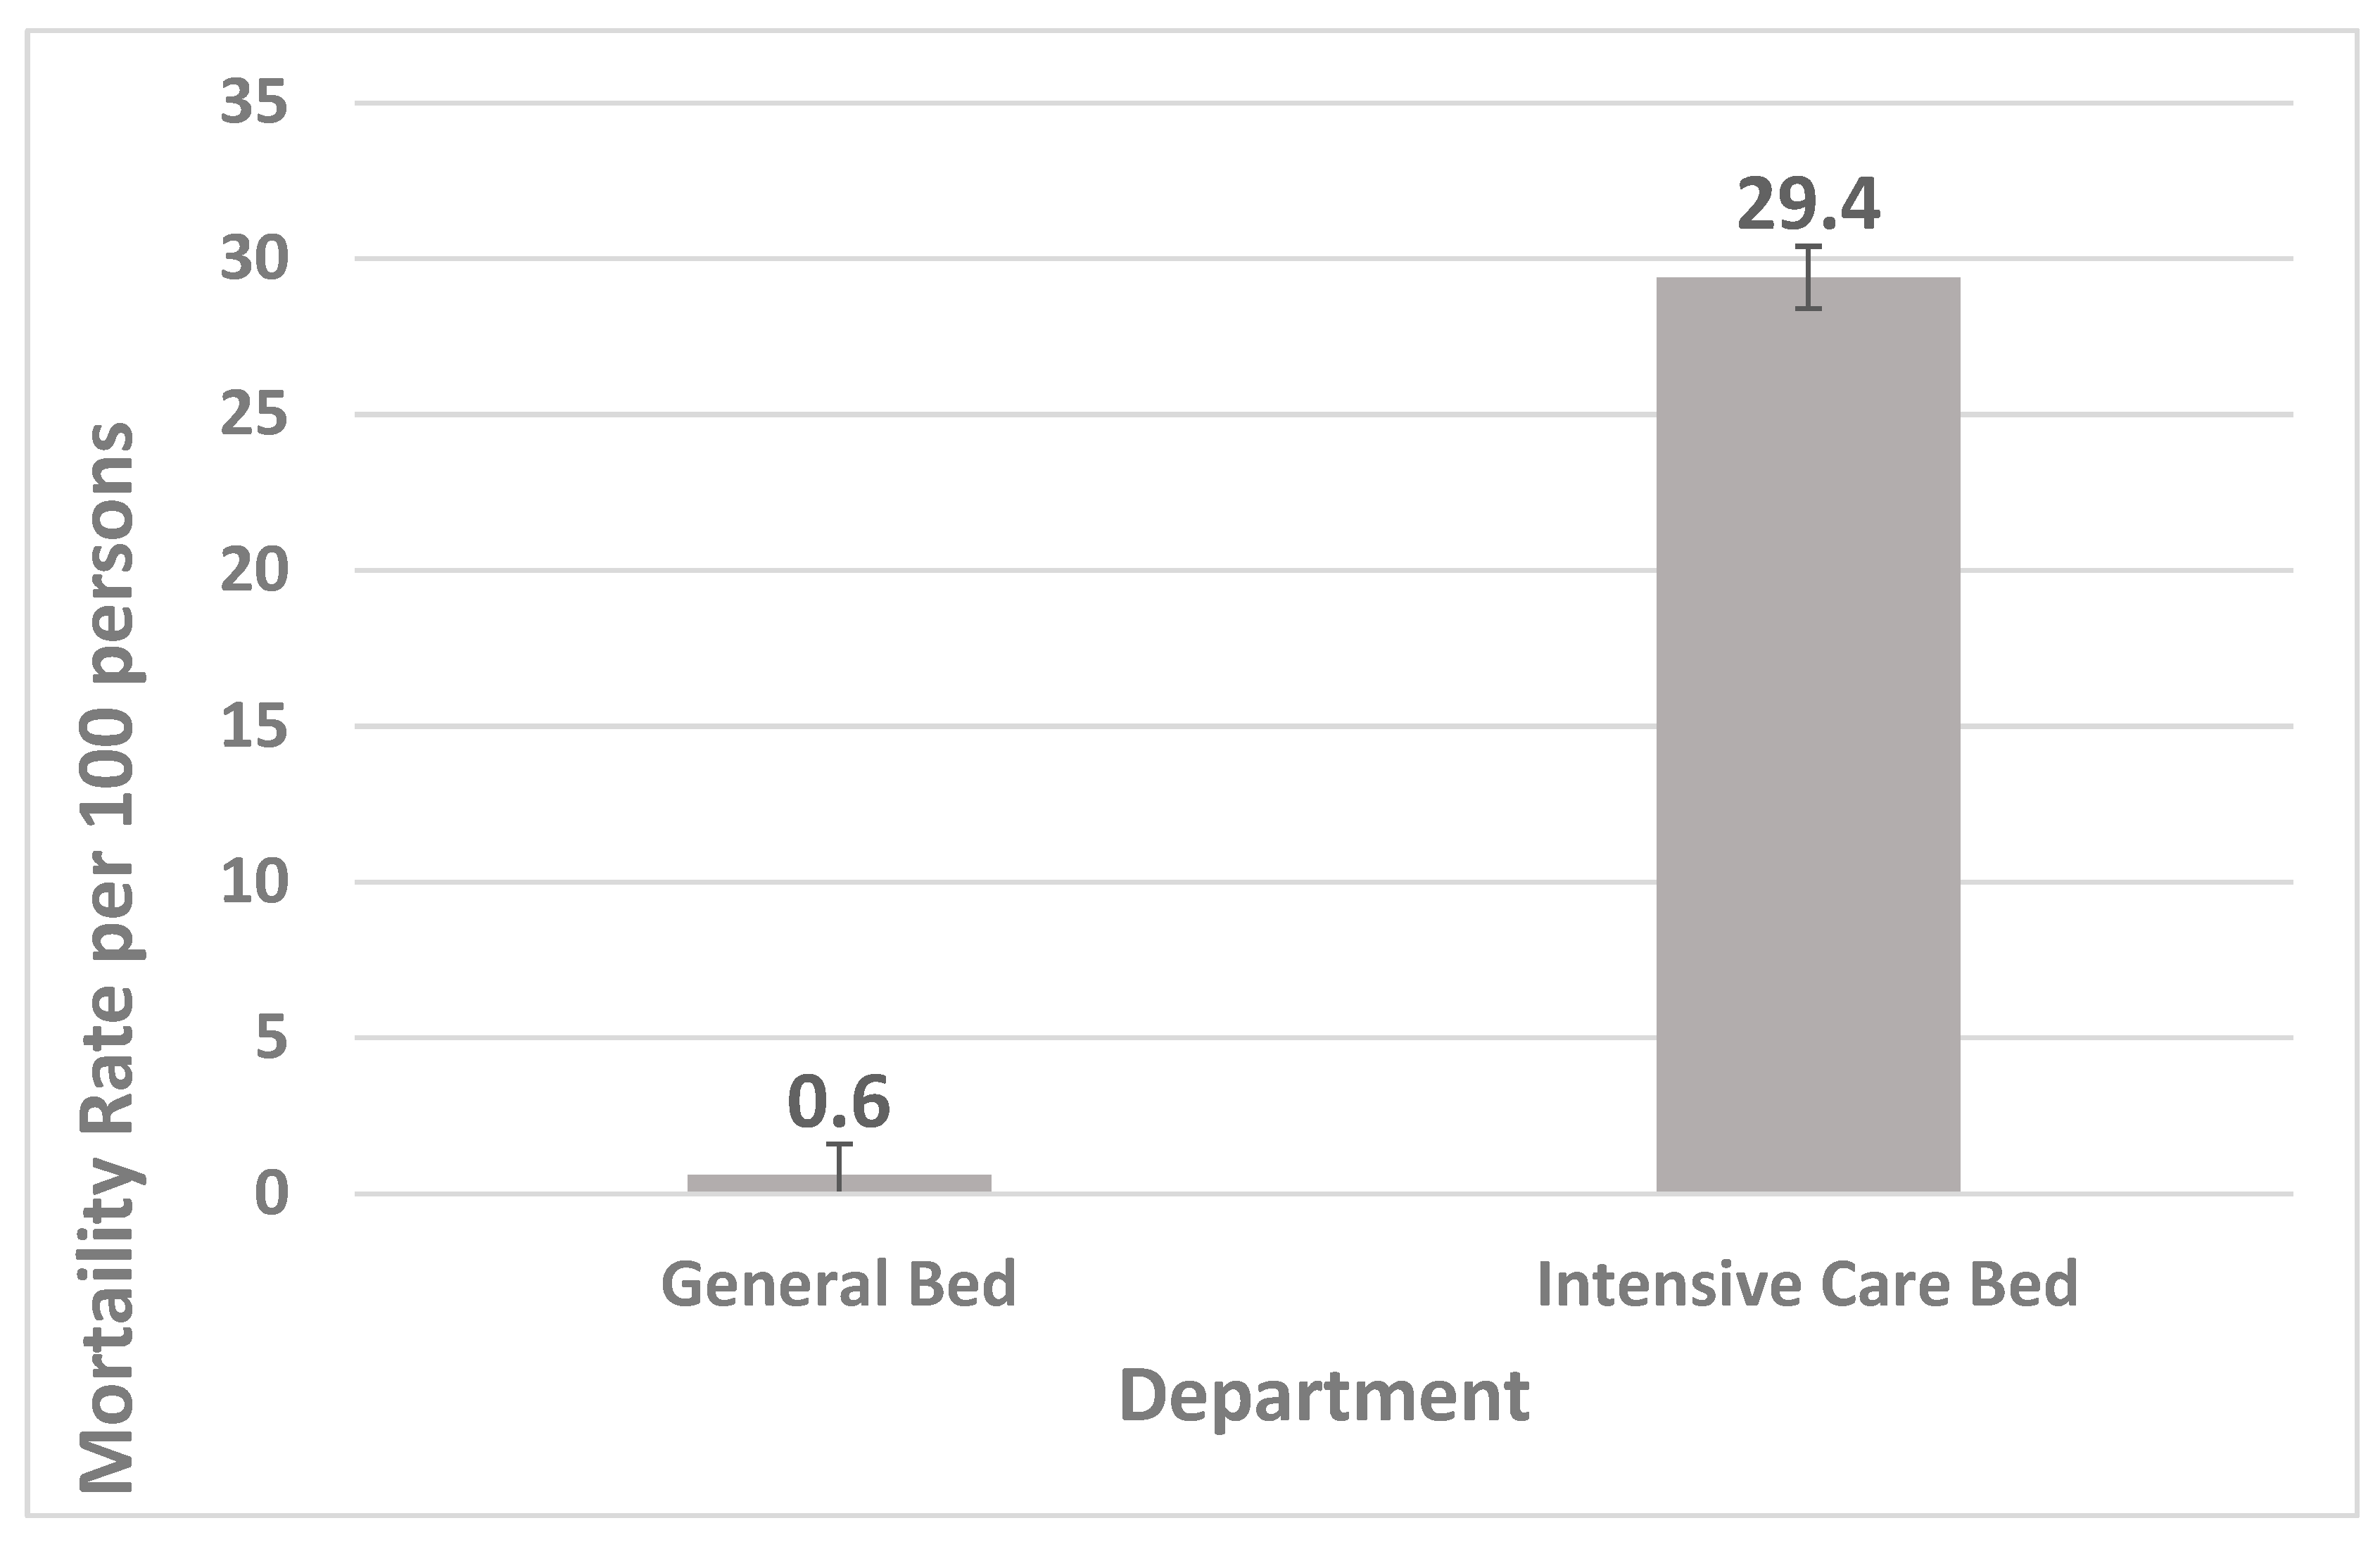
| Department | General bed | 338 | 0.6 | 0.6 | 0.7 | <0.001 | 0.47 |
| Intensive care bed | 2658 | 29.4 | 28.5 | 30.4 | |||
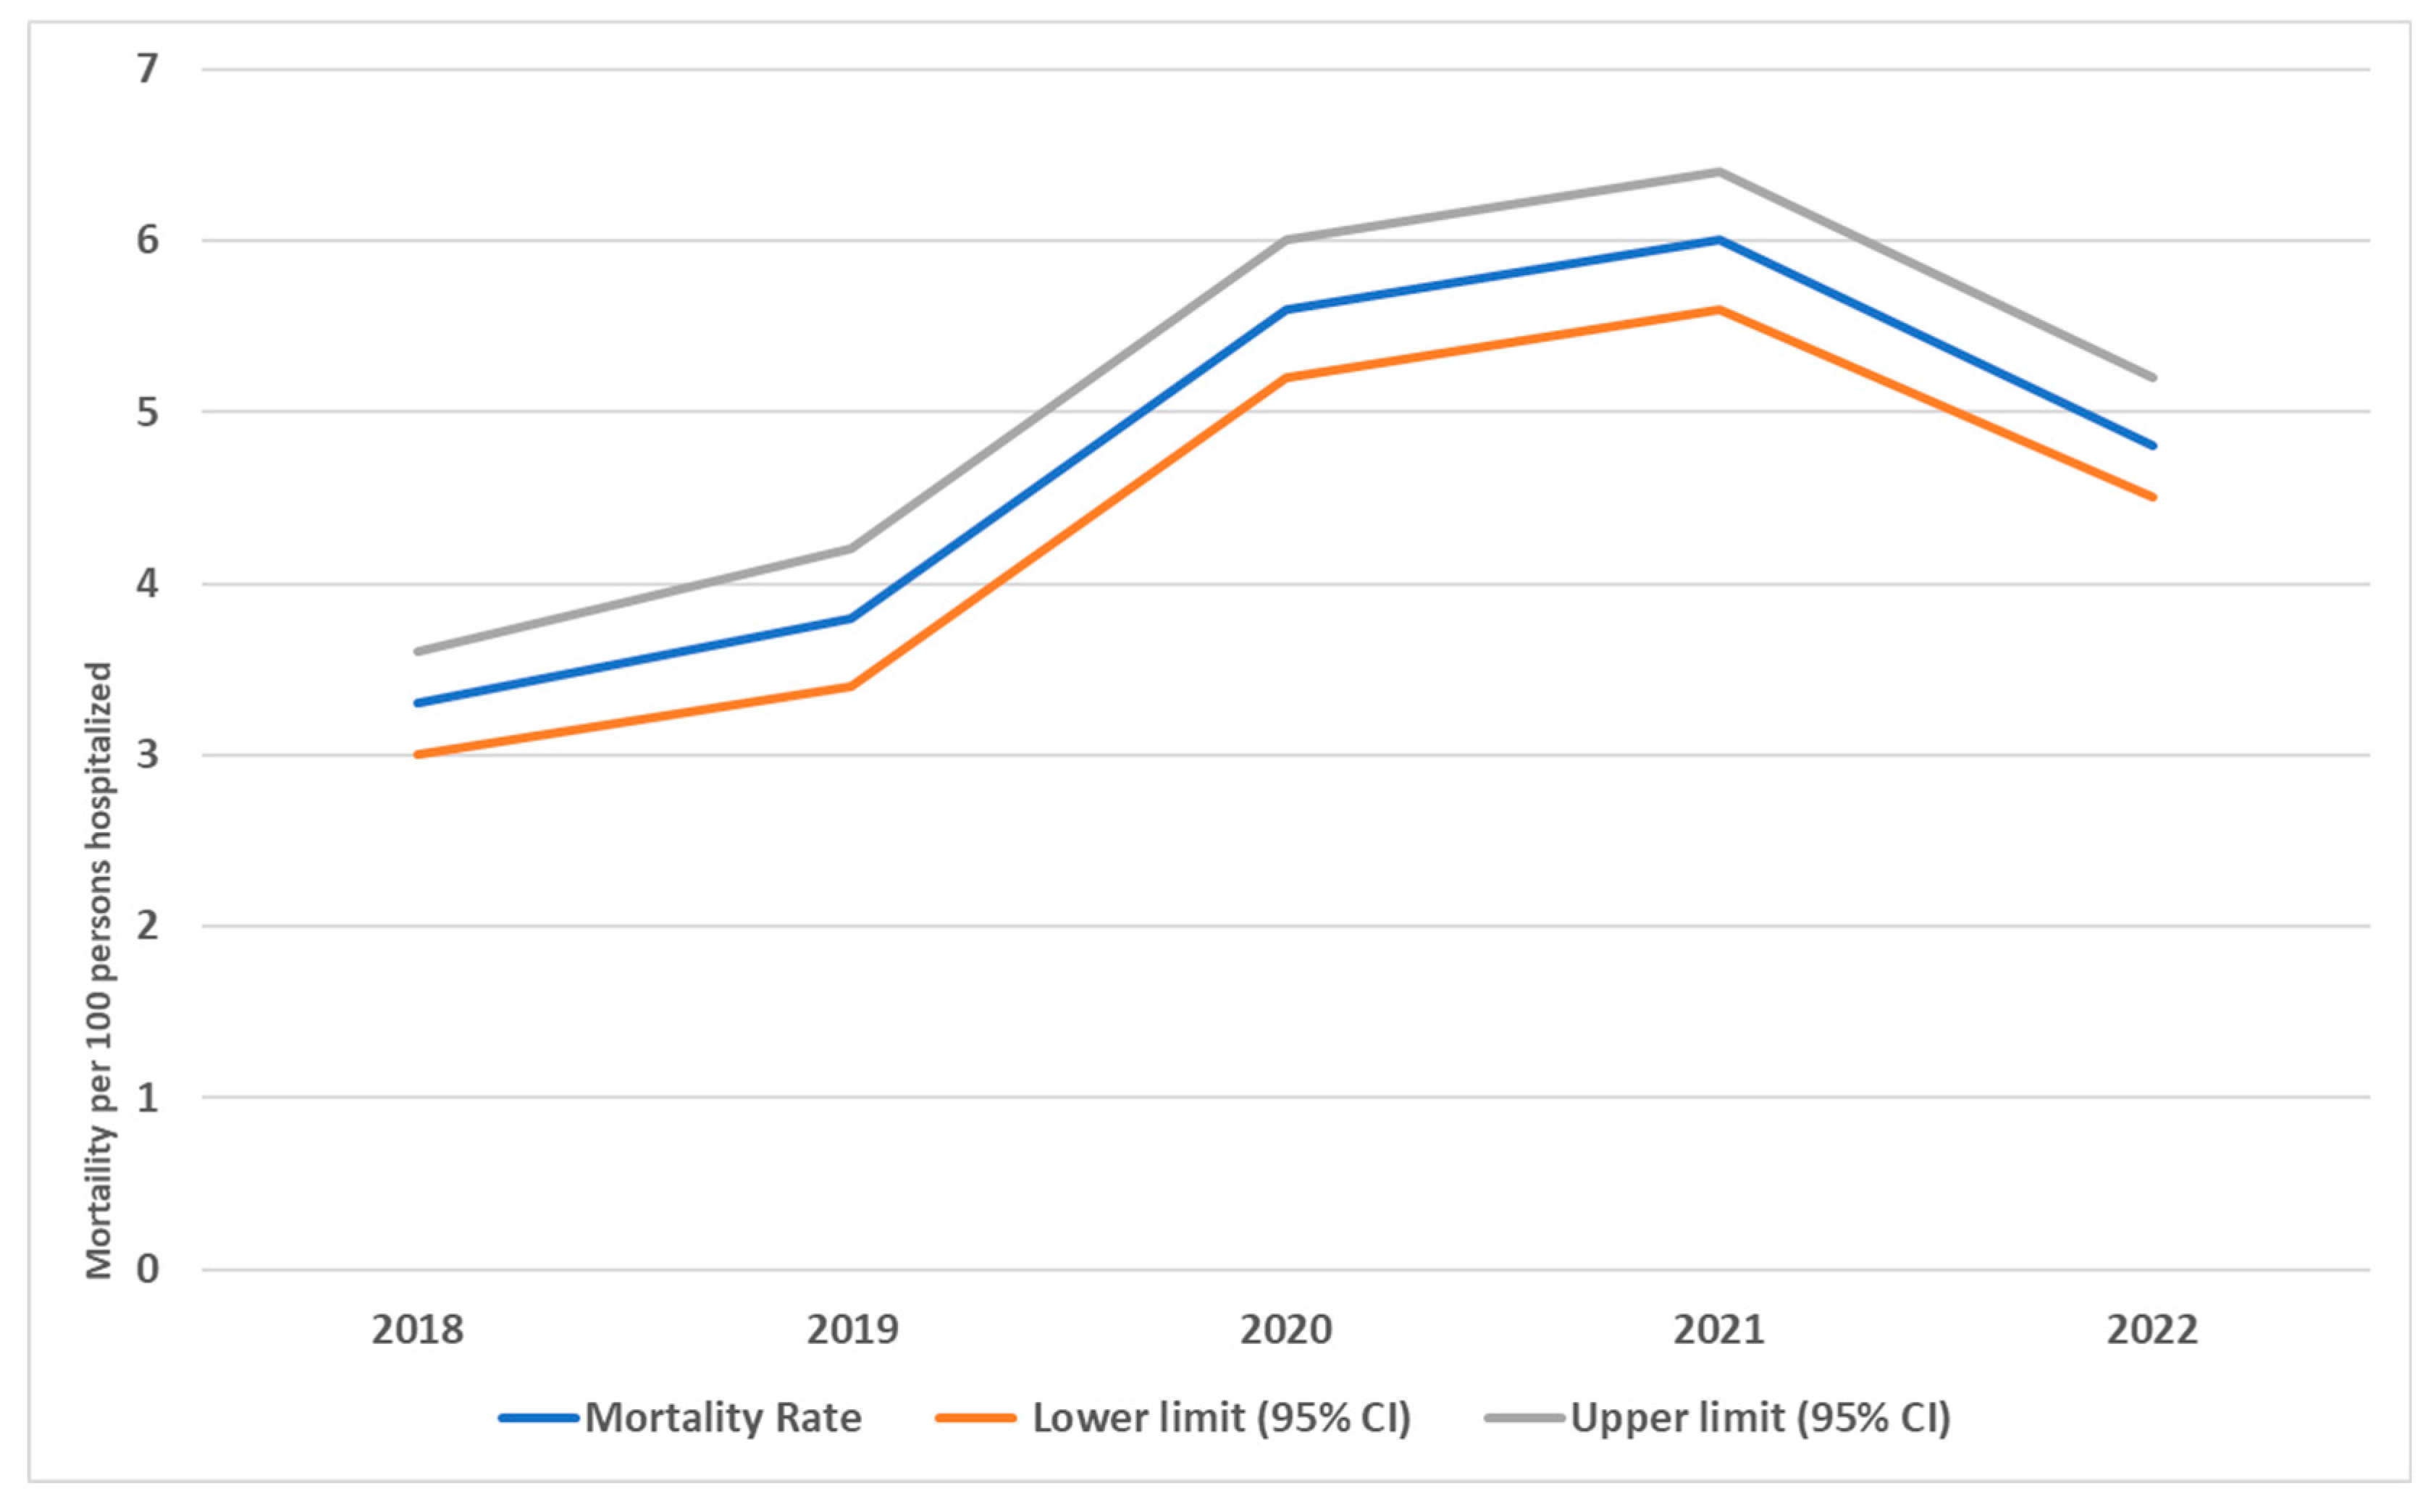
| Years | 2018 | 377 | 3.3 | 3.0 | 3.6 | <0.001 | 0.05 |
| 2019 | 385 | 3.8 | 3.4 | 4.2 | |||
| 2020 | 675 | 5.6 | 5.2 | 6.0 | |||
| 2021 | 833 | 6.0 | 5.6 | 6.4 | |||
| 2022 | 726 | 4.8 | 4.5 | 5.2 | |||
| Overall | 2996 | 4.8 | 4.6 | 5.0 | |||
| Years | Gender | Age Group | LOS | Department | |||||||||||
|---|---|---|---|---|---|---|---|---|---|---|---|---|---|---|---|
| Male | Female | Less than 1 Year | 1–4 Years | 5–14 Years | 15–29 Years | 30–44 Years | 45–59 Years | 60 Years and Above | Short Stay | Medium Stay | Long Stays | General Bed | Intensive Care Bed | ||
| 2018 | N | 218 | 157 | 134 | 13 | 21 | 35 | 36 | 38 | 100 | 64 | 88 | 225 | 75 | 302 |
| % | 5.0 | 2.2 | 3.9 | 2.2 | 2.5 | 1.2 | 1.5 | 7.2 | 14.5 | 1.3 | 2.5 | 7.1 | 0.7 | 25.2 | |
| Lower CI | 4.4 | 1.9 | 3.3 | 1.2 | 1.6 | 0.8 | 1.1 | 5.2 | 12.1 | 1.0 | 2.0 | 6.3 | 0.6 | 22.8 | |
| Upper CI | 5.7 | 2.6 | 4.6 | 3.6 | 3.8 | 1.6 | 2.0 | 9.7 | 17.3 | 1.7 | 3.1 | 8.0 | 0.9 | 27.7 | |
| 2019 | N | 236 | 147 | 130 | 25 | 24 | 35 | 41 | 42 | 88 | 49 | 102 | 234 | 79 | 306 |
| % | 6.5 | 2.3 | 4.4 | 5.8 | 3.5 | 1.4 | 1.7 | 8.3 | 13.9 | 1.2 | 3.3 | 8.1 | 0.9 | 27.7 | |
| Lower CI | 5.8 | 1.9 | 3.7 | 3.9 | 2.3 | 1.0 | 1.3 | 6.1 | 11.4 | 0.9 | 2.7 | 7.2 | 0.7 | 25.1 | |
| Upper CI | 7.4 | 2.6 | 5.1 | 8.3 | 5.1 | 1.9 | 2.3 | 10.9 | 16.8 | 1.5 | 4.0 | 9.2 | 1.1 | 30.4 | |
| 2020 | N | 407 | 266 | 155 | 22 | 23 | 44 | 71 | 105 | 255 | 110 | 149 | 416 | 89 | 586 |
| % | 8.2 | 3.8 | 4.9 | 3.8 | 2.8 | 1.6 | 2.7 | 12.6 | 21.1 | 2.2 | 4.4 | 11.8 | 0.9 | 31.4 | |
| Lower CI | 7.5 | 3.3 | 4.2 | 2.4 | 1.8 | 1.2 | 2.1 | 10.4 | 18.9 | 1.8 | 3.7 | 10.7 | 0.7 | 29.3 | |
| Upper CI | 9.0 | 4.2 | 5.7 | 5.5 | 4.0 | 2.2 | 3.3 | 14.9 | 23.5 | 2.6 | 5.1 | 12.9 | 1.1 | 33.5 | |
| 2021 | N | 486 | 346 | 199 | 24 | 24 | 69 | 90 | 100 | 327 | 141 | 146 | 546 | 63 | 770 |
| % | 8.1 | 4.4 | 6.1 | 3.0 | 2.1 | 2.4 | 3.0 | 8.8 | 19.0 | 2.5 | 3.5 | 13.2 | 0.5 | 32.8 | |
| Lower CI | 7.4 | 3.9 | 5.3 | 2.0 | 1.4 | 1.9 | 2.4 | 7.2 | 17.2 | 2.1 | 2.9 | 12.2 | 0.4 | 30.9 | |
| Upper CI | 8.8 | 4.8 | 6.9 | 4.4 | 3.1 | 3.0 | 3.7 | 10.5 | 20.9 | 3.0 | 4.0 | 14.3 | 0.7 | 34.7 | |
| 2022 | N | 443 | 279 | 139 | 30 | 40 | 84 | 95 | 79 | 259 | 128 | 167 | 431 | 32 | 694 |
| % | 6.7 | 3.3 | 4.2 | 2.8 | 2.7 | 2.7 | 2.9 | 7.1 | 15.0 | 2.3 | 3.2 | 10.1 | 0.3 | 27.6 | |
| Lower CI | 6.1 | 3.0 | 3.6 | 1.9 | 1.9 | 2.2 | 2.4 | 5.7 | 13.4 | 2.0 | 2.7 | 9.3 | 0.2 | 25.9 | |
| Upper CI | 7.3 | 3.7 | 5.0 | 3.9 | 3.6 | 3.4 | 3.6 | 8.7 | 16.8 | 2.8 | 3.7 | 11.1 | 0.4 | 29.3 | |
| Group of Disease | Years | Total | ||||
|---|---|---|---|---|---|---|
| 2018 | 2019 | 2020 | 2021 | 2022 | ||
| Certain conditions originating in the perinatal period (P00-P96) | 18% | 21% | 13% | 15% | 11% | 15% |
| Certain infectious and parasitic diseases (A00-B99) | 11% | 13% | 9% | 5% | 5% | 8% |
| Codes for special purposes (U00-U85) | 0% | 0% | 26% | 19% | 4% | 12% |
| Congenital malformations, deformations, and chromosomal abnormalities (Q00-Q99) | 7% | 3% | 2% | 2% | 3% | 3% |
| Diseases of the blood and blood-forming organs and certain disorders involving the immune mechanism (D50-D89) | 1% | 1% | 1% | 1% | 2% | 1% |
| Diseases of the circulatory system (I00-I99) | 10% | 11% | 9% | 11% | 17% | 12% |
| Diseases of the digestive system (K00-K93) | 9% | 8% | 6% | 6% | 5% | 6% |
| Diseases of the genitourinary system (N00-N99) | 7% | 7% | 7% | 7% | 7% | 7% |
| Diseases of the musculoskeletal system and connective tissue (M00-M99) | 1% | 1% | 0% | 0% | 0% | 0% |
| Diseases of the nervous system (G00-G99) | 2% | 3% | 2% | 3% | 3% | 3% |
| Diseases of the respiratory system (J00-J99) | 7% | 9% | 6% | 5% | 9% | 7% |
| Diseases of the skin and subcutaneous tissue (l00-l99) | 1% | 0% | 0% | 0% | 0% | 0% |
| Endocrine, nutritional, and metabolic diseases (E00-E90) | 2% | 2% | 2% | 1% | 2% | 1% |
| Facexternal causes of morbidity and mortality (V01-Y98) | 0% | 2% | 2% | 1% | 3% | 2% |
| Factors influencing health status and contact with health services (Z00-Z99) | 2% | 2% | 1% | 2% | 2% | 2% |
| Injury, poisoning, and certain other consequences of external causes (S00-T98) | 14% | 11% | 6% | 11% | 15% | 11% |
| Mental and behavioral disorders (F00-F99) | 0% | 0% | 0% | 0% | 0% | 0% |
| Neoplasms (C00-D48) | 2% | 2% | 1% | 2% | 1% | 1% |
| Pregnancy, childbirth, and the puerperium (O00-O99) | 1% | 1% | 1% | 0% | 1% | 1% |
| Symptoms, signs, and abnormal clinical and laboratory findings, not elsewhere classified (R00-R99) | 3% | 4% | 4% | 7% | 10% | 6% |
| Missing and unclassified | 2% | 2% | 2% | 1% | 0% | 1% |
| Total | 100% | 100% | 100% | 100% | 100% | 100% |
| Factors | p-Value | COR | 95% CI | |
|---|---|---|---|---|
| Lower | Upper | |||
| Gender | ||||
| Female | 1 | |||
| Male | <0.001 | 2.26 | 2.09 | 2.43 |
| Age groups | ||||
| Less than 5 years | 1 | |||
| 5–44 years | <0.001 | 0.49 | 0.44 | 0.54 |
| 45 years and more | <0.001 | 3.45 | 3.15 | 3.76 |
| Department | ||||
| General bed | ||||
| Intensive care bed | <0.001 | 0.015 | 0.014 | 0.017 |
| Length of stay in days | ||||
| Short stay | 1 | |||
| Medium stay | <0.001 | 1.73 | 1.53 | 1.94 |
| Long stay | <0.001 | 5.75 | 5.19 | 6.36 |
Disclaimer/Publisher’s Note: The statements, opinions and data contained in all publications are solely those of the individual author(s) and contributor(s) and not of MDPI and/or the editor(s). MDPI and/or the editor(s) disclaim responsibility for any injury to people or property resulting from any ideas, methods, instructions or products referred to in the content. |
© 2025 by the authors. Published by MDPI on behalf of the Lithuanian University of Health Sciences. Licensee MDPI, Basel, Switzerland. This article is an open access article distributed under the terms and conditions of the Creative Commons Attribution (CC BY) license (https://creativecommons.org/licenses/by/4.0/).
Share and Cite
Shaabi, L.A.; Mahfouz, M.S.; Shamakhi, A.E.; Alahdal, F.A.A.; Hakamy, A.; Rajhi, F. Mortality Trends and Characteristics in a Tertiary Hospital in Southwest Saudi Arabia: A 5-Year Retrospective Study. Medicina 2025, 61, 1334. https://doi.org/10.3390/medicina61081334
Shaabi LA, Mahfouz MS, Shamakhi AE, Alahdal FAA, Hakamy A, Rajhi F. Mortality Trends and Characteristics in a Tertiary Hospital in Southwest Saudi Arabia: A 5-Year Retrospective Study. Medicina. 2025; 61(8):1334. https://doi.org/10.3390/medicina61081334
Chicago/Turabian StyleShaabi, Layla Ali, Mohamed Salih Mahfouz, Ahmed Essa Shamakhi, Fathadin Ali Abdu Alahdal, Ali Hakamy, and Fatma Rajhi. 2025. "Mortality Trends and Characteristics in a Tertiary Hospital in Southwest Saudi Arabia: A 5-Year Retrospective Study" Medicina 61, no. 8: 1334. https://doi.org/10.3390/medicina61081334
APA StyleShaabi, L. A., Mahfouz, M. S., Shamakhi, A. E., Alahdal, F. A. A., Hakamy, A., & Rajhi, F. (2025). Mortality Trends and Characteristics in a Tertiary Hospital in Southwest Saudi Arabia: A 5-Year Retrospective Study. Medicina, 61(8), 1334. https://doi.org/10.3390/medicina61081334