
Functional Disability and Psychological Impact in Headache Patients: A Comparative Study Using Conventional Statistics and Machine Learning Analysis

 , , ,
, , ,
Abstract
1. Introduction
2. Materials and Methods
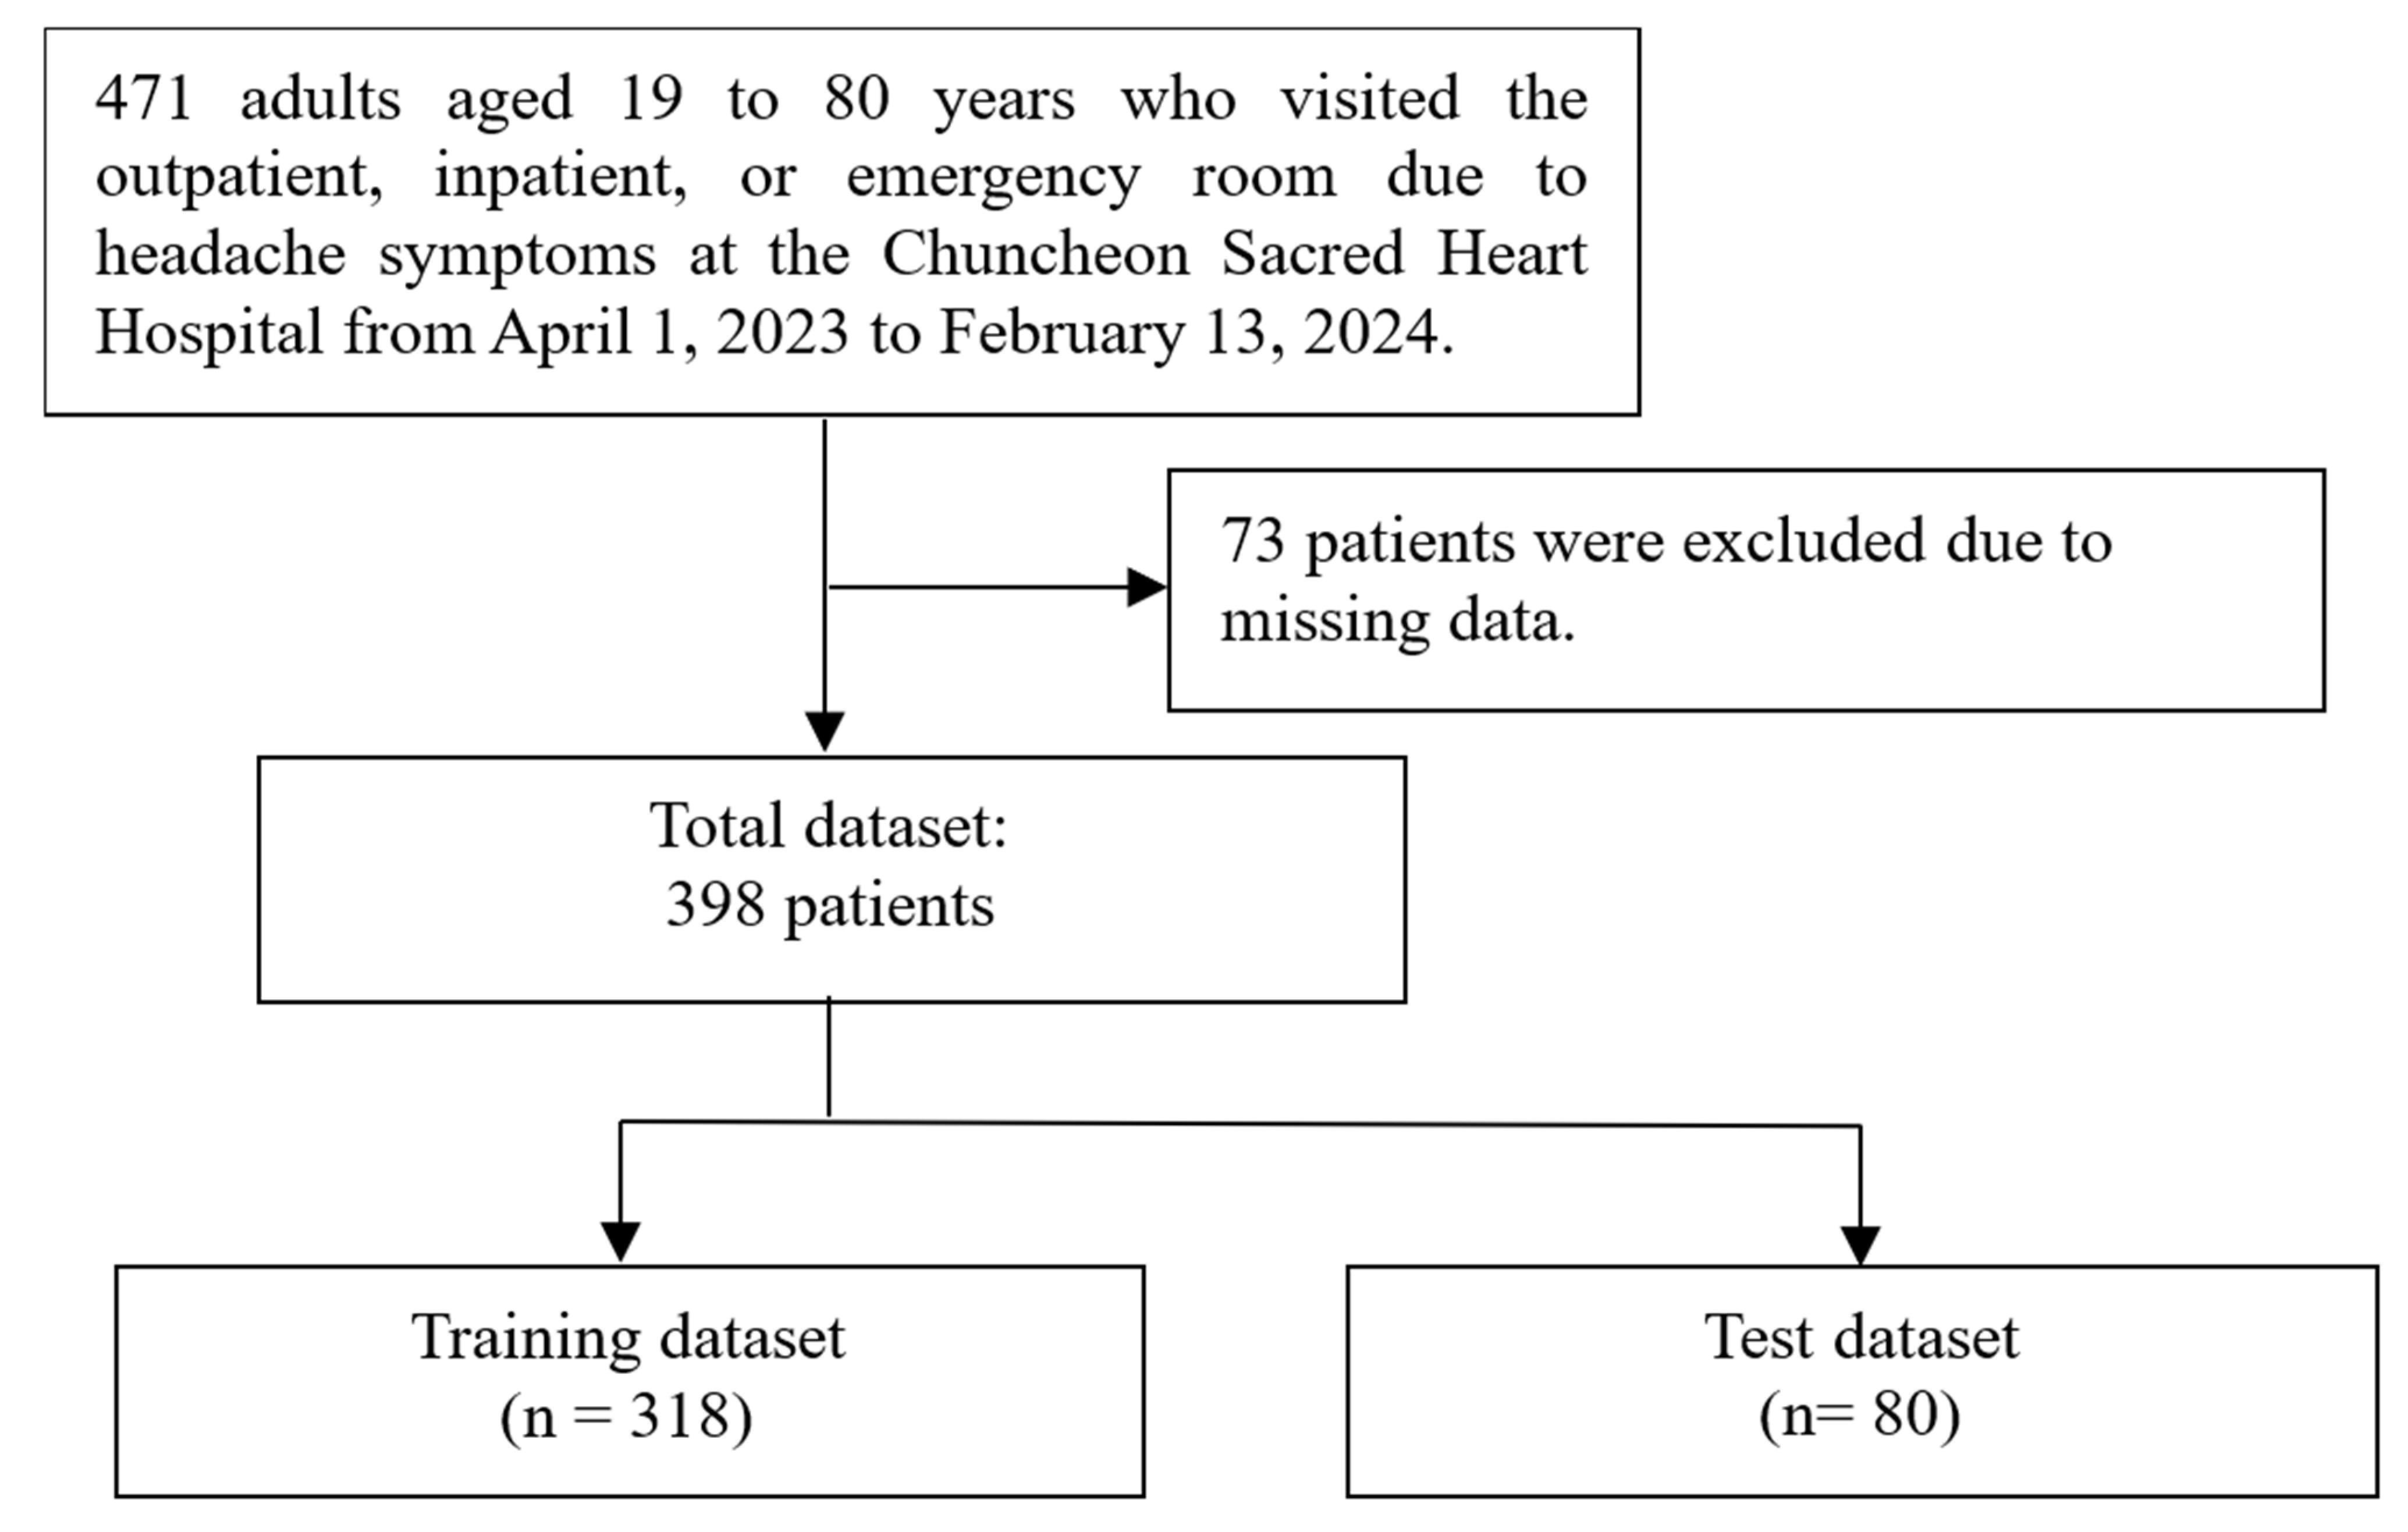
2.1. Study Design
2.2. Ethical Approval and Informed Consent
2.3. Data Source and Factors Associated with Headache

| Question | Answer |
|---|---|
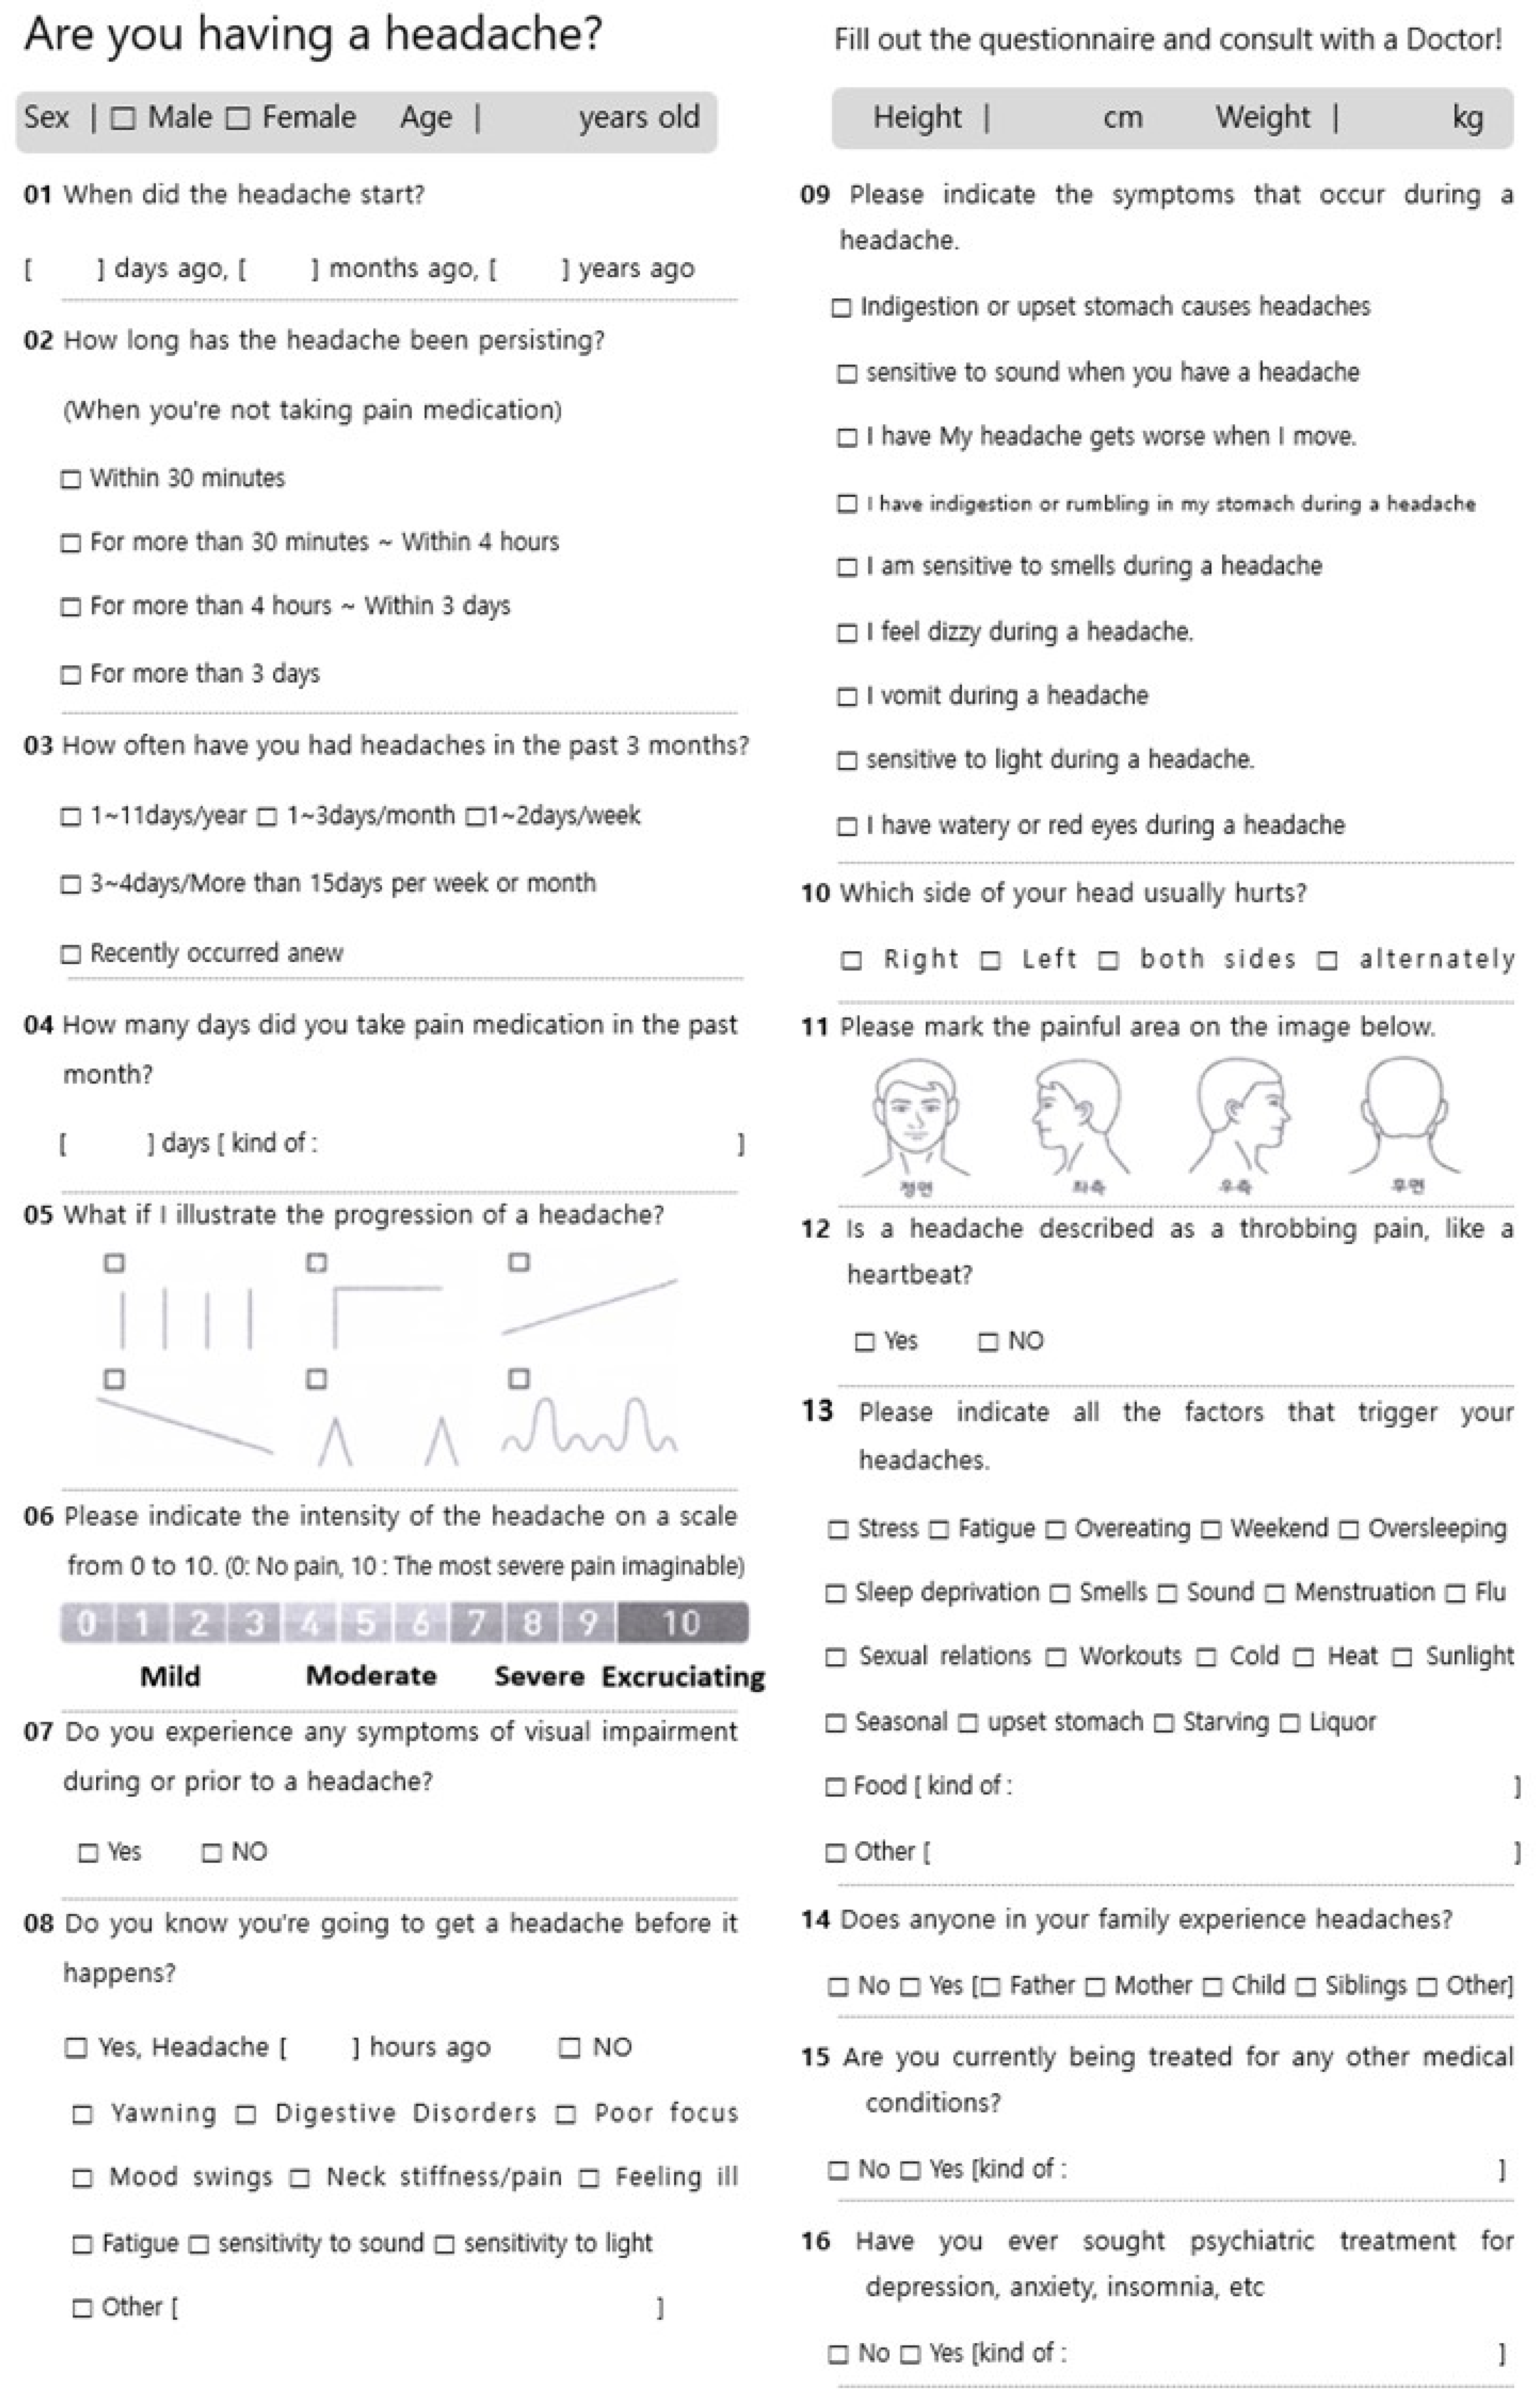
| When did your headache start? | □ days ago, □ months ago, □ years ago |
| How long does the headache last? If you don’t take painkillers. | Within 30 min; More than 30 min to 4 h; More than 4 h~3 days; Three days or more |
| How often have you had headaches in the past 3 months? | 1–11 days/year; 1–3 days/month; 1–2 days/week; 3–4 days/week or more than 15 days/month; newly occurred recently |
| How many days have you taken painkillers in the past month? | □ days [type: ] |
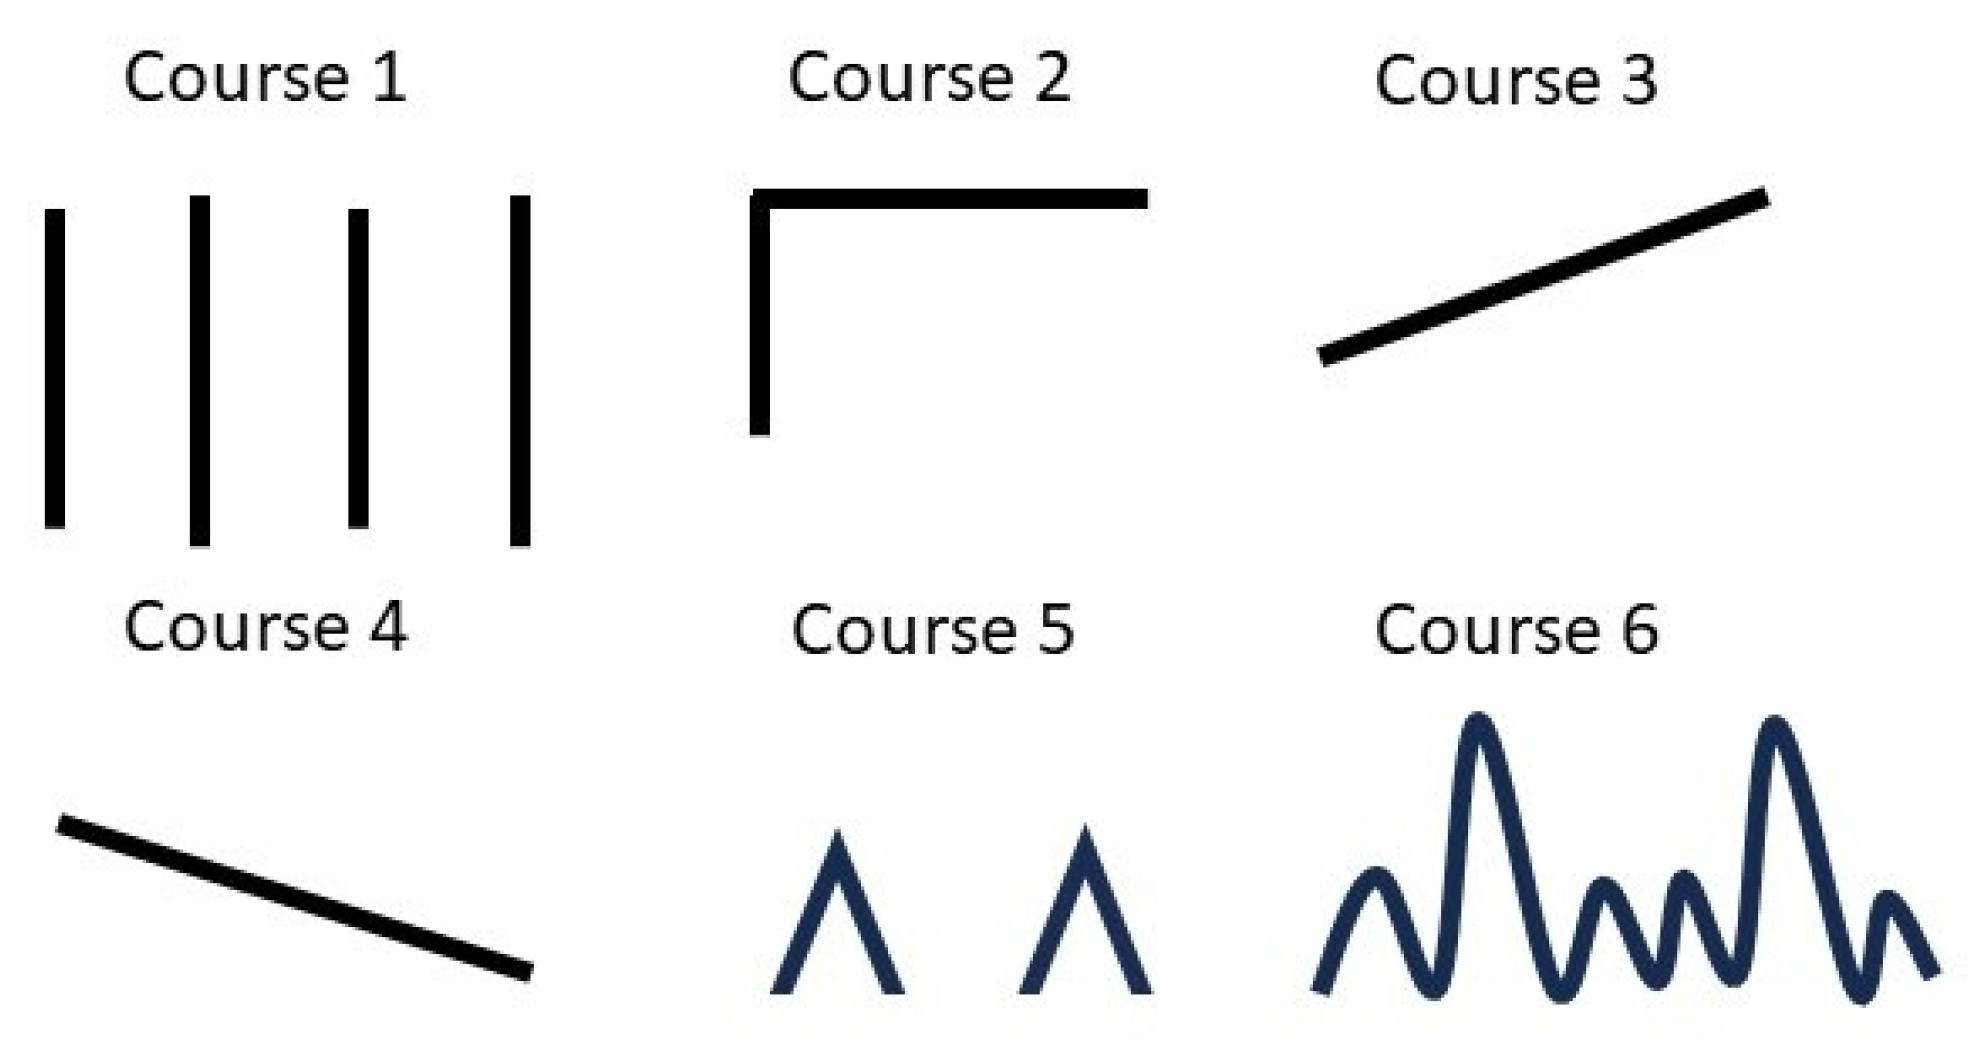
| What if you indicate the progress of your headache? Figure 1 illustrates the options for selecting headache course in the figure. | Figure 1. |
| Please indicate the intensity of your headache on a scale from 0 to 10. | 0: No pain, 10: The most severe pain imaginable. |
| Do you experience any symptoms that are not visible during a headache or prior to its onset? | □ Yes □ No |
| Do you anticipate or foresee the occurrence of a headache before its onset? | If yes: □ hours before headache; Symptoms that can predict or anticipate the onset of a headache before it occurs: yawning, digestive disturbances, impaired concentration, mood changes, stiffness/pain in the neck, feeling of impending pain, fatigue, decreased appetite, sensitivity to sound, sensitivity to light, and others. |
| Please specify the symptoms youexperience while experiencing a headache. |
|
| Which side of your head primarily hurts? | Right; left; both; alternatingly |
| Please indicate all factors that trigger your headaches. | Stress, fatigue, overeating, weekends, oversleeping, lack of sleep, noise, menstruation, colds, sexual activity, exercise, cold weather, hot weather, sunlight, change of seasons, upset stomach, hunger, alcohol, food, and others |
| Does anyone in your family experience headaches? | if yes: father, mother, children, sibling |
| Are you currently being treated for any other medical conditions? | □ No □ Yes If yes: The type of medical treatment received |
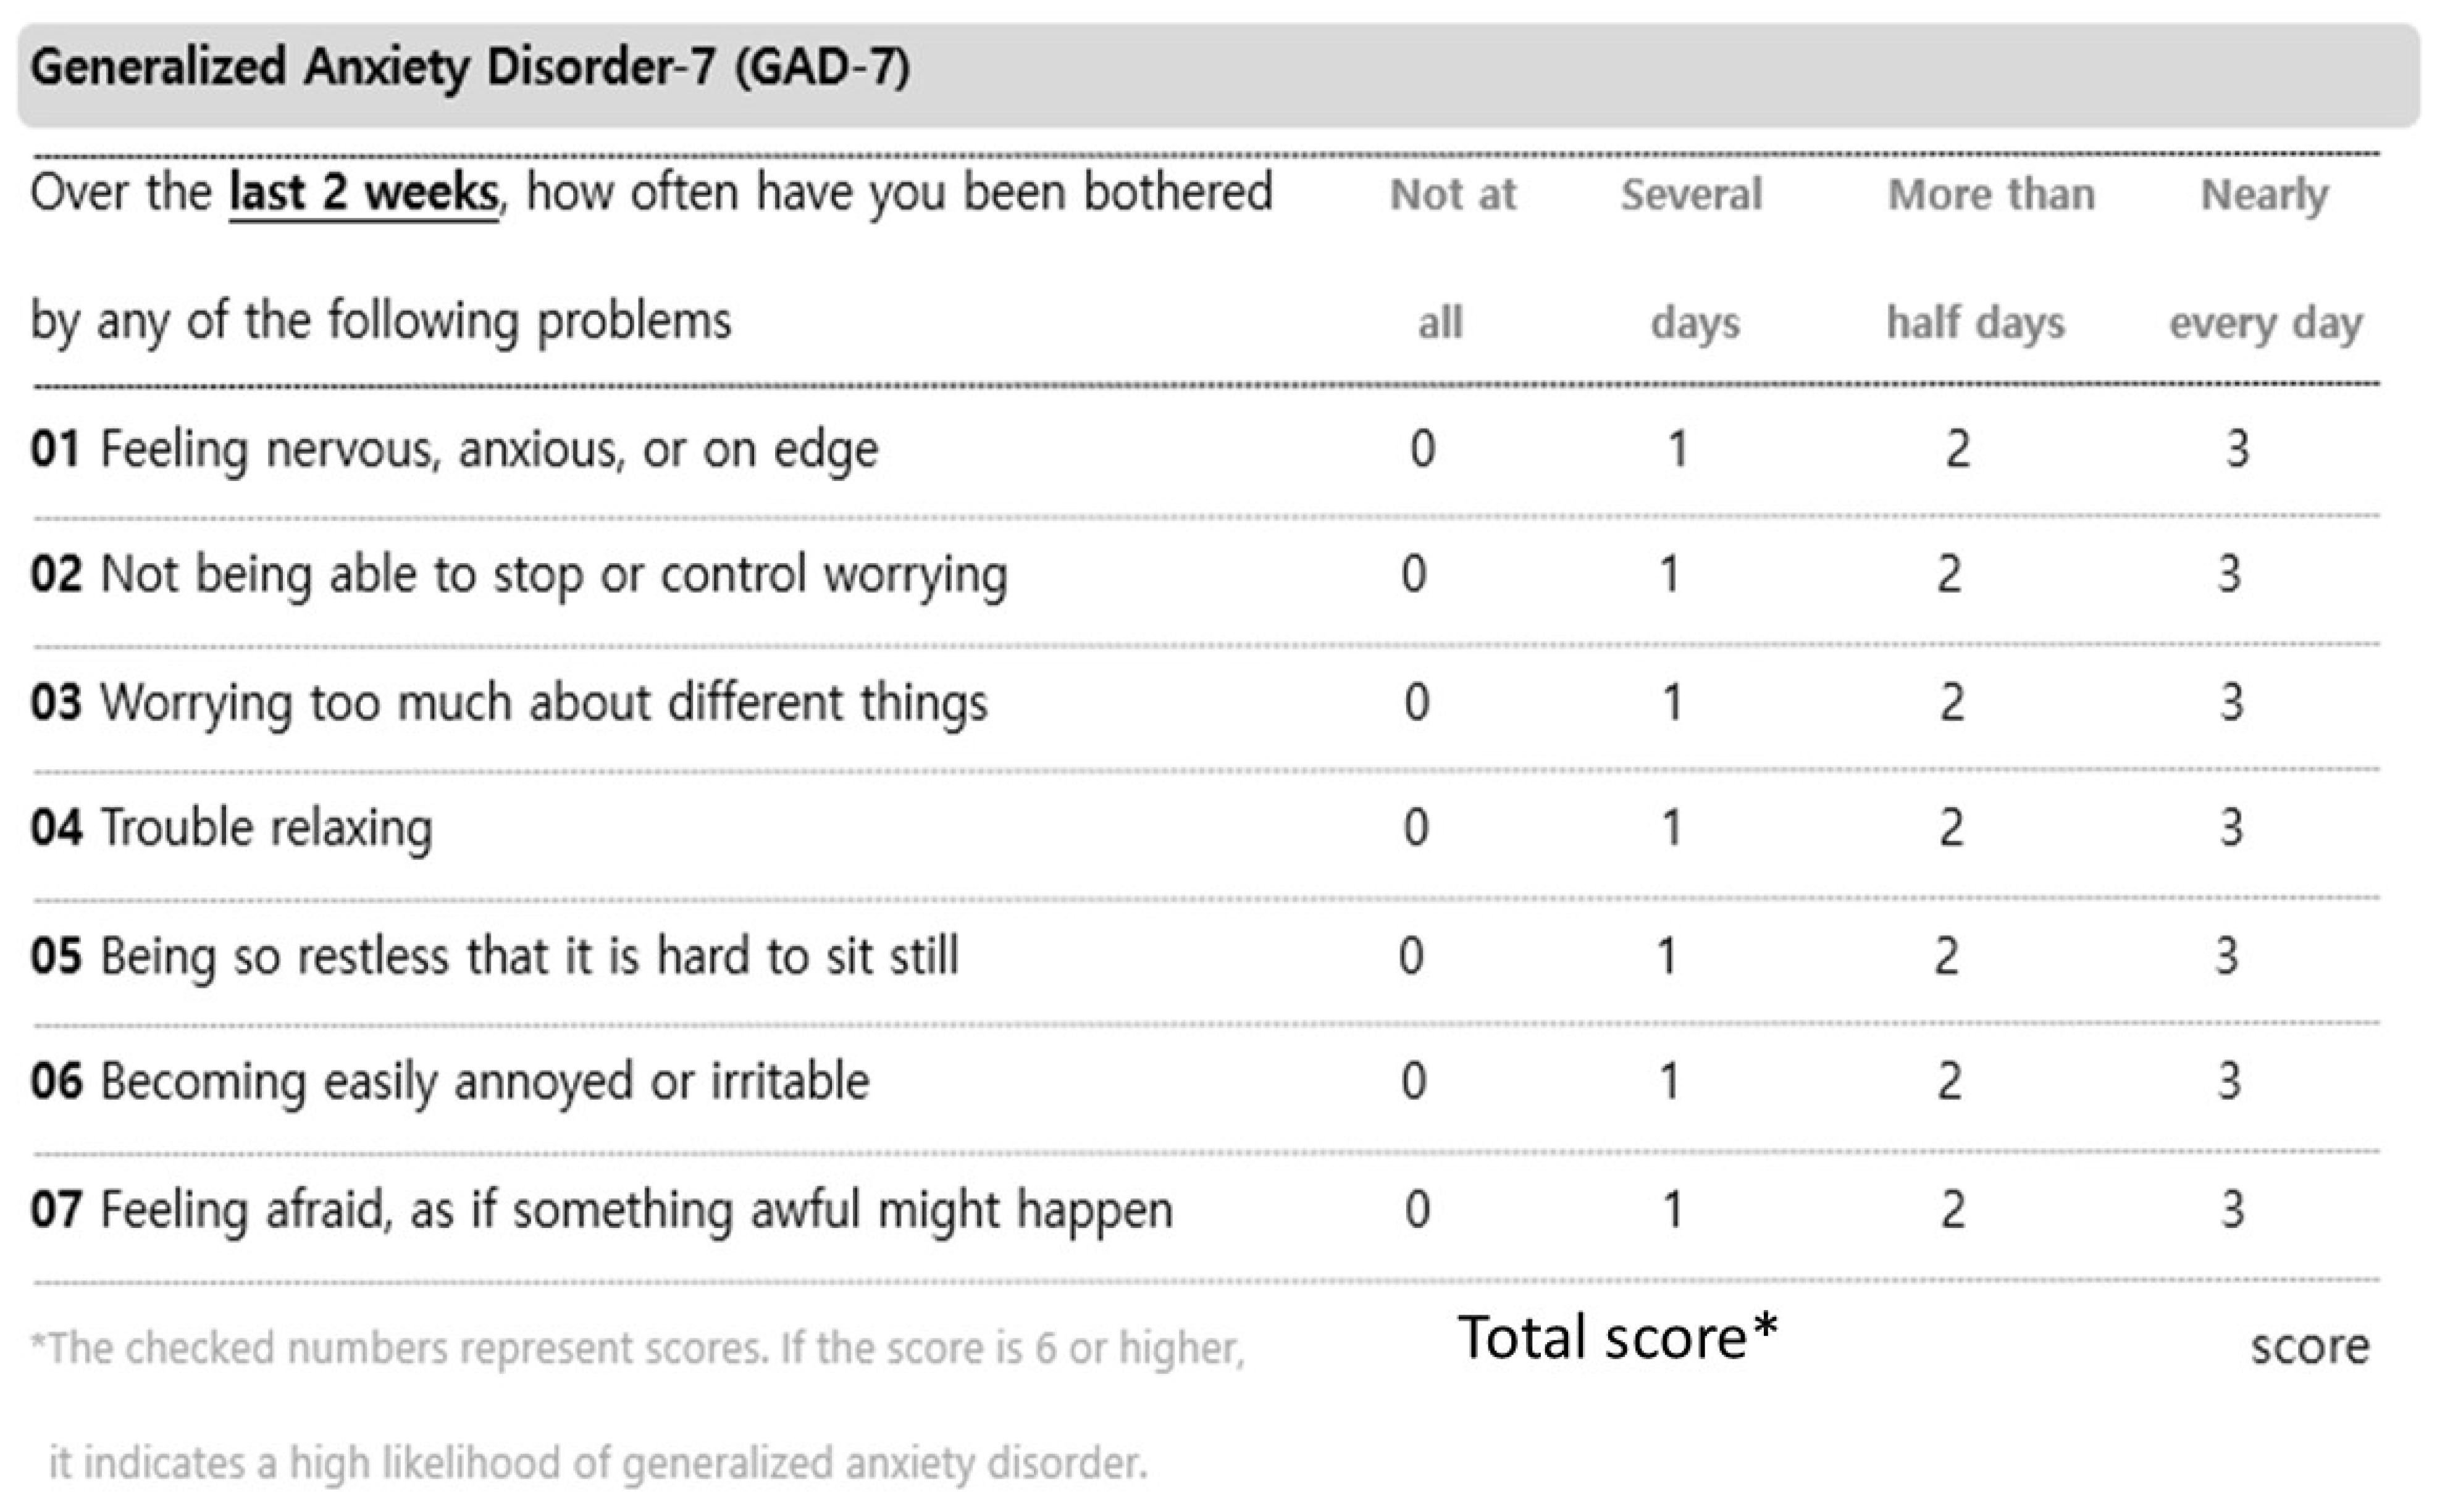
| Have you ever received psychiatric treatment for depression, anxiety, insomnia, or any other mental health condition? | □ No □ Yes If yes: The type of psychiatric treatment received |
2.4. Data Preprocessing, Machine Learning and Statistics
2.4.1. Data Preprocessing
2.4.2. Machine Learning and Statistics
2.4.3. Feature Importance
3. Results
3.1. Patient Characteristics
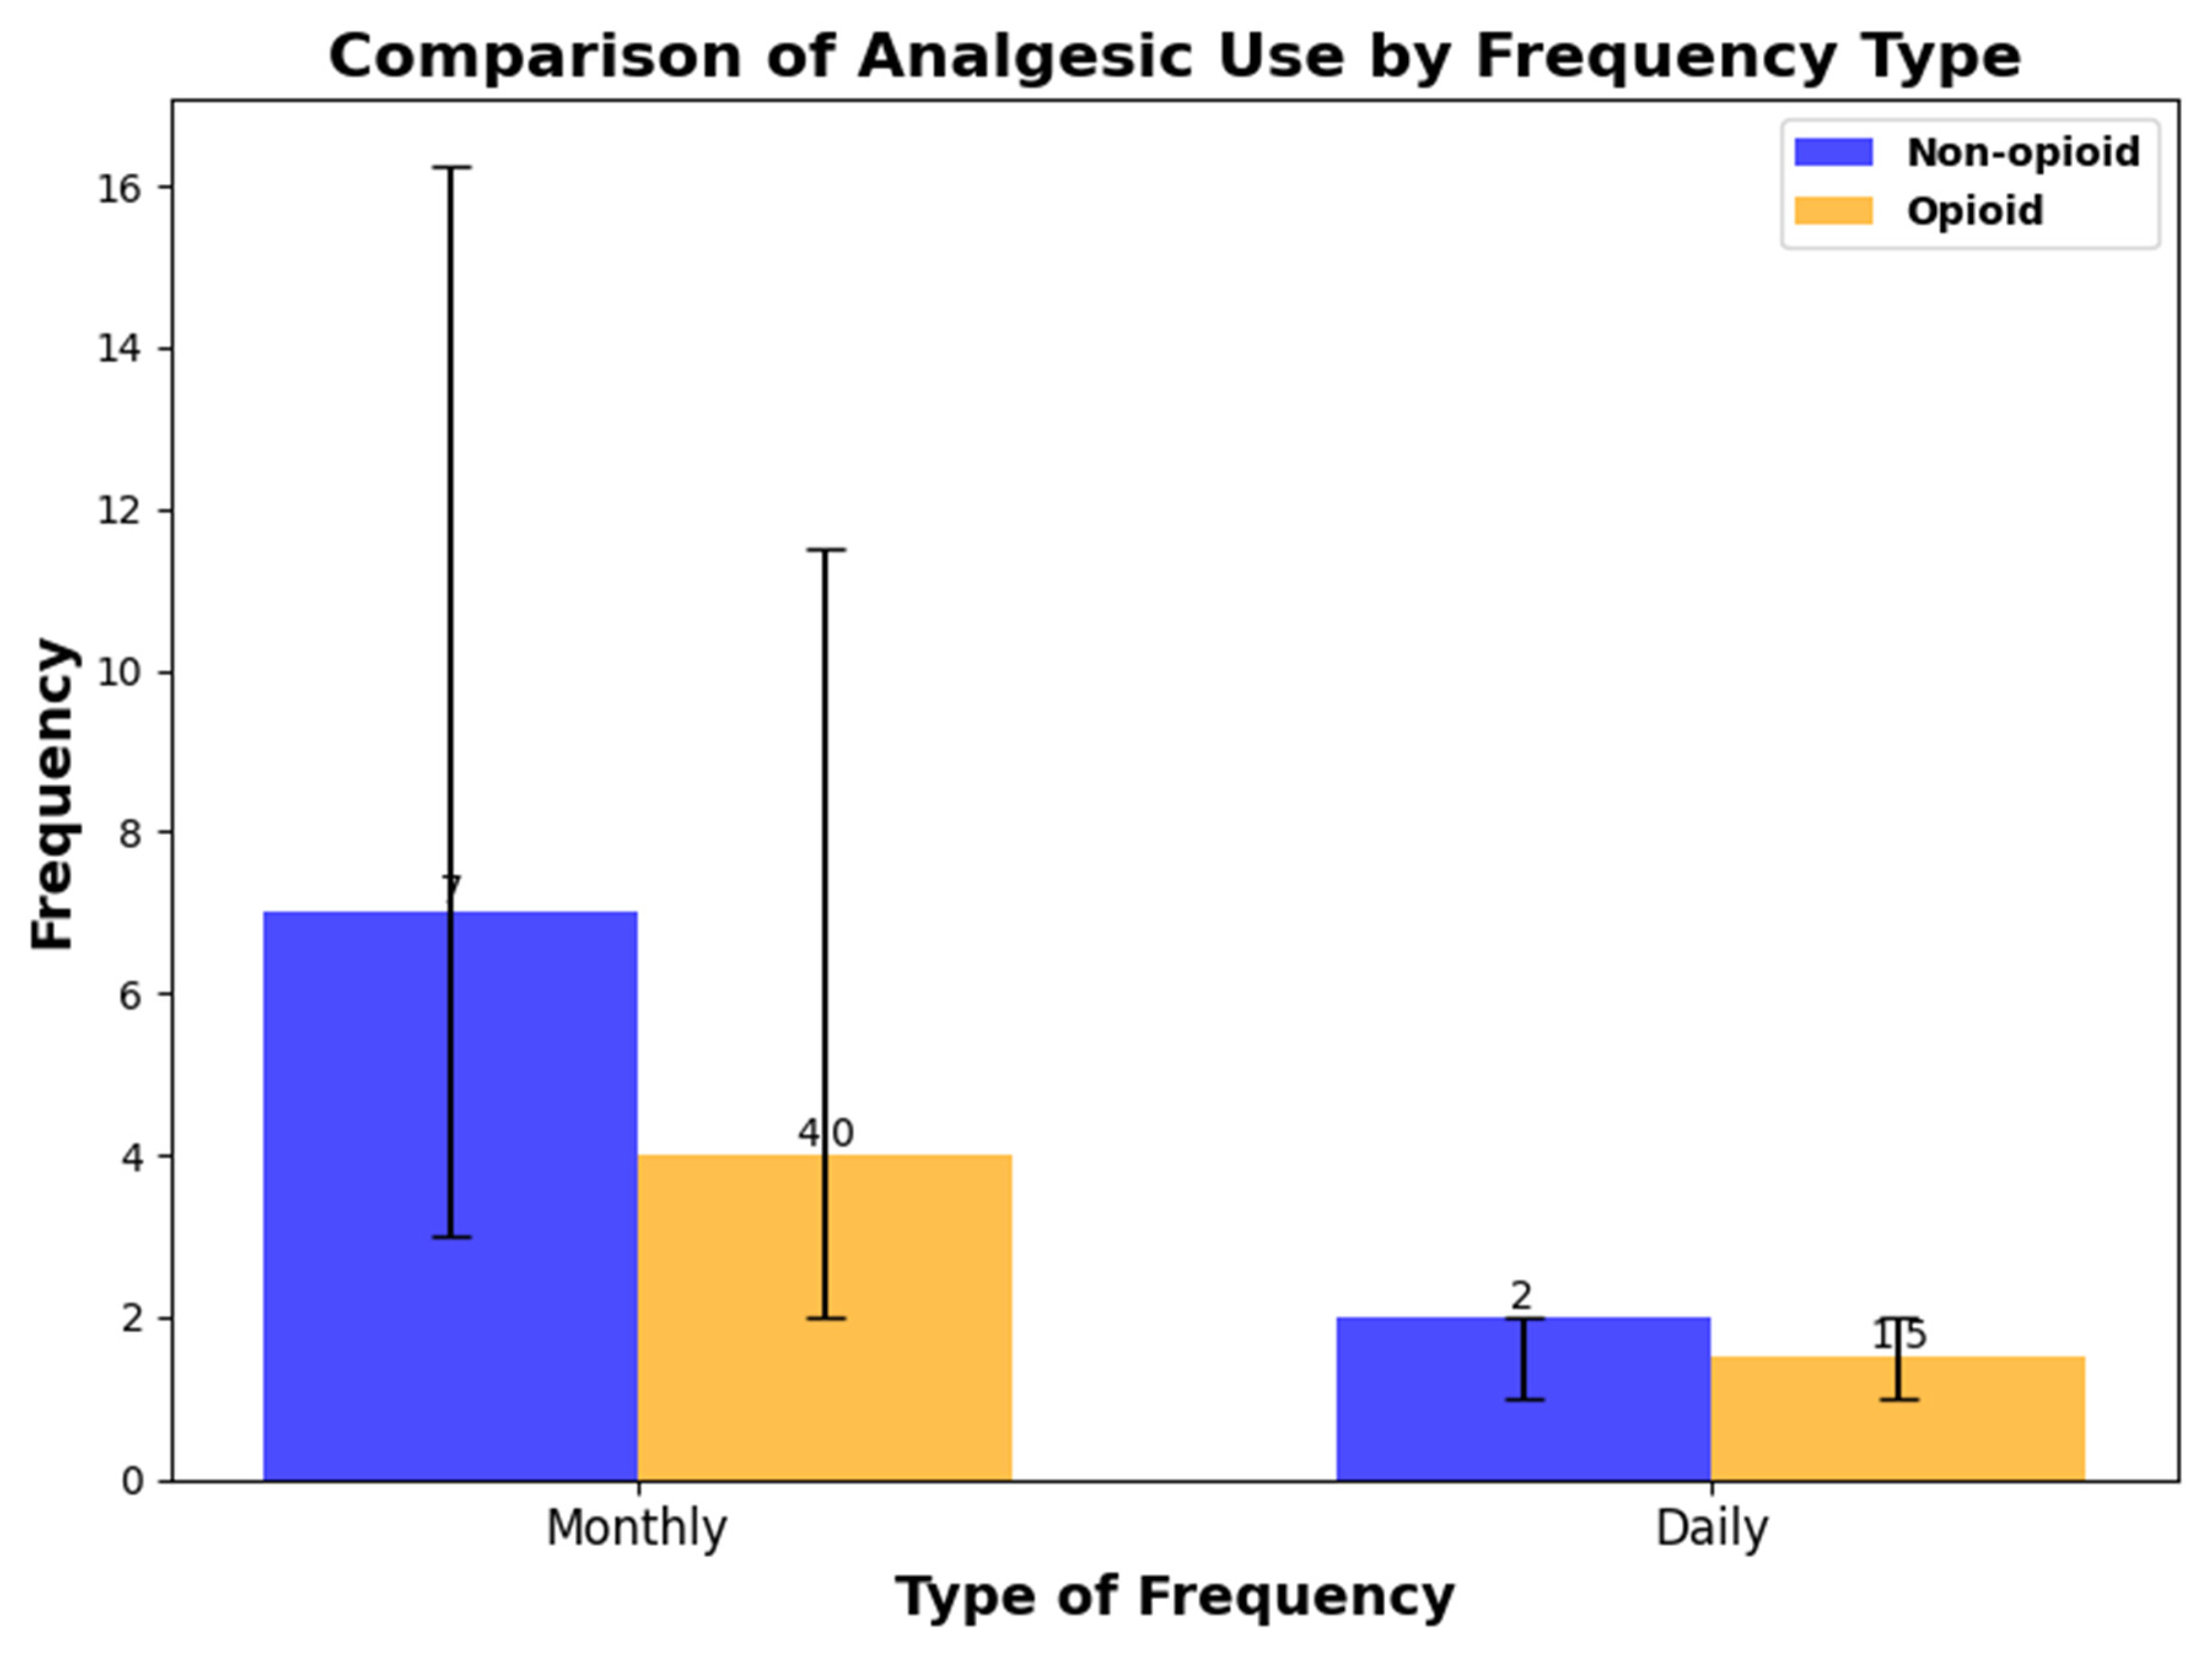
Analgesics
3.2. Prediction of HIT-6, MIDAS, PHQ-9, GAD-7, and Peak NRS
3.3. Important Features
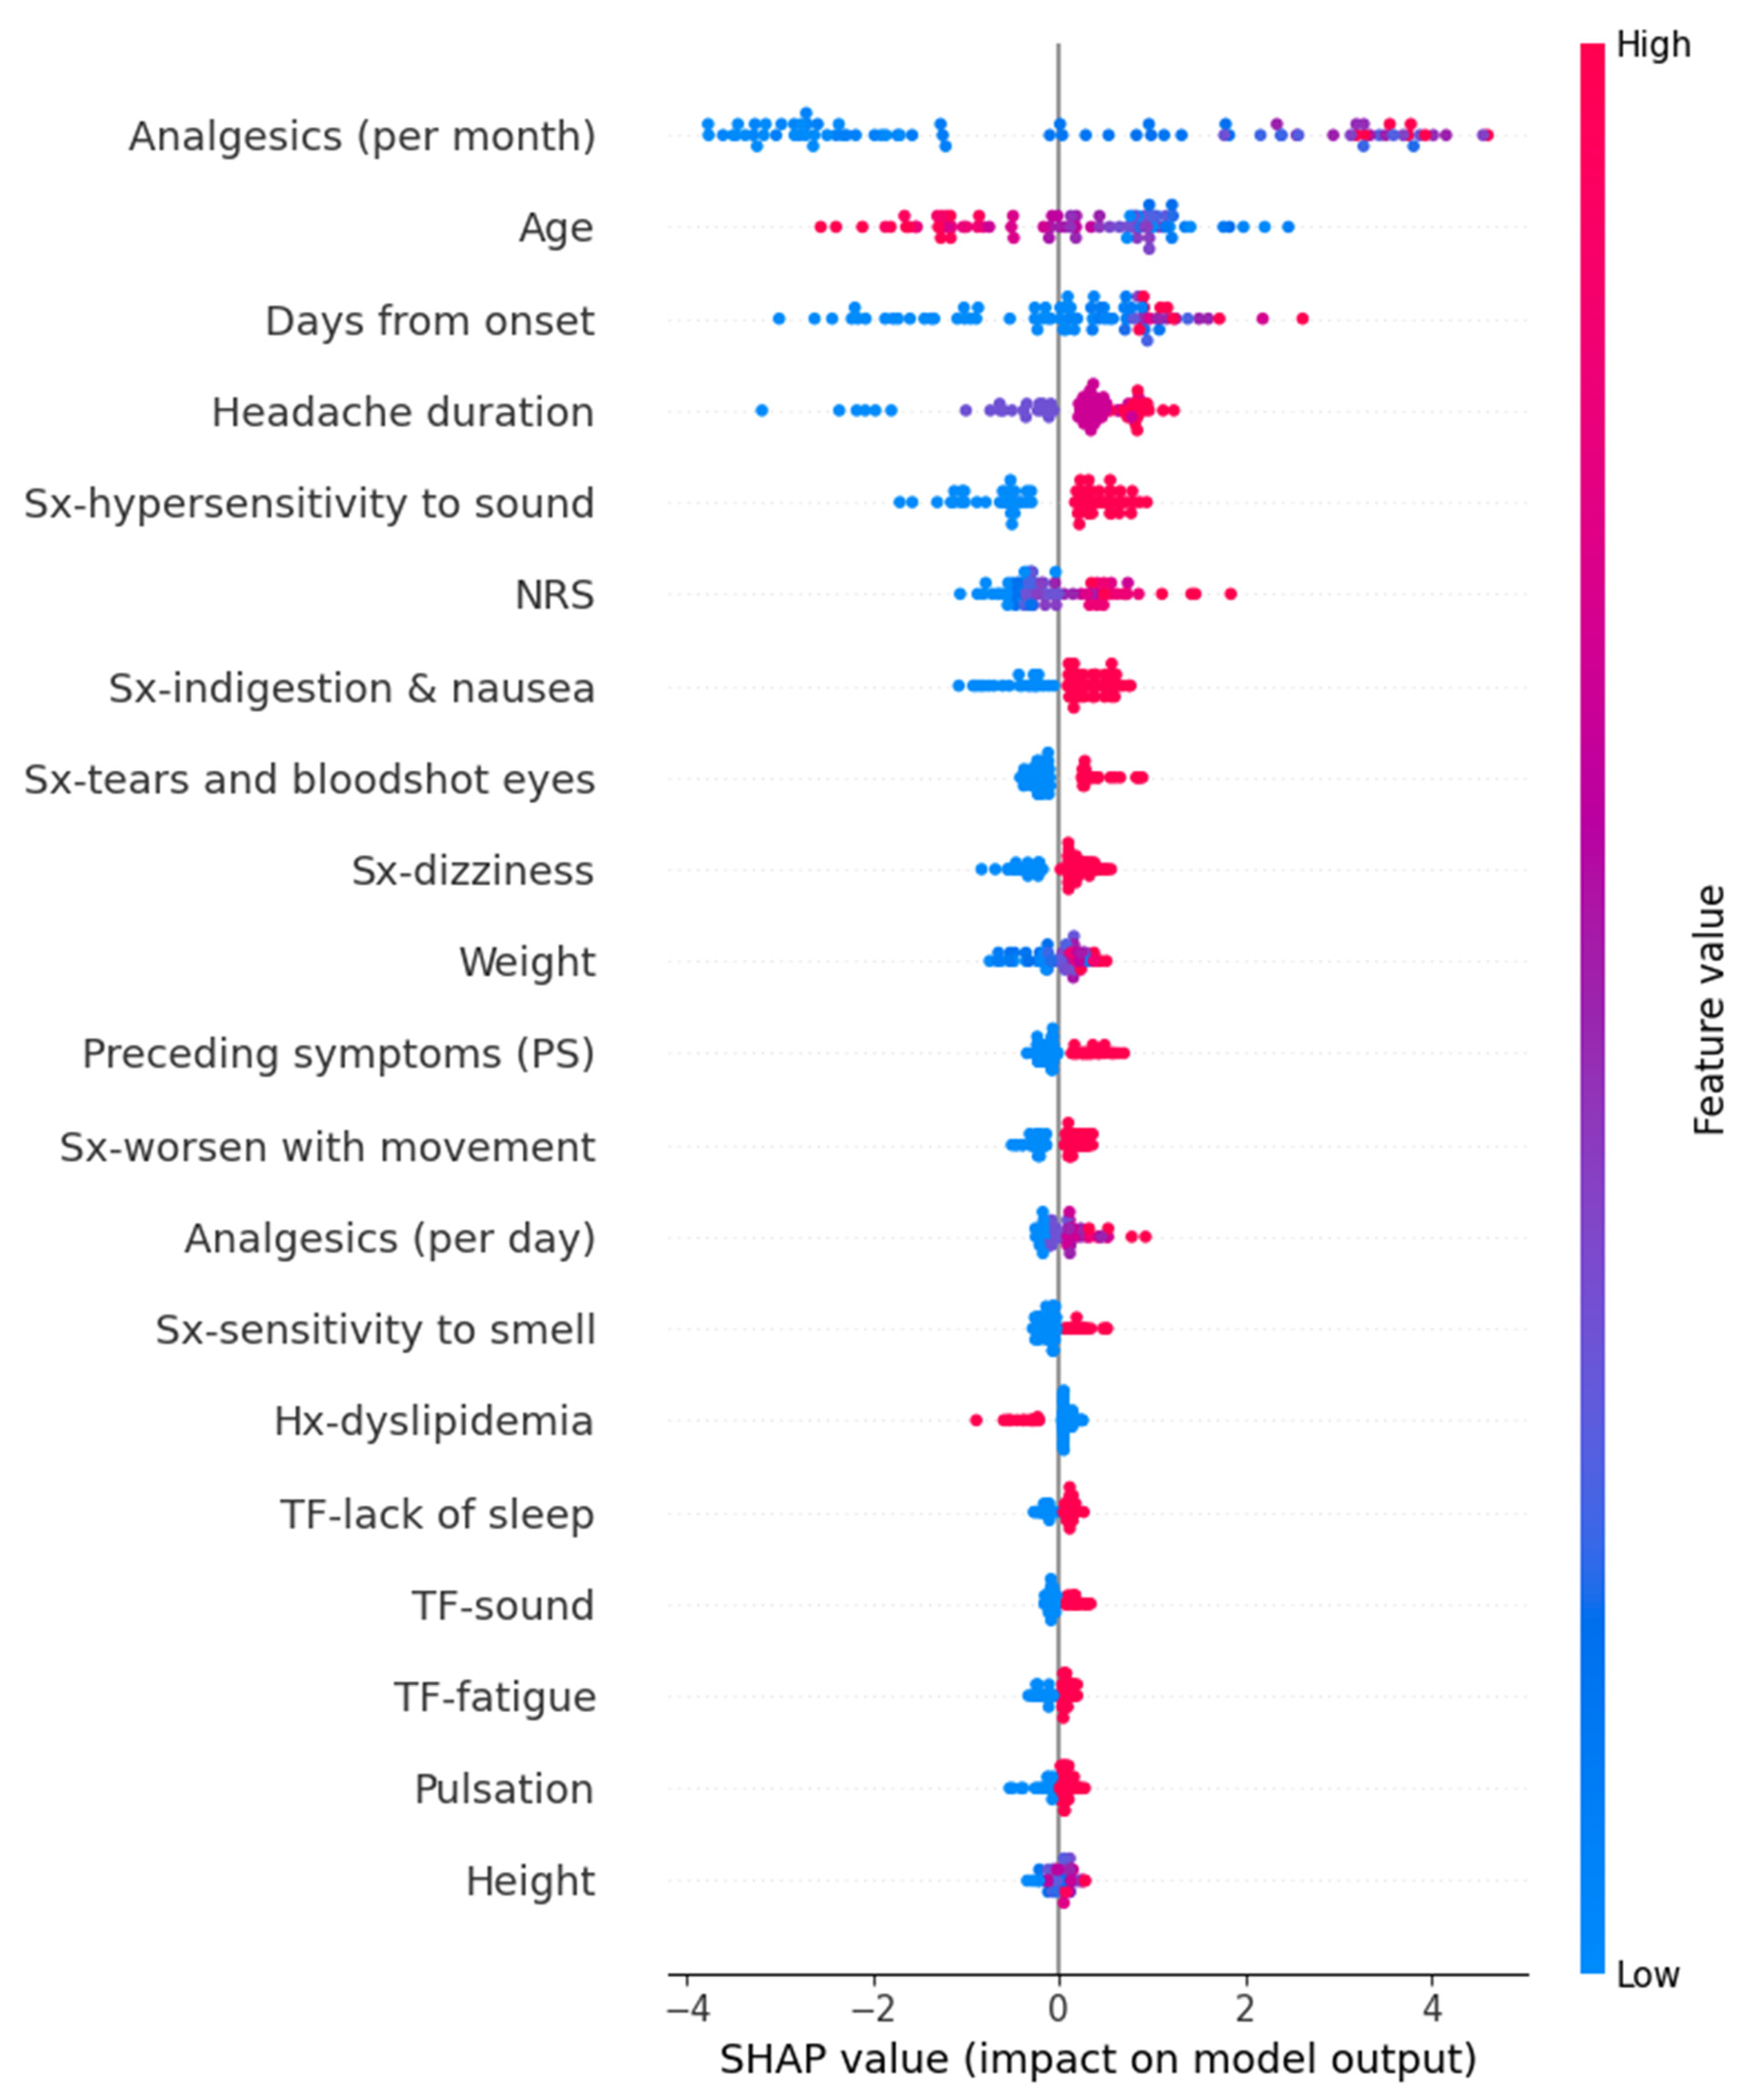
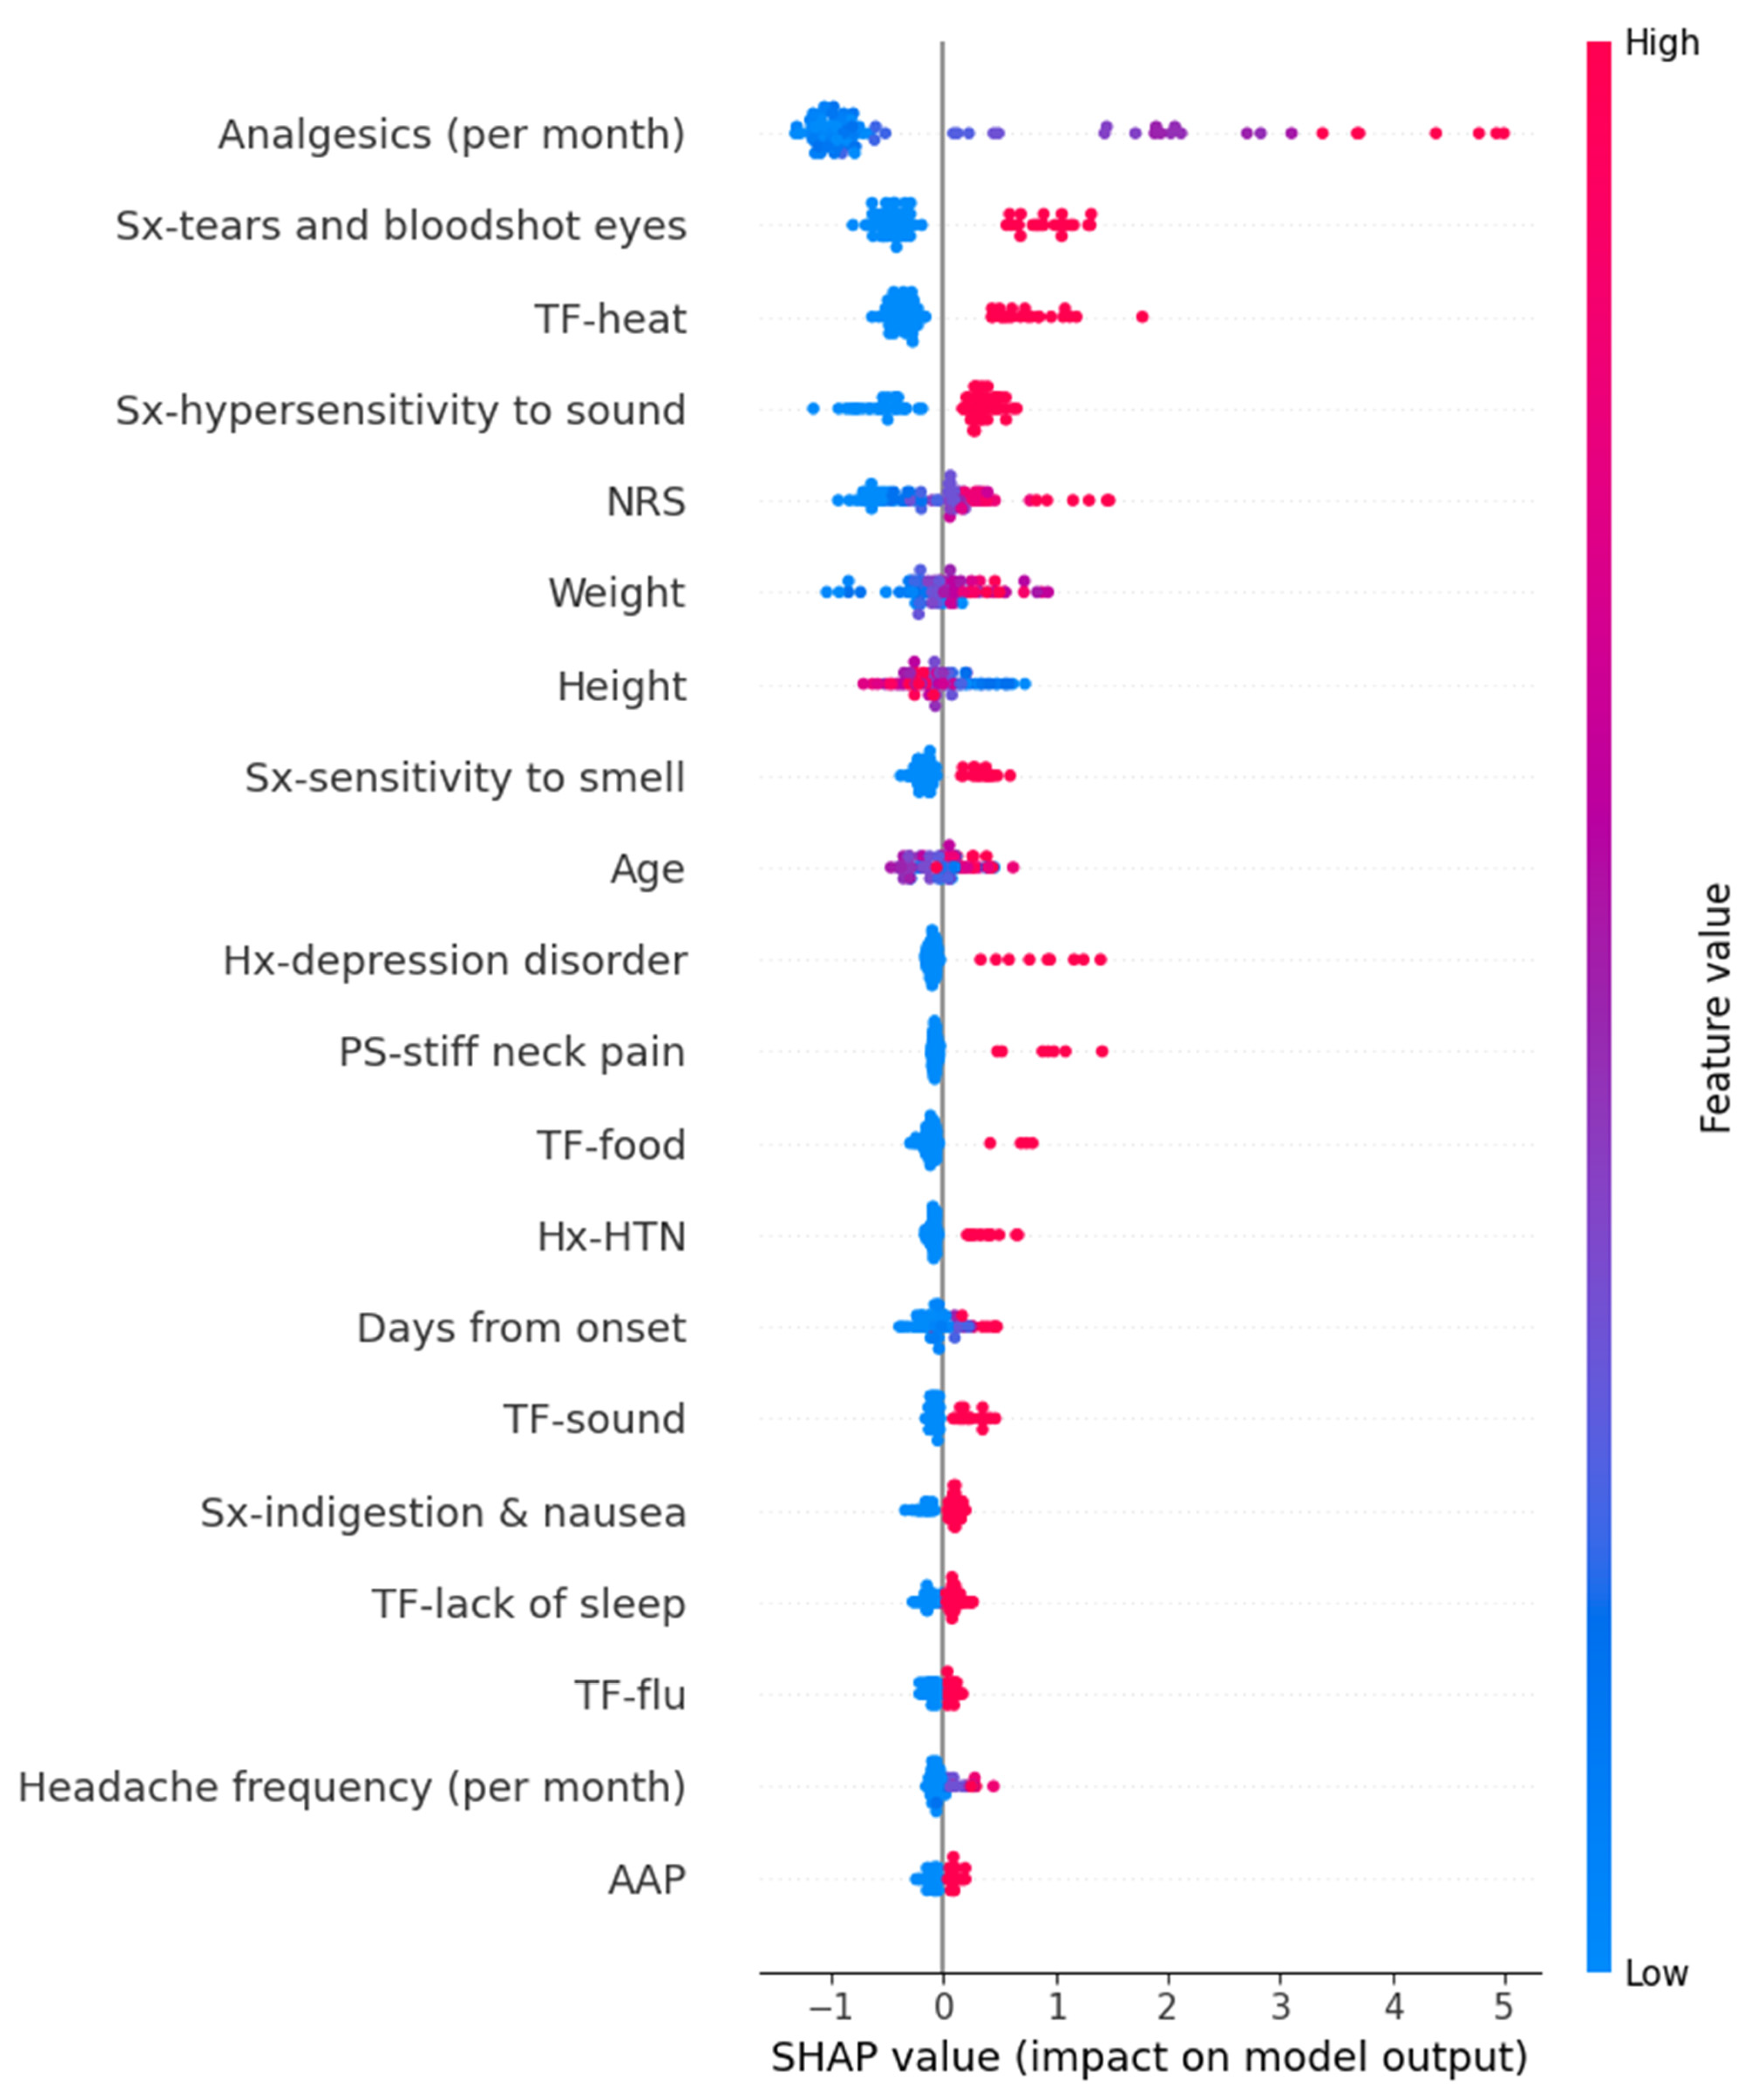
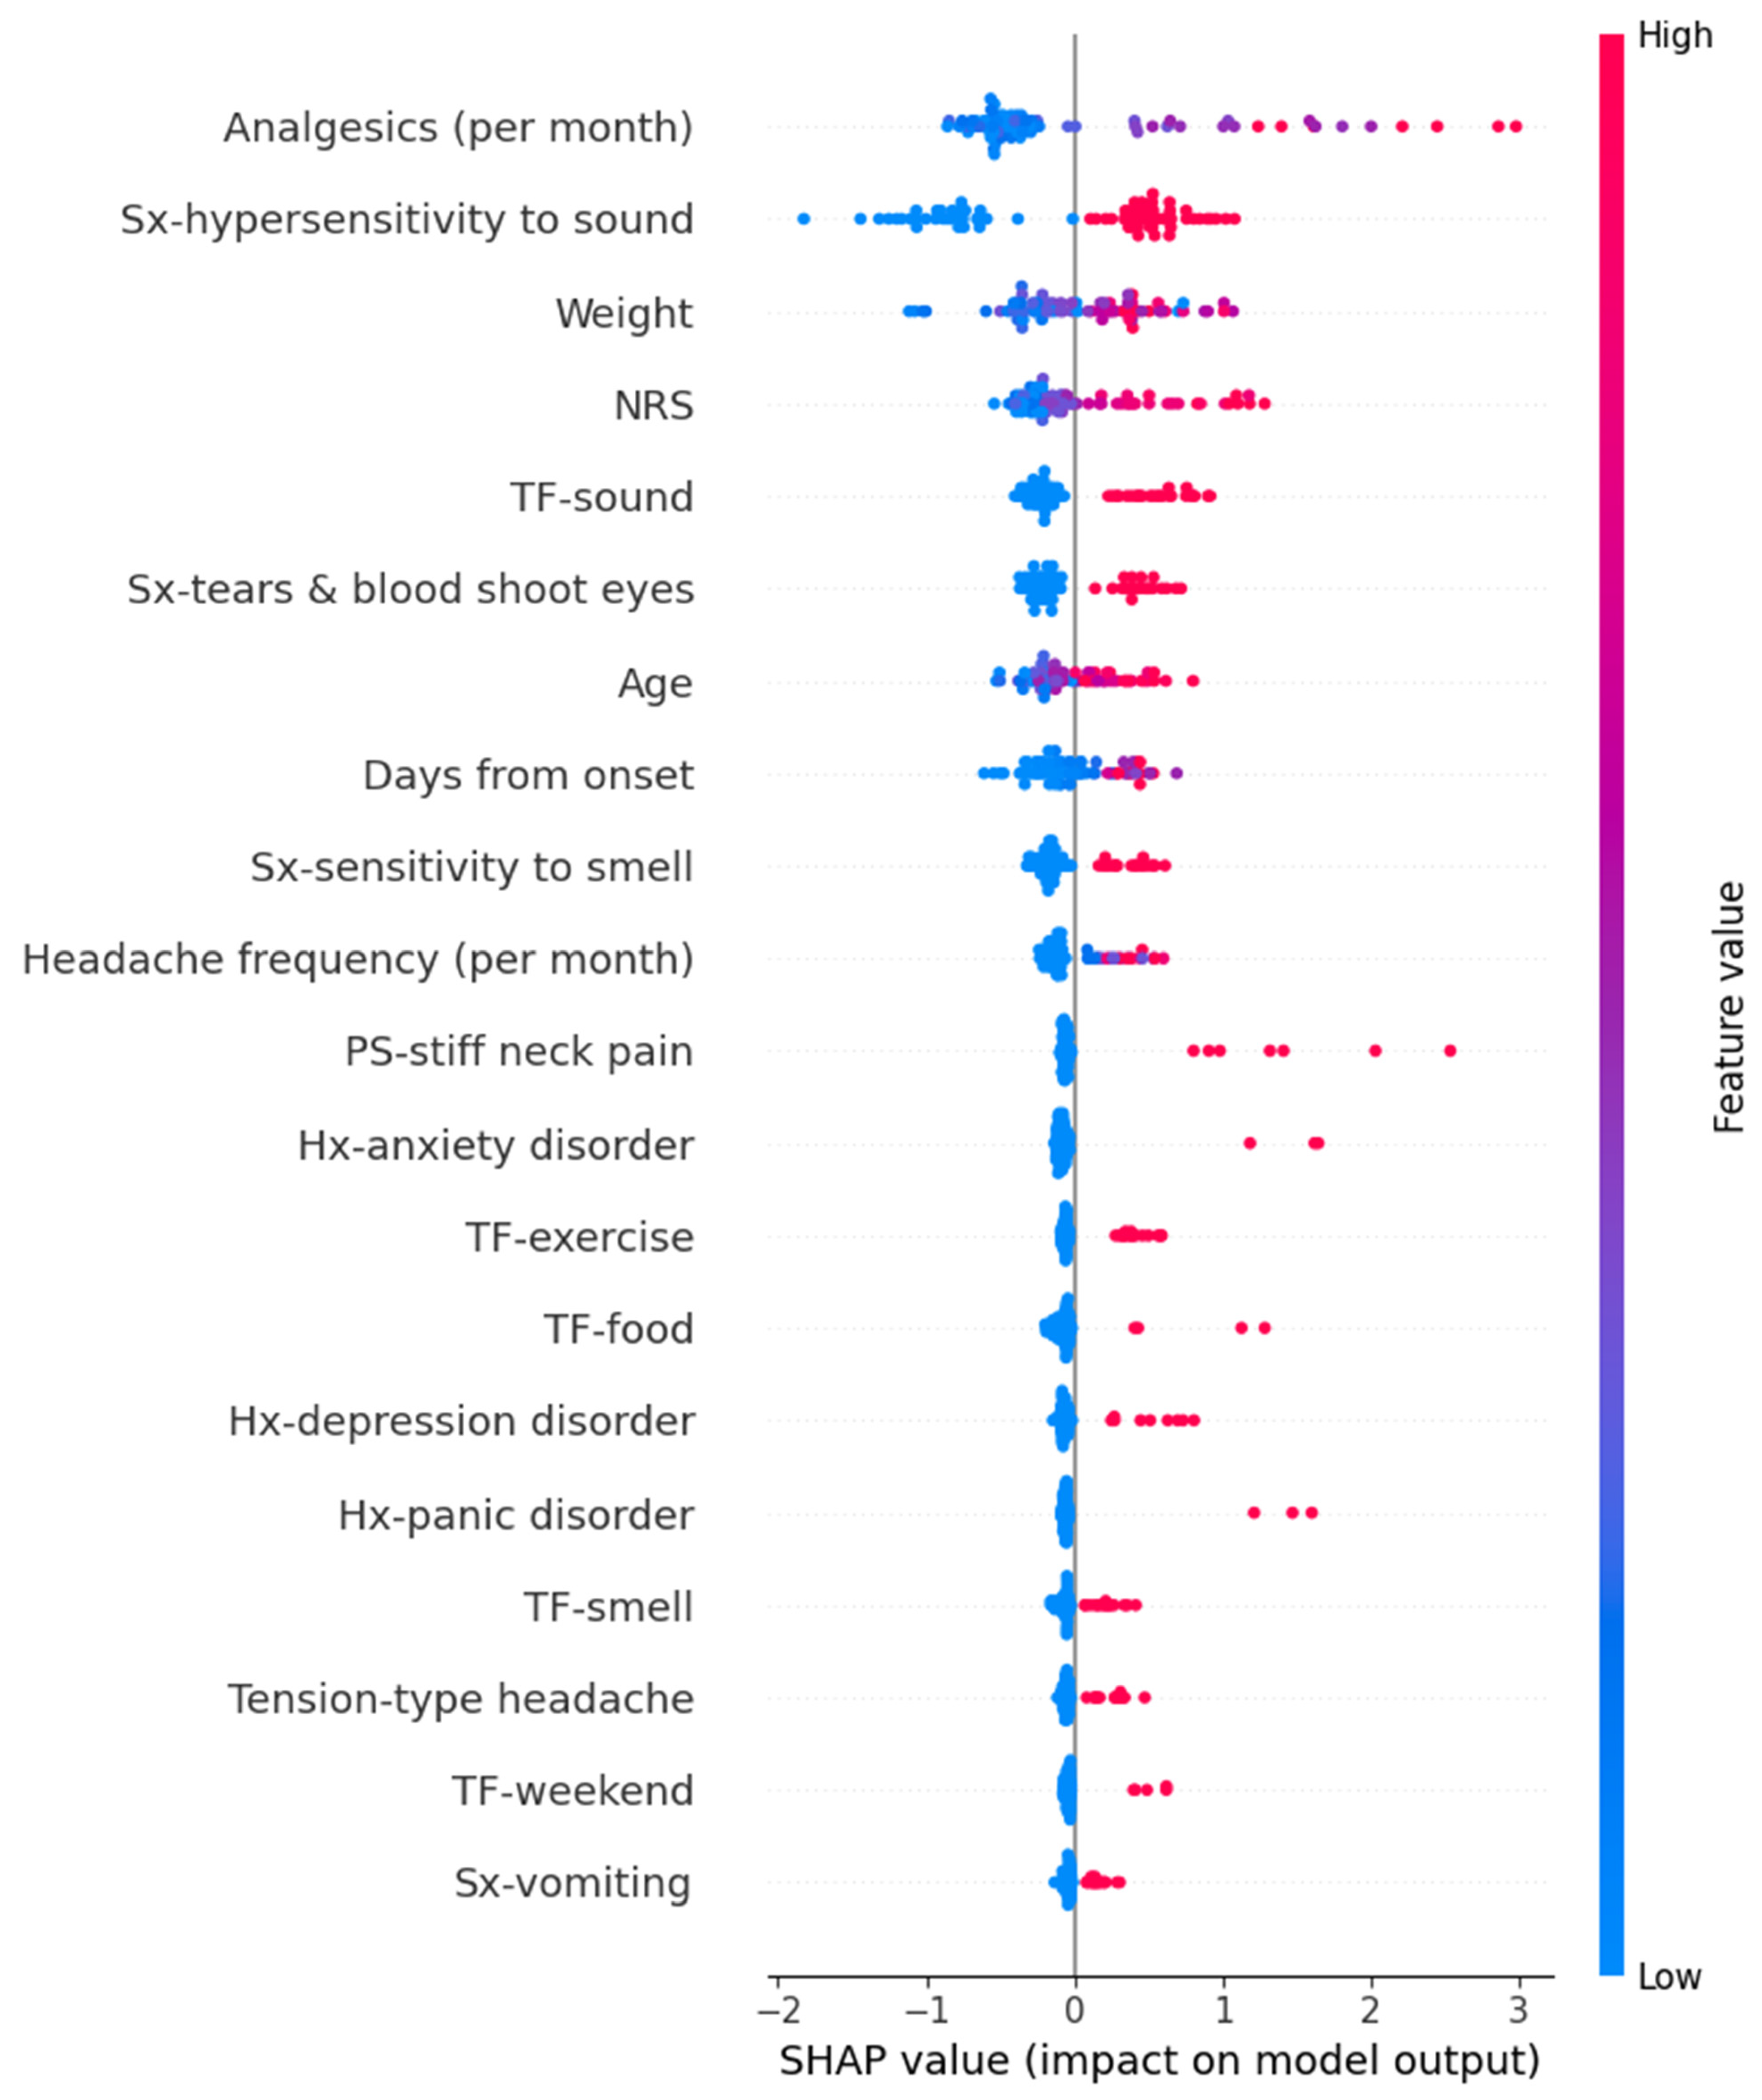
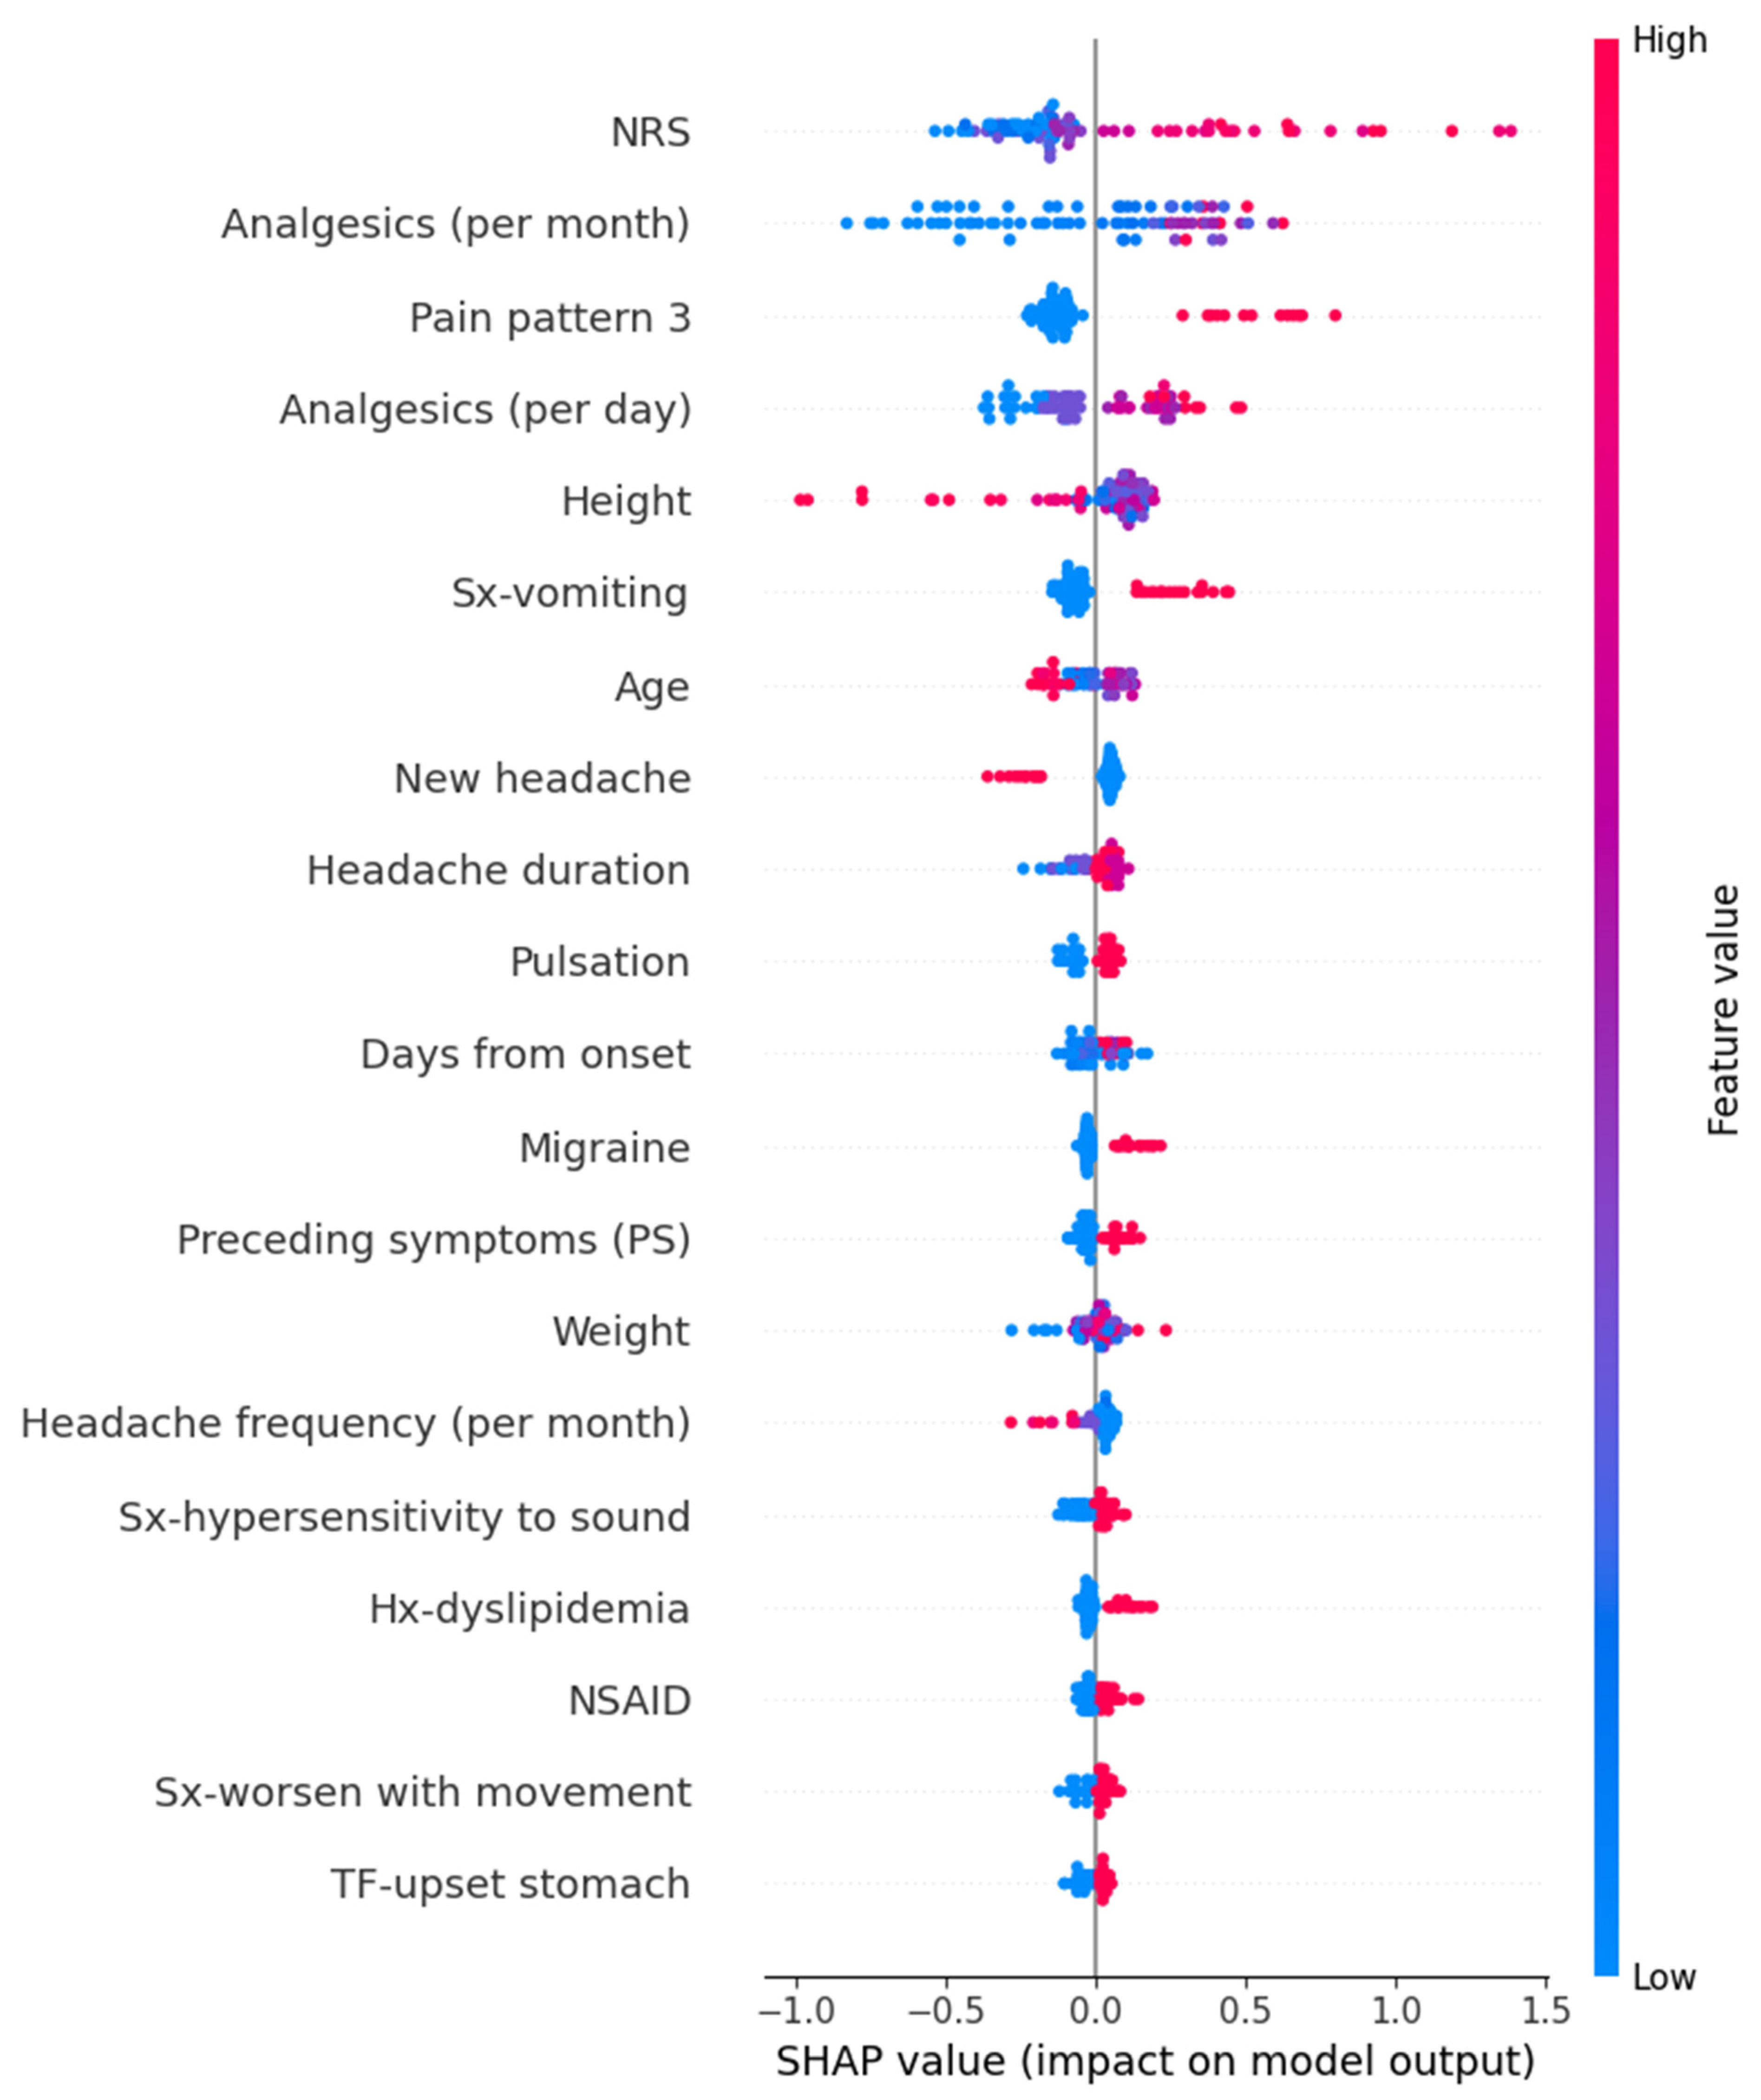
3.3.1. SHAP Values
3.3.2. Coefficients and p Value in Linear Regression Models
4. Discussion
5. Conclusions
Author Contributions
Funding
Institutional Review Board Statement
Informed Consent Statement
Data Availability Statement
Conflicts of Interest
Appendix A
References
- Stovner, L.J.; Hagen, K.; Linde, M.; Steiner, T.J. The global prevalence of headache: An update, with analysis of the influences of methodological factors on prevalence estimates. J. Headache Pain 2022, 23, 34. [Google Scholar] [CrossRef]
- Abu-Arafeh, I. Headache and Psychological Comorbidities: An Appraisal of the Evidence. J. Clin. Med. 2023, 12, 2683. [Google Scholar] [CrossRef]
- Hommer, R.; Lateef, T.; He, J.-P.; Merikangas, K. Headache and mental disorders in a nationally representative sample of American youth. Eur. Child Adolesc. Psychiatry 2022, 31, 39–49. [Google Scholar] [CrossRef] [PubMed]
- Peres, M.F.P.; Mercante, J.P.P.; Tobo, P.R.; Kamei, H.; Bigal, M.E. Anxiety and depression symptoms and migraine: A symptom-based approach research. J. Headache Pain 2017, 18, 37. [Google Scholar] [CrossRef]
- Ford, J.H.; Stauffer, V.L.; McAllister, P.; Akkala, S.; Sexson, M.; Ayer, D.W.; Wang, S. Functional impairment and disability among patients with migraine: Evaluation of galcanezumab in a long-term, open-label study. Qual. Life Res. 2021, 30, 455–464. [Google Scholar] [CrossRef]
- Kim, B.-K.; Cho, S.-J.; Kim, C.-S.; Sakai, F.; Dodick, D.W.; Chu, M.K. Disability and economic loss caused by headache among information technology workers in Korea. J. Clin. Neurol. 2021, 17, 546. [Google Scholar] [CrossRef]
- Lipton, R.B.; Lee, L.; Saikali, N.P.; Bell, J.; Cohen, J.M. Effect of headache-free days on disability, productivity, quality of life, and costs among individuals with migraine. J. Manag. Care Spec. Pharm. 2020, 26, 1344–1352. [Google Scholar] [CrossRef] [PubMed]
- Shimizu, T.; Sakai, F.; Miyake, H.; Sone, T.; Sato, M.; Tanabe, S.; Azuma, Y.; Dodick, D.W. Disability, quality of life, productivity impairment and employer costs of migraine in the workplace. J. Headache Pain 2021, 22, 29. [Google Scholar] [CrossRef] [PubMed]
- Onderwater, G.L.J.; Van Dongen, R.M.; Zielman, R.; Terwindt, G.M.; Ferrari, M.D. Chapter 16—Primary headaches. In Handbook of Clinical Neurology; Deisenhammer, F., Teunissen, C.E., Tumani, H., Eds.; Elsevier: Amsterdam, The Netherlands, 2018; Volume 146, pp. 267–284. [Google Scholar]
- Gupta, J.; Gaurkar, S.S. Migraine: An Underestimated Neurological Condition Affecting Billions. Cureus 2022, 14, e28347. [Google Scholar] [CrossRef]
- Loder, E.; Rizzoli, P. Tension-type headache. BMJ 2008, 336, 88–92. [Google Scholar] [CrossRef] [PubMed]
- Alturaiki, H.M.; Aldawood, M.A.; Alghirash, F.; Alhajji, A.M.; Almubarak, A.; Al Boesa, S.; Hakami, F.; AlMuslim, N. Headache Characteristics and Risk Factors Among Healthcare Providers in Al-Ahsa, Saudi Arabia. Cureus 2023, 15, e45377. [Google Scholar] [CrossRef]
- Milde-Busch, A.; Straube, A.; Heinen, F.; von Kries, R. Identified risk factors and adolescents’ beliefs about triggers for headaches: Results from a cross-sectional study. J. Headache Pain 2012, 13, 639–643. [Google Scholar] [CrossRef]
- Nicholson, R.A.; Houle, T.T.; Rhudy, J.L.; Norton, P.J. Psychological risk factors in headache. Headache 2007, 47, 413–426. [Google Scholar] [CrossRef] [PubMed]
- Lipton, R.B.; Buse, D.C.; Nahas, S.J.; Tietjen, G.E.; Martin, V.T.; Löf, E.; Brevig, T.; Cady, R.; Diener, H.C. Risk factors for migraine disease progression: A narrative review for a patient-centered approach. J. Neurol. 2023, 270, 5692–5710. [Google Scholar] [CrossRef] [PubMed]
- Martin, P.R.; MacLeod, C. Behavioral management of headache triggers: Avoidance of triggers is an inadequate strategy. Clin. Psychol. Rev. 2009, 29, 483–495. [Google Scholar] [CrossRef] [PubMed]
- Nicholson, R.A. Chronic headache: The role of the psychologist. Curr. Pain Headache Rep. 2010, 14, 47–54. [Google Scholar] [CrossRef] [PubMed]
- Wei, C.B.; Jia, J.P.; Wang, F.; Zhou, A.H.; Zuo, X.M.; Chu, C.B. Overlap between Headache, Depression, and Anxiety in General Neurological Clinics: A Cross-sectional Study. Chin. Med. J. 2016, 129, 1394–1399. [Google Scholar] [CrossRef] [PubMed]
- Irimia, P.; Garrido-Cumbrera, M.; Santos-Lasaosa, S.; Aguirre-Vazquez, M.; Correa-Fernández, J.; Colomina, I.; Pozo-Rosich, P. Impact of monthly headache days on anxiety, depression and disability in migraine patients: Results from the Spanish Atlas. Sci. Rep. 2021, 11, 8286. [Google Scholar] [CrossRef] [PubMed]
- Kumar, R.; Asif, S.; Bali, A.; Dang, A.K.; Gonzalez, D.A. The Development and Impact of Anxiety With Migraines: A Narrative Review. Cureus 2022, 14, e26419. [Google Scholar] [CrossRef]
- Bazargan, M.; Comini, J.; Kibe, L.W.; Assari, S.; Cobb, S. Association between Migraine and Quality of Life, Mental Health, Sleeping Disorders, and Health Care Utilization Among Older African American Adults. J. Racial Ethn. Health Disparities 2023, 11, 1530–1540. [Google Scholar] [CrossRef] [PubMed]
- Shapiro, R.E.; Martin, A.A.; Bhardwaj, S.; Thomson, H.; Maculaitis, M.C.; Anderson, C.; Kymes, S.M. Relationships between headache frequency, disability, and disability-related unemployment among adults with migraine. J. Manag. Care Spec. Pharm. 2023, 29, 197–209. [Google Scholar] [CrossRef]
- Han, R.; Yoon, H.; Kim, G.; Lee, H.; Lee, Y. Revolutionizing Medicinal Chemistry: The Application of Artificial Intelligence (AI) in Early Drug Discovery. Pharmaceuticals 2023, 16, 1259. [Google Scholar] [CrossRef] [PubMed]
- Sarker, I.H. Machine Learning: Algorithms, Real-World Applications and Research Directions. SN Comput. Sci. 2021, 2, 160. [Google Scholar] [CrossRef]
- Vora, L.K.; Gholap, A.D.; Jetha, K.; Thakur, R.R.S.; Solanki, H.K.; Chavda, V.P. Artificial intelligence in pharmaceutical technology and drug delivery design. Pharmaceutics 2023, 15, 1916. [Google Scholar] [CrossRef]
- Xu, Y.; Liu, X.; Cao, X.; Huang, C.; Liu, E.; Qian, S.; Liu, X.; Wu, Y.; Dong, F.; Qiu, C.-W.; et al. Artificial intelligence: A powerful paradigm for scientific research. Innovation 2021, 2, 100179. [Google Scholar] [CrossRef] [PubMed]
- Deo, R.C. Machine Learning in Medicine. Circulation 2015, 132, 1920–1930. [Google Scholar] [CrossRef]
- Zlobina, K.; Jafari, M.; Rolandi, M.; Gomez, M. The role of machine learning in advancing precision medicine with feedback control. Cell Rep. Phys. Sci. 2022, 3, 101149. [Google Scholar] [CrossRef]
- Kim, J.-H.; Sohn, J.-H.; Hwang, S.-M.; Lee, J.-J.; Kwon, Y.-S. Relationship Between Frequency Domain Indicators of Heart Rate Variability and Both Age and Duration of Illness in Patients with Headache: A Cross-Sectional Study. Biomedicines 2025, 13, 21. [Google Scholar] [CrossRef]
- Scikitlearn. Sklearn. Available online: https://scikit-learn.org/stable/ (accessed on 28 February 2024).
- Segal, M.R. Machine Learning Benchmarks and Random Forest Regression. Available online: https://escholarship.org/uc/item/35x3v9t4 (accessed on 22 February 2024).
- Prettenhofer, P.; Louppe, G. Gradient Boosted Regression Trees in Scikit-Learn. Available online: https://hdl.handle.net/2268/163521 (accessed on 23 February 2024).
- Cover, T.; Hart, P. Nearest neighbor pattern classification. IEEE Trans. Inf. Theory 1967, 13, 21–27. [Google Scholar] [CrossRef]
- Zhang, F.; O’Donnell, L.J. Support vector regression. In Machine Learning; Mechelli, A., Vieira, S., Eds.; Elsevier: London, UK, 2020; pp. 123–140. [Google Scholar]
- Lee, T.-H.; Ullah, A.; Wang, R. Bootstrap aggregating and random forest. Macroecon. Forecast. Era Big Data Theory Pract. 2020, 52, 389–429. [Google Scholar]
- Ahn, J.M.; Kim, J.; Kim, K. Ensemble Machine Learning of Gradient Boosting (XGBoost, LightGBM, CatBoost) and Attention-Based CNN-LSTM for Harmful Algal Blooms Forecasting. Toxins 2023, 15, 608. [Google Scholar] [CrossRef]
- Natekin, A.; Knoll, A. Gradient boosting machines, a tutorial. Front. Neurorobot. 2013, 7, 21. [Google Scholar] [CrossRef] [PubMed]
- Uddin, S.; Haque, I.; Lu, H.; Moni, M.A.; Gide, E. Comparative performance analysis of K-nearest neighbour (KNN) algorithm and its different variants for disease prediction. Sci. Rep. 2022, 12, 6256. [Google Scholar] [CrossRef] [PubMed]
- Zhang, Z.; Gao, G.; Tian, Y.; Yue, J. Two-phase multi-kernel LP-SVR for feature sparsification and forecasting. Neurocomputing 2016, 214, 594–606. [Google Scholar] [CrossRef]
- Chicco, D.; Warrens, M.J.; Jurman, G. The coefficient of determination R-squared is more informative than SMAPE, MAE, MAPE, MSE and RMSE in regression analysis evaluation. PeerJ Comput. Sci. 2021, 7, e623. [Google Scholar] [CrossRef] [PubMed]
- Cort, J.W.; Kenji, M. Advantages of the mean absolute error (MAE) over the root mean square error (RMSE) in assessing average model performance. Clim. Res. 2005, 30, 79–82. [Google Scholar]
- Wang, Z.; Bovik, A.C. Mean squared error: Love it or leave it? A new look at signal fidelity measures. IEEE Signal Process. Mag. 2009, 26, 98–117. [Google Scholar] [CrossRef]
- Wang, W.; Lu, Y. Analysis of the mean absolute error (MAE) and the root mean square error (RMSE) in assessing rounding model. In Proceedings of the IOP Conference Series: Materials Science and Engineering, Melbourne, Australia, 15–16 September 2018; p. 012049. [Google Scholar]
- Hart, S. Shapley value. In Game Theory; Springer: London, UK, 1989; pp. 210–216. [Google Scholar]
- SHAP. Available online: https://shap.readthedocs.io/en/latest/release_notes.html (accessed on 23 February 2024).
- Chu, H.T.; Liang, C.S.; Lee, J.T.; Yeh, T.C.; Lee, M.S.; Sung, Y.F.; Yang, F.C. Associations between depression/anxiety and headache frequency in migraineurs: A cross-sectional study. Headache J. Head Face Pain 2018, 58, 407–415. [Google Scholar] [CrossRef] [PubMed]
- Lampl, C.; Thomas, H.; Tassorelli, C.; Katsarava, Z.; Laínez, J.M.; Lantéri-Minet, M.; Rastenyte, D.; Ruiz de la Torre, E.; Stovner, L.J.; Andrée, C. Headache, depression and anxiety: Associations in the Eurolight project. J. Headache Pain 2016, 17, 1–9. [Google Scholar] [CrossRef] [PubMed]
- Beghi, E.; Bussone, G.; D’Amico, D.; Cortelli, P.; Cevoli, S.; Manzoni, G.C.; Torelli, P.; Tonini, M.C.; Allais, G.; De Simone, R. Headache, anxiety and depressive disorders: The HADAS study. J. Headache Pain 2010, 11, 141–150. [Google Scholar] [CrossRef]
- Mitsikostas, D.; Thomas, A. Comorbidity of headache and depressive disorders. Cephalalgia 1999, 19, 211–217. [Google Scholar] [CrossRef] [PubMed]
- Song, T.-J.; Cho, S.-J.; Kim, W.-J.; Yang, K.I.; Yun, C.-H.; Chu, M.K. Anxiety and depression in tension-type headache: A population-based study. PLoS ONE 2016, 11, e0165316. [Google Scholar] [CrossRef]
- Guitera, V.; Muñoz, P.; Castillo, J.; Pascual, J. Quality of life in chronic daily headache. Neurology 2002, 58, 1062–1065. [Google Scholar] [CrossRef]
- Kwon, J.; Lee, H.; Cho, S.; Chung, C.-S.; Lee, M.J.; Park, H. Machine learning-based automated classification of headache disorders using patient-reported questionnaires. Sci. Rep. 2020, 10, 14062. [Google Scholar] [CrossRef]
- Stubberud, A.; Ingvaldsen, S.H.; Brenner, E.; Winnberg, I.; Olsen, A.; Gravdahl, G.B.; Matharu, M.S.; Nachev, P.; Tronvik, E. Forecasting migraine with machine learning based on mobile phone diary and wearable data. Cephalalgia 2023, 43, 03331024231169244. [Google Scholar] [CrossRef] [PubMed]
- Ferroni, P.; Zanzotto, F.M.; Scarpato, N.; Spila, A.; Fofi, L.; Egeo, G.; Rullo, A.; Palmirotta, R.; Barbanti, P.; Guadagni, F. Machine learning approach to predict medication overuse in migraine patients. Comput. Struct. Biotechnol. J. 2020, 18, 1487–1496. [Google Scholar] [CrossRef] [PubMed]
- Yang, F.; Meng, T.; Torben-Nielsen, B.; Magnus, C.; Liu, C.; Dejean, E. A machine learning approach to support triaging of primary versus secondary headache patients using complete blood count. PLoS ONE 2023, 18, e0282237. [Google Scholar] [CrossRef] [PubMed]
- Magnoux, E.; Freeman, M.; Zlotnik, G. MIDAS and HIT-6 French translation: Reliability and correlation between tests. Cephalalgia 2008, 28, 26–34. [Google Scholar] [CrossRef] [PubMed]
- Yang, M.; Rendas-Baum, R.; Varon, S.F.; Kosinski, M. Validation of the Headache Impact Test (HIT-6™) across episodic and chronic migraine. Cephalalgia 2011, 31, 357–367. [Google Scholar] [CrossRef]
- Rodríguez-Pérez, R.; Bajorath, J. Evolution of Support Vector Machine and Regression Modeling in Chemoinformatics and Drug Discovery. J. Comput. Aided Mol. Des. 2022, 36, 355–362. [Google Scholar] [CrossRef] [PubMed]
- Telang, S.; Walton, C.; Olten, B.; Bloch, M.H. Meta-analysis: Second generation antidepressants and headache. J. Affect. Disord. 2018, 236, 60–68. [Google Scholar] [CrossRef] [PubMed]

| Features | Train | Test | ASD | Features | Train | Test | ASD | Features | Train | Test | ASD |
|---|---|---|---|---|---|---|---|---|---|---|---|
| Sex (Female) | 209 (66) | 58 (73) | 0.15 | PS-fatigue | 10 (3) | 3 (4) | 0.03 | TF-sex | 10 (3) | 4 (5) | 0.09 |
| Age | 49 (37.25, 60) | 46 (34, 62) | 0.04 | PS-hypersensitivity to sound | 5 (2) | 0 (0) | 0.14 | TF-exercise | 54 (17) | 16 (20) | 0.08 |
| Height | 162 (158, 170) | 163 (157.75, 169) | 0.01 | PS-sensitive to light | 5 (2) | 1 (1) | 0.03 | TF-cold | 101 (32) | 15 (19) | 0.33 |
| Weight | 63 (54, 73) | 62.5 (54, 72.25) | 0 | PS-heavy and stuffy and uncomfortable head | 36 (11) | 11 (14) | 0.07 | TF-heat | 99 (31) | 23 (29) | 0.05 |
| Days from onset | 180 (14, 2190) | 255 (15.5, 1825) | 0.04 | PS-head tingling | 13 (4) | 1 (1) | 0.26 | TF-sunlight | 94 (30) | 22 (28) | 0.05 |
| Migraine | 59 (19) | 19 (24) | 0.12 | PS-dizziness | 13 (4) | 1 (1) | 0.26 | TF-change in seasons | 83 (26) | 21 (26) | 0 |
| Tension-type headache | 63 (20) | 15 (19) | 0.02 | PS-feel nausea | 7 (2) | 1 (1) | 0.09 | TF-upset stomach | 167 (53) | 42 (53) | 0 |
| Headache duration | 3 (2, 4) | 3 (2, 3.25) | 0.01 | Sx-headache when indigestion | 174 (55) | 45 (56) | 0.03 | TF-fasting | 42 (13) | 18 (23) | 0.22 |
| New headache | 60 (19) | 12 (15) | 0.11 | Sx-hypersensitivity to sound | 197 (62) | 48 (60) | 0.04 | TF-alcohol | 121 (38) | 25 (31) | 0.15 |
| Headache frequency per month | 1 (1, 2) | 1 (1, 1.5) | 0.05 | Sx-worsen with movement | 197 (62) | 52 (65) | 0.06 | TF-food | 47 (15) | 4 (5) | 0.45 |
| Analgesics per month | 3 (1, 10) | 4 (1, 10) | 0.02 | Sx-indigestion & nausea | 210 (66) | 58 (73) | 0.14 | Family Hx-father | 16 (5) | 3 (4) | 0.22 |
| Analgesics per day | 1 (1, 2) | 1 (1, 2) | 0.01 | Sx-sensitivity to smell | 101 (32) | 18 (23) | 0.22 | Family-Hx mother | 69 (22) | 17 (21) | 0.08 |
| Acetaminophen | 151 (47) | 35 (44) | 0.08 | Sx- dizziness | 223 (70) | 57 (71) | 0.02 | Family Hx-children | 21 (7) | 6 (8) | 0.07 |
| NSAID | 137 (43) | 34 (43) | 0.01 | Sx-vomiting | 63 (20) | 21 (26) | 0.15 | Family Hx-sibling | 22 (7) | 6 (8) | 0.08 |
| Opioid | 24 (8) | 6 (8) | 0 | Sx-hypersensitivity to light | 138 (43) | 31 (39) | 0.1 | Hx-HTN | 66 (21) | 14 (18) | 0.09 |
| Muscle relaxant | 53 (17) | 11 (14) | 0.08 | Sx- tears and bloodshot eyes | 98 (31) | 24 (30) | 0.02 | Hx-DM | 30 (9) | 9 (11) | 0.06 |
| Triptan | 25 (8) | 8 (10) | 0.07 | Headache site right | 88 (28) | 19 (24) | 0.09 | Hx-cardiac disease | 13 (4) | 5 (6) | 0.09 |
| Antianxiety | 26 (8) | 3 (4) | 0.23 | Headache site left | 93 (29) | 27 (34) | 0.1 | Hx-CVA/TIA | 16 (5) | 2 (3) | 0.16 |
| Antidepressants | 7 (2) | 5 (6) | 0.16 | Headache site both | 106 (33) | 21 (26) | 0.16 | Hx-dyslipidemia | 55 (17) | 16 (20) | 0.07 |
| Headache course 1 | 28 (9) | 4 (5) | 0.17 | Headache site middle part | 20 (6) | 3 (4) | 0.13 | Hx-cancer | 11 (3) | 1 (1) | 0.2 |
| Headache course 2 | 76 (24) | 22 (28) | 0.08 | Headache site taking turns | 25 (8) | 10 (13) | 0.14 | Hx-depression disorder | 39 (12) | 9 (11) | 0.03 |
| Headache course 3 | 68 (21) | 13 (16) | 0.14 | Pulsation | 200 (63) | 55 (69) | 0 | Hx-insomnia | 22 (7) | 9 (11) | 0.14 |
| Headache course 4 | 15 (5) | 5 (6) | 0.06 | TF-stress | 253 (80) | 64 (80) | 0.01 | Hx-anxiety disorder | 14 (4) | 3 (4) | 0.03 |
| Headache course 5 | 32 (10) | 6 (8) | 0.1 | TF-fatigue | 218 (69) | 56 (70) | 0.03 | Hx-panic disorder | 11 (3) | 3 (4) | 0.02 |
| Headache course 6 | 149 (47) | 44 (55) | 0.16 | TF-overeating | 49 (15) | 12 (15) | 0.01 | NRS | 2 (0, 4) | 2 (1, 5) | 0.01 |
| Preceding symptoms | 120 (38) | 27 (34) | 0.08 | TF-weekend | 24 (8) | 5 (6) | 0.05 | HIT-6 | 57 (50, 63) | 58 (50, 63) | 0.03 |
| PS-yawn | 3 (1) | 0 (0) | 0.11 | TF-oversleep | 47 (15) | 11 (14) | 0.03 | MIDAS | 6.5 (1, 20) | 8 (2, 20) | 0.08 |
| PS-Digestive disorders | 6 (2) | 0 (0) | 0.16 | TF-lack of sleep | 179 (56) | 50 (63) | 0.13 | PHQ-9 | 7.5 (4, 12) | 8 (5, 11) | 0.01 |
| PS-difficulty concentrating | 1 (0) | 0 (0) | 0.06 | TF-smell | 64 (20) | 15 (19) | 0.04 | GAD-7 | 4.5 (2, 9) | 4 (2, 8) | 0.09 |
| PS-mood changes | 3 (1) | 4 (5) | 0.19 | TF- sound | 103 (32) | 25 (31) | 0.02 | NRS peak | 7 (5, 8) | 7 (5,8) | 0.23 |
| PS-stiff neck/pain | 23 (7) | 7 (9) | 0.05 | TF-menstruation | 46 (14) | 15 (19) | 0.11 | ||||
| PS-a sense of impending pain | 10 (3) | 2 (3) | 0.04 | TF-flu | 161 (51) | 33 (41) | 0.19 |
| 1 | Algorithm | RMSE | MSE | MAE | R2 |
|---|---|---|---|---|---|
| HIT-6 | Random Forest | 7.624 † | 58.119 † | 6.011 † | 0.157 ‡ |
| Gradient boosting | 8.014 | 64.225 | 6.402 | 0.068 | |
| K-Neighbors regressor | 8.383 | 70.275 | 6.713 | −0.019 | |
| Supportive vector regressor | 7.967 | 63.479 | 6.629 | 0.079 | |
| Linear regression | 8.607 | 74.082 | 6.729 | −0.074 | |
| MIDAS | Random Forest | 22.951 | 526.738 | 16.33 | −0.241 |
| Gradient boosting | 29.884 | 893.035 | 19.054 | −1.104 | |
| K-Neighbors regressor | 23.08 | 532.699 | 16.27 | −0.255 | |
| Supportive vector regressor | 22.553 † | 508.64 † | 13.86 † | −0.199 ‡ | |
| Linear regression | 23.72 | 562.662 | 18.07 | −0.326 | |
| PHQ-9 | Random Forest | 5.026 † | 25.263 † | 3.641 † | 0.144 ‡ |
| Gradient boosting | 5.599 | 31.352 | 4.18 | −0.062 | |
| K-Neighbors regressor | 5.955 | 35.467 | 4.553 | −0.201 | |
| Supportive vector regressor | 5.536 | 30.648 | 4.204 | −0.038 | |
| Linear regression | 5.913 | 34.963 | 4.582 | −0.184 | |
| GAD-7 | Random Forest | 4.886 † | 23.872 † | 3.706 | 0.053 ‡ |
| Gradient boosting | 5.086 | 25.87 | 3.83 | −0.027 | |
| K-Neighbors regressor | 5.267 | 27.736 | 3.878 | −0.101 | |
| Supportive vector regressor | 5.04 | 25.399 | 3.642 † | −0.008 | |
| Linear regression | 5.393 | 29.086 | 4.143 | −0.154 | |
| Peak NRS | Random Forest | 1.723 † | 2.968 † | 1.417 † | 0.107 ‡ |
| Gradient boosting | 1.82 | 3.311 | 1.459 | 0.003 | |
| K-Neighbors regressor | 1.927 | 3.714 | 1.607 | −0.118 | |
| Supportive vector regressor | 1.816 | 3.296 | 1.498 | 0.008 | |
| Linear regression | 2.162 | 4.673 | 1.759 | −0.406 |
| Target | Feature | Coefficient | p Value | Target | Feature | Coefficient | p Value |
|---|---|---|---|---|---|---|---|
| HIT-6 | Age | −0.09 | 0.01 | PHQ-9 | Height | −0.11 | 0.042 |
| Headache duration | 1.03 | 0.005 | Tension-type headache | 1.77 | 0.017 | ||
| New headache | −2.97 | 0.004 | Headache duration | 0.79 | 0.003 | ||
| Analgesics (per month) | 0.25 | <0.001 | Analgesics (per month) | 0.12 | 0.002 | ||
| Sx-tears and blood shoot eyes | 2.24 | 0.011 | Preceding symptoms (PS) | −2.09 | 0.04 | ||
| TF-flu | −2.04 | 0.014 | PS-Digestive disorders | 5.55 | 0.022 | ||
| Hx-panic disorder | −5.01 | 0.016 | PS-stiff neck pain | 3.89 | 0.002 | ||
| NRS | 0.64 | <0.001 | PS-dizziness | 3. 44 | 0.034 | ||
| MIDAS | Sex | −13.74 | 0.002 | Sx-sensitivity to smell | 1.47 | 0.032 | |
| Age | −0.32 | 0.009 | Sx-tears and blood shoot eyes | 1.75 | 0.006 | ||
| New headache | −7.43 | 0.03 | TF-sound | 1.62 | 0.02 | ||
| Analgesics (per month) | 0.88 | <0.001 | TF-heat | 1.92 | 0.005 | ||
| PS-stiff neck pain | 13.59 | 0.021 | NRS | 0.28 | 0.027 | ||
| PS-head tingling | 18.27 | 0.013 | GAD-7 | Weight | 0.05 | 0.038 | |
| PS-dizziness | 21.9 | 0.003 | Analgesics (per month) | 0.07 | 0.049 | ||
| Sx-tears and bloodshot eyes | 9.42 | 0.001 | Triptan | −2.26 | 0.046 | ||
| TF-menstruation | 10.55 | 0.007 | PS-stiff neck pain | 2.95 | 0.019 | ||
| TF-sex | −18.74 | 0.006 | TF-exercise | 1.47 | 0.043 | ||
| TF-exercise | 6.7 | 0.05 | TF-food | 1.88 | 0.031 | ||
| TF-cold | 8.82 | 0.003 | Family Hx-mother | 1.6 | 0.014 | ||
| Hx-HTN | 8 | 0.016 | Peak NRS | New headache | −0.85 | 0.005 | |
| Hx-depression disorder | 9.38 | 0.025 | Pain pattern 3 | 1.38 | <0.001 | ||
| Hx-anxiety disorder | −13.84 | 0.027 | Hx-dyslipidemia | 0.71 | 0.025 | ||
| NRS | 1.6 | 0.006 | NRS | 0.27 | <0.001 |
Disclaimer/Publisher’s Note: The statements, opinions and data contained in all publications are solely those of the individual author(s) and contributor(s) and not of MDPI and/or the editor(s). MDPI and/or the editor(s) disclaim responsibility for any injury to people or property resulting from any ideas, methods, instructions or products referred to in the content. |
© 2025 by the authors. Published by MDPI on behalf of the Lithuanian University of Health Sciences. Licensee MDPI, Basel, Switzerland. This article is an open access article distributed under the terms and conditions of the Creative Commons Attribution (CC BY) license (https://creativecommons.org/licenses/by/4.0/).
Share and Cite
Kim, J.-H.; Kim, H.-S.; Sohn, J.-H.; Hwang, S.-M.; Lee, J.-J.; Kwon, Y.-S. Functional Disability and Psychological Impact in Headache Patients: A Comparative Study Using Conventional Statistics and Machine Learning Analysis. Medicina 2025, 61, 188. https://doi.org/10.3390/medicina61020188
Kim J-H, Kim H-S, Sohn J-H, Hwang S-M, Lee J-J, Kwon Y-S. Functional Disability and Psychological Impact in Headache Patients: A Comparative Study Using Conventional Statistics and Machine Learning Analysis. Medicina. 2025; 61(2):188. https://doi.org/10.3390/medicina61020188
Chicago/Turabian StyleKim, Jong-Ho, Hye-Sook Kim, Jong-Hee Sohn, Sung-Mi Hwang, Jae-Jun Lee, and Young-Suk Kwon. 2025. "Functional Disability and Psychological Impact in Headache Patients: A Comparative Study Using Conventional Statistics and Machine Learning Analysis" Medicina 61, no. 2: 188. https://doi.org/10.3390/medicina61020188
APA StyleKim, J.-H., Kim, H.-S., Sohn, J.-H., Hwang, S.-M., Lee, J.-J., & Kwon, Y.-S. (2025). Functional Disability and Psychological Impact in Headache Patients: A Comparative Study Using Conventional Statistics and Machine Learning Analysis. Medicina, 61(2), 188. https://doi.org/10.3390/medicina61020188