Evaluating TAB2, IKBKB, and IKBKG Gene Polymorphisms and Serum Protein Levels and Their Association with Age-Related Macular Degeneration and Its Treatment Efficiency


 ,
,
Abstract
1. Introduction
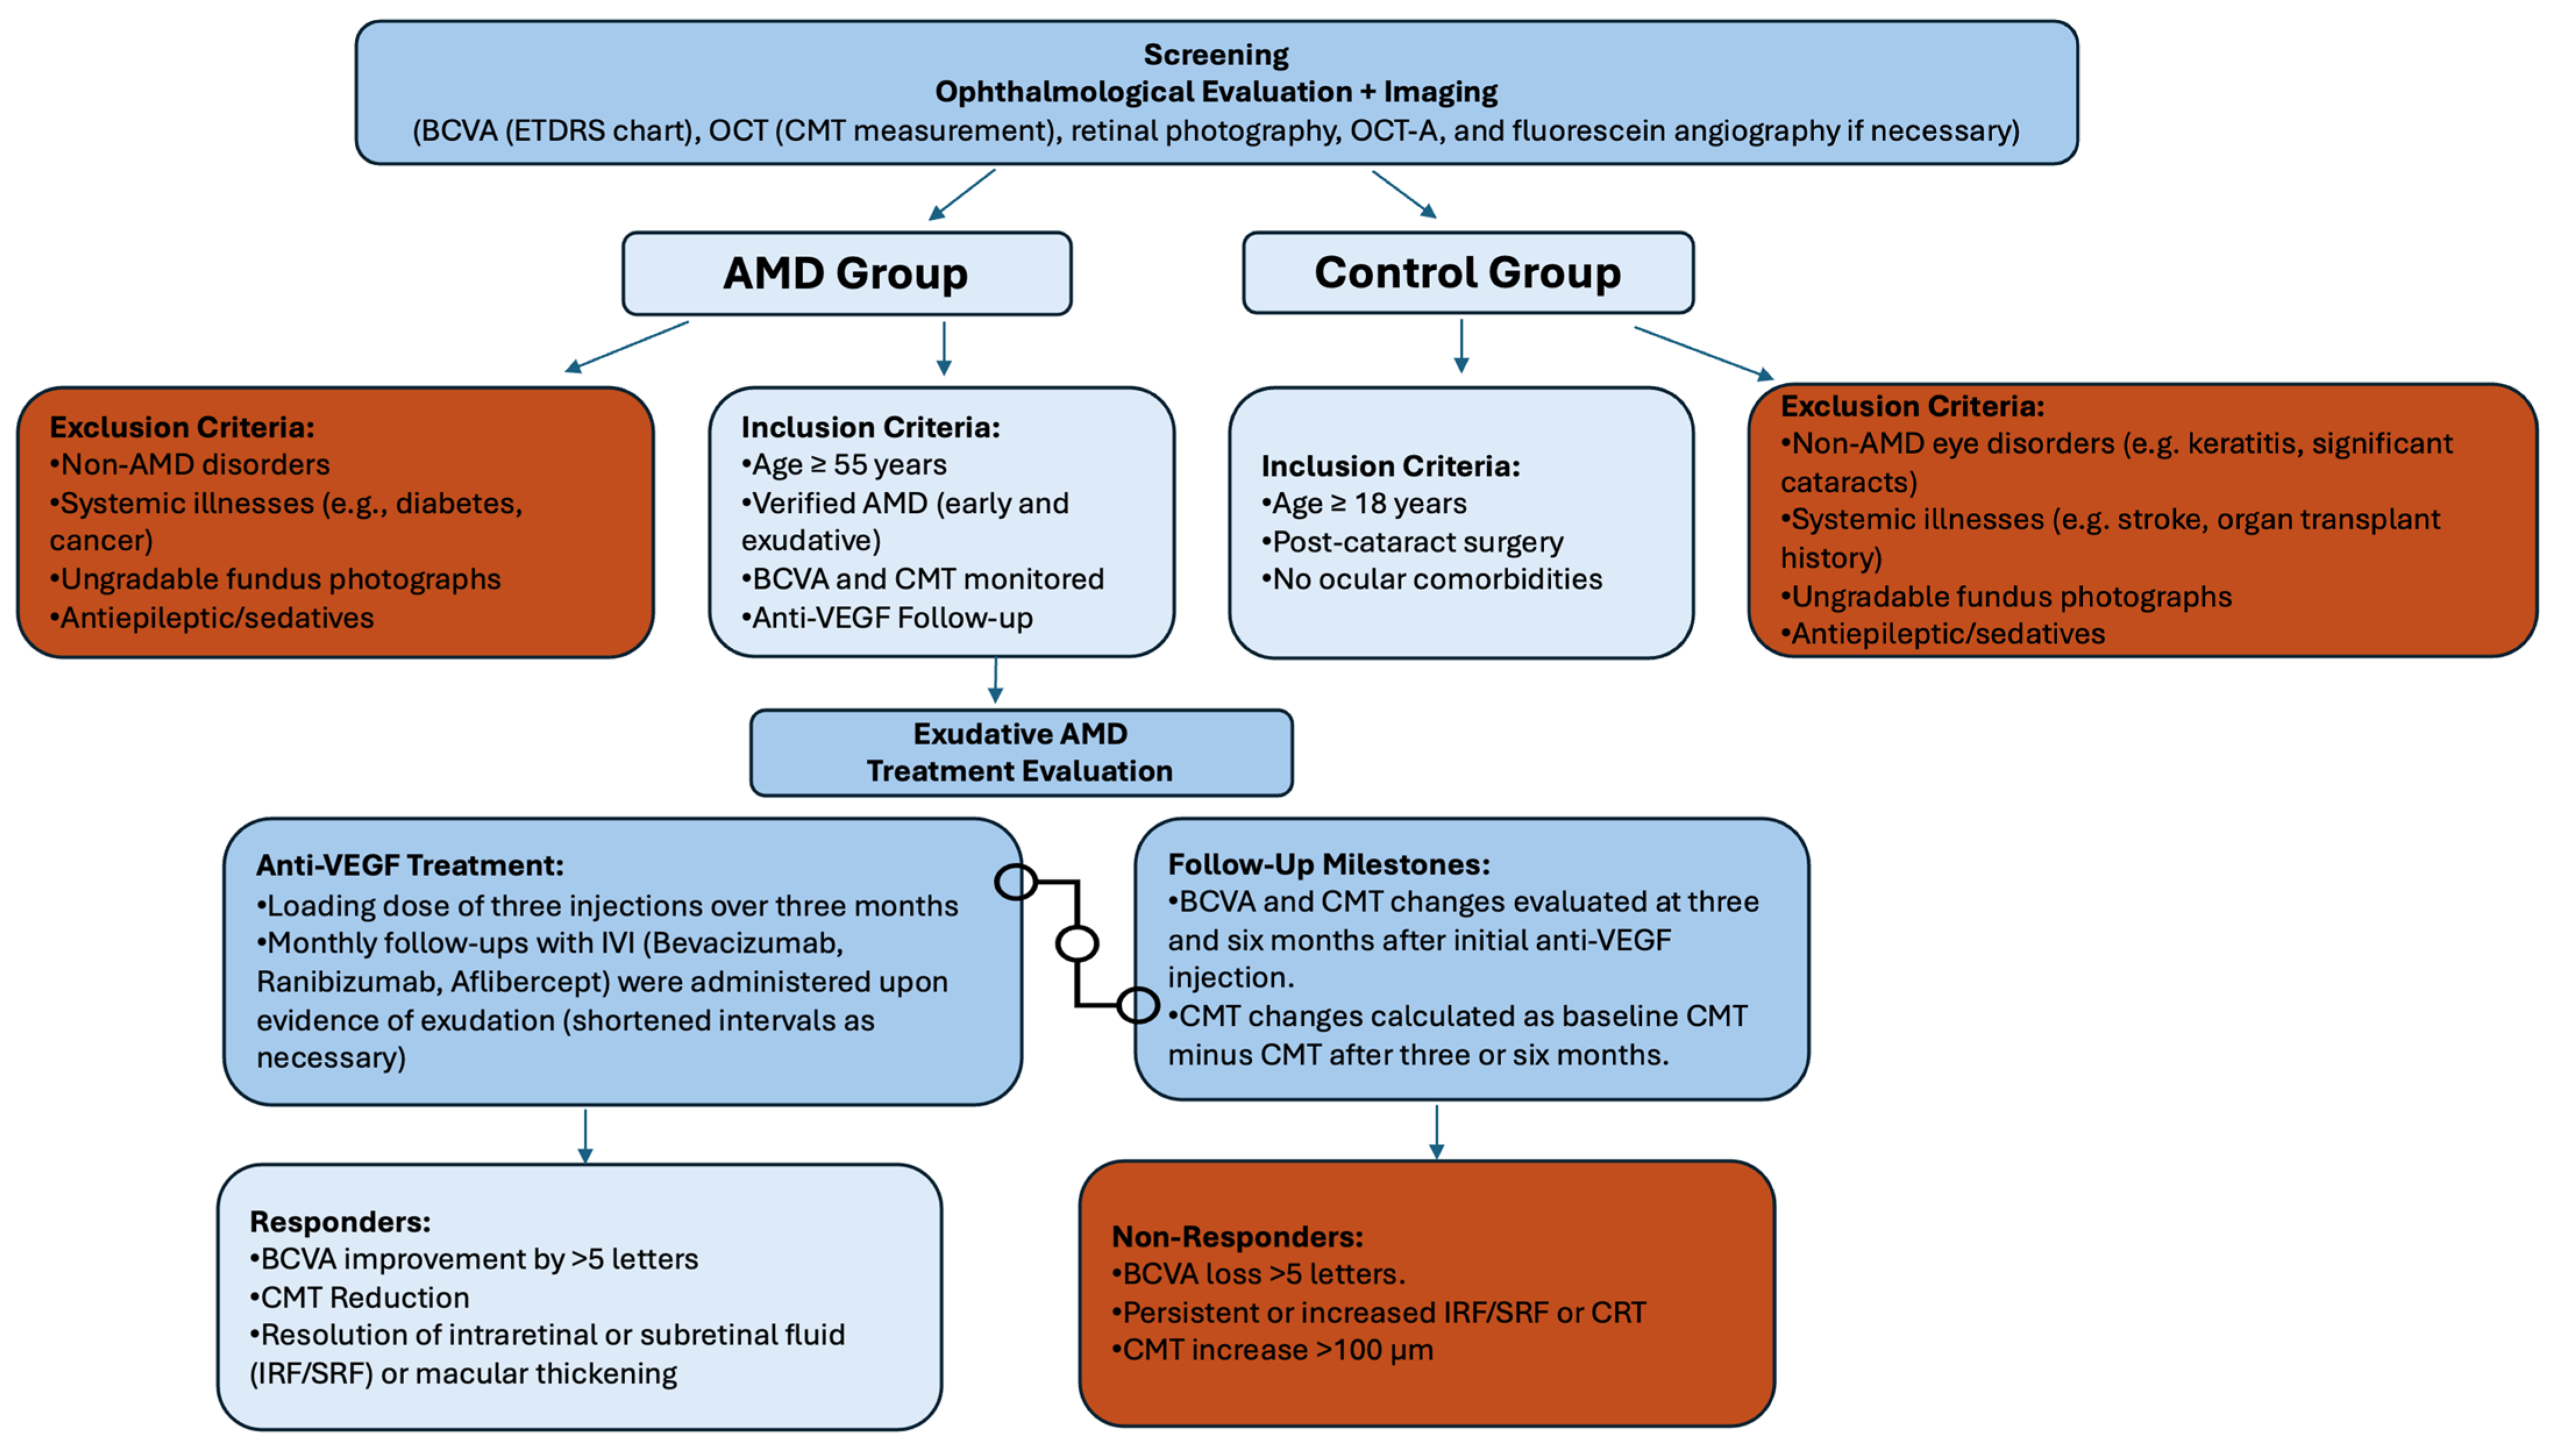
2. Materials and Methods
2.1. Selection of SNPs
2.2. Statistical Evaluation
3. Results
3.1. Exudative AMD Treatment Response and SNPs
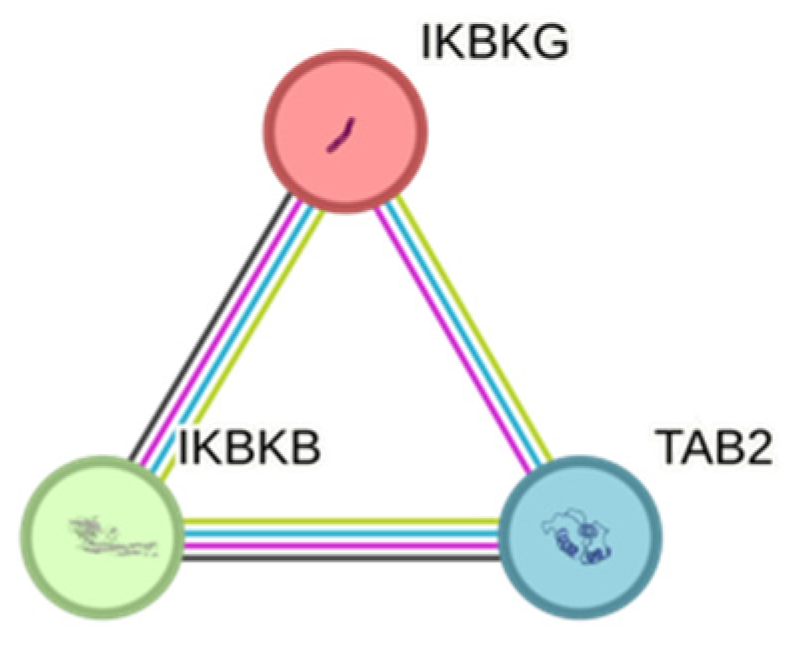
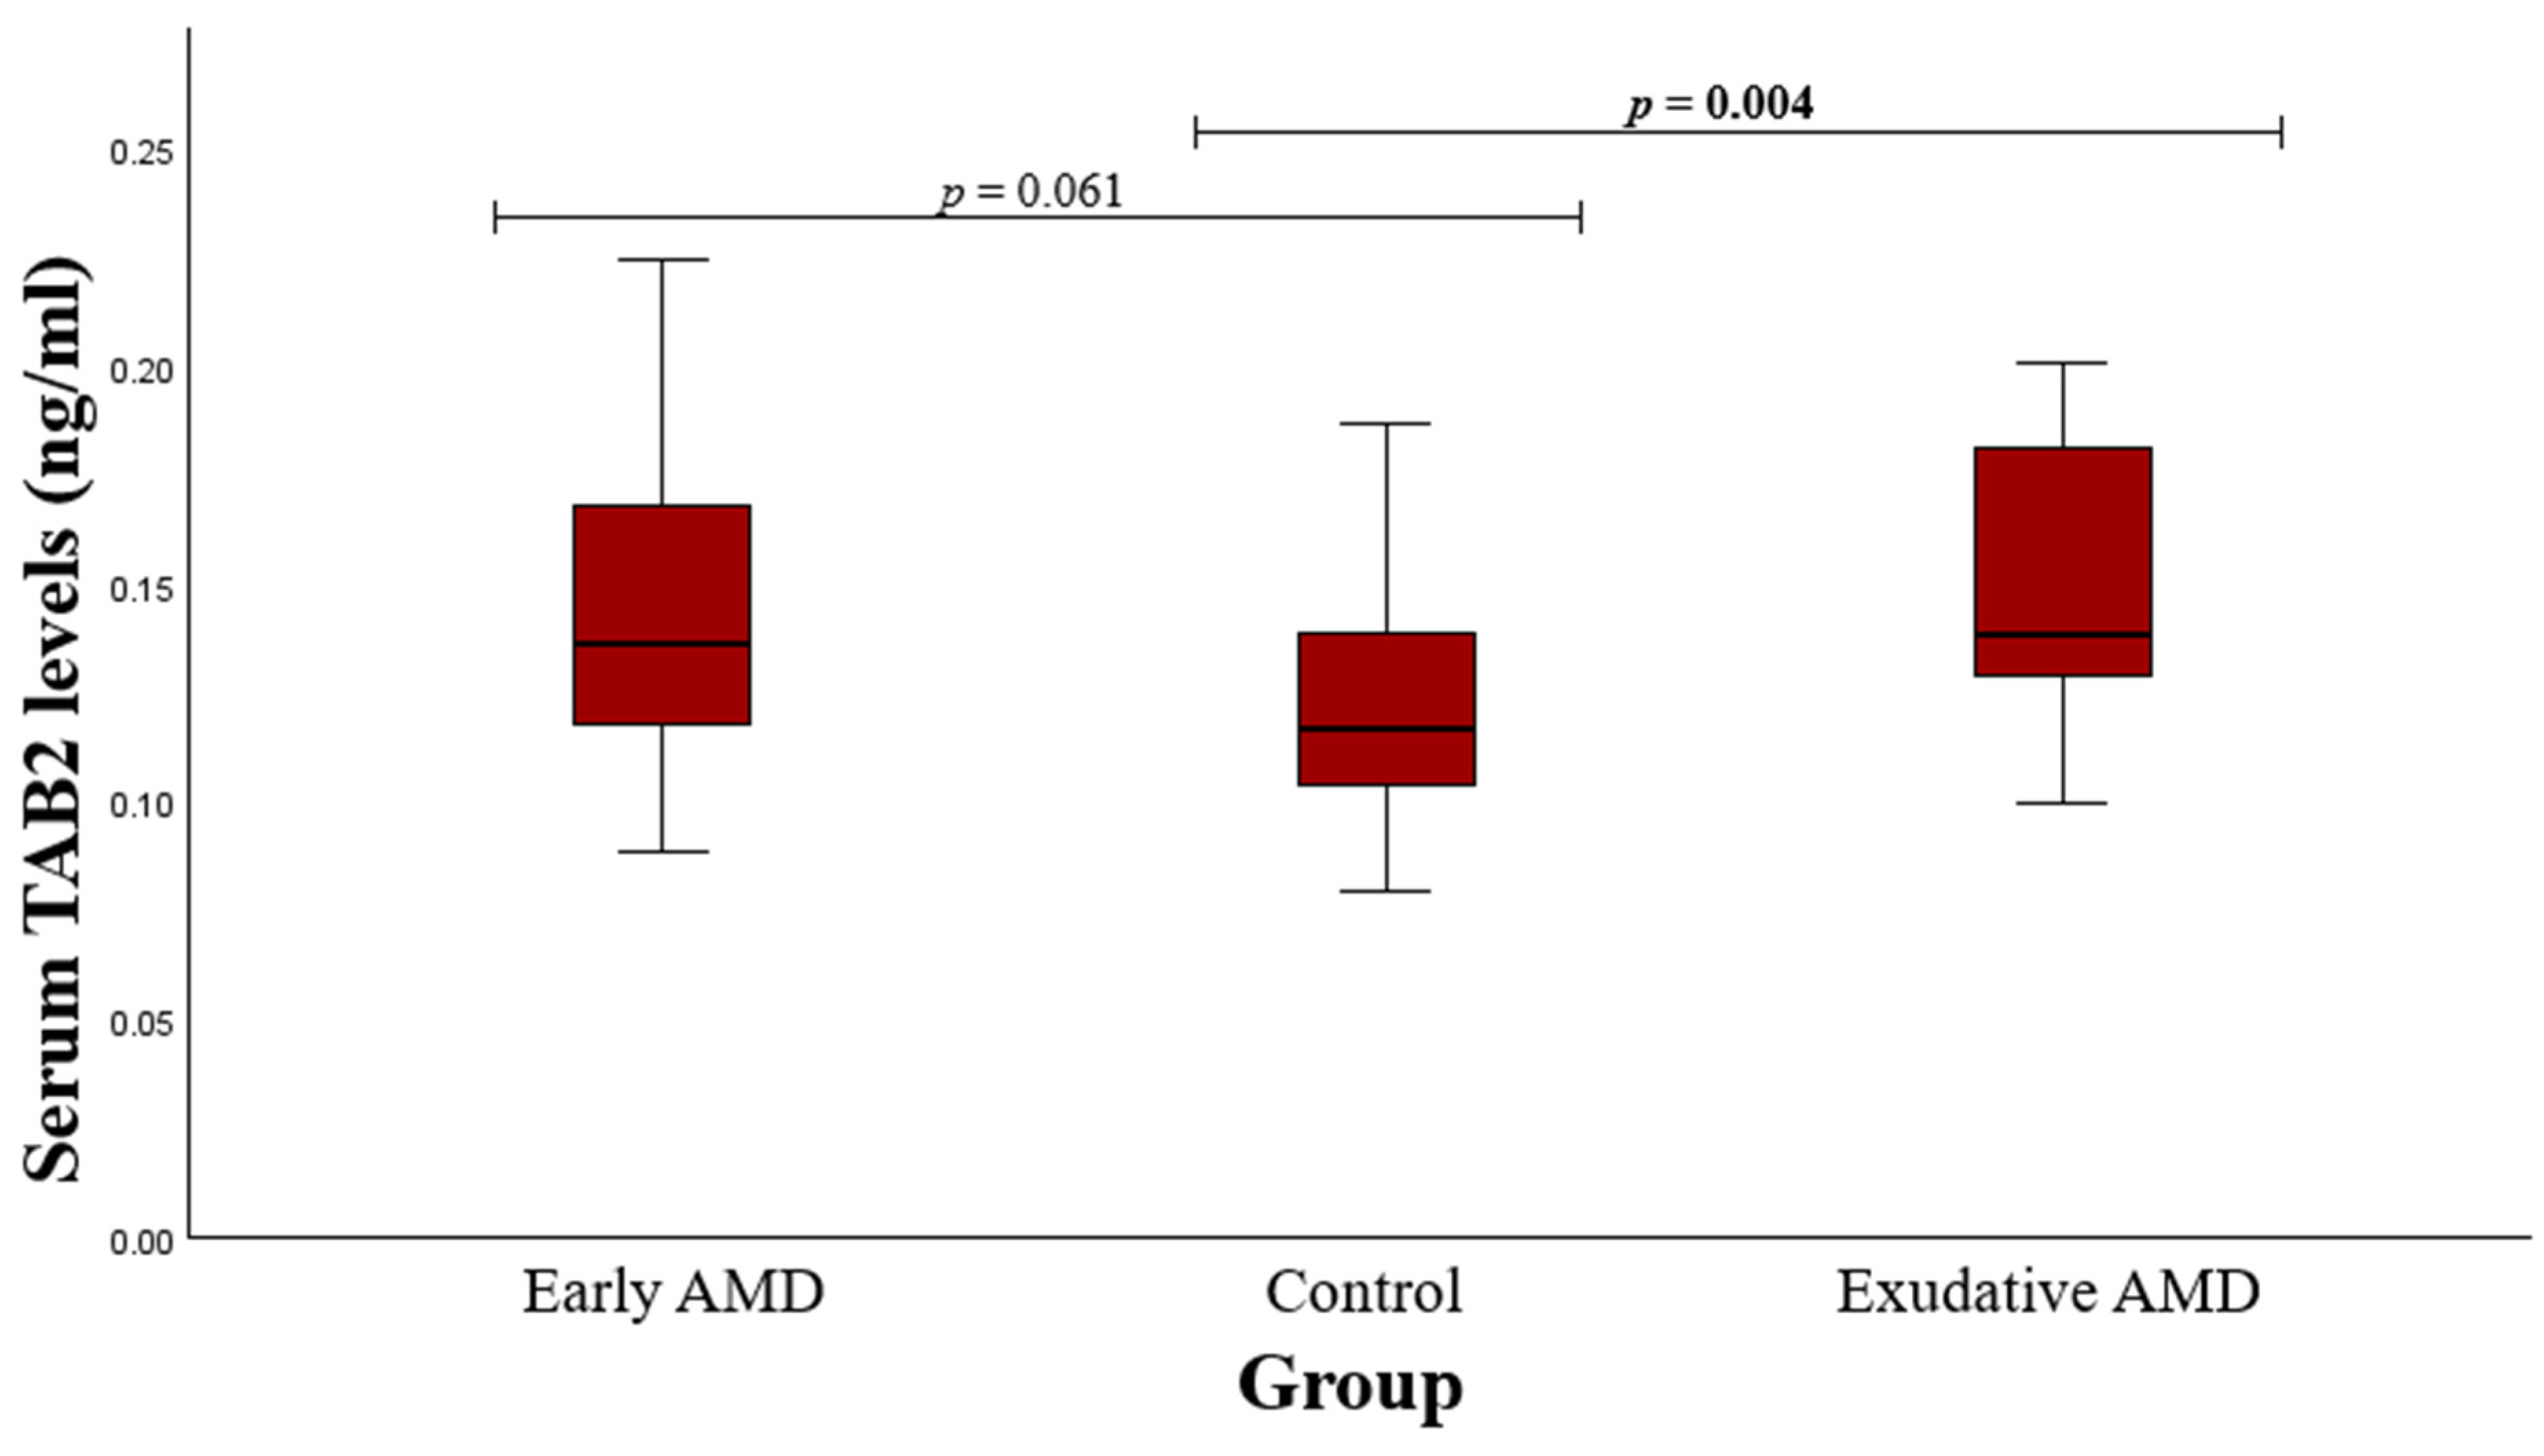
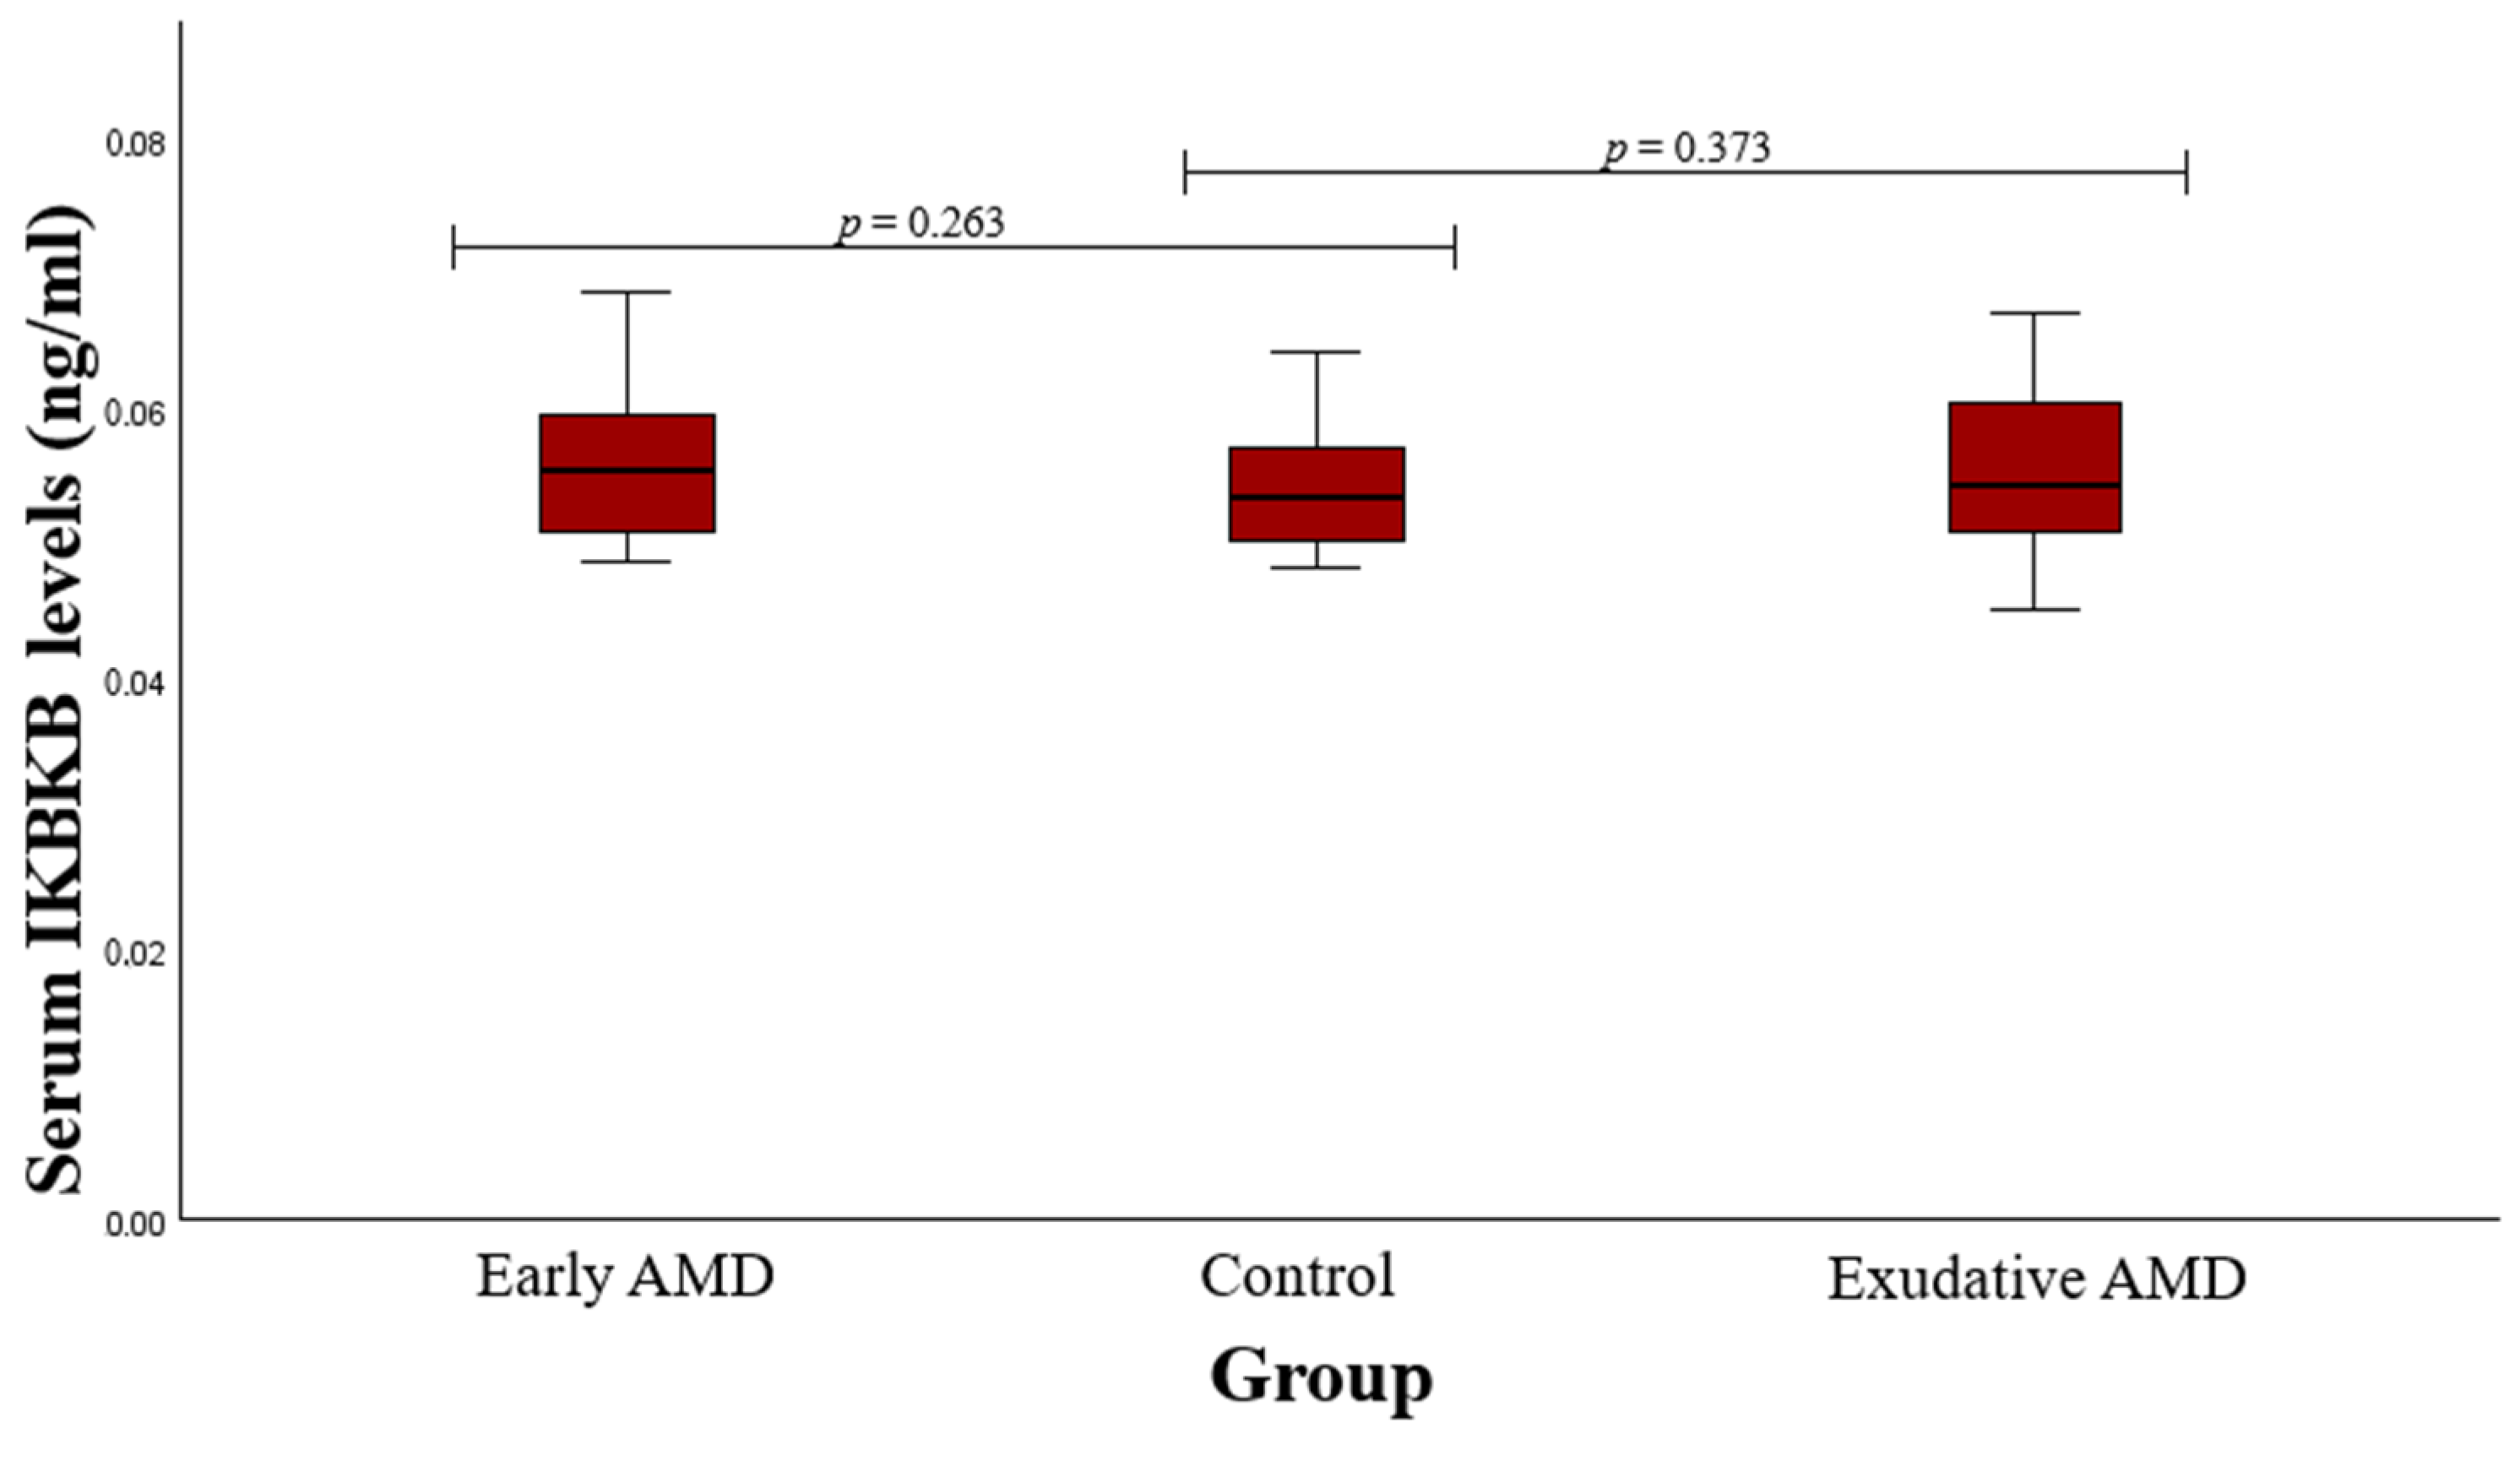
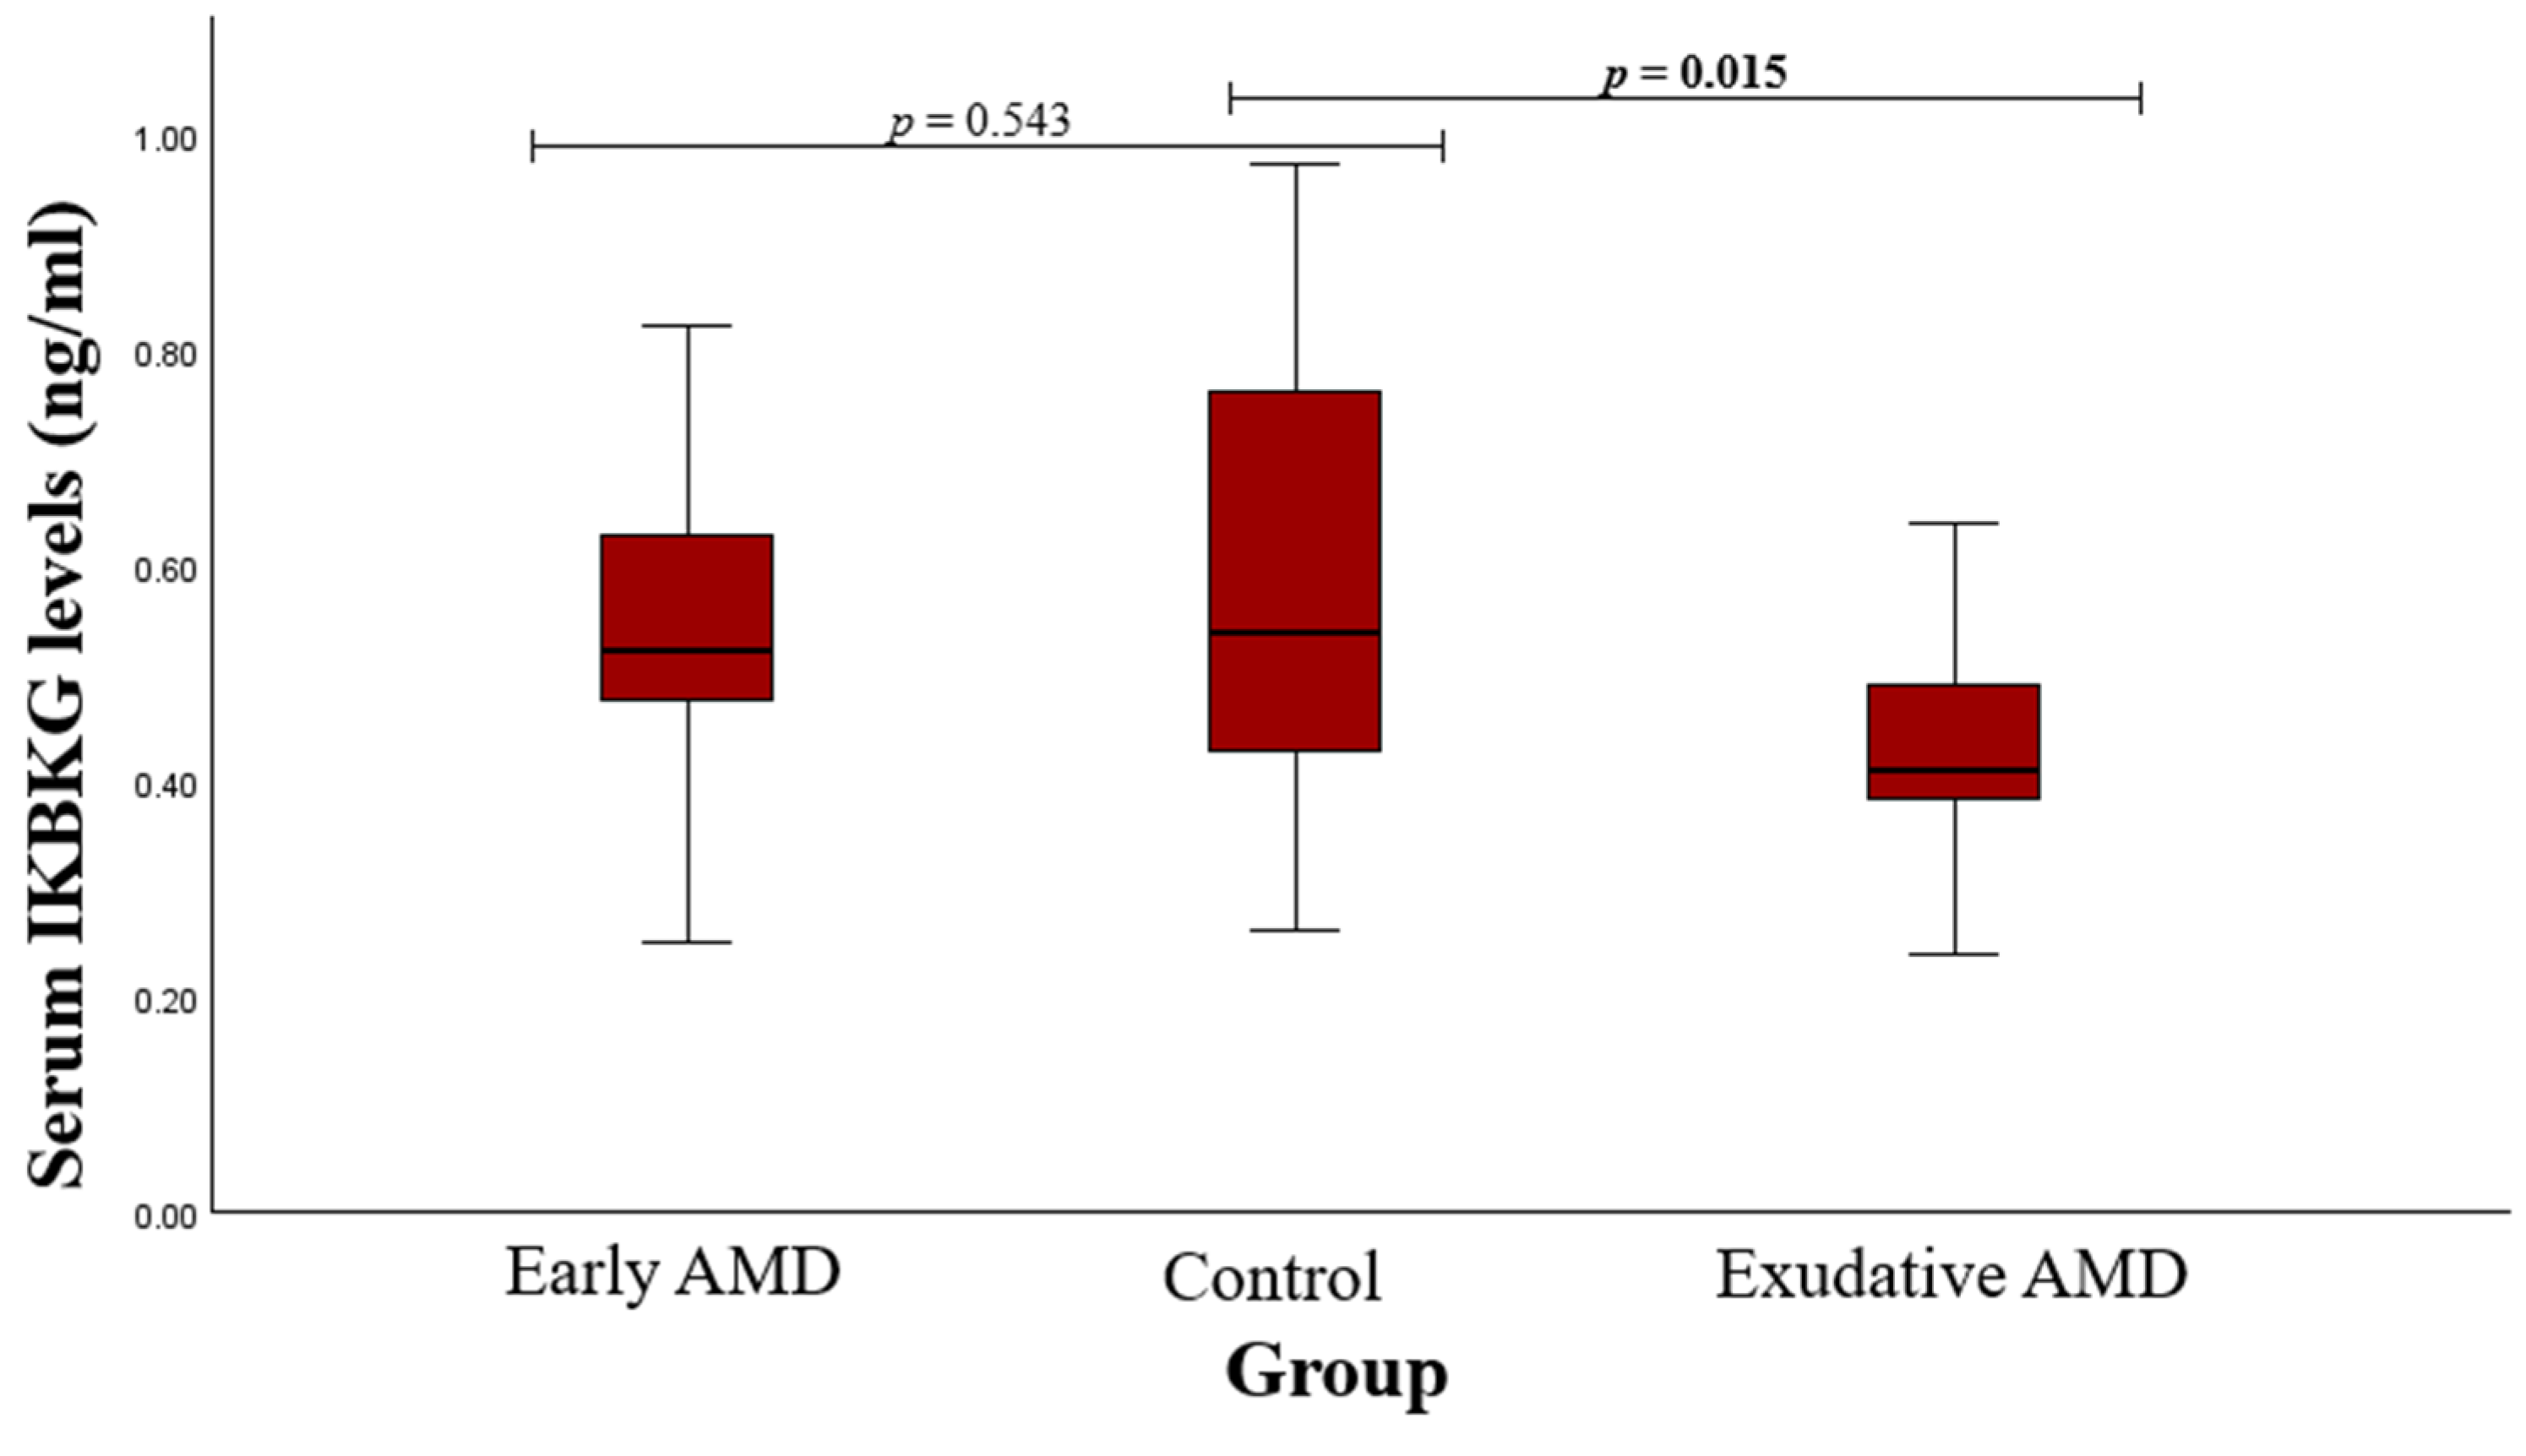
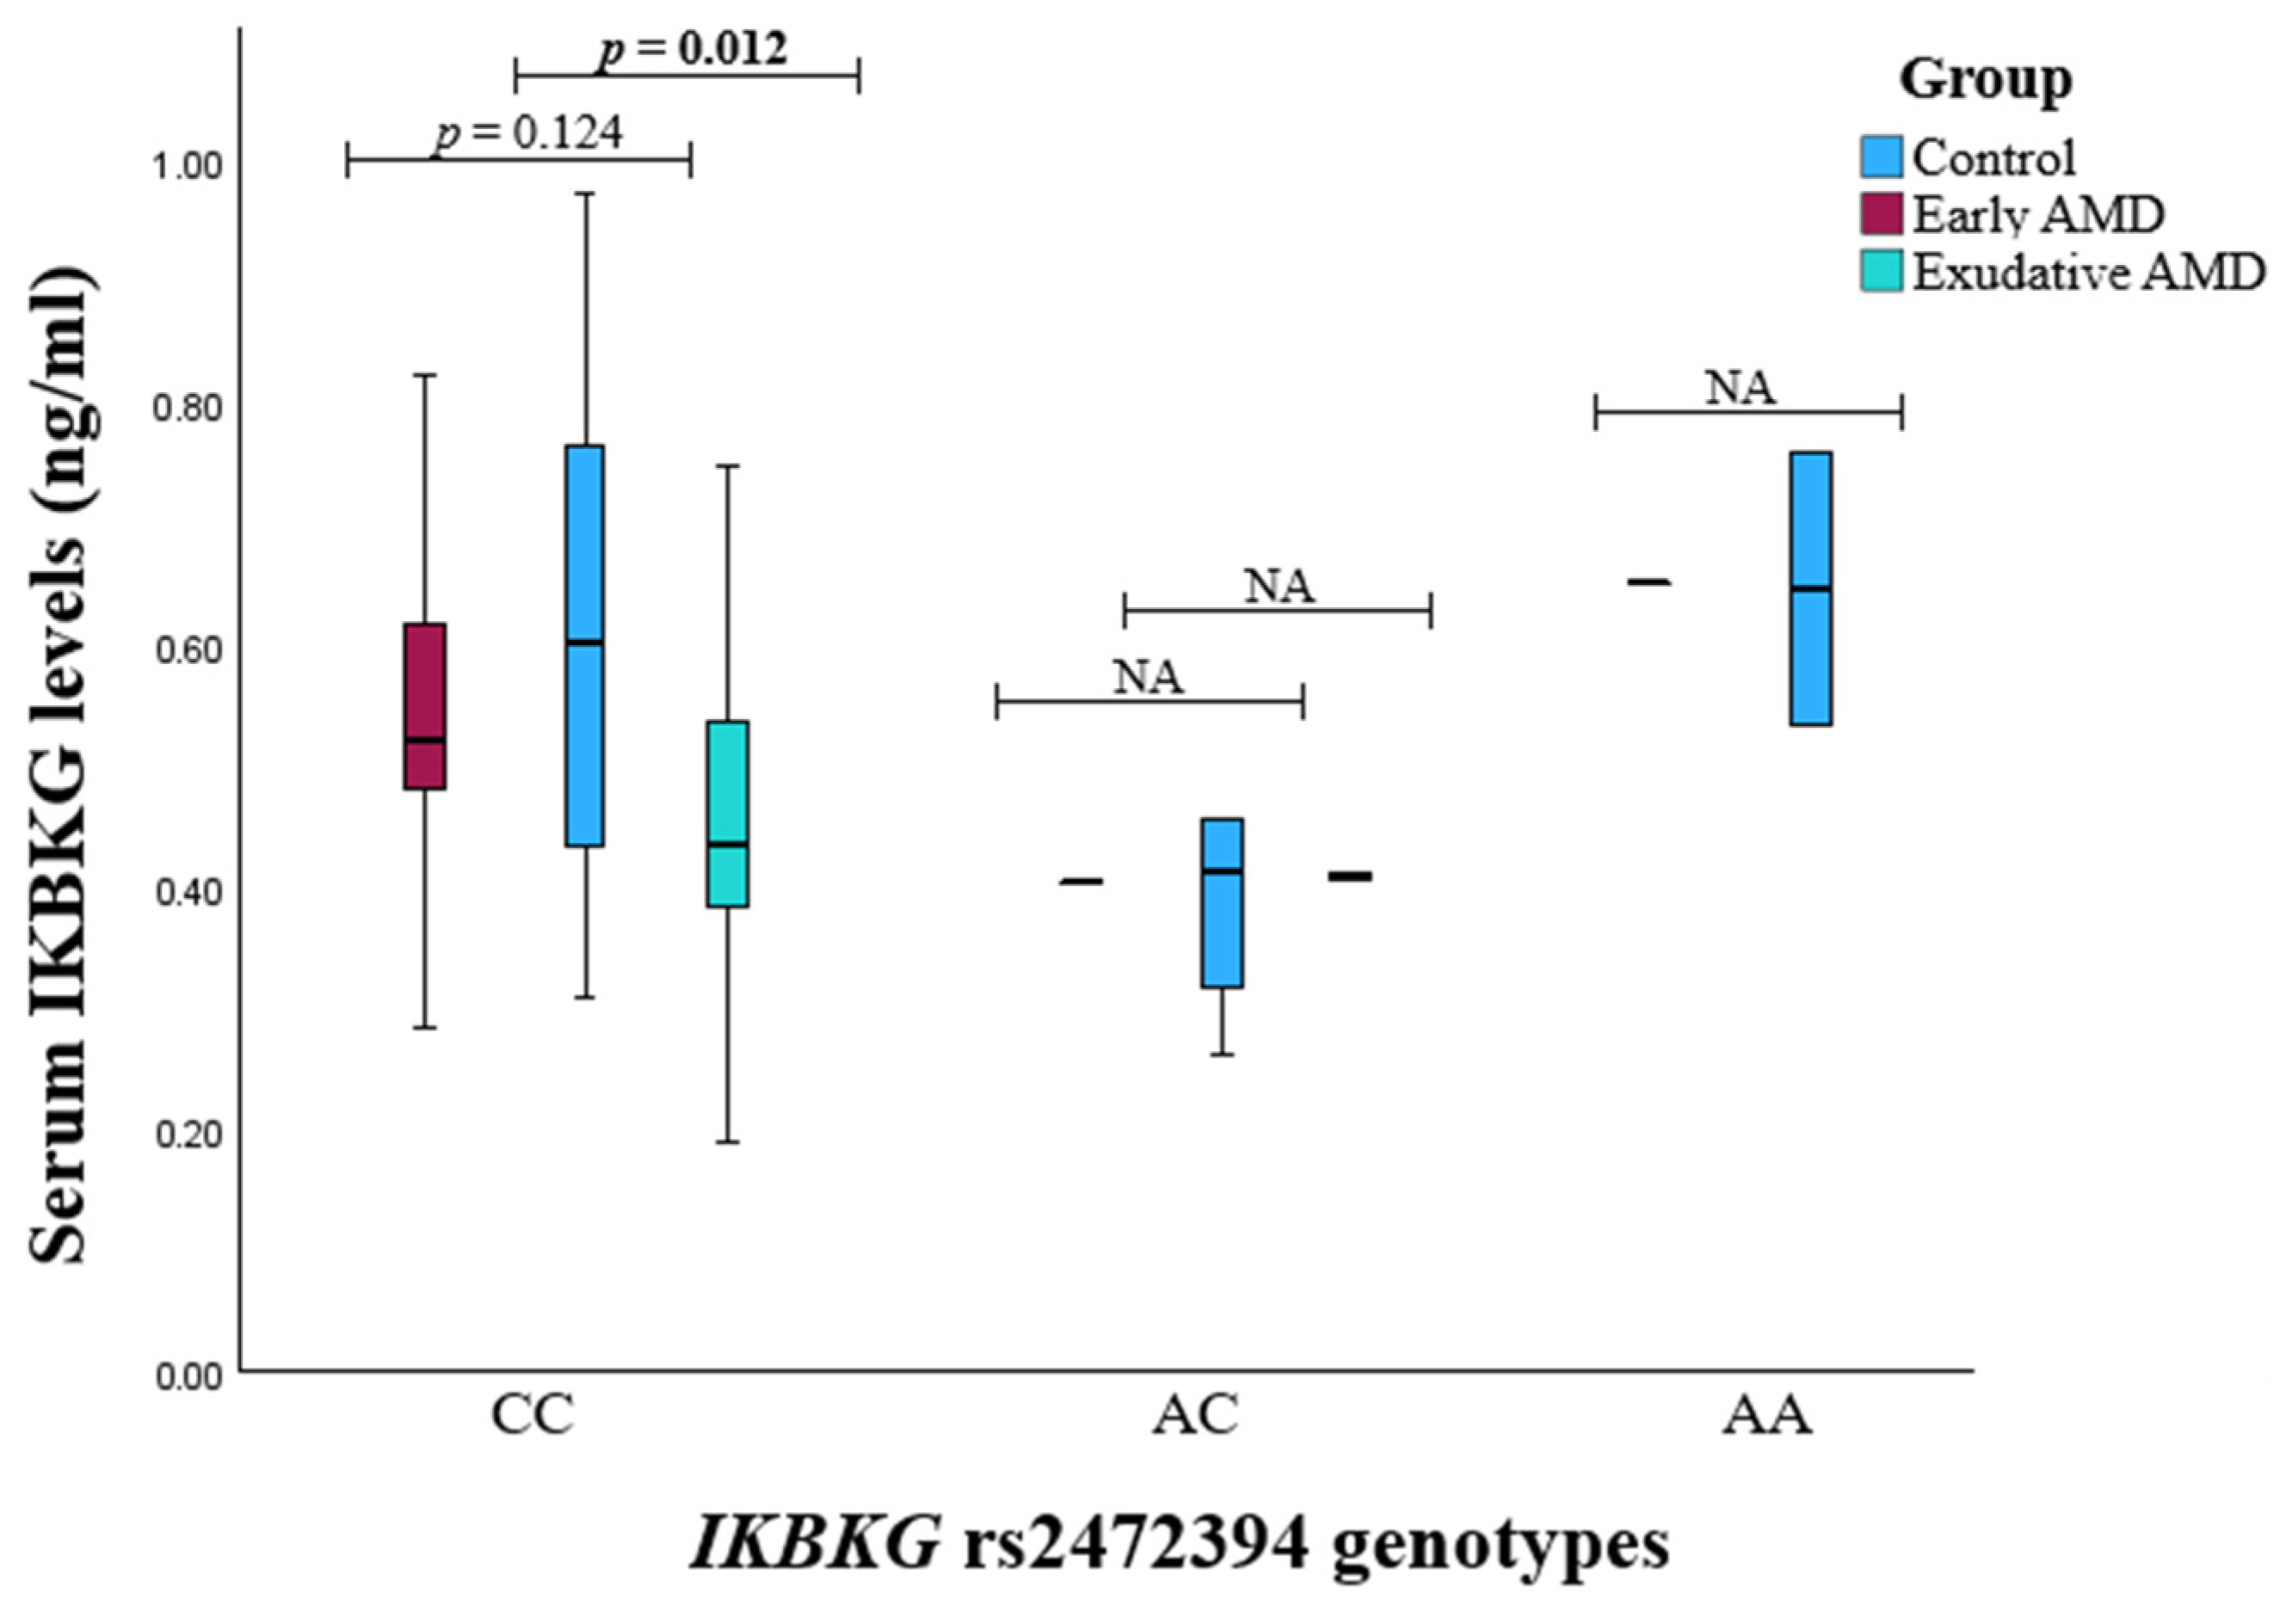
3.2. Serum Protein Level and SNP Associations with AMD
4. Discussion
4.1. TAB2 rs237025
4.2. IKBKB rs13278372
4.3. IKBKG rs2472395
5. Conclusions
Author Contributions
Funding
Institutional Review Board Statement
Informed Consent Statement
Data Availability Statement
Conflicts of Interest
References
- Klein, R.; Klein, B.E.; Knudtson, M.D.; Meuer, S.M.; Swift, M.; Gangnon, R.E. Fifteen-year cumulative incidence of age-related macular degeneration: The Beaver Dam Eye Study. Ophthalmology 2007, 114, 253–262. [Google Scholar] [CrossRef] [PubMed]
- Wong, W.L.; Su, X.; Li, X.; Cheung, C.M.G.; Klein, R.; Cheng, C.-Y.; Wong, T.Y. Global prevalence of age-related macular degeneration and disease burden projection for 2020 and 2040: A systematic review and meta-analysis. Lancet Glob. Health 2014, 2, e106–e116. [Google Scholar] [CrossRef] [PubMed]
- Zhou, M.; Duan, P.C.; Liang, J.H.; Zhang, X.F.; Pan, C.W. Geographic distributions of age-related macular degeneration incidence: A systematic review and meta-analysis. Br. J. Ophthalmol. 2021, 105, 1427–1434. [Google Scholar] [CrossRef] [PubMed]
- Li, J.Q.; Welchowski, T.; Schmid, M.; Mauschitz, M.M.; Holz, F.G.; Finger, R.P. Prevalence and incidence of age-related macular degeneration in Europe: A systematic review and meta-analysis. Br. J. Ophthalmol. 2020, 104, 1077–1084. [Google Scholar] [CrossRef] [PubMed]
- Liutkeviciene, R.; Lesauskaite, V.; Asmoniene, V.; Zaliūniene, D.; Jasinskas, V. Factors determining age-related macular degeneration: A current view. Medicina 2010, 46, 89–94. [Google Scholar] [CrossRef]
- Casten, R.J.; Rovner, B.W. Update on depression and age-related macular degeneration. Curr. Opin. Ophthalmol. 2013, 24, 239–243. [Google Scholar] [CrossRef]
- Gabrielle, P.H.; Maitrias, S.; Nguyen, V.; Arnold, J.J.; Squirrell, D.; Arnould, L.; Sanchez-Monroy, J.; Viola, F.; O’Toole, L.; Barthelmes, D.; et al. Incidence, risk factors and outcomes of submacular haemorrhage with loss of vision in neovascular age-related macular degeneration in daily clinical practice: Data from the FRB! registry. Acta Ophthalmol. 2022, 100, e1569–e1578. [Google Scholar] [CrossRef]
- Ferris, F.L., III; Wilkinson, C.P.; Bird, A.; Chakravarthy, U.; Chew, E.; Csaky, K.; Sadda, S.R. Clinical classification of age-related macular degeneration. Ophthalmology 2013, 120, 844–851. [Google Scholar] [CrossRef]
- Bhumika; Bora, N.S.; Bora, P.S. Genetic insights into age-related macular degeneration. Biomedicines 2024, 12, 1479. [Google Scholar] [CrossRef]
- Blasiak, J.; Pawlowska, E.; Ciupińska, J.; Derwich, M.; Szczepanska, J.; Kaarniranta, K. A new generation of gene therapies as the future of wet AMD treatment. Int. J. Mol. Sci. 2024, 25, 2386. [Google Scholar] [CrossRef]
- Paliwal, H.; Prajapati, B.G.; Sichana, T.; Singh, S.; Patel, R.J. Novel Approaches in the drug development and delivery systems for age-related macular degeneration. Life 2023, 13, 568. [Google Scholar] [CrossRef] [PubMed]
- Takaesu, G.; Ninomiya-Tsuji, J.; Kishida, S.; Li, X.; Stark, G.R.; Matsumoto, K. Interleukin-1 (IL-1) receptor-associated kinase leads to activation of TAK1 by inducing TAB2 translocation in the IL-1 signaling pathway. Mol. Cell. Biol. 2001, 21, 2475–2484. [Google Scholar] [CrossRef] [PubMed]
- Gu, Z.; Chen, X.; Yang, W.; Qi, Y.; Yu, H.; Wang, X.; Gong, Y.; Chen, Q.; Zhong, B.; Dai, L.; et al. The SUMOylation of TAB2 mediated by TRIM60 inhibits MAPK/NF-κB activation and the innate immune response. Cell. Mol. Immunol. 2021, 18, 1981–1994. [Google Scholar] [CrossRef] [PubMed]
- Xiao, K.; He, W.; Guan, W.; Hou, F.; Yan, P.; Xu, J.; Zhou, T.; Liu, Y.; Xie, L. Mesenchymal stem cells reverse EMT process through blocking the activation of NF-κB and Hedgehog pathways in LPS-induced acute lung injury. Cell Death Dis. 2020, 11, 863. [Google Scholar] [CrossRef]
- Hinz, M.; Scheidereit, C. The IκB kinase complex in NF-κB regulation and beyond. EMBO Rep. 2014, 15, 46–61. [Google Scholar] [CrossRef]
- Mercurio, F.; Zhu, H.; Murray, B.W.; Shevchenko, A.; Bennett, B.L.; Li, J.; Young, D.B.; Barbosa, M.; Mann, M.; Manning, A.; et al. IKK-1 and IKK-2: Cytokine-activated IkappaB kinases essential for NF-kappaB activation. Science 1997, 278, 860–866. [Google Scholar] [CrossRef]
- Berlin, A.L.; Paller, A.S.; Chan, L.S. Incontinentia pigmenti: A review and update on the molecular basis of pathophysiology. J. Am. Acad. Dermatol. 2002, 47, 169–187. [Google Scholar] [CrossRef]
- Courtois, G.; Gilmore, T.D. Mutations in the NF-κB signaling pathway: Implication for human disease. Oncogene 2006, 25, 6831–6843. [Google Scholar] [CrossRef]
- Aradhya, S.; Woffendin, H.; Jakins, T.; Bardaro, T.; Esposito, T.; Smahi, A.; Shaw, C.; Levy, M.; Munnich, A.; D’Urso, M.; et al. A recurrent deletion in the ubiquitously expressed NEMO (IKK-γ) gene accounts for the vast majority of incontinentia pigmenti mutations. Hum. Mol. Genet. 2001, 10, 2171–2179. [Google Scholar] [CrossRef]
- Minić, S.; Cerovac, N.; Novaković, I.; Gazikalović, S.; Popadić, S.; Trpinac, D. The Impact of the IKBKG Gene on the Appearance of the Corpus Callosum Abnormalities in Incontinentia Pigmenti. Diagnostics 2023, 13, 1300. [Google Scholar] [CrossRef]
- Cebatoriene, D.; Vilkeviciute, A.; Gedvilaite-Vaicechauskiene, G.; Duseikaite, M.; Bruzaite, A.; Kriauciuniene, L.; Zaliuniene, D.; Liutkeviciene, R. The Impact of ARMS2 (rs10490924), VEGFA (rs3024997), TNFRSF1B(rs1061622), TNFRSF1A (rs4149576), and IL1B1 (rs1143623) Polymorphisms and Serum Levels on Age-Related Macular Degeneration Development and Therapeutic Responses. Int. J. Mol. Sci. 2024, 25, 9750. [Google Scholar] [CrossRef] [PubMed]
- Szklarczyk, D.; Kirsch, R.; Koutrouli, M.; Nastou, K.; Mehryary, F.; Hachilif, R.; Gable, A.L.; Fang, T.; Doncheva, N.T.; Pyysalo, S.; et al. The STRING database in 2023: Protein-protein association networks and functional enrichment analyses for any sequenced genome of interest. Nucleic Acids Res. 2023, 51, D638–D646. [Google Scholar] [CrossRef] [PubMed]
- Pu, L.M.; Nan, N.; Yang, Z.; Jin, Z.N. Association between SUMO4 polymorphisms and type 2 diabetes mellitus. Yi Chuan 2012, 34, 315–325. [Google Scholar] [CrossRef] [PubMed]
- Noso, S.; Fujisawa, T.; Kawabata, Y.; Asano, K.; Hiromine, Y.; Fukai, A.; Ogihara, T.; Ikegami, H. Association of small ubiquitin-like modifier 4 (SUMO4) variant, located in IDDM5 locus, with type 2 diabetes in the Japanese population. J. Clin. Endocrinol. Metab. 2007, 92, 2358–2362. [Google Scholar] [CrossRef] [PubMed]
- Li, Y.Y.; Wang, H.; Yang, X.X.; Geng, H.Y.; Gong, G.; Kim, H.J.; Zhou, Y.H.; Wu, J.J. Small Ubiquitin-Like Modifier 4 (SUMO4) Gene M55V Polymorphism and Type 2 Diabetes Mellitus: A Meta-analysis Including 6,823 Subjects. Front. Endocrinol. 2017, 8, 303. [Google Scholar] [CrossRef]
- Li, H.; Yang, Z.; Pu, L.M.; Li, X.; Ruan, Y.; Yang, F.; Meng, S.; Yang, D.; Yao, W.; Fu, H.; et al. Adiponectin receptor 1 and small ubiquitin-like modifier 4 polymorphisms are associated with risk of coronary artery disease without diabetes. J. Geriatr. Cardiol. 2016, 13, 776–782. [Google Scholar] [CrossRef]
- Almalki, W.H.; Almujri, S.S. The impact of NF-κB on inflammatory and angiogenic processes in age-related macular degeneration. Exp. Eye Res. 2024, 248, 110111. [Google Scholar] [CrossRef]
- Ahmed, N.; Zeng, M.; Sinha, I.; Polin, L.; Wei, W.-Z.; Rathinam, C.; Flavell, R.; Massoumi, R.; Venuprasad, K. The E3 ligase Itch and deubiquitinase Cyld act together to regulate Tak1 and inflammation. Nat. Immunol. 2011, 12, 1176–1183. [Google Scholar] [CrossRef]
- Safina, A.; Sotomayor, P.; Limoge, M.; Morrison, C.; Bakin, A.V. TAK1-TAB2 signaling contributes to bone destruction by breast carcinoma cells. Mol. Cancer Res. 2011, 8, 1042–1053. [Google Scholar] [CrossRef]
- Xia, Y.; Yeddula, N.; Leblanc, M.; Ke, E.; Zhang, Y.; Oldfield, E.; Shaw, R.J.; Verma, I.M. Reduced cell proliferation by IKK2 depletion in a mouse lung-cancer model. Nat. Cell Biol. 2012, 14, 257–265. [Google Scholar] [CrossRef]
- Yang, J.; Splittgerber, R.; Yull, F.E.; Kantrow, S.; Ayers, G.D.; Karin, M.; Richmond, A. Conditional ablation of Ikkb inhibits melanoma tumor development in mice. J. Clin. Investig. 2010, 120, 2563–2574. [Google Scholar] [CrossRef] [PubMed]
- Baumann, B.; Wagner, M.; Aleksic, T.; Von Wichert, G.; Weber, C.K.; Adler, G.; Wirth, T. Constitutive IKK2 activation in acinar cells is sufficient to induce pancreatitis in vivo. J. Clin. Investig. 2007, 117, 1502–1513. [Google Scholar] [CrossRef] [PubMed]
- Aleksic, T.; Baumann, B.; Wagner, M.; Adler, G.; Wirth, T.; Weber, C.K. Cellular immune reaction in the pancreas is induced by constitutively active IκB kinase-2. Gut 2007, 56, 227–236. [Google Scholar] [CrossRef]
- Gong, Y.; Zhao, W.; Jia, Q.; Dai, J.; Chen, N.; Chen, Y.; Gu, D.; Huo, X.; Chen, J. Ikbkb rs2272736 is associated with gastric cancer survival. Pharmgenomics Pers. Med. 2020, 13, 345–352. [Google Scholar] [CrossRef]
- Zaliunas, B.R.; Gedvilaite-Vaicechauskiene, G.; Kriauciuniene, L.; Tamasauskas, A.; Liutkeviciene, R. Associations of TRAF2 (rs867186), TAB2 (rs237025), IKBKB (rs13278372) Polymorphisms and TRAF2, TAB2, IKBKB Protein Levels with Clinical and Morphological Features of Pituitary Adenomas. Cancers 2024, 16, 2509. [Google Scholar] [CrossRef]
- Genetics Home Reference. Genes. IKBKG. Available online: https://www.ncbi.nlm.nih.gov/gene/8517 (accessed on 20 October 2024).
- Scheuerle, A.E.; Ursini, M.V. Incontinentia Pigmenti. 1999 Jun 8 [updated 2017 Dec 21]. In GeneReviews® [Internet]; Adam, M.P., Feldman, J., Mirzaa, G.M., Pagon, R.A., Wallace, S.E., Amemiya, A., Eds.; University of Washington: Seattle, WA, USA, 1999. [Google Scholar] [PubMed]
- Smahi, A.; Courtois, G.; Vabres, P.; Yamaoka, S.; Heuertz, S.; Munnich, A. Genomic rearrangement in NEMO impairs NF-κB activation and is a cause of incontinentia pigmenti. The International Incontinentia Pigmenti (IP) Consortium. Nature 2000, 405, 466–472. [Google Scholar]
- Parrish, J.E.; Scheuerle, A.E.; Lewis, R.A.; Levy, M.L.; Nelson, D.L. Selection against mutant alleles in blood leukocytes is a consistent feature in incontinentia pigmenti type 2. Hum. Mol. Genet. 1996, 5, 1777–1783. [Google Scholar] [CrossRef]
- Fusco, F. Molecular analysis of the genetic defect in a large cohort of IP patients and identification of novel NEMO mutations interfering with NF-κB activation. Hum. Mol. Genet. 2004, 13, 1763–1773. [Google Scholar] [CrossRef]
- Fusco, F.; Paciolla, M.; Napolitano, F.; Pescatore, A.; D’Addario, I.; Bal, E.; Lioi, M.B.; Smahi, A.; Miano, M.G.; Ursini, M.V. Genomic architecture at the Incontinentia Pigmenti locus favours de novo pathological alleles through different mechanisms. Hum. Mol. Genet. 2012, 21, 1260–1271. [Google Scholar] [CrossRef]
- Wang, R.; Lara-Corrales, I.; Kannu, P.; Pope, E. Unraveling incontinentia pigmenti: A comparison of phenotype and genotype variants. J. Am. Acad. Dermatol. 2019, 81, 1142–1149. [Google Scholar] [CrossRef]
- Dangouloff-Ros, V.; Hadj-Rabia, S.; Oliveira Santos, J.; Bal, E.; Desguerre, I.; Kossorotoff, M.; An, I.; Smahi, A.; Bodemer, C.; Munnich, A.; et al. Severe neuroimaging anomalies are usually associated with random X inactivation in leucocytes circulating DNA in X-linked dominant incontinentia pigmenti. Mol. Genet. Metab. 2017, 122, 140–144. [Google Scholar] [CrossRef] [PubMed]
- Kim, H.; Song, H.; Kim, K.; Kim, J.; Chae, J.; Kim, M.; Seong, M.; Ko, J.M. Importance of extracutaneous organ involvement in determining the clinical severity and prognosis of incontinentia pigmenti caused by mutations in the IKBKG gene. Exp. Dermatol. 2021, 30, 676–683. [Google Scholar] [CrossRef] [PubMed]
- Nelson, D. NEMO, NF-κB signaling and incontinentia pigmenti. Curr. Opin. Genet. Dev. 2006, 16, 282–288. [Google Scholar] [CrossRef] [PubMed]
- Gong, Y.; Zhan, Y.; Yuan, T.; Liao, Y.; Zhang, L.; Liu, X.; Zheng, Y.; Bao, Y. Association of HTRA1 and CFH gene polymorphisms with age-related macular degeneration in Ningbo, China. Int. Ophthalmol. 2021, 41, 995–1002. [Google Scholar] [CrossRef]
- Romero-Vazquez, S.; Llorens, V.; Soler-Boronat, A.; Figueras-Roca, M.; Adan, A.; Molins, B. Interlink between inflammation and oxidative stress in age-related macular degeneration: Role of complement factor H. Biomedicines 2021, 9, 763. [Google Scholar] [CrossRef]
- Kanda, A.; Chen, W.; Othman, M.; Branham, K.E.; Brooks, M.; Khanna, R.; He, S.; Lyons, R.; Abecasis, G.R.; Swaroop, A. A variant of mitochondrial protein LOC387715/ARMS2, not HTRA1, is strongly associated with age-related macular degeneration. Proc. Natl. Acad. Sci. USA 2007, 104, 16227–16232. [Google Scholar] [CrossRef]
- Ding, X.; Patel, M.; Chan, C.C. Molecular pathology of age-related macular degeneration. Prog. Retin. Eye Res. 2009, 28, 1–18. [Google Scholar] [CrossRef]

| Characteristics | Groups | p-Value | |||
|---|---|---|---|---|---|
| Control | Early AMD | Exudative AMD | |||
| Gender | Females, n (%) | 218 (64.7) | 195 (69.4) | 223 (65.0) | 0.217 * 0.929 ** |
| Males, n (%) | 119 (35.3) | 86 (30.6) | 120 (35.0) | ||
| Age, Median (IQR) | 72 (11) | 73.5 (13) | 77 (10) | 0.056 * <0.001 ** | |
| Genotype/Allele | Groups | p-Value * | p-Value ** | ||
|---|---|---|---|---|---|
| Control, n (%) N = 337 | Early AMD, n (%) N = 281 | Exudative AMD, n (%) N = 343 | |||
| TAB2 rs237025 | |||||
| GG | 116 (34.4) | 75 (26.7) | 92 (26.8) | 0.111 | 0.072 |
| AG | 164 (48.7) | 150 (53.4) | 178 (51.9) | ||
| AA | 57 (16.9) | 56 (19.9) | 73 (21.3) | ||
| G | 396 (58.8) | 300 (53.4) | 362 (52.8) | 0.058 | 0.026 |
| A | 278 (41.2) | 262 (46.6) | 324 (47.2) | ||
| IKBKB rs13278372 | |||||
| CC | 274 (81.3) | 226 (80.4) | 270 (78.7) | 0.834 | 0.662 |
| AC | 58 (17.2) | 52 (18.5) | 66 (19.2) | ||
| AA | 5 (1.5) | 3 (1.1) | 7 (2.0) | ||
| C | 606 (89.9) | 504 (89.7) | 606 (88.3) | 0.894 | 0.352 |
| A | 68 (10.1) | 58 (10.3) | 80 (11.7) | ||
| IKBKG rs2472394 | |||||
| CC | 284 (84.3) | 251 (89.3) | 297 (86.6) | 0.047 | 0.441 |
| AC | 37 (11.0) | 26 (9.3) | 36 (10.5) | ||
| AA | 16 (4.7) | 4 (1.4) | 10 (2.9) | ||
| C | 605 (89.8) | 528 (93.9) | 630 (91.8) | 0.008 | 0.186 |
| A | 69 (10.2) | 34 (6.1) | 56 (8.2) | ||
| Model | Genotype/Allele | OR (95% CI) | p-Value | AIC |
|---|---|---|---|---|
| TAB2 rs237025 | ||||
| Codominant | AG vs. GG AA vs. GG | 1.415 (0.982–2.038) 1.520 (0.950–2.430) | 0.063 0.081 | 851.227 |
| Dominant | AA + AG vs. GG | 1.442 (1.019–2.040) | 0.039 | 849.333 |
| Recessive | AA vs. GG + AG | 1.223 (0.813–1.839) | 0.335 | 852.719 |
| Overdominant | AG vs. GG + AA | 1.208 (0.880–1.659) | 0.243 | 852.284 |
| Additive | A | 1.254 (0.996–1.580) | 0.054 | 849.926 |
| IKBKB rs13278372 | ||||
| Codominant | AC vs. CC AA vs. CC | 1.087 (0.719–1.644) 0.727 (0.127–3.077) | 0.693 0.665 | 855.282 |
| Dominant | AA + AC vs. CC | 1.058 (0.708–1.583) | 0.782 | 853.572 |
| Recessive | AA vs. CC + AC | 0.717 (0.170–3.025) | 0.650 | 853.438 |
| Overdominant | AC vs. CC + AA | 1.092 (0.723–1.651) | 0.675 | 853.473 |
| Additive | A | 1.025 (0.712–1.476) | 0.895 | 853.631 |
| IKBKG rs2472394 | ||||
| Codominant | AC vs. CC AA vs. CC | 0.795 (0.468–1.350) 0.283 (0.093–0.857) | 0.396 0.026 | 849.053 |
| Dominant | AA + AC vs. CC | 0.640 (0.397–1.034) | 0.068 | 850.235 |
| Recessive | AA vs. CC + AC | 0.290 (0.096–0.877) | 0.028 | 847.780 |
| Overdominant | AC vs. CC + AA | 0.827 (0.487–1.403) | 0.480 | 853.147 |
| Additive | A | 0.648 (0.445–0.944) | 0.024 | 848.204 |
| Model | Genotype/Allele | OR * (95% CI) | p-Value | AIC |
|---|---|---|---|---|
| TAB2 rs237025 | ||||
| Codominant | AG vs. GG AA vs. GG | 1.334 (0.929–1.915) 1.650 (1.037–2.624) | 0.118 0.035 | 880.643 |
| Dominant | AA + AG vs. GG | 1.413 (1.003–1.991) | 0.048 | 879.594 |
| Recessive | AA vs. GG + AG | 1.378 (0.919–2.067) | 0.121 | 881.094 |
| Overdominant | AG vs. GG + AA | 1.102 (0.805–1.510) | 0.544 | 883.146 |
| Additive | A | 1.291 (1.027–1.622) | 0.029 | 878.697 |
| IKBKB rs13278372 | ||||
| Codominant | AC vs. CC AA vs. CC | 1.070 (0.712–1.607) 1.155 (0.348–3.836) | 0.746 0.813 | 885.363 |
| Dominant | AA + AC vs. CC | 1.077 (0.727–1.595) | 0.712 | 883.378 |
| Recessive | AA vs. CC + AC | 1.141 (0.344–3.777) | 0.830 | 883.468 |
| Overdominant | AC vs. CC + AA | 1.066 (0.710–1.601) | 0.757 | 883.419 |
| Additive | A | 1.071 (0.757–1.515) | 0.697 | 883.363 |
| IKBKG rs2472394 | ||||
| Codominant | AC vs. CC AA vs. CC | 0.968 (0.579–1.616) 0.476 (0.206–1.103) | 0.900 0.084 | 882.432 |
| Dominant | AA + AC vs. CC | 0.803 (0.513–1.257) | 0.337 | 882.589 |
| Recessive | AA vs. CC + AC | 0.478 (0.207–1.105) | 0.084 | 880.447 |
| Overdominant | AC vs. CC + AA | 0.998 (0.599–1.664) | 0.994 | 883.515 |
| Additive | A | 0.787 (0.565–1.097) | 0.158 | 881.506 |
| Genotype/Allele | Groups | p-Value * | p-Value ** | ||
|---|---|---|---|---|---|
| Control, n (%) | Early AMD, n (%) | Exudative AMD, n (%) | |||
| TAB2 rs237025 | |||||
| GG | 74 (33.9) | 51 (26.2) | 53 (23.8) | 0.220 | 0.055 |
| AG | 106 (48.6) | 104 (53.3) | 121 (54.3) | ||
| AA | 38 (17.4) | 40 (20.5) | 49 (22.0) | ||
| G | 254 (58.3) | 206 (52.8) | 227 (50.9) | 0.116 | 0.028 |
| A | 182 (41.7) | 184 (47.2) | 219 (49.1) | ||
| IKBKB rs13278372 | |||||
| CC | 172 (78.9) | 159 (81.5) | 170 (76.2) | 0.556 | 0.796 |
| AC | 41 (18.8) | 34 (17.4) | 47 (21.1) | ||
| AA | 5 (2.3) | 2 (1.0) | 6 (2.7) | ||
| C | 385 (88.3) | 352 (90.3) | 387 (86.8) | 0.366 | 0.491 |
| A | 51 (11.7) | 38 (9.7) | 59 (13.2) | ||
| IKBKG rs2472394 | |||||
| CC | 178 (81.7) | 168 (86.2) | 184 (82.5) | 0.079 | 0.470 |
| AC | 32 (14.7) | 26 (13.3) | 35 (15.7) | ||
| AA | 8 (3.7) | 1 (0.5) | 4 (1.8) | ||
| C | 388 (89.0) | 362 (92.8) | 403 (90.4) | 0.057 | 0.504 |
| A | 48 (11.0) | 28 (7.2) | 43 (9.6) | ||
| Model | Genotype/Allele | OR (95% CI) | p-Value | AIC |
|---|---|---|---|---|
| TAB2 rs237025 | ||||
| Codominant | AG vs. GG AA vs. GG | 1.424 (0.910–2.227) 1.527 (0.864–2.699) | 0.122 0.145 | 572.213 |
| Dominant | AA + AG vs. GG | 1.451 (0.949–2.219) | 0.086 | 570.283 |
| Recessive | AA vs. GG + AG | 1.222 (0.746–2.002) | 0.425 | 572.621 |
| Overdominant | AG vs. GG + AA | 1.208 (0.820–1.778) | 0.339 | 572.344 |
| Additive | A | 1.256 (0.949–1.663) | 0.112 | 570.711 |
| IKBKB rs13278372 | ||||
| Codominant | AC vs. CC AA vs. CC | 0.897 (0.542–1.484) 0.433 (0.083–2.262) | 0.672 0.321 | 574.046 |
| Dominant | AA + AC vs. CC | 0.847 (0.520–1.377) | 0.502 | 572.806 |
| Recessive | AA vs. CC + AC | 0.441 (0.085–2.302) | 0.332 | 572.226 |
| Overdominant | AC vs. CC + AA | 0.912 (0.552–1.506) | 0.718 | 573.128 |
| Additive | A | 0.824 (0.534–1.270) | 0.380 | 572.480 |
| IKBKG rs2472394 | ||||
| Codominant | AC vs. CC AA vs. CC | 0.861 (0.492–1.505) 0.132 (0.016–1.070) | 0.599 0.058 | 569.431 |
| Dominant | AA + AC vs. CC | 0.715 (0.420–1.217) | 0.217 | 571.712 |
| Recessive | AA vs. CC + AC | 0.135 (0.017–1.092) | 0.060 | 567.708 |
| Overdominant | AC vs. CC + AA | 0.894 (0.512–1.562) | 0.694 | 573.103 |
| Additive | A | 0.665 (0.421–1.051) | 0.081 | 570.085 |
| Model | Genotype/Allele | OR * (95% CI) | p-Value | AIC |
|---|---|---|---|---|
| TAB2 rs237025 | ||||
| Codominant | AG vs. GG AA vs. GG | 1.475 (0.922–2.359) 1.826 (1.003–3.324) | 0.105 0.049 | 549.184 |
| Dominant | AA + AG vs. GG | 1.561 (0.998–2.442) | 0.051 | 547.786 |
| Recessive | AA vs. GG + AG | 1.420 (0.848–2.377) | 0.182 | 549.832 |
| Overdominant | AG vs. GG + AA | 1.158 (0.775–1.731) | 0.474 | 551.112 |
| Additive | A | 1.364 (1.014–1.835) | 0.040 | 547.362 |
| IKBKB rs13278372 | ||||
| Codominant | AC vs. CC AA vs. CC | 1.022 (0.618–1.690) 0.841 (0.238–2.972) | 0.933 0.788 | 553.543 |
| Dominant | AA + AC vs. CC | 1.000 (0.618–1.616) | 0.998 | 551.626 |
| Recessive | AA vs. CC + AC | 0.837 (0.238–2.944) | 0.782 | 551.550 |
| Overdominant | AC vs. CC + AA | 1.028 (0.623–1.696) | 0.914 | 551.614 |
| Additive | A | 0.981 (0.651–1.479) | 0.927 | 551.618 |
| IKBKG rs2472394 | ||||
| Codominant | AC vs. CC AA vs. CC | 1.137 (0.648–1.997) 0.259 (0.072–0.933) | 0.655 0.039 | 548.707 |
| Dominant | AA + AC vs. CC | 0.907 (0.538–1.529) | 0.714 | 551.491 |
| Recessive | AA vs. CC + AC | 0.254 (0.071–0.913) | 0.036 | 544.907 |
| Overdominant | AC vs. CC + AA | 1.185 (0.677–2.073) | 0.552 | 551.272 |
| Additive | A | 0.793 (0.517–1.217) | 0.288 | 550.500 |
| Genotype/Allele | Groups | p-Value * | p-Value ** | ||
|---|---|---|---|---|---|
| Control, n (%) | Early AMD, n (%) | Exudative AMD, n (%) | |||
| TAB2 rs237025 | |||||
| GG | 42 (35.3) | 24 (27.9) | 39 (32.5) | 0.530 | 0.706 |
| AG | 58 (48.7) | 46 (53.5) | 57 (47.5) | ||
| AA | 19 (16.0) | 16 (18.6) | 24 (20.0) | ||
| G | 142 (59.7) | 94 (54.7) | 135 (56.3) | 0.311 | 0.450 |
| A | 96 (40.3) | 78 (45.3) | 105 (43.7) | ||
| IKBKB rs13278372 | |||||
| CC | 102 (85.7) | 67 (77.9) | 100 (83.3) | 0.218 | 0.569 |
| AC | 17 (14.3) | 18 (20.9) | 19 (15.8) | ||
| AA | 0 (0) | 1 (1.2) | 1 (0.8) | ||
| C | 221 (92.9) | 152 (88.4) | 219 (91.3) | 0.118 | 0.516 |
| A | 17 (7.1) | 20 (12.6) | 21 (8.7) | ||
| IKBKG rs2472394 | |||||
| CC | 106 (89.1) | 83 (96.5) | 113 (94.2) | 0.087 | 0.205 |
| AC | 5 (4.2) | 0 (0) | 1 (0.8) | ||
| AA | 8 (6.7) | 3 (3.5) | 6 (5.0) | ||
| C | 217 (91.2) | 166 (96.5) | 227 (94.6) | 0.032 | 0.147 |
| A | 21 (8.8) | 6 (3.5) | 13 (5.4) | ||
| Model | Genotype/Allele | OR (95% CI) | p-Value | AIC |
|---|---|---|---|---|
| TAB2 rs237025 | ||||
| Codominant | AG vs. GG AA vs. GG | 1.388 (0.737–2.615) 1.474 (0.641–3.390) | 0.310 0.362 | 281.573 |
| Dominant | AA + AG vs. GG | 1.409 (0.771–2.575) | 0.265 | 279.597 |
| Recessive | AA vs. GG + AG | 1.203 (0.579–2.501) | 0.621 | 280.611 |
| Overdominant | AG vs. GG + AA | 1.209 (0.694–2.108) | 0.502 | 280.404 |
| Additive | A | 1.238 (0.825–1.858) | 0.302 | 279.787 |
| IKBKB rs13278372 | ||||
| Codominant | AC vs. CC AA vs. CC | 1.612 (0.776–3.348) - | 0.201 - | 279.474 |
| Dominant | AA + AC vs. CC | 1.701 (0.825–3.507) | 0.150 | 278.778 |
| Recessive | AA vs. CC + AC | - | - | - |
| Overdominant | AC vs. CC + AA | 1.588 (0.765–3.297) | 0.214 | 279.316 |
| Additive | A | 1.754 (0.873–3.523) | 0.114 | 278.337 |
| IKBKG rs2472394 | ||||
| Codominant | AC vs. CC AA vs. CC | - 0.479 (0.123–1.862) | - 0.288 | 276.095 |
| Dominant | AA + AC vs. CC | 0.295 (0.081–1.068) | 0.063 | 276.646 |
| Recessive | AA vs. CC + AC | 0.502 (0.129–1.948) | 0.319 | 279.777 |
| Overdominant | AC vs. CC + AA | - | - | - |
| Additive | A | 0.575 (0.284–1.163) | 0.123 | 278.081 |
| Model | Genotype/Allele | OR * (95% CI) | p-Value | AIC |
|---|---|---|---|---|
| TRADD rs868213 | ||||
| Codominant | AG vs. AA GG vs. AA | 0.371 (0.177–0.776) - | 0.009 - | 320.714 |
| Dominant | GG + AG vs. AA | 0.341 (0.164–0.709) | 0.004 | 320.312 |
| Recessive | GG vs. AA + AG | - | - | - |
| Overdominant | AG vs. AA + GG | 0.381 (0.182–0.798) | 0.011 | 322.319 |
| Additive | G | 0.344 (0.170–0.697) | 0.003 | 319.347 |
| TAB2 rs237025 | ||||
| Codominant | AG vs. GG AA vs. GG | 1.094 (0.616–1.942) 1.381 (0.654–2.918) | 0.759 0.397 | 330.592 |
| Dominant | AA + AG vs. GG | 1.166 (0.679–2.003) | 0.578 | 329.009 |
| Recessive | AA vs. GG + AG | 1.310 (0.672–2.555) | 0.428 | 328.687 |
| Overdominant | AG vs. GG + AA | 0.978 (0.586–1.632) | 0.932 | 329.312 |
| Additive | A | 1.162 (0.807–1.673) | 0.419 | 328.664 |
| IKBKB rs13278372 | ||||
| Codominant | AC vs. CC AA vs. CC | 1.118 (0.547–2.282) - | 0.760 - | 329.589 |
| Dominant | AA + AC vs. CC | 1.186 (0.585–2.403) | 0.636 | 329.095 |
| Recessive | AA vs. CC + AC | - | - | - |
| Overdominant | AC vs. CC + AA | 1.106 (0.542–2.257) | 0.782 | 329.243 |
| Additive | A | 1.250 (0.634–2.465) | 0.519 | 328.901 |
| IKBKG rs2472394 | ||||
| Codominant | AC vs. CC AA vs. CC | 0.153 (0.017–1.364) 0.729 (0.242–2.196) | 0.093 0.574 | 327.207 |
| Dominant | AA + AC vs. CC | 0.488 (0.186–1.282) | 0.145 | 327.101 |
| Recessive | AA vs. CC + AC | 0.758 (0.252–2.278) | 0.058 | 329.073 |
| Overdominant | AC vs. CC + AA | 0.156 (0.017–1.387) | 0.096 | 325.526 |
| Additive | A | 0.746 (0.434–1.280) | 0.287 | 328.150 |
| Characteristic | Non-Responders n = 22 | Responders n = 86 | p-Value | |
|---|---|---|---|---|
| Gender | Females, n (%) | 14 (63.6) | 58 (67.4) | 0.735 * |
| Males, n (%) | 8 (36.4) | 28 (32.6) | ||
| Age years; mean (SD) | 75.91 (7.64) | 77.12 (8.28) | 0.537 ** | |
| Response parameter | ||||
| VA, median (IQR) | ||||
| Before treatment | 0.18 (0.32) 1 | 0.35 (0.25) 3 | 0.074 *** | |
| After 3 months | 0.21 (0.37) 1 | 0.30 (0.33) 3 | 0.092 *** | |
| After 6 months | 0.21 (0.29) 1 | 0.35 (0.35) 3 | 0.029 *** | |
| CMT (μm), median (IQR) | ||||
| Before treatment | 410 (174.5) 2 | 298 (101.75) 4 | <0.001 *** | |
| After 3 months | 282 (107.5) 2 | 262 (84.0) 4 | 0.411 *** | |
| After 6 months | 279 (109.25) 2 | 273 (87.0) 4 | 0.771 *** | |
| Genetic Model | Genotype/Allele | Non-Responders n = 22 | Responders n = 86 | OR (95% CI) | p-Value | AIC |
|---|---|---|---|---|---|---|
| TAB2 rs237025 | ||||||
| Codominant | AG vs. GG AA vs. GG | 12 (54.5) 3 (13.6) | 44 (51.2) 25 (29.1) | 1.510 (0.509–4.478) 3.431 (0.776–15.168) | 0.458 0.104 | 110.236 |
| Dominant | AA + AG vs. GG | 15 (68.1) | 69 (80.2) | 1.894 (0.668–5.372) | 0.230 | 109.804 |
| Recessive | AA vs. GG + AG | 7 (31.8) | 17 (19.8) | 2.596 (0.705–9.558) | 0.152 | 108.777 |
| Overdominant | AG vs. GG + AA | 12 (54.5) | 44 (51.2) | 0.873 (0.341–2.234) | 0.777 | 111.106 |
| Additive | A | 15 (68.1) | 69 (80.3) | 1.794 (0.892–3.610) | 0.101 | 108.404 |
| IKBKB rs13278372 | ||||||
| Codominant | AC vs. CC AA vs. CC | 4 (18.2) 2 (9.1) | 12 (14.0) - | 0.649 (0.185–2.273) - | 0.499 - | 106.236 |
| Dominant | AA + AC vs. CC | 6 (27.3) | 12 (14.0) | 0.432 (0.141–1.324) | 0.142 | 109.156 |
| Recessive | AA vs. CC + AC | 2 (9.1) | - | - | - | - |
| Overdominant | AC vs. CC + AA | 4 (18.2) | 12 (14.0) | 0.730 (0.210–2.530) | 0.619 | 110.949 |
| Additive | A | 6 (27.3) | 12 (14.0) | 0.347 (0.145–0.961) | 0.041 | 107.153 |
Disclaimer/Publisher’s Note: The statements, opinions and data contained in all publications are solely those of the individual author(s) and contributor(s) and not of MDPI and/or the editor(s). MDPI and/or the editor(s) disclaim responsibility for any injury to people or property resulting from any ideas, methods, instructions or products referred to in the content. |
© 2024 by the authors. Published by MDPI on behalf of the Lithuanian University of Health Sciences. Licensee MDPI, Basel, Switzerland. This article is an open access article distributed under the terms and conditions of the Creative Commons Attribution (CC BY) license (https://creativecommons.org/licenses/by/4.0/).
Share and Cite
Vilkeviciute, A.; Pileckaite, E.; Bruzaite, A.; Cebatoriene, D.; Gedvilaite-Vaicechauskiene, G.; Kriauciuniene, L.; Zaliuniene, D.; Liutkeviciene, R. Evaluating TAB2, IKBKB, and IKBKG Gene Polymorphisms and Serum Protein Levels and Their Association with Age-Related Macular Degeneration and Its Treatment Efficiency. Medicina 2024, 60, 2072. https://doi.org/10.3390/medicina60122072
Vilkeviciute A, Pileckaite E, Bruzaite A, Cebatoriene D, Gedvilaite-Vaicechauskiene G, Kriauciuniene L, Zaliuniene D, Liutkeviciene R. Evaluating TAB2, IKBKB, and IKBKG Gene Polymorphisms and Serum Protein Levels and Their Association with Age-Related Macular Degeneration and Its Treatment Efficiency. Medicina. 2024; 60(12):2072. https://doi.org/10.3390/medicina60122072
Chicago/Turabian StyleVilkeviciute, Alvita, Enrika Pileckaite, Akvile Bruzaite, Dzastina Cebatoriene, Greta Gedvilaite-Vaicechauskiene, Loresa Kriauciuniene, Dalia Zaliuniene, and Rasa Liutkeviciene. 2024. "Evaluating TAB2, IKBKB, and IKBKG Gene Polymorphisms and Serum Protein Levels and Their Association with Age-Related Macular Degeneration and Its Treatment Efficiency" Medicina 60, no. 12: 2072. https://doi.org/10.3390/medicina60122072
APA StyleVilkeviciute, A., Pileckaite, E., Bruzaite, A., Cebatoriene, D., Gedvilaite-Vaicechauskiene, G., Kriauciuniene, L., Zaliuniene, D., & Liutkeviciene, R. (2024). Evaluating TAB2, IKBKB, and IKBKG Gene Polymorphisms and Serum Protein Levels and Their Association with Age-Related Macular Degeneration and Its Treatment Efficiency. Medicina, 60(12), 2072. https://doi.org/10.3390/medicina60122072