
Doppler Indices of the Uterine, Umbilical and Fetal Middle Cerebral Artery in Diabetic versus Non-Diabetic Pregnancy: Systematic Review and Meta-Analysis

 , ,
, ,  ,
, 
 , ,
, ,  ,
,
Abstract
:1. Introduction
2. Materials and Methods
2.1. Study Design
2.2. Eligibility Criteria
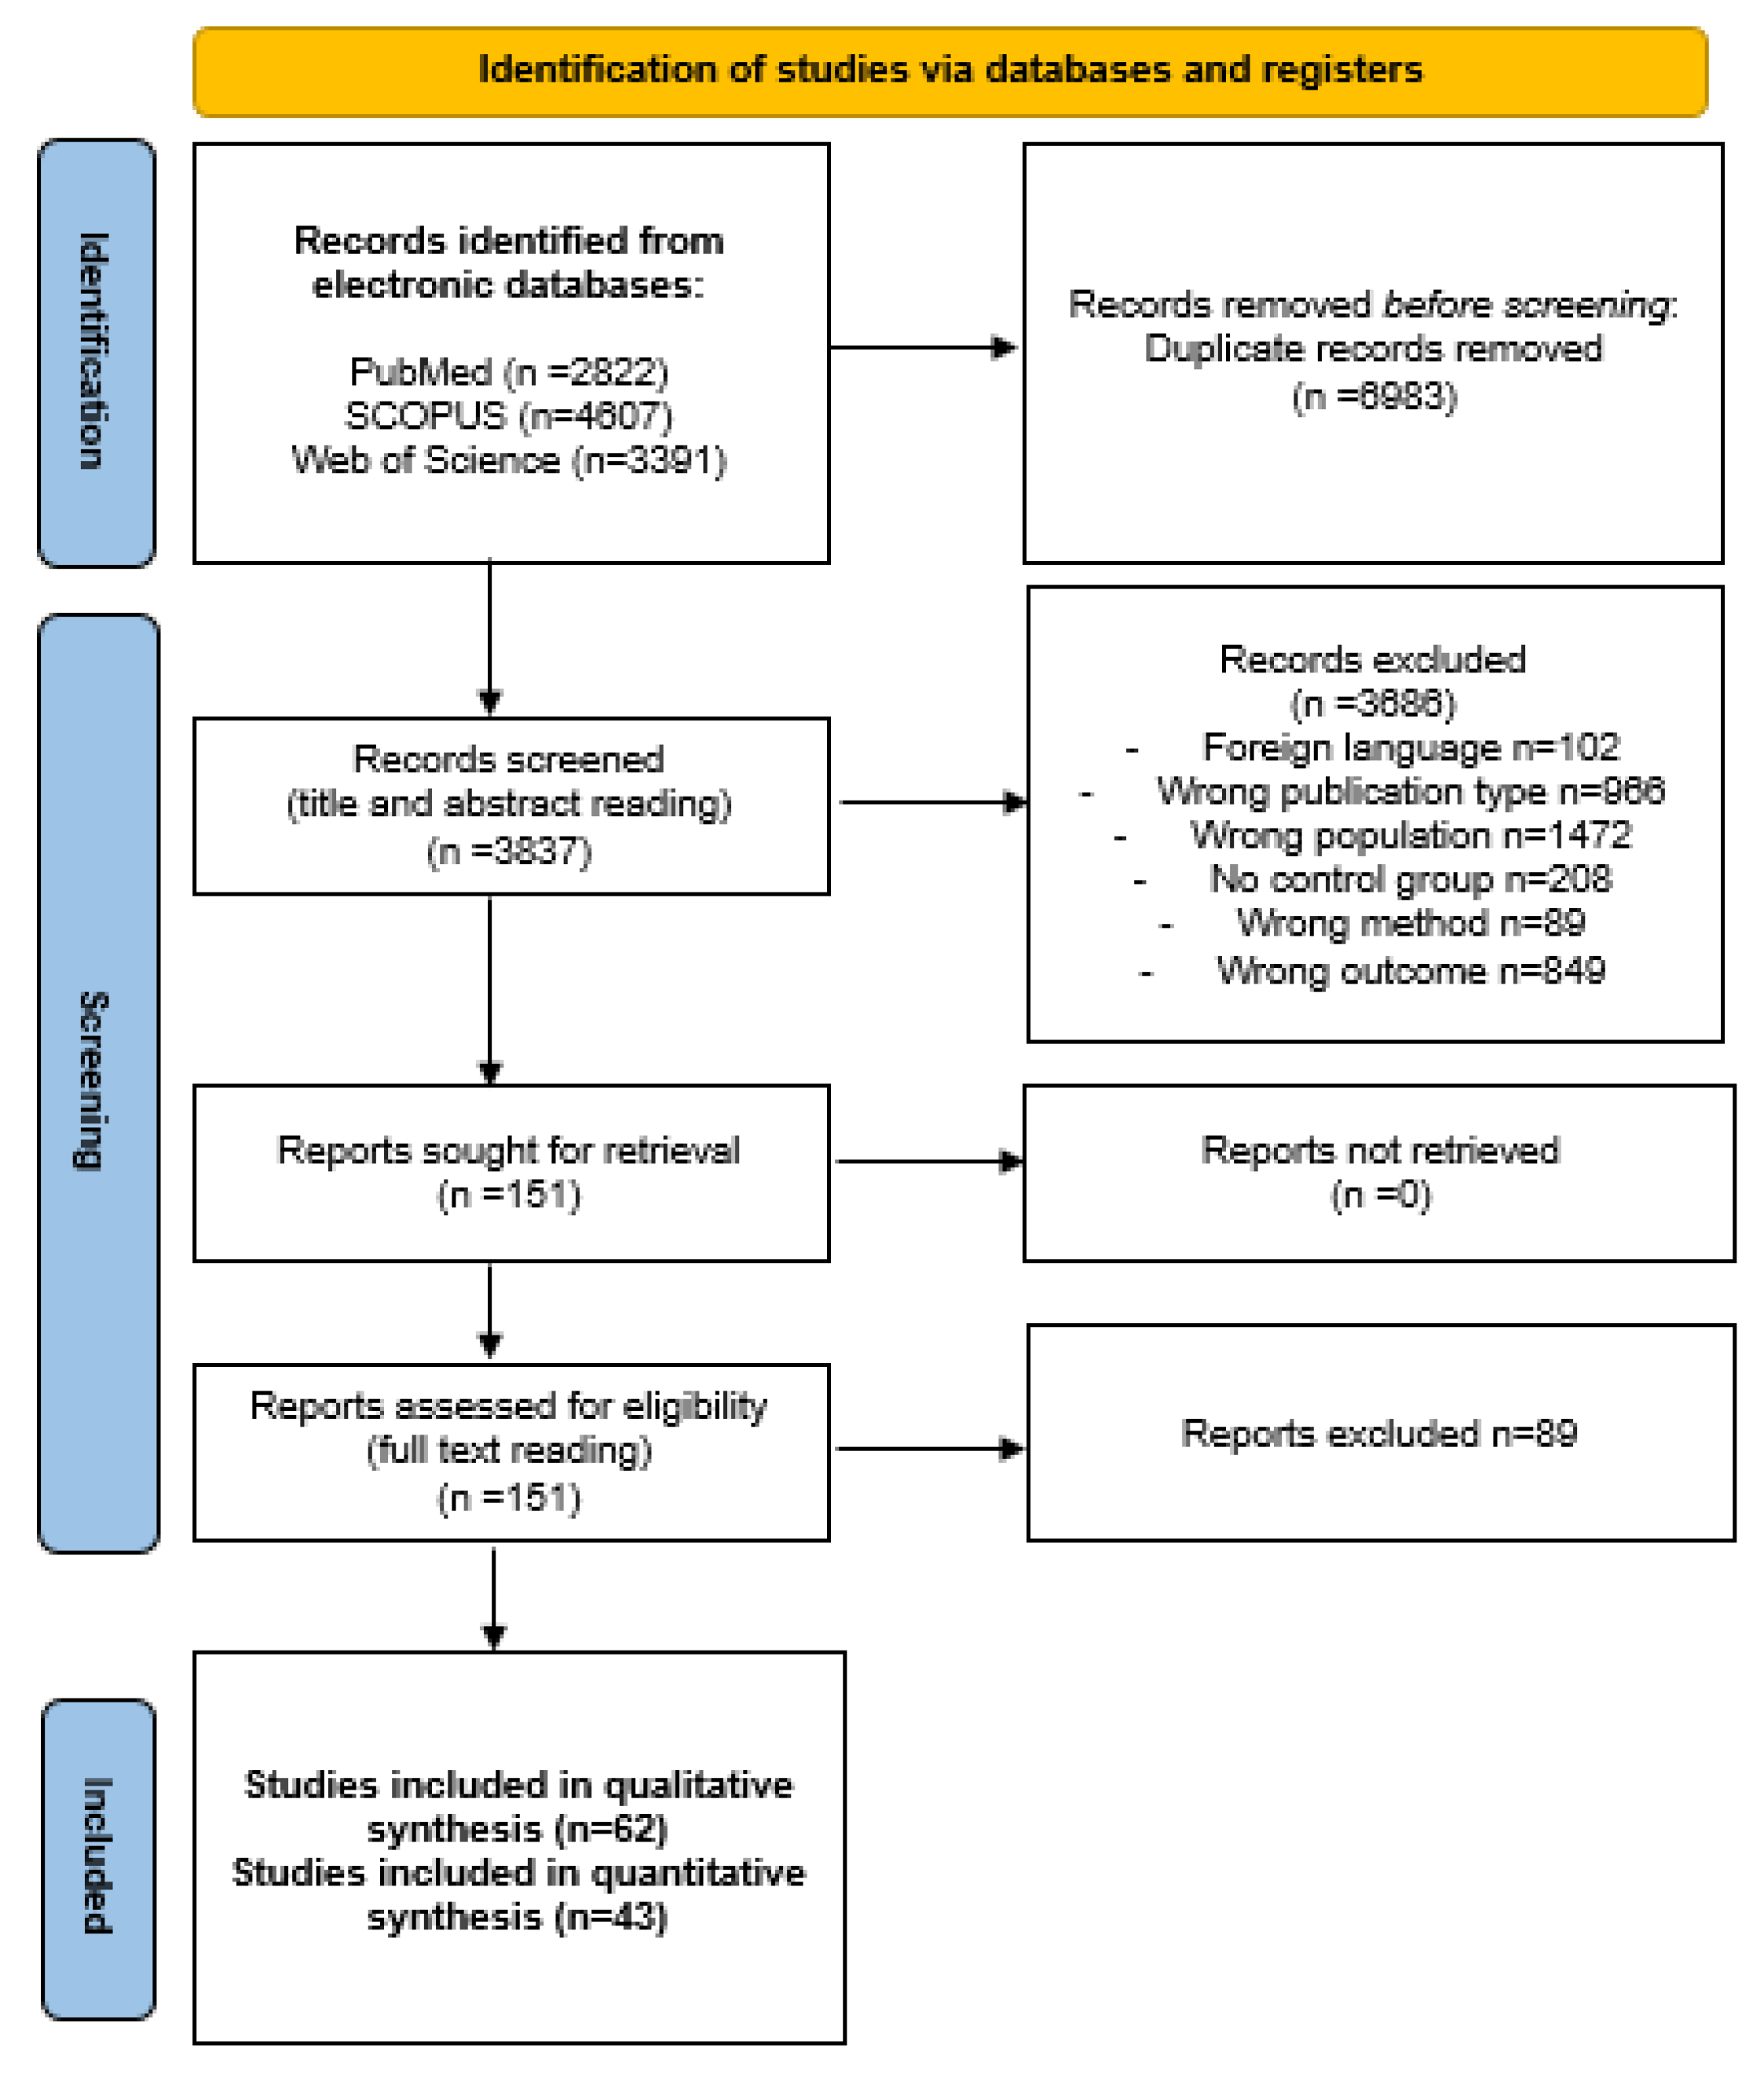
2.3. Article Screening and Selection
2.4. Data Abstraction and Quality Assessment
2.5. Statistical Analysis
3. Results
3.1. Systematic Review
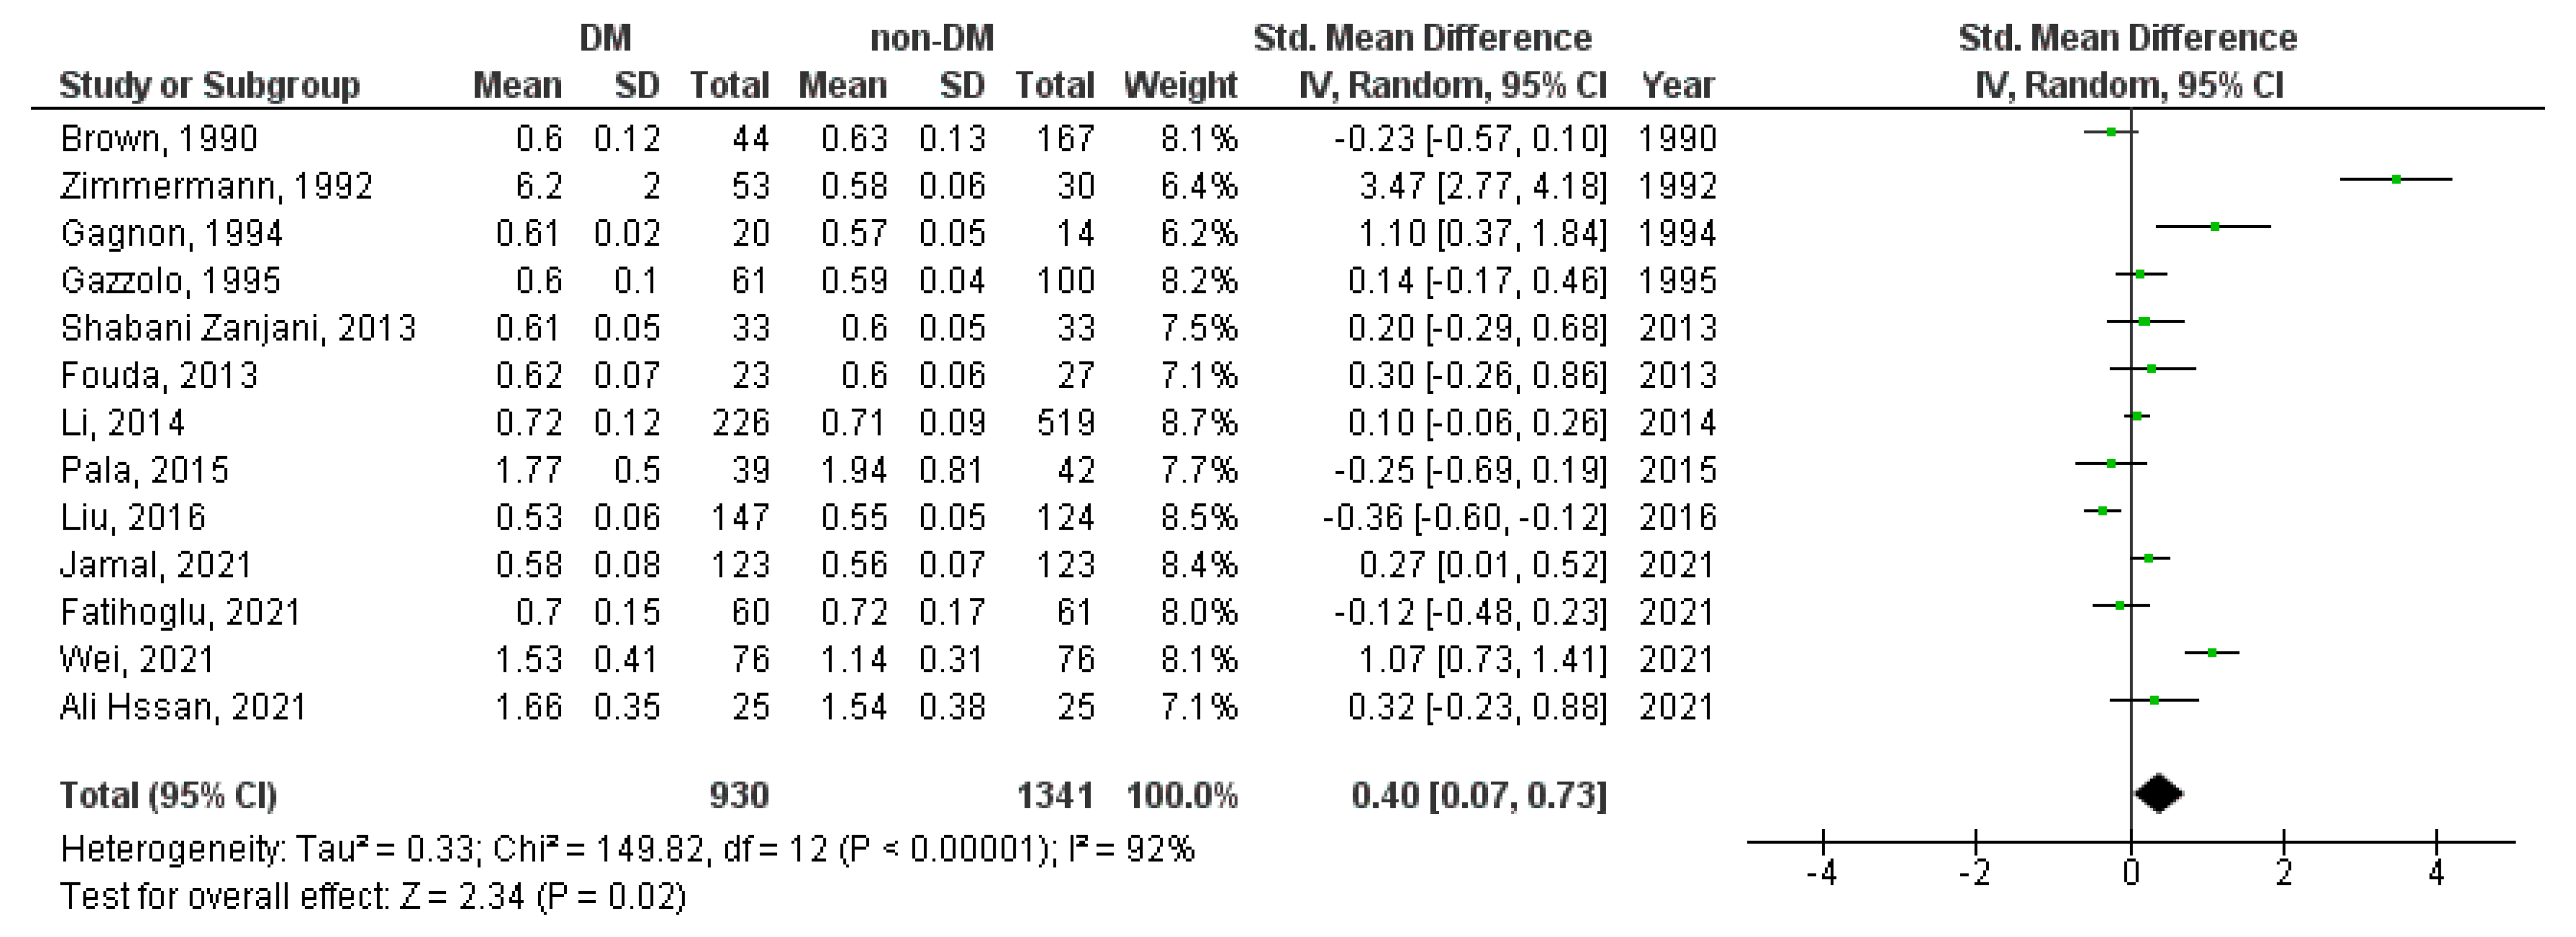
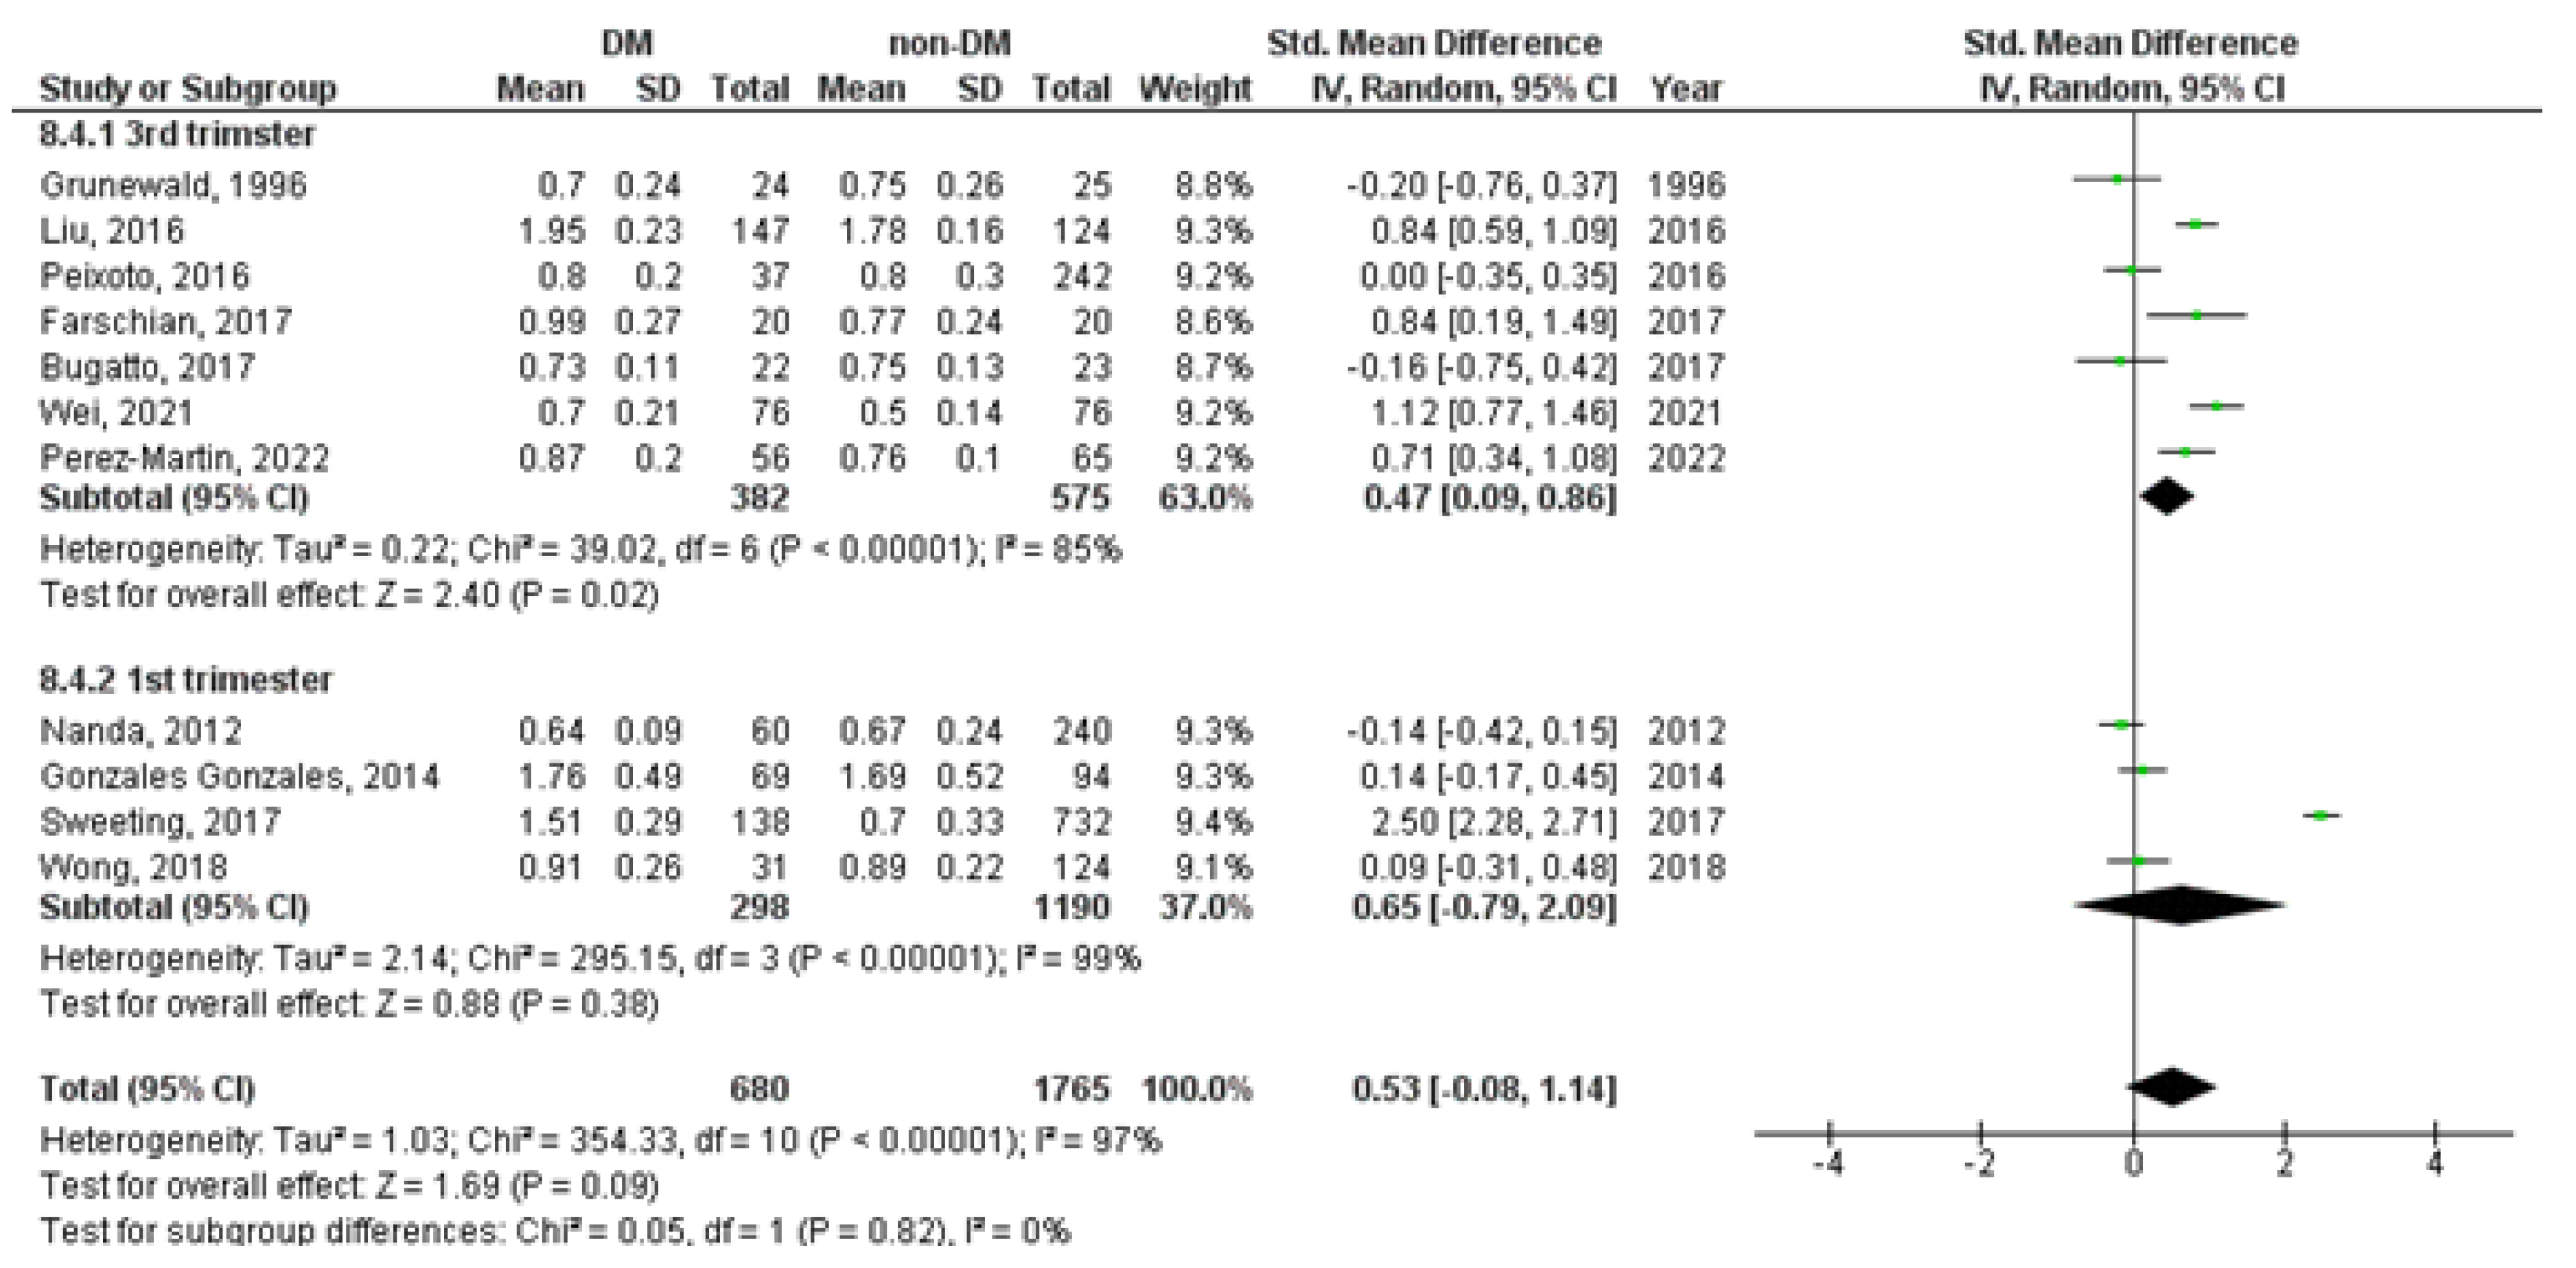
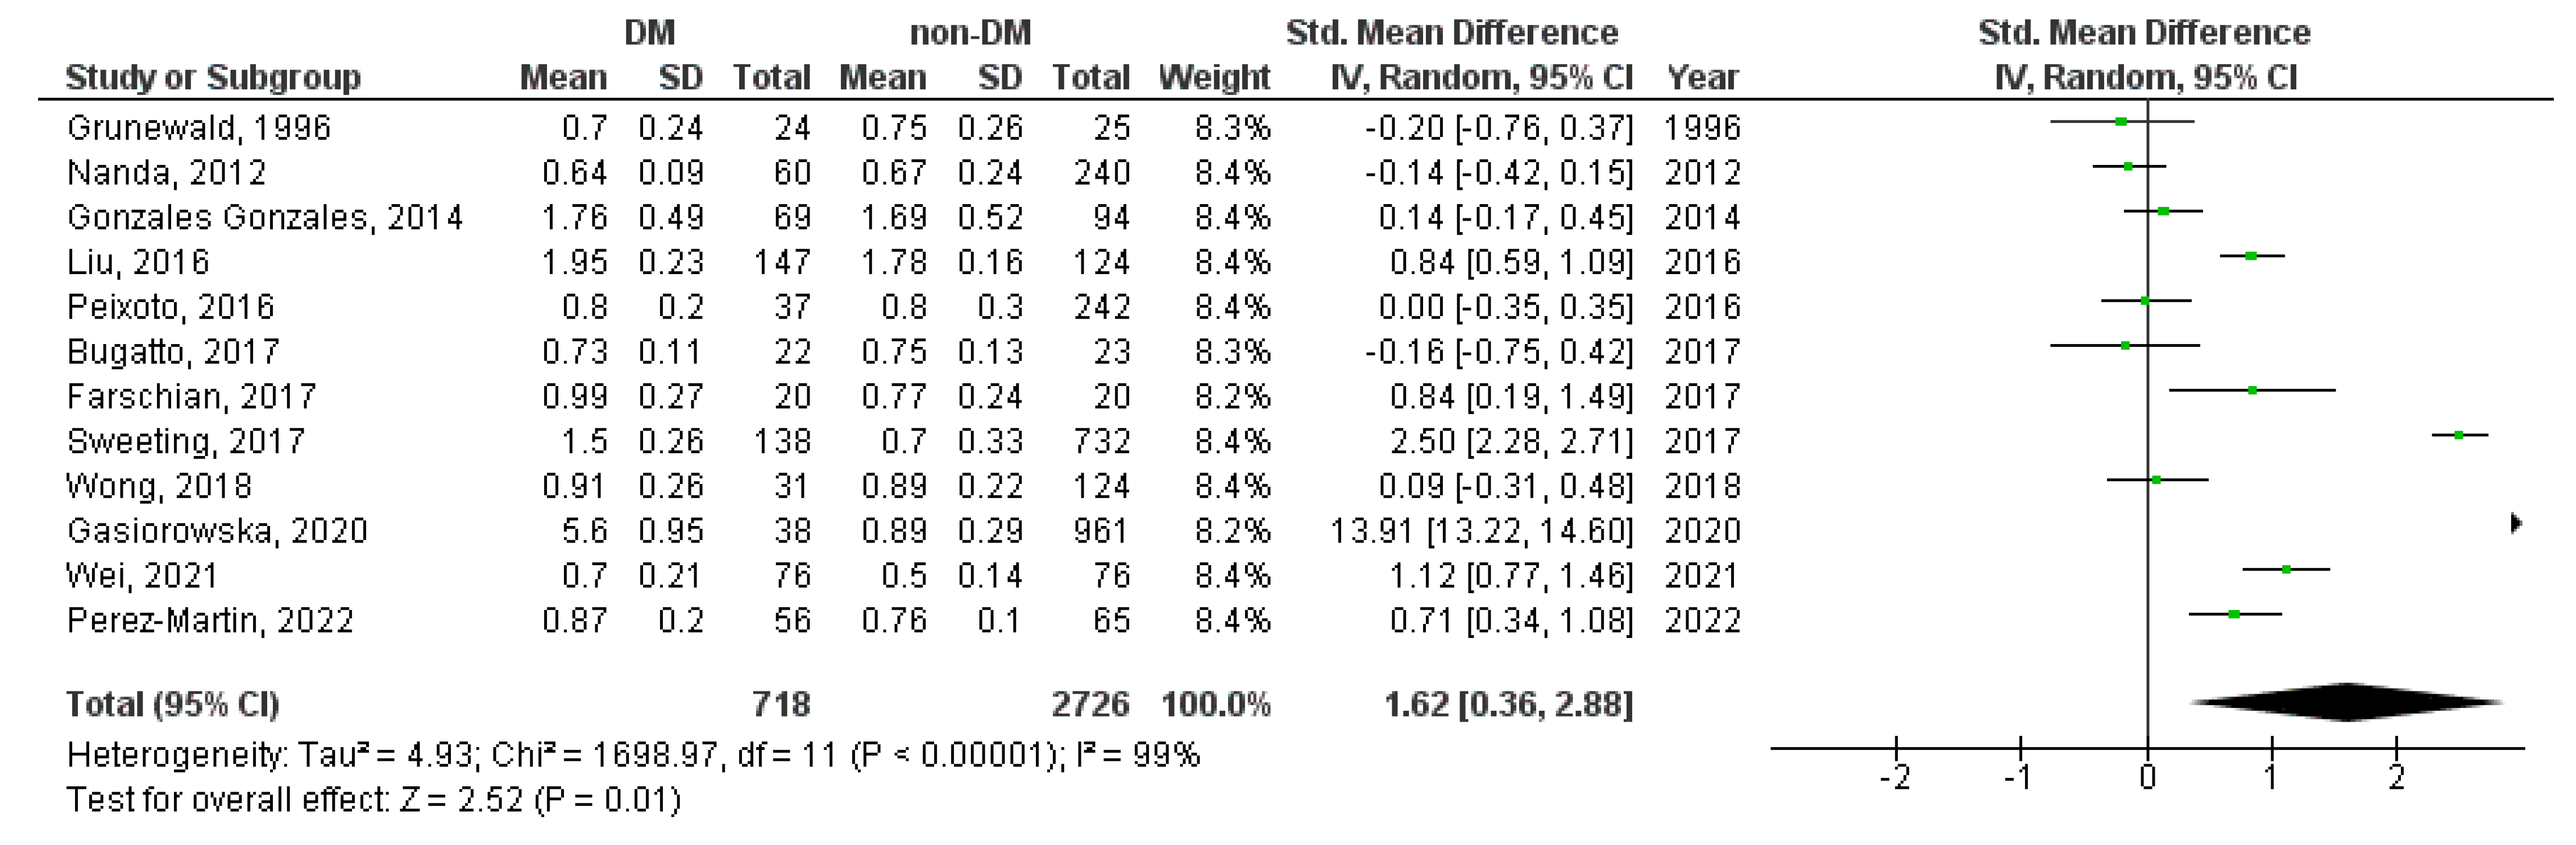
3.2. Meta-Analysis
4. Discussion
5. Conclusions
Supplementary Materials
Author Contributions
Funding
Institutional Review Board Statement
Informed Consent Statement
Data Availability Statement
Conflicts of Interest
References
- Farrar, D.; Simmonds, M.; Bryant, M.; Sheldon, T.A.; Tuffnell, D.; Golder, S.; Dunne, F.; Lawlor, D.A. Hyperglycaemia and Risk of Adverse Perinatal Outcomes: Systematic Review and Meta-Analysis. BMJ 2016, 354, i4694. [Google Scholar] [PubMed]
- Franzago, M.; Fraticelli, F.; Stuppia, L.; Vitacolonna, E. Nutrigenetics, Epigenetics and Gestational Diabetes: Consequences in Mother and Child. Epigenetics 2019, 14, 215–235. [Google Scholar] [CrossRef] [PubMed]
- Turkmen, S.; Johansson, S.; Dahmoun, M. Foetal Macrosomia and Foetal-Maternal Outcomes at Birth. J. Pregnancy 2018, 2018, 4790136. [Google Scholar] [CrossRef] [PubMed]
- Ye, W.; Luo, C.; Huang, J.; Li, C.; Liu, Z.; Liu, F. Gestational Diabetes Mellitus and Adverse Pregnancy Outcomes: Systematic Review and Meta-Analysis. BMJ 2022, 377, e067946. [Google Scholar]
- Hochberg, A.; Pardo, A.; Oron, G.; Krispin, E.; Amikam, U.; Wiznitzer, A.; Hadar, E.; Salman, L. Perinatal Outcome Following Induction of Labor in Patients with Good Glycemic Controlled Gestational Diabetes: Does Timing Matter? Arch. Gynecol. Obstet. 2019, 300, 299–303. [Google Scholar] [PubMed]
- Melamed, N.; Ray, J.G.; Geary, M.; Bedard, D.; Yang, C.; Sprague, A.; Murray-Davis, B.; Barrett, J.; Berger, H. Induction of Labor before 40 Weeks Is Associated with Lower Rate of Cesarean Delivery in Women with Gestational Diabetes Mellitus. Am. J. Obstet. Gynecol. 2016, 214, e1–e364. [Google Scholar]
- MacDonald, S.C.; Bodnar, L.M.; Himes, K.P.; Hutcheon, J.A. Patterns of Gestational Weight Gain in Early Pregnancy and Risk of Gestational Diabetes Mellitus. Epidemiology 2017, 28, 419–427. [Google Scholar] [CrossRef]
- Glazer, N.L.; Hendrickson, A.F.; Schellenbaum, G.D.; Mueller, B.A. Weight change and the risk of gestational diabetes in obese women. Epidemiology 2004, 15, 733–737. [Google Scholar] [CrossRef]
- Zhao, Z.; Reece, E.A. New Concepts in Diabetic Embryopathy. Clin. Lab. Med. 2013, 33, 207–233. [Google Scholar]
- Kallem, V.R.; Pandita, A.; Pillai, A. Infant of Diabetic Mother: What One Needs to Know? J. Matern.-Fetal Neonatal Med. 2020, 33, 482–492. [Google Scholar]
- Malaza, N.; Masete, M.; Adam, S.; Dias, S.; Nyawo, T.; Pheiffer, C. A Systematic Review to Compare Adverse Pregnancy Outcomes in Women with Pregestational Diabetes and Gestational Diabetes. Int. J. Environ. Res. Public Health 2022, 19, 10846. [Google Scholar] [CrossRef] [PubMed]
- Mistry, S.K.; Das Gupta, R.; Alam, S.; Kaur, K.; Shamim, A.A.; Puthussery, S. Gestational Diabetes Mellitus (GDM) and Adverse Pregnancy Outcome in South Asia: A Systematic Review. Endocrinol. Diabetes Metab. 2021, 4, e00285. [Google Scholar] [PubMed]
- Coustan, D.R. Gestational Diabetes Mellitus. Clin. Chem. 2013, 59, 1310–1321. [Google Scholar]
- Plows, J.F.; Stanley, J.L.; Baker, P.N.; Reynolds, C.M.; Vickers, M.H. The Pathophysiology of Gestational Diabetes Mellitus. Int. J. Mol. Sci. 2018, 19, 3342. [Google Scholar] [CrossRef]
- Allen, R.E.; Morlando, M.; Thilaganathan, B.; Zamora, J.; Khan, K.S.; Thangaratinam, S.; Bhide, A. Predictive Accuracy of Second-Trimester Uterine Artery Doppler Indices for Stillbirth: A Systematic Review and Meta-Analysis. Ultrasound Obstet. Gynecol. 2016, 47, 22–27. [Google Scholar] [PubMed]
- La Verde, M.; Torella, M.; Ronsini, C.; Riemma, G.; Cobellis, L.; Marrapodi, M.M.; Capristo, C.; Rapisarda, A.M.C.; Morlando, M.; De Franciscis, P. The association between fetal Doppler and uterine artery blood volume flow at term of pregnancy: A pilot study. Ultraschall Med. 2023. epub ahead of print. [Google Scholar] [CrossRef]
- Jaiman, S.; Romero, R.; Pacora, P.; Erez, O.; Jung, E.; Tarca, A.L.; Bhatti, G.; Yeo, L.; Kim, Y.M.; Kim, C.J.; et al. Disorders of Placental Villous Maturation Are Present in One-Third of Cases with Spontaneous Preterm Labor. J. Perinat. Med. 2021, 49, 412–430. [Google Scholar]
- Wei, Z.; Mu, M.; Li, M.; Li, J.; Cui, Y. Color Doppler Ultrasound Detection of Hemodynamic Changes in Pregnant Women with GDM and Analysis of Their Influence on Pregnancy Outcomes. Am. J. Transl. Res. 2021, 13, 3330–3336. [Google Scholar]
- Ornoy, A.; Becker, M.; Weinstein-Fudim, L.; Ergaz, Z. Diabetes during Pregnancy: A Maternal Disease Complicating the Course of Pregnancy with Long-Term Deleterious Effects on the Offspring. A Clinical Review. Int. J. Mol. Sci. 2021, 22, 2965. [Google Scholar]
- Schierz, I.A.M.; Pinello, G.; Piro, E.; Giuffrè, M.; La Placa, S.; Corsello, G. Transitional Hemodynamics in Infants of Diabetic Mothers by Targeted Neonatal Echocardiography, Electrocardiography and Peripheral Flow Study. J. Matern. Neonatal Med. 2018, 31, 1578–1585. [Google Scholar]
- Shabani Zanjani, M.; Nasirzadeh, R.; Fereshtehnejad, S.M.; Yoonesi Asl, L.; Alemzadeh, S.A.P.; Askari, S. Fetal Cerebral Hemodynamic in Gestational Diabetic versus Normal Pregnancies: A Doppler Velocimetry of Middle Cerebral and Umbilical Arteries. Acta Neurol. Belg. 2014, 114, 15–23. [Google Scholar] [PubMed]
- Ciobanu, A.; Wright, A.; Syngelaki, A.; Wright, D.; Akolekar, R.; Nicolaides, K.H. Fetal Medicine Foundation Reference Ranges for Umbilical Artery and Middle Cerebral Artery Pulsatility Index and Cerebroplacental Ratio. Ultrasound Obstet. Gynecol. 2019, 53, 465–472. [Google Scholar] [PubMed]
- Altorjay, Á.T.; Surányi, A.; Nyári, T.; Németh, G. Use of Placental Vascularization Indices and Uterine Artery Peak Systolic Velocity in Early Detection of Pregnancies Complicated by Gestational Diabetes, Chronic or Gestational Hypertension, and Preeclampsia at Risk. Croat. Med. J. 2017, 58, 161–169. [Google Scholar] [CrossRef]
- Liberati, A.; Altman, D.G.; Tetzlaff, J.; Mulrow, C.; Gøtzsche, P.C.; Ioannidis, J.P.A.; Clarke, M.; Devereaux, P.J.; Kleijnen, J.; Moher, D. The PRISMA Statement for Reporting Systematic Reviews and Meta-Analyses of Studies That Evaluate Health Care Interventions: Explanation and Elaboration. PLoS Med. 2009, 6, e1000100. [Google Scholar] [CrossRef]
- Stroup, D.F.; Berlin, J.A.; Morton, S.C.; Olkin, I.; Williamson, G.D.; Rennie, D.; Moher, D.; Becker, B.J.; Sipe, T.A.; Thacker, S.B. Meta-Analysis of Observational Studies in Epidemiology: A Proposal for Reporting. Meta-Analysis of Observational Studies in Epidemiology (MOOSE) Group. JAMA 2000, 283, 2008–2012. [Google Scholar] [CrossRef] [PubMed]
- Wells, G.A.; Shea, B.; O’Connell, D.; Peterson, J.; Welch, V.; Losos, M.; Tugwell, P. The Newcastle-Ottawa Scale (NOS) for Assessing the Quality of Nonrandomised Studies in Meta-Analyses; Ottawa Hospital Research Institute: Ottawa, ON, Canada, 2014. [Google Scholar]
- Weichert, A.; Hagen, A.; Tchirikov, M.; Fuchs, I.B.; Henrich, W.; Entezami, M. Reference Curve for the Mean Uterine Artery Pulsatility Index in Singleton Pregnancies. Geburtshilfe Frauenheilkd. 2017, 77, 516–523. [Google Scholar] [PubMed]
- Higgins, J.P.; Thomas, J.; Chandler, J.; Cumpston, M.; Li, T.; Page, M.J.; Welch, V.A. Cochrane Handbook for Systematic Reviews of Interventions; John Wiley & Sons: Hoboken, NJ, USA, 2019; ISBN 9780470699515. [Google Scholar]
- Olofsson, P.; Lingman, G.; Marsal, K.; Sjoberg, N.-O. Fetal Blood Flow in Diabetic Pregnancy 545 Fetal Blood Flow in Diabetic Pregnancy. J. Perinat. Med. 1987, 15, 545. [Google Scholar] [CrossRef] [PubMed]
- Landon, M.; Gabbe, S.; Bruner, J.; Ludmir, J. Doppler Umbilical Artery Velocimetry in Pregnancy Complicated by Insulin-Dependent Diabetes Mellitus. Obstet. Gynecol. 1989, 73, 961–965. [Google Scholar]
- Friedman, D.M.; Ehrlich, P.; Hoskins, I.A. Umbilical Artery Doppler Blood Velocity Waveforms in Normal and Abnormal Gestations. J. Ultrasound Med. 1989, 8, 375–380. [Google Scholar] [CrossRef]
- Brown, M.A.; Northz, L.; Hargoodl, J. Uteroplacental Doppler Ultrasound in Routine Antenatal Care. Aust. N. Z. J. Obstet. Gynaecol. 1990, 30, 303–307. [Google Scholar] [CrossRef]
- Johnstone, F.; Steel, J.; Haddad, N.; Hoskins, P.; Greer, I.; Chambers, S. Doppler Umbilical Artery Flow Velocity Waveforms in Diabetic Pregnancy. Br. J. Obstet. Gynaecol. 1992, 99, 135–140. [Google Scholar] [PubMed]
- Zimmermann, P.; Kujansuu, E.; Tuimala, R. Doppler Velocimetry of the Umbilical Artery in Pregnancies Complicated by Insulin-Dependent Diabetes Mellitus. Eur. J. Obstet. Gynecol. Reprod. Biol. 1992, 47, 85–93. [Google Scholar] [CrossRef] [PubMed]
- Pachi, A.; Maggi, E.; Ferrero, A.; Giancotti, A.; Marceca, M.; Matone, M.; Castelli, R. Umbilical Artery Blood Flow in Pregnancies Complicated by Insulin-Dependent Diabetes Mellitus. J. Obstet. Gynaecol. 1993, 13, 423–427. [Google Scholar] [CrossRef]
- Gagnon, R.; Tevaarwerk, G.; Hunse, C.; Connors, G. Longitudinal Doppler Ultrasound Assessment of Fetal Circulation in Diabetic Pregnancies in Relation to Maternal Glycemic Control. J. Matern.-Fetal Med. 1994, 3, 1–8. [Google Scholar] [CrossRef]
- Weber, H.S.; Botti, J.J.; Baylen, B.G.; Weber, H.S. Pediatric Cardiology Sequential Longitudinal Evaluation of Cardiac Growth and Ventricular Diastolic Filling in Fetuses of Well Controlled Diabetic Mothers. Pediatr. Cardiol. 1994, 15, 184–189. [Google Scholar] [CrossRef] [PubMed]
- Santolaya, J.; Kahn, D.; Nobles, G.; Ramakrishnan, V.; Warsof, S. Ultrasonographic Growth and Doppler Hemodynamic Evaluation of Fetuses of Obese Women. J. Reprod. Med. 1994, 39, 690–694. [Google Scholar]
- Gazzolo, D.; Scopes, F.; Russo, A.; Camorlano, R.; Santl, F.; Vlsser, G.; Bruschettlnl, P. Doppler Velocimetry and Behavioural State Development in Relation to Perinatal Outcome in Pregnancies Complicated by Gestational Diabetes. Early Hum. Dev. 1995, 41, 193–201. [Google Scholar] [CrossRef]
- Saldeen, P.; Olofsson, P.; Parhar, R.S.; AI-Sedairy, S. Prostanoid Production in Umbilical Vessels and Its Relation to Glucose Tolerance and Umbilical Artery Flow Resistance. Eur. J. Obstet. Gynecol. Reprod. Biol. 1996, 68, 35–41. [Google Scholar] [CrossRef]
- Grunewald, C.; Divon, M.; Lunell, N.O. Doppler Velocimetry in Last Trimester Pregnancy Complicated by Insulin-Dependent Diabetes Mellitus. Acta Obstet. Gynecol. Scand. 1996, 75, 804–808. [Google Scholar] [CrossRef]
- Weiner, Z.; Thaler, I.; Farmakides, G.; Barnhard, Y.; Maulik, D.; Divon, M. Fetal Heart Rate Patterns in Pregnancies Complicated by Maternal Diabetes. Eur. J. Obstet. Gynecol. Reprod. Biol. 1996, 70, 111–115. [Google Scholar] [CrossRef]
- Ursem, N.T.C.; Clark, E.B.; Keller, B.B.; Wladimiroff, J.W. Fetal Heart Rate and Umbilical Artery Velocity Variability in Pregnancies Complicated by Insulin-Dependent Diabetes Mellitus. Ultrasound Obstet. Gynecol. 1999, 13, 312–316. [Google Scholar] [CrossRef] [PubMed]
- Boito, S.M.; Struijk, P.C.; Ursem, N.T.C.; Stijnen, T.; Wladimiroff, J.W. Assessment of Fetal Liver Volume and Umbilical Venous Volume Flow in Pregnancies Complicated by Insulin-Dependent Diabetes Mellitus. BJOG 2003, 110, 1007–1013. [Google Scholar] [CrossRef]
- Tan, A.E.; Norizah, W.M.; Rahman, H.A.; Aziz, B.A.; Cheah, F.C. Umbilical Artery Resistance Index in Diabetic Pregnancies: The Associations with Fetal Outcome and Neonatal Septal Hypertrophic Cardiomyopathy. J. Obstet. Gynaecol. Res. 2005, 31, 296–301. [Google Scholar] [PubMed]
- Florio, P.; Reis, F.M.; Severi, F.M.; Luisi, S.; Imperatore, A.; Palumbo, M.A.; Bagnoli, F.; Gioffre, W.; Petraglia, F. Umbilical Cord Serum Activin A Levels Are Increased in Pre-Eclampsia with Impaired Blood Flow in the Uteroplacental and Fetal Circulation. Placenta 2006, 27, 432–437. [Google Scholar] [CrossRef] [PubMed]
- Girsen, A.; Ala-Kopsala, M.; Mäkikallio, K.; Vuolteenaho, O.; Räsänen, J. Increased Fetal Cardiac Natriuretic Peptide Secretion in Type-1 Diabetic Pregnancies. Acta Obstet. Gynecol. Scand. 2008, 87, 307–312. [Google Scholar] [CrossRef]
- Russell, N.E.; Higgins, M.F.; Amaruso, M.; Foley, M.; McAuliffe, F.M. Troponin T and Pro-B-Type Natriuretic Peptide in Fetuses of Type 1 Diabetic Mothers. Diabetes Care 2009, 32, 2050–2055. [Google Scholar] [CrossRef]
- To, W.W.K.; Mok, C.K.M. Fetal Umbilical Arterial and Venous Doppler Measurements in Gestational Diabetic and Nondiabetic Pregnancies near Term. J. Matern. Neonatal Med. 2009, 22, 1176–1182. [Google Scholar] [CrossRef]
- Parlakgumus, H.A.; Durukan, T. The Relationship between Cardiac Adaptation to Uteroplacental Doppler Flow and Perinatal Outcome in Pregnant Women with Diabetes. Clin. Exp. Obstet. Gynecol. 2010, 37, 39–42. [Google Scholar]
- Turan, S.; Turan, O.M.; Miller, J.; Harman, C.; Reece, E.A.; Baschat, A.A. Decreased Fetal Cardiac Performance in the First Trimester Correlates with Hyperglycemia in Pregestational Maternal Diabetes. Ultrasound Obstet. Gynecol. 2011, 38, 325–331. [Google Scholar]
- Nanda, S.; Poon, L.C.Y.; Muhaisen, M.; Acosta, I.C.; Nicolaides, K.H. Maternal Serum Resistin at 11 to 13 Weeks’ Gestation in Normal and Pathological Pregnancies. Metabolism 2012, 61, 699–705. [Google Scholar] [CrossRef]
- Fouda, U.M.; Elkassem, M.M.A.; Hefny, S.M.; Hashem, A.T. Role of Middle Cerebral Artery, Umbilical Artery Resistance Indices and Middle Cerebral Artery to Umbilical Artery Resistance Index Ratio in Predicting Unfavorable Perinatal Outcomes of Normotensive and Hypertensive Diabetic Pregnancies. Life Sci. J. 2013, 10, 1097–8135. [Google Scholar]
- Surányi, A.; Kozinszky, Z.; Molnár, A.; Nyári, T.; Bitó, T.; Pál, A. Placental Three-Dimensional Power Doppler Indices in Mid-Pregnancy and Late Pregnancy Complicated by Gestational Diabetes Mellitus. Prenat. Diagn. 2013, 33, 952–958. [Google Scholar] [PubMed]
- Savvidou, M.D.; Syngelaki, A.; Balakitsas, N.; Panaiotova, E.; Nicolaides, K.H. First-Trimester Uterine Artery Doppler Examination in Pregnancies Complicated by Gestational Diabetes Mellitus with or without Pre-Eclampsia. Ultrasound Obstet. Gynecol. 2013, 42, 525–529. [Google Scholar] [CrossRef] [PubMed]
- Li, J.; Chen, Y.P.; Dong, Y.P.; Yu, C.H.; Lu, Y.P.; Xiao, X.M.; Hocher, B. The Impact of Umbilical Blood Flow Regulation on Fetal Development Differs in Diabetic and Non-Diabetic Pregnancy. Kidney Blood Press. Res. 2014, 39, 369–377. [Google Scholar]
- Gonzalez Gonzalez, N.L.; Gonzalez Davila, E.; Castro, A.; Padron, E.; Plasencia, W. Effect of Pregestational Diabetes Mellitus on First Trimester Placental Characteristics: Three-Dimensional Placental Volume and Power Doppler Indices. Placenta 2014, 35, 147–151. [Google Scholar]
- Moran, M.; Mulcahy, C.; Daly, L.; Zombori, G.; Downey, P.; McAuliffe, F.M. Novel Placental Ultrasound Assessment: Potential Role in Pre-Gestational Diabetic Pregnancy. Placenta 2014, 35, 639–644. [Google Scholar]
- Bhorat, I.E.; Bagratee, J.S.; Pillay, M.; Reddy, T. Use of the Myocardial Performance Index as a Prognostic Indicator of Adverse Fetal Outcome in Poorly Controlled Gestational Diabetic Pregnancies. Prenat. Diagn. 2014, 34, 1301–1306. [Google Scholar] [PubMed]
- Pala, H.G.; Artunc-Ulkumen, B.; Koyuncu, F.M.; Bulbul-Baytur, Y. Three-Dimensional Ultrasonographic Placental Volume in Gestational Diabetes Mellitus. J. Matern. Neonatal Med. 2016, 29, 610–614. [Google Scholar] [CrossRef] [PubMed]
- Liu, F.; Liu, Y.; Lai, Y.P.; Gu, X.N.; Liu, D.M.; Yang, M. Fetal Hemodynamics and Fetal Growth Indices by Ultrasound in Late Pregnancy and Birth Weight in Gestational Diabetes Mellitus. Chin. Med. J. 2016, 129, 2109–2114. [Google Scholar]
- Farshchian, N.; Naleini, F.; Jaafarnejhad, A.M. Comparison of the Uterine Artery Doppler Indices during Pregnancy between Gestational Diabetes and Diabetes Mellitus and Healthy Pregnant Women. World Fam. Med./Middle East J. Fam. Med. 2017, 15, 32–35. [Google Scholar] [CrossRef]
- Bugatto, F.; Quintero-Prado, R.; Visiedo, F.M.; Vilar-Sánchez, J.M.; Figueroa-Quiñones, A.; López-Tinoco, C.; Torrejón, R.; Bartha, J.L. The Influence of Lipid and Proinflammatory Status on Maternal Uterine Blood Flow in Women with Late Onset Gestational Diabetes. Reprod. Sci. 2018, 25, 837–843. [Google Scholar]
- Sweeting, A.N.; Wong, J.; Appelblom, H.; Ross, G.P.; Kouru, H.; Williams, P.F.; Sairanen, M.; Hyett, J.A. A First Trimester Prediction Model for Gestational Diabetes Utilizing Aneuploidy and Pre-Eclampsia Screening Markers. J. Matern. Neonatal Med. 2018, 31, 2122–2130. [Google Scholar] [CrossRef] [PubMed]
- Meiramova, A.; Ainabekova, B.; Sadybekova, G.; Akhmetova, Z.; Imangazinova, S.; Omralina, Y. Peculiarities of the Course of Gestation and Pregnancy Outcomes in Women with Gestational Diabetes Mellitus. Acta Endocrinol. 2018, 14, 213–218. [Google Scholar]
- Moodley, S.; Arunamata, A.; Stauffer, K.J.; Nourse, S.E.; Chen, A.; Quirin, A.; Selamet Tierney, E.S. Maternal Arterial Stiffness and Fetal Cardiovascular Physiology in Diabetic Pregnancy. Ultrasound Obstet. Gynecol. 2018, 52, 654–661. [Google Scholar] [CrossRef] [PubMed]
- Wong, C.H.; Chen, C.P.; Sun, F.J.; Chen, C.Y. Comparison of Placental Three-Dimensional Power Doppler Indices and Volume in the First and the Second Trimesters of Pregnancy Complicated by Gestational Diabetes Mellitus. J. Matern. Neonatal Med. 2019, 32, 3784–3791. [Google Scholar] [CrossRef] [PubMed]
- Dantas, A.M.A.; Palmieri, A.B.S.; Vieira, M.R.; Souza, M.L.R.; Silva, J.C. Doppler Ultrasonographic Assessment of Fetal Middle Cerebral Artery Peak Systolic Velocity in Gestational Diabetes Mellitus. Int. J. Gynecol. Obstet. 2019, 144, 174–179. [Google Scholar] [CrossRef]
- Bhorat, I.; Pillay, M.; Reddy, T. Assessment of the Fetal Myocardial Performance Index in Well-Controlled Gestational Diabetics and to Determine Whether It Is Predictive of Adverse Perinatal Outcome. Pediatr. Cardiol. 2019, 40, 1460–1467. [Google Scholar]
- Gasiorowska, A.; Zawiejska, A.; Dydowicz, P.; Wender-Ozegowska, E.; Poprawski, G.; Tobola-Wrobel, K.; Radzicka-Mularczyk, S.; Ziolkowska, K.; Pietryga, M. Mid-Trimester Ultrasound Parameters for Predicting Birth Weight in Low Risk Pregnancies vs. High-Risk Pregnancies Complicated with Pre-Gestational Diabetes Mellitus. Ginekol. Pol. 2020, 91, 216–222. [Google Scholar] [CrossRef]
- McLaren, R.; Kalgi, B.; Ndubizu, C.; Homel, P.; Haberman, S.; Minkoff, H. The Effect of Maternal Position on Fetal Middle Cerebral Artery Doppler Indices and Its Association with Adverse Perinatal Outcomes: A Pilot Study. J. Perinat. Med. 2020, 48, 317–321. [Google Scholar]
- Bachani, S.; Dadhwal, V.; Perumal, V. Correlation of Maternal BMI with Foetal Liver Blood Flow and Neonatal Adiposity in Normal Pregnancies and Pregnancies Complicated by Gestational Diabetes Mellitus and Foetal Growth Restriction. J. Clin. Diagn. Res. 2020, 14, QC08–QC11. [Google Scholar] [CrossRef]
- Tenenbaum-Gavish, K.; Sharabi-Nov, A.; Binyamin, D.; Møller, H.J.; Danon, D.; Rothman, L.; Hadar, E.; Idelson, A.; Vogel, I.; Koren, O.; et al. First Trimester Biomarkers for Prediction of Gestational Diabetes Mellitus. Placenta 2020, 101, 80–89. [Google Scholar] [CrossRef]
- Lehtoranta, L.; Haapsamo, M.; Vuolteenaho, O.; Palo, P.; Ekholm, E.; Räsänen, J. Fetal Cardiovascular Hemodynamics in Type 1 Diabetic Pregnancies at Near-Term Gestation. Acta Obstet. Gynecol. Scand. 2021, 100, 263–271. [Google Scholar] [CrossRef]
- Phadungkiatwattana, P.; Puttanavijarn, L. Comparison of Fetal Cardiac Function between Pregnancies with Diabetes Mellitus and Normal Controls. Thai J. Obstet. Gynaecol. 2021, 29, 264–272. [Google Scholar]
- Zhang, X.; Lou, Y.; Hu, S.; Zhu, D. Backpropagation Neural Network Algorithm-Based Color Doppler Ultrasound Detection of Gestational Diabetes Mellitus and Perinatal Outcomes. Sci. Program. 2021, 2021, 8. [Google Scholar]
- Oncel Alanyali, M.; Alkan, F.; Artunc Ulkumen, B.; Coskun, S. Use of the Modified Myocardial Performance Index for Evaluating Fetal Cardiac Functions in Pregestational Diabetic Pregnancy Babies. J. Obstet. Gynaecol. 2021, 41, 187–192. [Google Scholar] [CrossRef]
- Mecacci, F.; Ottanelli, S.; Vannuccini, S.; Serena, C.; Rambaldi, M.P.; Simeone, S.; Clemenza, S.; Comito, C.; Lisi, F.; Mello, G.; et al. What Is the Role of Glycemic Control in the Development of Preeclampsia among Women with Type 1 Diabetes? Pregnancy Hypertens. 2021, 25, 191–195. [Google Scholar] [CrossRef]
- Liu, H.; Liu, J. Improved Support Vector Machine Algorithm Based on the Influence of Gestational Diabetes Mellitus on the Outcome of Perinatal Outcome by Ultrasound Imaging. Pak. J. Med. Sci. 2021, 37, 1625–1629. [Google Scholar] [CrossRef]
- Fatihoglu, E.; Aydin, S.; Karavas, E.; Kantarci, M. Gestational Diabetes Mellitus and Early Hemodynamic Changes in Fetus. J. Med. Ultrasound 2021, 29, 270–276. [Google Scholar] [PubMed]
- Chen, Y.; Huang, D.; Liu, J.; Zeng, F.; Tang, G.; Lei, W.; Wang, H.; Jiang, Y.; Shentu, W.; Wang, H. Non-Invasive Detection of Fetal Vascular Endothelial Function in Gestational Diabetes Mellitus. Front. Endocrinol. 2021, 12, 763683. [Google Scholar] [CrossRef]
- Hssan, H.; Abd El Wahed, M.; Abdel Aziz, M. Interventricular Septal Thickness and Doppler Indices as Multiparametric Assessment of High-Risk Pregnancy and Their Relation to Fetal Outcome. Egypt. J. Hosp. Med. 2022, 87, 1876–1882. [Google Scholar]
- Jamal, A.S.; Naemi, M.; Eslamian, L.; Marsoosi, V.; Moshfeghi, M.; Nurzadeh, M.; Geran, T.; Ghaemi, M.; Zanbagh, L. The Association between Fetal Renal Artery Indices in Late Pregnancy and Birth Weight in Gestational Diabetes Mellitus: A Cohort Study. Int. J. Reprod. Biomed. 2022, 20, 21–28. [Google Scholar]
- Pérez-Martín, S.M.; Quintero-Prado, R.; Lara-Barea, A.; López-Tinoco, C.; Torrejón, R.; Bugatto, F. Fetal Cerebral Three-Dimensional Power Doppler Vascularization Indices and Their Relationships with Maternal Glucose Levels in Pregnancies Complicated with Gestational Diabetes. Diabetes Vasc. Dis. Res. 2022, 19, 14791641221078108. [Google Scholar] [CrossRef] [PubMed]
- Chatzakis, C.; Sotiriadis, A.; Fatouros, I.G.; Jamurtas, A.Z.; Deli, C.K.; Papagianni, M.; Dinas, K.; Mastorakos, G. The Effect of Physical Exercise on Oxidation Capacity and Utero-Placental Circulation in Pregnancies with Gestational Diabetes Mellitus and Uncomplicated Pregnancies, a Pilot Study. Diagnostics 2022, 12, 1732. [Google Scholar] [CrossRef]
- Karaca Kurtulmus, S.; Sahin Gülec, E.; Sengül, M. Evaluation of the Selected Parameters of the Fetal Diastolic Functions in Normally Grown or Macrosomic Fetuses of Gestational Diabetic Mothers with Poor Glycaemic Control. Cardiol. Young 2022, 32, 1320–1326. [Google Scholar] [CrossRef] [PubMed]
- Abell, S.K.; De Courten, B.; Boyle, J.A.; Teede, H.J. Inflammatory and Other Biomarkers: Role in Pathophysiology and Prediction of Gestational Diabetes Mellitus. Int. J. Mol. Sci. 2015, 16, 13442–13473. [Google Scholar] [PubMed]
- American College of Obstetricians and Gynecologists. ACOG Practice Bulletin Clinical Management Guidelines for Obstetrician-Gynecologists Number 202. Obstet. Gynecol. 2019, 133, e1–e25. [Google Scholar]
- Whittington, J.R.; Cummings, K.F.; Ounpraseuth, S.T.; Aughenbaugh, A.L.; Quick, C.M.; Dajani, N.K. Placental Changes in Diabetic Pregnancies and the Contribution of Hypertension. J. Matern. Neonatal Med. 2022, 35, 486–494. [Google Scholar] [CrossRef]
- Oros, D.; Ruiz-Martinez, S.; Staines-Urias, E.; Conde-Agudelo, A.; Villar, J.; Fabre, E.; Papageorghiou, A.T. Reference Ranges for Doppler Indices of Umbilical and Fetal Middle Cerebral Arteries and Cerebroplacental Ratio: Systematic Review. Ultrasound Obstet. Gynecol. 2019, 53, 454–464. [Google Scholar]
- Nicolaides, K.; Rizzo, G.; Hecher, K.; Ximenes, R. Doppler in Obstetrics; The Fetal Medicine Foundation: London, UK, 2002. [Google Scholar]
- Zimmermann, P.; Kujansuu, E.; Tuimala, R. Doppler Flow Velocimetry of the Uterine and Uteroplacental Circulation in Pregnancies Complicated by Insulin-Dependent Diabetes Mellitus. J. Perinat. Med. 1994, 22, 137–147. [Google Scholar] [CrossRef]
- Pietryga, M.; Brazert, J.; Wender-Ozegowska, E.; Dubiel, M.; Gudmundsson, S. Placental Doppler Velocimetry in Gestational Diabetes Mellitus. J. Perinat. Med. 2006, 34, 108–110. [Google Scholar] [CrossRef]
- Gutaj, P.; Wender-Ozegowska, E. Diagnosis and Management of IUGR in Pregnancy Complicated by Type 1 Diabetes Mellitus. Curr. Diabetes Rep. 2016, 16, 39. [Google Scholar] [CrossRef]
- Gibbons, A.; Flatley, C.; Kumar, S. The Fetal Cerebro-Placental Ratio in Diabetic Pregnancies Is Influenced More by the Umbilical Artery Rather than Middle Cerebral Artery Pulsatility Index. Eur. J. Obstet. Gynecol. Reprod. Biol. 2017, 211, 56–61. [Google Scholar] [PubMed]
- Jiang, L.; Tang, K.; Magee, L.A.; von Dadelszen, P.; Ekeroma, A.; Li, X.; Zhang, E.; Bhutta, Z.A. A Global View of Hypertensive Disorders and Diabetes Mellitus during Pregnancy. Nat. Rev. Endocrinol. 2022, 18, 760–775. [Google Scholar] [PubMed]
- Conti, E.; Zezza, L.; Ralli, E.; Caserta, D.; Musumeci, M.B.; Moscarini, M.; Autore, C.; Volpe, M. Growth Factors in Preeclampsia: A Vascular Disease Model: A Failed Vasodilation and Angiogenic Challenge from Pregnancy Onwards? Cytokine Growth Factor Rev. 2013, 24, 411–425. [Google Scholar] [PubMed]
- Erkamp, J.S.; Geurtsen, M.L.; Duijts, L.; Reiss, I.K.M.; Mulders, A.G.M.G.J.; Steegers, E.A.P.; Gaillard, R.; Jaddoe, V.W.V. Associations of Maternal Early-Pregnancy Glucose Concentrations with Placental Hemodynamics, Blood Pressure and Gestational Hypertensive Disorders. Am. J. Hypertens. 2020, 33, 660–666. [Google Scholar] [CrossRef] [PubMed]
- Contreras, Z.A.; Heck, J.E.; Lee, P.C.; Cui, X.; Hobel, C.J.; Janzen, C.; Lurmann, F.; Ritz, B. Prenatal Air Pollution Exposure, Smoking, and Uterine Vascular Resistance. Environ. Epidemiol. 2018, 2, e017. [Google Scholar] [CrossRef]
- Bhorat, I.; Foolchand, S.; Reddy, T. Cardiac Doppler in Poorly Controlled Gestational Diabetics and Its Link to Markers of Intra-Uterine Hypoxia and Adverse Outcome. J. Obstet. Gynaecol. 2021, 41, 66–72. [Google Scholar] [CrossRef]
- Meler, E.; Martínez, J.; Boada, D.; Mazarico, E.; Figueras, F. Doppler Studies of Placental Function. Placenta 2021, 108, 91–96. [Google Scholar] [CrossRef]
- Mok, T.; Afshar, Y.; Platt, L.D.; Guo, R.; Rao, R.R.; Pluym, I.D.; Silverman, N.S.; Han, C.S. Predicting Adverse Outcomes in Monochorionic-Diamniotic Twins: The Role of Intertwin Discrepancy in Middle Cerebral Artery Doppler Measurements and the Cerebroplacental Ratio. Am. J. Perinatol. 2021, 38, 1348–1357. [Google Scholar]
- Baki Yıldırım, S.; Ayaydın Yılmaz, K.İ.; Gulerman, C. The Effect of Active and Passive Maternal Smoking During Pregnancy on the Uterine Artery Blood Flow and Obstetric Outcomes: A Prospective Study. Cureus 2023, 15, e35270. [Google Scholar]
- Langmia, I.M.; Kräker, K.; Weiss, S.E.; Haase, N.; Schütte, T.; Herse, F.; Dechend, R. Cardiovascular Programming during and after Diabetic Pregnancy: Role of Placental Dysfunction and IUGR. Front. Endocrinol. 2019, 10, 2015. [Google Scholar]
- Misan, N.; Michalak, S.; Kapska, K.; Osztynowicz, K.; Ropacka-Lesiak, M. Blood-Brain Barrier Disintegration in Growth-Restricted Fetuses with Brain Sparing Effect. Int. J. Mol. Sci. 2022, 23, 12349. [Google Scholar] [PubMed]
- Mari, G.; Deter, R.; Carpenter, R.; Rahman, F.; Zimmerman, R.; Moise, K.J.; Dorman, K.; Ludomirsky, A.; Gonzalez, R.; Gomez, R.; et al. Noninvasive Diagnosis by Doppler Ultrasonography of Fetal Anemia Due to Maternal Red-Cell Alloimmunization. Collaborative Group for Doppler Assessment of the Blood Velocity in Anemic Fetuses. N. Engl. J. Med. 2000, 342, 9–14. [Google Scholar] [CrossRef] [PubMed]


| Study Characetristics | Cases | Controls | ||||||||||||
|---|---|---|---|---|---|---|---|---|---|---|---|---|---|---|
| Author (Year) Country Study Design | Artery-Index | DM Type (White Classification) | n | Characteristics | Glycaemia HbA1c | Maternal Age a | Gestational Age b | Weight BMI | n | Characteristics | Matched (Variable) | Maternal Age | Gestational Age | Weight BMI |
| Olofsson (1987) [29] Sweden NR | UA-PI | DM | 40 | Diabetic pregnancies | NR NR | 29.2 (19–39) | 26–34 (I test) 35–37 (II test) 37-delivery (III test) 37–42–term delivery in 37 <37–preterm delivery in 2 >42–post-term delivery in | NR NR | 21 | Healthy women with uncomplicated pregnancies | No | NR | NR | NR NR |
| Landon (1989) [30] USA NR | UA-S/D ratio | DM (B, C, D, F/R) | 35 | Insulin-dependent diabetic pregnant women | NR NR | NR | 18–28 (at assessment) | NR NR | 117 | Normal non-diabetic pregnant women | No | NR | 18–38 (at assessment) | NR NR |
| Friedman (1989) [31] USA prospective study | UA-S/D ratio | DM | 18 | Pregnant diabetic women with a genetic risk of heart disease or exposure to potential teratogens | NR NR | NR | 16–38 (at assessment) | NR NR | 113 | Normal pregnant women | No | NR | 14–41 (at assessment) | NR NR |
| Brown (1990) [32] Australia NR | UA-RI UA-S/D ratio UtA-RI UtA-S/D ratio | GDM | 44 | Diabetic pregnant women | NR NR | NR | >26 (at assessment) 38 ± 2 (at delivery) | NR NR | 167 | Normal pregnancies | No | NR | >26 (at assessment) 40 ± 2 (at delivery) | NR NR |
| Johnstone (1992) [33] UK prospective study | UA-PI | DM type 1 (B, C, D, F/R) GDM (A2) | 128 | Insulin-dependent diabetic pregnant women | NR NR | NR | >28 (at assessment) | NR NR | 119 | Non-diabetic pregnant women | No | NR | >28 (at assessment) | NR NR |
| Zimmermann (1992) [34] Finland prospective study | UA-RI | DM type 1 (B, C, D, F/R) | 53 | Insulin-dependent diabetic pregnant women | 6.2 ± 2.0 mmol/L 6.6 ± 1.1% | 26.8 ± 5.6 | >17 (at assessment) 37.7 ± 1.3 (at delivery) | NR >27 kg/m2 in 11 (21%) women | 30 | Non-diabetic normal pregnancies at 37–38 weeks gestation with subsequently normal fetal outcome | No | NR | 37–38 (at assessment) | NR NR |
| Pachi (1993) [35] Italy NR | UA-PI | DM type 1 (B, C, D, R) | 30 Total Group I–10 Group II–10 Group III–10 | Insulin-dependent diabetic pregnant women | Group I (<6.7 mmol/L): 5.5 ± 0.5 mmol/L Group II (6.1–7.2 mmol/L): 6.8 ± 0.3 mmol/L group III (>7.2 mmol/L) 8.1 ± 0.6, mmol/L NR | Group: I 30.3 ± 3.0 Group: II 29.0 ± 3.1 Group: III 29.2 ± 3.8 | 31 and 34 (test 1 and 2) | Pre-pregnancy weight (kg) Group I 54.3 ± 3.0. Group II 55.2 ± 3.3 Group III 56.7 ± 3.4 NR | 150 | Healthy pregnant women | No | NR | NR | NR NR |
| Gagnon (1994) [36] Canada NR | UA-RI | DM type 1 DM type 2 GDM | 37 Total 17 DM (16 type I + 1 type II) 20 GDM | Diabetic pregnant women without diabetic retinopathy or nephropathy | DM (mean ± se) 128.0 ± 1.4 mg/dL, at 30 gw, 108.2 ± 1.3 mg/dL at 38 gw GDM (mean ± se) 121.5 ± 5.4 mg/dL at 30 gw, 109.0 ± 2.9 mg/dL, at 31 gw NR | NR | 30, 33, 36 (at 1st assessment and weekly thereafter until delivery) DM mean (range) 38.2 (35–40) GDM 38.5 (36–40) | NR >27.3 kg/m2 in 3 DM and 18 GDM | 14 | Pregnant women with normal glucose metabolism defined as both screening tests negative (at 28 and 36 gw) | No | NR | 40.1 (37–41) mean (range) (at delivery) | NR >27.3 kg/m2 in 1 control |
| Weber (1994) [37] USA NR | UA-S/D ratio | DM type 1 (B, C, D, F, RF) | 9 | Well-controlled insulin-dependent diabetic pregnant women without HTA or PE | NR 4.5 ± 0.6%, (20–26 gw) 4.6 ± 0.9%, (27–33 gw) 4.1 ± 0.3%, (34–40 gw) 3.8 ± 0.3%, (at delivery) | NR | 20–26 (test 1) 27–33 (test 2) 34–40 (test 3) 38.1 ± 1.06 (at delivery) | NR NR | 11 | Nondiabetic volunteers randomly selected with normal medical histories and normal oral glucose tolerance tests excluding gestational diabetes | No | NR | 20–26 (test 1) 27–33 (test 2) 34–40 (test 3) 40.6 + 91.3 (at delivery) | NR NR |
| Santolaya (1994) [38] USA NR | UA-RI | GDM | 10 | Obese GDM women with preconceptional weight > 90.7 kg | NR NR | 28.3 ± 1.8 | >20 (at assessment) 37.6 ± 0.9 (at delivery) | over 70.9 kg NR | 18 Total 9-1st control 9-2nd control | 1st control—obese woman 2nd control—obese women with PIH | No | 1st control-24.7 ± 1.7 2nd control-30.0 ± 3.4 | >20 (at assessment 1st control-38.8 ± 0.7 (at delivery) 2nd control-36.9 ± 1.8 (at delivery) | over 70.9 kg NR |
| Gazzolo (1995) [39] Italy NR | UA-RI | GDM | 71 | GDM pregnancies: treated with diet and insulin–Group A and group with abnormal neonatal neurological outcome-Group B | Group A GLY I 6.35 ± 2.72 mmol/L (27–32 gw) GLY II 5.97 ± 2.60 mmol/L (33–36 gw) Group B GLY I 6.08 ± 1.41 (27–32 gw) GLY II 5.91 ± 1.72 mmol/L (33–36 gw) NR | NR | 27–32 (test 1) 33–36 (test 2) | NR NR | 100 | Healthy pregnancies | No | NR | 27–32 (test 1) 33–36 (test 2) | NR NR |
| Saldeen (1996) [40] Saudi Arabia case-control | UA-PI | DM type 2 GDM | 21 total 2 DM type 2 9 GDM 10 impaired glucose tolerance | Pregannat women with DM type 2, GDM or impaired glucose tolerance | NR 0.079 ± 0.003% (mean ± se) | NR | NR 271.8 ± 1.9 (mean ± se) | NR NR | 10 | Healthy women with normal pregnancies undergoing repeated elective cesarean section | No | NR | 269.0 ± 1.1 days (mean ± se) | NR NR |
| Grunewald (1996) [41] Sweden NR | UA-PI | DM type 1 (B, C, D, F, R) | 24 | Pregnant women with well-controlled insulin-dependent pregestational diabetes | Random blood glucose 5.8 mmol/L (1.8–14.3), med (range) At test I 4.2 mmol/L (1.8–8.4), med (range), At test II 5.6 mmol/L (3.6–9.4), med (range) 4.7% (3.6–7.1), med (range) | 28 (19–37), med (range) | 31 (29–33) (test I), med (range) 35 (33–37) (test II), med (range) 38 (35–40) (at delivery), med (range) | 1st trimester65 kg (52–91) med (range) 38 gw 81 kg (69–107) med (range) NR | 25 | Healthy low risk pregnant women | No | 27 (21–37), med (range) | 31 (29–33) (test I), med (range) 35 (33–37) (test II), med (range) 39 (38–42) (at delivery), med (range) | 1st trimester 59 kg (49–74), med (range) 38 gw 76 kg (60–89) med (range) NR |
| Weiner (1996) [42] USA NR | UA-S/D ratio | DM type 1 (B, C, D, F, R) GDM (A) | 120 | Well-controlled diabetics with mean blood glucose levels below 95 mg | NR NR | 29.89 ± 5.4, (mean ± 2 sd) DM class A 30.2 ± 5.9 (mean ± 2 sd) DM class B–R | >30 (at assessment) DM class A 38.3 ± 1.7 (mean ± 2 sd) DM class B-R 37.7 ± 5.18(mean ± 2 sd), at delivery | NR NR | 55 | Non-diabetic low-risk pregnant women | No | 29.4 ± 6.4 | >30 (at assessment) 39.7 ± 1.4 (mean ± 2 sd) | NR NR |
| Ursem (1999) [43] Italy Not clear (prospective cross-sectional) | UA-PI | DM type 1 (B, C, R, F/R) | 16 | Well-controlled insulin-dependent diabetic pregnant women | NR 6.3% (6.1–7.1), med (range) at 1st trimestar | 32 (23–32) med (range) | 18 (12–21), med (range) (at assessment) 38 (30–40), med (range) (at delivery) | NR NR | 16 | Normal controls | Yes (gestational age) | 32 (15–39), med (range) | 18 (12–21) (at assessment), med (range) 40 (37–42) (at delivery), med (range) | NR NR |
| Boito (2003) [44] Netherlandscross-sectional | UA-PI | DM type 1 (B, C, D, R, F/R) | 32 | Pregestational insulin-dependent DM singleton pregnant women | NR 6.7% (4.5–12.5), mean (range) | 31 (19–39) (mean-range) | 25.7 (18–36), mean (range) 37.4 (28–41), mean (range) | NR NR | 32 | Uncomplicated pregnancies | Yes (gestational age) | 31 (19–42), mean (range) | 25.6 (19–36), mean (range) | NR NR |
| Tan (2005) [45] Malaysia case-control | UA-RI | DM type 1 DM type 2 GDM | 50 Total 10 pre-existing DM 25 GDM 15 impaired glucose tolerance | Pregnant women with pre-existing DM, GDM or impaired glucose tolerance at 36 gw of amenorrhea according to the WHO 1985 criteria | NR 6.53 ± 1.14% | NR | >36 (at assessment) NR | NR NR | 50 | Normal pregnancies | Yes (maternal age, parity, and gestation) | NR | >36 (at assessment) NR | NR NR |
| Florio (2006) [46] Italy cross-sectional | UA-PI MCA-PI | GDM (A1) | 13 | GDM pregnancies complicated by fetal macrosomia without superimposed hypertensive disorders, preterm labor, or infection | NR NR | 27.9 ± 1.1 mean ± se | 40.1 ± 0.2 (at delivery) | NR NR | 40 | Uneventful, term gestation and delivery of a healthy infant | No | 28.7 ± 1.2 | 39.3 ± 0.1 (at delivery) | NR NR |
| Girsen (2008) [47] Finland cross-sectional | UA-NR | DM type 1 (B, C, D, F) | 32 Total 22 Group 1 10 Group 2 | 2 groups according to the HbA1c value in the 1st trimester. Group 1 (good glycemic control—HbA1c < 7.5% Group 2 (poor glycemic control–HbA1c ≥ 7.5%) | NR Group 1: 6.5 ± 0.7, 1st trimester 6.0 ± 0.8, 2nd trimester 5.9 ± 0.8 3rd trimester Group 2: 8.6 ± 0.8, 1st trimester 7.5 ± 0.8, 2nd trimester 7.3 ± 0.5 3rd trimester | Group 1 31 (18–44), med (range) Group 2 29 (21–39), med (range) | Group 1 37.3 ± 2.1 (at delivery) Group 2 36.8 ± 1.7 (at delivery) | NR NR | 60 | Healthy, non-diabetic women after uncomplicated pregnancy and delivery | No | NR | 40.4 ± 1.2 (at delivery) | NR NR |
| Russell (2009) [48] Ireland prospective study | UA-PI | DM type 1 (B, C, D, F, R, F/R) | 45 | Pregnant women with pregestational diabetes lasting for 16.5 ± 8.7 years. | NR 7.5 ± 1.5% Early pregnancy 6.6 ± 0.9% at 14 gw 6.2 ± 0.8% at 20 gw 6.3 ± 0.8% at 36 gw | 32 ± 4 | 38 ± 1 (at delivery) | NR 26.13 ± 4.34 kg/m2, | 39 | Uncomplicated pregnancies with no evidence of impaired glucose tolerance, without glycosuria during their pregnancy or any other indication for formal glucose tolerance testing | No | 32 ± 5 | 39 ± 1 (at delivery) | NR 22.97 ± 3.57 kg/m2, |
| To (2009) [49] China prospective study | UA-PI | GDM | 78 Total 16 GDM 62 IGT | Pregnant women before 24 gw with risk factors for GDM such as advanced age (>35 years at expected date of confinement), obesity (BMI > 25), family history of type I or type II diabetes, significant obstetric history of previous GDM, previous fetal macrosomia, or previous unexplained stillbirths. | NR NR | 33.1 ± 5.4 | 38.3 ± 1.15 (at delivery) | NR NR | 62 | Non-diabetic non-hypertensive patients between 36 and 40 gw randomly selected during the same study period when they were scanned for placental location, fetal size, or liquor volume or fetal presentation | No | 30.8 ± 5.0 | 38.9 ± 1.41 (at delivery) | NR NR |
| Parlakgumus (2010) [50] Turkey prospective study | UA-S/D ratio | DM type 1 DM type 2 GDM | 20 | Pregnant women with pre-gestational and gestational DM | NR NR | 33.2 ± 4.18 | 37.2 ± 2.25 (at delivery) | 71.6 ± 7.4 kg NR | 25 | Healthy pregnant women whose 50 g glucose tolerance test at 24 weeks was found to be normal | No | 34 ± 4.24 | 38.6 ± 1.52 (at delivery) | 69.4 ± 6.9 kg NR |
| Turan (2011) [51] USA prospective study | UA-PI | DM | 63 | Insulin-dependent pregestational DM with moderate to poor glycemic control | NR 7.5% (5.1–12.7), med (range) | 32.5 ± 6.68 | 12.5 ± 0.59 (at assessment) | NR 32.6 kg/m2 (19–61), med (range) | 63 | Pregnant women without DM | Yes (gestational age, UA and DV indices) | 32.1 ± 6.03 | 12.6 ± 0.55 (at assessment) | NR 25.0 kg/m2 (17–42), med (range) |
| Nanda (2012) [52] UK prospective study | UtA-PI | GDM | 60 | Pregnant women between 11+0 and 13+6 gw with GDM attending routine first pregnancy control visit | NR NR | 32.0 (28.5–35.6), med (IQR) | 89.1 days (86.2–93.1) (at assessment), med (IQR) 38.5 (38.1–39.6) (at delivery), med (IQR) | 76.5 kg (64.3–94.0), kg, med (IQR) 28.6 kg/m2 (24.6–34.2), med (IQR) | 240 | Pregnancies with no medical complications, such as hypertensive disorders or diabetes mellitus, resulting in the birth after 37 weeks’ gestation of phenotypically normal neonates with birth weight between the 5th and 95th percentiles for gestational age | Yes (NR) | 33.0 (27.3–35.9), med (IQR) | 88.9 days (86.1–91.2) (at assessment), med (IQR) 39.7 (38.6–40.5) (at delivery), med (IQR) | 64.0 kg (58.9–70.0), med (IQR) 23.8 kg/m2 (21.7–26.2), med (IQR) |
| Fouda (2013) [53] Egypt prospective study | UA-RI | DM type 1 DM type 2 | 69 Total 23 Pre-gestational DM 22 GDM 24 DM + HTA | Pregnant women with high (maternal age above 35 years, obesity, family history of diabetes mellitus, glycosuria, past history of gestational diabetes, infant macrosomia and unexplained stillbirth) and low risk after the first antenatal visit. | NR 5.66 ± 0.8% | 26.35 ± 2.6 | 37.21 ± 0.75 (at delivery) | NR NR | 27 | Uncomplicated pregnancies | No | 25.96 ± 2.18 | 37.69 ± 0.75 (at delivery) | NR NR |
| Suranyi (2013) [54] Hungary case-control study | UA-PI | DM type 1 (B, C, D)GDM (A1, A2) | 99 Total 43 DM 56 GDM | DM type I with good glycemic control (HgA1c: 20–42 mmol/mol) | NR NR | DM 32 ± 5 GDM 33 ± 5.1 | DM 31 ± 7+4 (at assessment) GDM 30+6 ± 6+4 (at assessment) | NR NR | 113 | Non-pathological control group | No | 30.7 ± 5.4 | 28+4 ± 5+5 (at assessment) | NR NR |
| Savvidou (2013) [55] UK prospective study | UtA-PI | GDM | 1037 | Pregnant women attending their routine first hospital visit between 11+0 and 13+6 gw | NR NR | 32.8 ± 5.4 | 89.2 ± 4.2 days (at assessment) 38.6 ± 1.4 (at delivery) | NR 29.9 ± 6.7 kg/m2 | 56 649 | Normoglycemic controls | No | 30.7 ± 6.0 | 89.0 ± 4.1 days (at assessment) | NR 25.4 ± 5.1 kg/m2 |
| Shabani Zanjani (2013) [21] Iran cross-sectional study | UA-PI UA-RI UA-S/D ratio MCA-PI right and left MCA-RI right and left MCA-S/D ratio right | GDM | 33 | Singleton pregnant woman with at least 24 gw without any history of DM, PE, renal diseases, blood disorders, and hyperlipidemia | 113.50 ± 25.03 mg/dL NR | 31.21 ± 5.94 | 34.46 ± 2.62 (at assessment) NR | NR NR | 33 | The non-GDM pregnant women selected from the same perinatology clinic during the same period of time | Yes (gestational age) | 26.31 ± 7.59 | 34.64 ± 3.24 | NR NR |
| Li (2014) [56] China prospective cohort study | UA-PI | GDM | 226 | Pregnant GDM Chinese women who delivered babies at the obstetric department of the first affiliated hospital | NR NR | 29.48 ± 3.54 | 274.70 ± 8.03 days (at delivery) | 52.57 ± 7.13 kg, prepregnancy 68.16 ± 8.58 kg (at delivery) 20.64 ± 2.46 kg/m2, prepregnancy | 519 | Non-GDM pregnant women | No | 28.32 ± 3.52 | 274.42 ± 9.69 days (at delivery) | 51.58 ± 6.79 kg (prepregnancy) 67.76 ± 7.93 kg (at delivery) 20.11 ± 2.33 (prepregnancy) |
| Gonzales Gonzales (2014) [57] Spain Not clear (prospective case-control study) | UtA-PI | DM type 1 DM type 2 | 69 Total 44 DM type 1 25 DM type 2 | Pregnant women with pregestational DM undergoing 1st trimester combined screening for aneuploidies | NR 6.50 ± 0.87% | 32.5 ± 4.6 | 11–13 (at assessment) 273 days (266–280), med (IQR) (at delivery) | 78.4 ± 17.0 kg 29.2 ± 5.7 kg/m2 | 94 | Cases without pregestational diabetes | Yes (maternal characteristics in terms of chronic hypertension, obesity and smoking status) | 30.7 ± 6.4 | 281 days (274, 286), med (IQR) (at delivery) | 73.5 ± 15.0 kg 27.9 ± 5.4 kg/m2 |
| Moran (2014) [58] Ireland prospective cohort study | UA-PI MCA-PI UtA-PI | DM type 1 DM type 2 | 50 Total 37 DM type 1 13 DM type 2 | Pregnant women with pregestational type 1 and type 2 DM | NR NR | 33 (21–45) n (range/%) | 12+2 to 39+5 (at assessment) | NR 24.43 kg/m2 (18.44–79.8), mean (range) | 250 | Normal controls defined as no pv bleeding at any stage in the pregnancy, no medical disorder requiring treatment, e.g., diabetes, or any degree of hypertension, fetal anomaly or a suspicion or diagnosis of intrauterine growth restriction | No | 31 (16–44), n (range/%) | 12+6 to 39+5 (at assessment) | NR 25.43 kg/m2 (16.16–50.97), med (range) |
| Bhorat (2014) [59] South Africa Not clear (prospective cross-sectional study) | UA-RI MCA-RI | GDM (A2) | 29 | Women with suboptimally to poorly controlled insulin-dependent GDM diabetes in the 3rd trimester | 11.9 mmol/L (8.3–15.9), med (IQR) NR | 32 (30–33), med (IQR) | 35 (34–36), med (IQR) (at assessment) 38.35 (37.71–38.71), med (IQR) (at delivery) | NR NR | 29 | Normal pregnancies | Yes (gestational age, maternal age) | 32 (30–33), med (IQR) | 35 (34–36), med (IQR) (at assessment) 39.43 (39–39.71), med (IQR) (at delivery) | NR NR |
| Pala (2015) [60] Turkey case-control study | UA-PI MCA-PI | GDM | 39 | Singleton pregnancies between 24 and 39 gw | NR NR | 30.05 ± 5.56 | 34.92 ± 3.16 | NR NR | 42 | Healthy singleton pregnancies between 24 and 39 gw | Yes (gestational age, maternal age, and parity) | 29.32 ± 5.79 | 33.65 ± 3.64 | NR NR |
| Liu (2016) [61] China Not clear (observational study) | UA-PI UA-RI UA-S/D ratio MCA-PI MCA-RI MCA-S/D ratio UtA-PI UtA-RI UtA-S/D ratio | GDM | 147 | Singleton pregnant women aged 25–38 years, between 37 and 40 gw (within 1 week before delivery) with an OGTT performed in the 2nd trimester, and gestational age calculated from the first day of the last normal menstrual period and confirmed by the 1st trimester ultrasound scans | NR NR | 30.80 ± 3.00 | 38.0 ± 0.68 (at assessment) | 73.50 ± 12.06 kg, (at assessment) 23.87 ± 3.58 kg/m2 (prepregnancy) | 124 | Normal pregnancies | No | 29.94 ± 3.60 | 38.0 ± 0.65 (at assessment) | 70.35 ± 9.35 kg, (at assessment) 22.24 ± 3.20 kg/m2 (before pregnancy) |
| Peixoto (2016) [14] Brazil retrospective cohort study | UA-PI MCA-PI UtA-PI | GDM | 56 | Pregnant women who underwent 3rd-trimester ultrasound exams between 26w0d and 37w6d of gestation | NR NR | 27.60 ± 6.50 | 32.3 ± 3.1 (at assessment) 38.2 ± 1.5 (at delivery) | 82.90 ± 15.50 kg 33.30 ± 7.30 kg/m2 | 684 | NR | No | 25.40 ± 6.30 | 32.7 ± 2.9 (at assessment) 37.8 ± 2.8 (at delivery) | 71.90 ± 17.00 kg 27.30 ± 6.10, kg/m2 |
| Farshchian (2017) [62] Iran case-control study | UtA-PI | DM GDM | 40 Total 20 DM 20 GDM | Pregnant women with gestational age of 20 to 40 gw with DM or GDM. DM pregnant women had the condition for less than 5 years, without vascular diseases, and their blood glucose was under control. | NR NR | DM 37.85 ± 4.99 GDM 35.55 ± 3.63 | DM 31.70 ± 3.64 GDM 31.9 ± 4.41 | NR NR | 20 | Normal healthy mothers without hyperglycemia with gestational age between 20 and 40 gw | Yes (gestational age, maternal age) | 35.55 ± 6.01 | 32.45 ± 3.34 | NR NR |
| Bugatto (2017) [63] Spain prospective cohort study | UtA-PI | GDM (A1, A2) | 25 | Pregnant women diagnosed with GDM in the 2nd or 3rd trimester of gestation. | 80.5 ± 9.4 mg/dL NR | 31.4 ± 6.0 | 36.1 ± 0.4 | NR 26.6 ± 6.0 m/kg2 (pregravid) | 25 | Non-GDM pregnant women | No | 30.5 ± 4.5 | 36.0 ± 0.5 | NR 29.06 ± 5.0 (pregravid) |
| Sweeting (2017) [64] Australia case-control study | UtA-PI | GDM | 248 Total 89 Early GDM 138 Standard GDM | Pregnant women who had a diagnosis of GDM made at any timepoint during pregnancy, retrospectively identified by review of pathology and electronic medical records who referred for evaluation of 1st-trimester aneuploidy and PE screening at 11–13+6 gw | NR NR | 33 (30–36), med (IQR) | All GDM women 275 days (271–280) med (IQR) Early GDM 274 days (269–280) med (IQR) Standard GDM 276 days (271–280) med (IQR) (at delivery) | All GDM 64.4 kg (58.2–75.4), med (IQR) Early GDM 64.5 kg (58.0–76.3), med (IQR) Standard GDM 64.6 kg (59.6–75.2), med (IQR) 24.5 (22.5–28.3)kg/m2, med (IQR) (at assessment) | 732 | Women with a normal OGTT or GCT at 24 to 28 gw, randomly selected based on gestational age (via measurement of first trimester fetal crown rump length on ultrasound) | Yes (NR) | 32 (29–35) med (IQR) | 279 days (173–285), med (IQR) (at delivery) | 63.7 kg (57.4–71.7), med (IQR) (at assessment) 23.3 (21.6–26.1) kg/m2, med (IQR) (at assessment) |
| Meiramova (2018) [65] Kazahstan NR | UA-PI | GDM | 61 Total 24 Mild GDM 37 Moderate GDM | Pregnant women with mild and moderate GDM severity between 18–42 gw | NR NR | 32.8 ± 6.314 | 30–32 (I test) and first day of delivery (II test) 37.16 ± 3.348 (at delivery) | NR 31.1 ± 7.433 kg/m2 (pre-gravid) | 39 | Pregnant women with normal glucose tolerance | No | 30 ± 5.432 | 38.85 ± 1.247 (at delivery) | NR 24.9 ± 5.434 kg/m2 (pre-gravid) |
| Moodley (2018) [66] Canada prospective study | MCA-RI UA-RI | DM GDM | 43 Total 22 DM 21 GDM | Pregnant women referred to the Heart Center by their obstetricians for fetal echocardiography due to risk factors or concerns for fetal congenital heart disease, in keeping with indications established in recent guidelines for diagnosis and treatment of fetal cardiac disease | NR NR | 33.3 ± 3.7 | 22.3 ± 2.2 (at assessment) | 85.4 ± 26.3 kg, (pre-pregnancy) 32.8 ± 9.9 kg/m2 (pre-pregnancy) | 23 | Healthy pregnant women referred for a family history of congenital heart disease, teratogen exposure, difficulty viewing all structures of the fetal heart, suspicion of abnormal fetal cardiac structures on screening ultrasound, increased nuchal thickness and a finding of an echogenic foci, all with normal fetal echocardiograms on assessment | No | 31.6 ± 8.2 | 22.2 ± 2.4 (at assessment) | 60.4 ± 7.6 kg (pre-pregnancy) 23.5 ± 2.6 kg pre-pregnancy |
| Wong (2018) [67] Taiwan Not clear (prospective case-control study) | UtA-PI | GDM | 31 | Singleton pregnancies with GDM | NR | 33.58 ± 4.32 | 12.52 ± 0.51 and 21.90 ± 0.65 (at assessment) 37.97 ± 1.89 (at delivery) | NR 25.13 ± 5.95 kg/m2 | 124 | Those who passed the GCT or OGTT | No | 31.72 ± 3.31 | 12.49 ± 0.55 and 22.01 ± 0.52 (at assessment) 38.84 ± 1.23 (at delivery) | NR 21.35 ± 3.23 kg/m2 |
| Ciobanu (2019) [22] UK prospective study | MCA-PI | DM type 1 DM type 2 | 40 15 DM type 1 25 Dm type 2 | Singleton pregnancies with DM | NR NR | NR | NR | NR NR | 71,565 | Pregnant women without DM | No | NR | NR | NR NR |
| Dantas (2019) [68] Brazil cross-sectional study | UA-PI MCA-PI | GDM | 115 | Singleton pregnant women presenting for prenatal follow-up who were diagnosed with GDM in 2nd or 3rd trimester referred to the outpatient pregnancy risk reference center | Fasting blood glucose 4.91 ± 0.78, mmol/L Postprandial blood glucose 6.45 ± 1.46, mmol/L 5.69 ± 0.95% | 32.2 ± 6.5 | 2nd or 3rd trimester (at assessment) 30.1 ± 3.7 (at delivery) | NR 30.9 ± 5.4, kg/m2 Category-18.5–24.9-17 (14.8%) -25.0–29.9-34 (29.6%) -≥30.0–64 (55.7%) | 123 | Women without GDM (i.e., negative OGTT results) who were in the second or third trimester of pregnancy and attending basic healthcare units | No | 30.7 ± 6.3 | 2nd or 3rd trimester (at assessment) 31.2 ± 2.3 (at delivery) | NR 27.0 ± 3.9, kg/m2 Category: -18.5–24.9 31 (25.2%) -25.0–29.9-49 (39.8%) -≥30.0–43 (35.0%) |
| Bhorat (2019) [69] South Africa Not clear (prospective cross-sectional study) | UA-RI | GDM | 54 | Women with GDM in the 3rd trimester | NR NR | NR | 3rd trimester (at assessment) | NR NR | 54 | Randomly selected from the antenatal clinic and who were not diabetic as defined by the WHO criteria of a 2 h level < 7.8 mmol after a 75 g OGTT | Yes (gestational age, maternal age, parity, gravidity, BMI, and past obstetric history) | NR | 34.05 ± 1.03 (at delivery) | NR NR |
| Gasiorowska (2020) [70] Poland NR | UtA-PI | DM | 38 | Singleton pregnancies at about 20 gw | NR 5.6 ± 0.95% (at 20 gw, at assessment) | 29.8 ± 4.7 | at about 20 (at assessment) | 65.3 ± 14.6 kg (pregestational) 23.7 ± 5.1, kg/m2 (pregestational) | 961 | Healthy pregnant women | No | 28.5 ± 5.3 | at about 20 (at assessment) | 66.2 ± 12.4 kg (pregestational) 24.3 ± 4.7 kg/m2(pregestational) |
| McLaren (2020) [71] USA Not clear (prospective cross-sectional study) | MCA-PI | DM GDM | 30 Total 20 DM 10 GDM | Pregnant diabetic women 18–45 years old with a gestational age of 18–36 weeks | NR NR | NR | DM 218.47 ± 34.80 days (at assessment) Pregestational DM 218.15 ± 36.71 days (at assessment) GDM 219.10 ± 32.50 days (at assessment) | NR NR | 34 | Low risk pregnancies without DM | No | 28 ± 6.1 | 28.8 ± 6.4 (at assessment) | NR 26.5 ± 4.0 kg/m2 (at assessment) |
| Bachani (2020) [72] India Not clear (observational study) | UA-PI MCA-PI | GDM | 31 | Women with GDM on treatment | NR NR | 28.74 ± 4.12 | 35 (at assessment) | NR 26.07 ± 3.32 kg/m2 (at assessment) | 40 | Singleton uncomplicated pregnancies | No | 27.22 ± 3.56 | 35 (at assessment) | NR 24.44 ± 2.97 kg/m2 |
| Tenenbaum-Gavish (2020) [73] Israel prospective study | UA-PI | GDM | 20 | Women carrying a singleton viable gestation when undergoing combined first trimester screening for aneuploidy with GDM managed either by diet (GDMA1) or treated by glyburide or insulin (GDMA2) | NR NR | 33.4 (30.7–36.1) mean (95%CI) | at 11+0 to 13+6-12.7 (12.3–13.1) mean (95%CI) (at assessment) 39.0 (38.3–39.6) mean (95%CI) | NR 30.0 kg/m2 (27.0–33.0) mean (95%CI), (at assessment) | 185 | Normal pregnancies delivering a healthy baby at term | No | 31.0 (30.3–31.6) mean (95%CI) | 12.6 (12.5–12.7) mean (95%CI) (at assessment) 39.6 (39.4–39.8) mean (95%CI) (at delivery) | NR 23.3 kg/m2 (22.8–23.9) mean (95%CI) (at assessment) |
| Lehtoranta (2020) [74] Finland Not clear (prospective case-control study) | UA-PI MCA-PI | DM type 1 | 33 | Pregnant women recruited consecutively at the University Hospital outpatient maternity clinics during their first visit | NR NR | 28.5 ± 4.9 | Between 34+2 and 40+2 (at assessment) 37.4 ± 1.5 (at delivery) | NR 26.1 ± 4.9, kg/m2 (prepregnancy) | 67 | Healthy singleton pregnancies from outpatient maternity clinics with BMI < 30 kg/m2, major serious illnesses and with normal 2 h oral glucose tolerance test at 24–28 gw | No | 28.0 ± 4.0 | Between 34+2 and 40+2 (at assessment) 39.5 ± 1.9 (at delivery) | NR 23.2 ± 3.4 kg/m2 (prepregnancy) |
| Phadungkiatwattana (2021) [75] Thailand Not clear (prospective observational cross-sectional study) | UA-PI MCA-PI | DM GDM | 138 Total 46 DM 92 GDM | Pregnant women with DM (pregestational with insulin usage and gestational with diet control) | NR 5.8% (5.3–6.3) med (IQR) | 33.8 ± 5.4 | Between 35 and 37, 36.05 ± 0.8 (at assessment) 38.33 ± 1.08 (at delivery) | NR 25.35 ± 5.10 kg/m2 (pregestational) | 149 | Healthy pregnant women | No | 29.0 ± 6.0 | Between 35 and 37, 36.05 ± 0.8 (at assessment) 38.78 ± 1.1 (at delivery) | NR 22.64 ± 3.72 kg/m2 (pregestational) |
| Wei (2021) [18] China NR | MCA-PI MCA-RI MCA-S/D ratio UA-PI UA-RI UA-S/D ratio UtA-PI UtA-RI UtA-S/D ratio | GDM | 76 | Pregnant women with GDM admitted to the obstetric outpatient clinic | NR NR | 28.71 ± 4.62 | 27.88 ± 2.31 (at assessment) | NR NR | 76 | Healthy pregnant women | No | 28.62 ± 4.55 | 26.37 ± 2.35 (at assessment) | NR NR |
| Zhang (2021) [76] China NR | MCA-PI MCA-RI MCA-S/D ratio | GDM | 80 | Pregnant women diagnosed as having GDM treated in the hospital | NR NR | NR | at 25th–28th (at assessment) 34.17 ± 3.88 | NR NR | 80 | Healthy pregnant women | No | NR | 38.66 ± 2.75 (mean ± sd), at delivery | NR NR |
| Alanyali (2021) [77] Turkey prospectivecontrolled clinical trial | UA-PI | DM type 1 DM type 2 | 30 | Outpatient pregnant women aged 18–45 years, between 24 and 26 gw according to the last menstrual period diagnosed pregestational DM type 1 or type 2 | NR NR | 32.00 ± 4.99 | 24.57 ± 0.62 (at assessment) | NR NR | 30 | Singleton healthy non-PE pregnant women aged 18–45 years of age without pregestational DM or additive diseases (HTA, cardiac disease, thyroid disorders, systemic lupus erythematosus) with fetus without congenital malformations | No | 27.53 ± 5.22 | 24.53 ± 0.77 (at assessment) | NR NR |
| Mecacci (2021) [78] Italy case-control study | UA-PI | DM type 1 | 244 | Pregnant women with DM recruited before 10th gw | NR NR | 28.3 (22–41) med (range) | 16th, 20th, and 24th (at assessment) | NR NR | 488 | Singleton pregnant women with normal glucose tolerance test, and delivery after 20 gw followed up in the same maternal-fetal outpatient unit | Yes (race, maternal age, pre-pregnancy BMI, nulliparity, weight gain during pregnancy in ratio 1:2) | 29.4 (16–41) med (range) | 16th, 20th, and 24th (at assessment) | NR 23.7 (19.4–27.8) kg/m2 med (range) |
| Liu (2021) [79] China NR | MCA-PI MCA-RI MCA-S/D ratio | GDM | 1268 | GDM pregnant women | NR NR | 31 mean | 38 mean (at assessment and delivery) | NR NR | 10,922 | Non-GDM pregnancies | No | 30 mean | 39 mean (at delivery, at assessment) | NR NR |
| Fatihoglu (2021) [80] Turkey prospective study | UA-PI UA-RI UA-S/D ratio MCA-PI MCA-RI MCA-S/D ratio | GDM | 60 | GDM pregnant women | NR NR | 32 (20–46) med (range) | at 18–22 (at assessment) | NR 30 (24–35) kg/m + med (range) | 61 | Healthy controls | Yes (gestational age) | 26 (18–38) med (range) | at 18–22 (at assessment) | NR 28 (24–32) med (range) |
| Chen (2021) [81] China cross-sectional study | UA-PI | GDM | 30 | Singleton diabetic pregnancies at 24–40 gw | Fasting blood glucose: 4.78 (3.64–7.41) mmol/L, med (IQR) 1 h plasma glucose: 10.45 (3.32–14.62) mmol/L, med (IQR) 2 h plasma glucose: 9.10 ± 1.73 5.50 (4.80–6.70), med (IQR) | 31.00 ± 2.92 | 36–40 gestational weeks (at assessment) 39.30 (37.20–40.1) med (IQR) 39.30 (37.20–40.1) med (IQR) (at delivery) | NR 21.76 (17.80–27.58) kg/m2, med (IQR) | 31 | Healthy pregnant mothers | No | 29.84 ± 3.07 | Fasting blood glucose: 4.29 (3.88–4.94) mmol/L med (IQR) 1 h plasma glucose: 6.91 (3.92–9.80) mmol/L med (IQR) 2 h plasma glucose: 6.46 ± 1.18 mmol/L | NR 21.00 (17.97–29.69) kg/m2 med (IQR) |
| Ali Hassan (2021) [82] Egypt prospective study | UA-PI UA-RI MCA-PI MCA-RI | GDM | 25 GDM 25 GDM + PE | Singleton pregnant women in 3rd trimester (28–39 gw) with age between 25–38 years with GDM, and combined GDM with PE defined as SBP > 140 mmHg and DBP > 90 mmHg) | NR NR | 25–38 (range) | 28–39 (at assessment) | NR NR | 25 | 3rd-trimester pregnant women of a single fetus between 28 and 39 gw without factor, checked by measuring fasting plasma glucose concentration < 140 mg/dL and HbA1c < 6.5%. | No | 25–38 (range) | 28–39 (at assessment) | NR NR |
| Jamal (2021) [83] Iran prospective cohort study | UA-PI UA-RI UA-S/D ratio MCA-PI MCA-RI MCA-S/D ratio | GDM | 123 | Pregnant women newly diagnosed with GDM at 24–28 gw treated with insulin or managed with diet | NR NR | 31.5 ± 5.4 | 37–40 (at assessment) 38.6 ± 0.8 (at delivery) | NR NR | 123 | Women without GDM | No | 29.7 ± 5.6 | 37–40 (at assessment) 38.9 ± 0.8 (at delivery) | NR NR |
| Perez-Martin (2022) [84] Spain Not clear (prospective and cross-sectional case control study) | UA-PI MCA-PI UtA-PI | GDM | 56 | GDM pregnancies | 83.6 ± 9.0 mg/dL 4.9 ± 0.3% | 35.5 ± 4.1 | 28–32 (at assessment) 38.6 ± 1.5 (at delivery) | 74.1 ± 18.9 kg (pregestational) 28.2 ± 6.2 kg/m2 (pregestational) | 65 | Physicologic pregnancies with normal glucose screening that were seen during the growth scan at 28–32 gw | No | 33 ± 5 | 30 ± 1.5 (at assessment) 39.3 ± 1.2 (at delivery) | 66.5 ± 13.2 kg (pregestational) 25.1 ± 4.6 kg/m2 (pregestational) |
| Chatzakis (2022) [85] Greece cross-sectional study | UA-PI UtA-PI | GDM | 25 | GDM pregnancies | NR NR | 32.4 ± 4.0 | 32 ± 2.5 (at assessment) | NR 27.3 ± 7.9 kg/m2 (prepregnancy) 30 ± 5.7 kg/m2 (at assessment) | 25 | Uncomplicated pregnancies | Yes (pre-pregnancy BMI, maternal age, and gestational age) | 30.4 ± 6.2 | 31 ± 3.2 (at assessment) | NR 25.1 ± 5.2 kg/m2 (prepregnancy) 28.6 ± 5.0 kg/m2 (at assessment) |
| Karaca Kutulmus (2022) [86] Turkey cross-sectional | UA-PI MCA-PI | GDM | 45 | GDM pregnant women with poor glycaemic control and appropriate-for-gestational-age or macrosomic fetuses between 28 and 39 gw | NR NR | 30.04 ± 5.33 | NR 33.13 ± 2.96 (at delivery) | NR NR | 49 | Healthy pregnant women on routine prenatal care with the appropriate-for-gestational-age fetuses between 29 and 41 gw | Yes (gestational age) | 28 ± 4.91 | 33.40 ± 3.22 (at delivery) | NR NR |
Disclaimer/Publisher’s Note: The statements, opinions and data contained in all publications are solely those of the individual author(s) and contributor(s) and not of MDPI and/or the editor(s). MDPI and/or the editor(s) disclaim responsibility for any injury to people or property resulting from any ideas, methods, instructions or products referred to in the content. |
© 2023 by the authors. Licensee MDPI, Basel, Switzerland. This article is an open access article distributed under the terms and conditions of the Creative Commons Attribution (CC BY) license (https://creativecommons.org/licenses/by/4.0/).
Share and Cite
Perkovic-Kepeci, S.; Cirkovic, A.; Milic, N.; Dugalic, S.; Stanisavljevic, D.; Milincic, M.; Kostic, K.; Milic, N.; Todorovic, J.; Markovic, K.; et al. Doppler Indices of the Uterine, Umbilical and Fetal Middle Cerebral Artery in Diabetic versus Non-Diabetic Pregnancy: Systematic Review and Meta-Analysis. Medicina 2023, 59, 1502. https://doi.org/10.3390/medicina59081502
Perkovic-Kepeci S, Cirkovic A, Milic N, Dugalic S, Stanisavljevic D, Milincic M, Kostic K, Milic N, Todorovic J, Markovic K, et al. Doppler Indices of the Uterine, Umbilical and Fetal Middle Cerebral Artery in Diabetic versus Non-Diabetic Pregnancy: Systematic Review and Meta-Analysis. Medicina. 2023; 59(8):1502. https://doi.org/10.3390/medicina59081502
Chicago/Turabian StylePerkovic-Kepeci, Sonja, Andja Cirkovic, Natasa Milic, Stefan Dugalic, Dejana Stanisavljevic, Milos Milincic, Konstantin Kostic, Nikola Milic, Jovana Todorovic, Ksenija Markovic, and et al. 2023. "Doppler Indices of the Uterine, Umbilical and Fetal Middle Cerebral Artery in Diabetic versus Non-Diabetic Pregnancy: Systematic Review and Meta-Analysis" Medicina 59, no. 8: 1502. https://doi.org/10.3390/medicina59081502
APA StylePerkovic-Kepeci, S., Cirkovic, A., Milic, N., Dugalic, S., Stanisavljevic, D., Milincic, M., Kostic, K., Milic, N., Todorovic, J., Markovic, K., Aleksic Grozdic, N., & Gojnic Dugalic, M. (2023). Doppler Indices of the Uterine, Umbilical and Fetal Middle Cerebral Artery in Diabetic versus Non-Diabetic Pregnancy: Systematic Review and Meta-Analysis. Medicina, 59(8), 1502. https://doi.org/10.3390/medicina59081502