Abstract
Background and Objectives: As is well understood, peroxisome proliferator-activated receptor gamma cofactor-related 1 (PPRC1) plays a central role in the transcriptional control of the mitochondrial biogenesis and oxidative phosphorylation (OXPHOS) process, yet its critical role in pan-cancer remains unclear. Materials and Methods: In this paper, the expression levels of PPRC1 in different tumor tissues and corresponding adjacent normal tissues were analyzed based on four databases: The Genotype-Tissue Expression (GTEx), Cancer Cell Line Encyclopedia (CCLE), The Cancer Genome Atlas (TCGA), and Tumor Immune Estimation Resource (TIMER). Meanwhile, the prognostic value of PPRC1 was inferred using Kaplan–Meier plotter and forest-plot studies. In addition, the correlation between PPRC1 expression and tumor immune cell infiltration, immune checkpoints, and the tumor-stemness index was analyzed using TCGA and TIMER databases. Results: According to our findings, the expression level of PPRC1 was found to be different in different cancer types and there was a positive correlation between PPRC1 expression and prognosis in several tumor types. In addition, PPRC1 expression was found to be significantly correlated with immune cell infiltration, immune checkpoints, and the tumor-stemness index in both ovarian and hepatocellular carcinoma. Conclusions: PPRC1 demonstrated promising potential as a novel biomarker in pan-cancer due to its potential association with immune cell infiltration, expression of immune checkpoints, and the tumor-stemness index.
1. Introduction
A tumor is a heterotrophic proliferative tissue, marked by locally abnormal proliferating cells that lose their regulatory effect on normal growth at the genetic level due to the activation of various carcinogenic factors and gene mutations in the organism resulting in clonal abnormal proliferation, which often manifests as a local mass. The development of a tumor is a multifactorial and multi-step process involving the proliferation, anti-apoptosis, enhanced angiogenesis, and immune escape of cancer cells. Cancer is a common malignant tumor in clinical practice, and this disease has a high mortality rate with rapid progression and causes great physical, psychological, and economic harm to patients [1,2]. Recent studies in the literature have shown that an important role in tumor-tissue microenvironment alteration is played by stromal cells and immune cells. Therefore, the discovery of new cancer biomarkers is also closely related to some key genes [3]. It is thus clear that a pan-cancer analysis not only allows the identification of key genes in different cancer types, but also attempts to summarize the diagnosis and treatment of more tumors by cross-tumor similarity [4,5], which fundamentally improves the effectiveness of cancer treatment.
The peroxisome proliferator-activated receptor γ cofactor (PGC) family is a well-known family of activated mitochondrial synthesis molecules, mainly PGC-1α (PPARGC1A), PGC-1β (PPARGC1B), and PRC (PPRC1) [6]. The PGC family plays a key role in regulating energy metabolism, maintaining glucose homeostasis, and lipid metabolism [7,8]. It is also a major regulator of mitochondrial oxidative energy metabolism and antioxidant defense [6]. PGC-1α can increase ATP production by regulating mitochondrial biosynthesis and energy metabolism, promoting tumor angiogenesis, and thus increasing tumor invasiveness by making it easier for cancer cells easier to proliferate, metastasize, and increase their degree of malignancy [9]. PGC-1β plays an important role in the formation of mitochondria and influences fat formation, repair of sport-related muscle injury, and regulation of vascular proliferation. Recent studies have also shown that PGC-1β affects the growth and proliferation of tumor cells such as breast cancer, liver cancer, and glioma [10,11,12]. Comparatively few studies on PPRC1 have investigated the similar biological functions between PGC-1α and PGC-1β [13,14], while many have shown that PPRC1 not only plays an important role in improving and promoting oxidative stress, inflammation, and metabolic reprogramming but is also critical in regulating mitochondrial biogenesis and maintaining expression by coordinating the metabolic stress response [15]. It is well known that tumorigenesis is closely related to oxidative stress, metabolic reprogramming, and the regulation of mitochondrial energy metabolism. Recent literature reports have also shown that PPRC1 not only participates in regulating glioblastoma [15,16,17] but also helps in diagnosing and understanding the pathogenesis of polymorphic low-grade neurons in young people [18]. Nevertheless, studies of the regulatory mechanism of PPRC1 in malignancy are rare and deserve further investigation.
In summary, we hypothesized that, based on the results of comprehensive analysis of multiple databases, PPRC1 expression was significantly correlated with tumor immune cells, immune-checkpoint genes, and tumor stemness. The results of the present study revealed that PPRC1 may be a potentially critical biomarker suggestive of prognosis in ovarian and hepatocellular carcinoma.
2. Method
2.1. Expression Level of PPRC1
First, we screened the expression of PPRC1 in normal tissues by the Genotype-Tissue Expression (GTEx) database and the expression of PPRC1 in tumor cell lines by the Cancer Cell Line Encyclopedia (CCLE) database. The expression of PPRC1 in normal and tumor tissues was inferred by integrating data from three databases, TIMER, The Cancer Genome Atlas (TCGA), and GTEx [19]. The “rma function” (http://www.r-project.org/ https://www.rstudio.com/, accessed on 17 July 2022) of R software (studio version: 1.2.1335, R version: 3.6.1, Ross Ihaka, Robert Gentleman, University of Auckland, New Zealand) was used to collate the entire dataset, exclude missing and duplicate results, and to analyze the results by the log2 (TPM + 1) analysis method for the final transformation of the eligible data.
2.2. Prognostic Role of PPRC1
First, the Kaplan–Meier statistical method was used to analyze the survival differences between the two groups of patients. Secondly, according to the statistical method of univariate Cox regression model, the favorable or unfavorable survival outcomes of PPRC1 were analyzed from three aspects: overall survival (OS), disease specific survival (DSS), and progression-free interval (PFI). The Cox regression forest map was formed using the R package “survivor” and “forest map”. In addition, the Kaplan–Meier plotter was used to further analyze the correlation between PPRC1 expression and survival rate (https://kmplot.com/Analysis/, accessed on 17 July 2022) [20,21,22].
2.3. Correlation of PPRC1 and Tumor Immune Cells
The TIMER database allowed us to perform correlation studies between PPRC1 and six types of immune cell infiltration, including B cells, CD4+ T cells, CD8+ T cells, neutrophils, macrophages, and dendritic cells
2.4. Relationship between PPRC1 with Checkpoint Genes and Tumor-Stemness Index
We first analyzed the correlation between the expression of 47 immune-checkpoint genes and the expression of PPRC1 in the TCGA database using Pearson’s method. Secondly, we analyzed the correlation between PPRC1 expression and tumor dryness index (DNAss) [20,21]. Previous studies have shown that the occurrence of certain diseases, such as cancer, is closely related to abnormal expression and dysfunction of immune-checkpoint molecules [22]. Using the “Tools” module on the Sangerbox website, we studied the correlation between PPRC1 and 47 immune-checkpoint-related genes (such as ADORA2A, BTLA, CD274, CD276, and CD200) in 34 cancer types. In addition, the correlation between PPRC1 expression and DNAss in each tumor was obtained by calculating the correlation test function in the R package “psych”.
2.5. Statistical Analysis
The R software version used in this paper was 3.6.3 (developed by Ross Ihaka, Robert Gentleman, University of Auckland, New Zealand), which includes the R packages “ggplot2”, “ggpubr”, “limma”, “survival”, “surveyor”, and “forestplot” [16,20]. The t-test was used to analyze continuous variables with normal distribution and correlation analysis using Pearson correlation analysis was mainly used to analyze correlation studies. A p-value < 0.05 indicated statistical significance. The statistical analysis for comparing PPRC1 expression in tumor and normal tissues was the Wilcoxon rank sum test. The correlation of PPRC1 expression with immune-checkpoint genes and R-immune infiltrating cells was also analyzed by Pearson correlation analysis, and a p value < 0.05 indicated a significant correlation.
3. Results
3.1. Expression Patterns of PPRC1 in Pan-Cancer
We analyzed the protein levels of PPRC1 in several public databases to analyze the expression of PPRC1 in different tumors. First, in order to demonstrate the protein expression level of PPRC1 in different tissues of healthy subjects, we used the data from the GTEx database for comprehensive analysis to obtain the final results. As shown in Figure 1A, although PPRC1 protein is expressed in 31 human tissues, there were differences in protein quantification of PPRC1 in different tissue types. Secondly, we obtained the protein expression of PPRC1 in different tumor cell lines through the CCLE database, and there were differences (Figure 1B). Next, in order to clarify whether PPRC1 is differentially expressed in tumors, we analyzed the expression of PPRC1 in cancer and normal tissues from the TCGA database. Due to the relatively small number of normal samples in the TCGA database, we integrated the results of the TCGA and GTEx databases to analyze the difference in PPRC1 expression. From the TCGA results in the TIMER database, we found that PPRC1 was differentially expressed in 12 of 33 tumors, but when the GTEx database contained more normal samples, it was observed that PPRC1 was differentially expressed in 27 of 33% of tumors (Figure 1C,D). These results indicate that PPRC1 has different expression in different tumors, indicating that PPRC1 plays an important role in the occurrence and development of tumors.
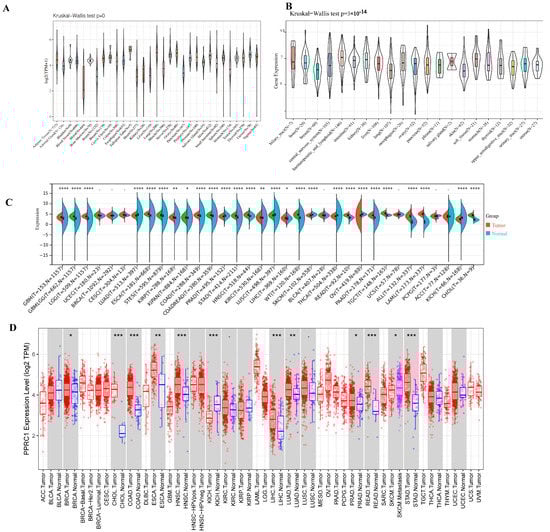
Figure 1.
Pan-cancer expression of PPRC1. The expression level of PPRC1 in normal tissues from the GTEx database (A) and different tumor cell lines in the CCLE database. The expression of PPRC1 in normal and tumor tissues was explored in integrated datasets containing TCGA (B) and GTEx datasets (C), and in the TIMER database (D). * p < 0.05; ** p < 0.01; *** p < 0.001, **** p < 0.0001.
3.2. Prognostic Role of PPRC1 in Pan-Cancer
To further analyze the prognostic value of PPRC1 for survival in pan-cancer, we first analyzed the correlation between PPRC1 expression and different survival outcomes in various cancers, such as OS, DSS, and PFI. Survival analysis showed that high PPRC1 expression in six tumors, including Adrenocortical carcinoma (ACC), Bladder Urothelial Carcinoma (BLCA), Kidney renal papillary cell carcinoma (KIRP), Liver hepatocellular carcinoma (LIHC), Ovarian serous cystadenocarcinoma (OV), and Skin Cutaneous Melanoma(SKCM), was associated with poorer OS (Figure 2A–F). The forest plots suggest that the hazard ratios (HRs) of PPRC1 in pan-cancer and PPRC1 in the six cancer types were significantly different, for example, ACC (HR = 1. 07, p < 0.0001), BLCA (HR = 1.01, p = 0.030), KIRP (HR = 1.05, p = 0.0015), LIHC (HR = 1.02, p = 0.0220), OV (HR = 1.01, p = 0.0420), and SKCM (HR = 1.01, p = 0.0075) (Figure 2G).
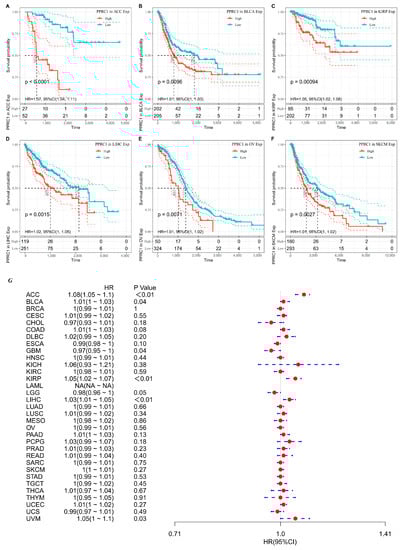
Figure 2.
The association of PPRC1 with OS. Kaplan–Meier-plotted survival analysis of different expression levels of PPRC1 from the TCGA database. The OS of ACC (A), BLCA (B), KIRP (C), LIHC (D), OV (E), and SKCM (F) in patients with higher or lower PPRC1 expression. The forest plot shows the hazard ratios of PPRC1 in pan-cancer (G).
As for DSS, tumor patients with lower PPRC1 expression were found to have better survival outcomes in ACC, KIRP and LIHC, while higher PPRC1 was correlated with better DSS in Esophageal carcinoma(ESCA)patients (Figure 3A–D). The forest plot showed that PPRC1 was associated with DFI in 4 tumors: ACC (HR = 1.07, p = 0.0020), ESCA (HR = 0.98, p = 0.0410), KIRP (HR = 1.06, p = 0.0410), and LIHC (HR = 1.02, p = 0.0250) (Figure 3E).
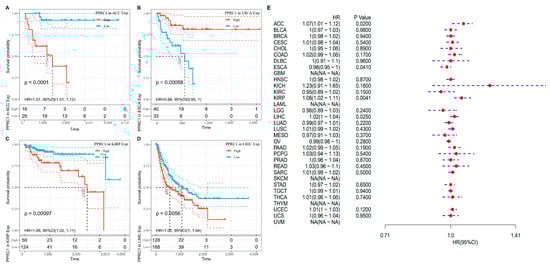
Figure 3.
The association of PPRC1 with DSS. Kaplan–Meier-plotted survival analysis revealed the DSS of ACC (A), ESCA (B), KIRP (C), and LIHC (D) in patients with different expression levels of PPRC1. The forest plot showed the hazard ratios of PPRC1 in pan-cancer (E).
Based on Kaplan–Meier plotter database, we detected the relationship between PPRC1 expression and different stage of LIHC and OV. In OV, a higher expression level of PPRC1 was associated with poor prognosis at stages 2 and 4, while in LIHC, a higher expression level of PPRC1 was correlated with poor prognosis at stage 3 (Table 1).

Table 1.
Correlation of PPRC1 expression and stage in OV and LIHC.
The PFI results showed that high expression of PPRC1 was significantly correlated with six cancer types, with a positive correlation with GBM and a negative correlation with ACC, BLCA, KIRP, LIHC, and UVM (Figure 4A–F). The results of univariate Cox regression analysis suggested that, PPRC1 was a risk factor for ACC (HR = 1.08, p < 0.0001), BLCA (HR = 1.01, p = 0.0460), KIRP (HR = 1.05, p = 0.0011), LIHC (HR = 1.03, p = 0.0013), and UVM (HR = 1.05, p = 0.0310) (Figure 4G).
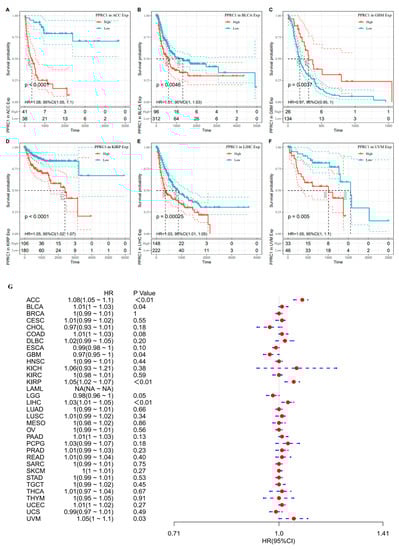
Figure 4.
The association of PPRC1 with PFI. Kaplan–Meier-plotted survival analysis revealed the PFI of ACC (A), BLCA (B), GBM (C), KIRP (D), LIHC (E), and UVM (F). The forest plot shows the hazard ratios of PPRC1 in pan-cancer (G).
Immunohistochemistry is a cell biological technique that utilizes the highly specific characteristics of the binding of antibodies and antigens to ultimately detect the location and expression of a certain protein in cells. The Human Protein Atlas (HPA) (https://www.proteinatlas.org, accessed on 17 July 2022) is the largest and most complete atlas of egg-protein expression in all major tissues and organs of the human body. It provides in-depth information on the location and expression of all characteristic egg-like proteins from seven different levels, including tissue specificity, drug resistance, carcinogenicity, and regulation. Through the HPA database we found differences in PPRC1 expression between normal tissues and ovarian cancer and liver cancer tissues. IHC results showed that the protein expression of PPRC1 was upregulated in ovarian cancer and liver cancer tissues compared to normal tissues. These results are consistent with the results predicted by our data.
Based on the high specificity of binding between antibodies and antigens, immunohistochemistry can reveal the relative distribution and abundance of proteins. The Human Protein Atlas (HPA) (https://www.proteinatlas.org, accessed on 17 July 2022) is the largest and most comprehensive human tissue, cell, and protein spatial distribution database, with enormous capabilities and potential application prospects. We used HPA database to observe the differences in PPRC1 expression between normal tissues and ovarian cancer and liver cancer tissues. IHC results showed that the protein expression of PPRC1 in ovarian cancer and liver cancer tissues were upregulated compared to normal tissues. These results confirmed our findings (Figure S1).
Using the TIMER database, we investigated the correlation between the PPRC1 expression and mutation status. The results showed that the tumors with the highest frequencies of PPRC1 mutations were UCE, SKCM, and COAD, while the frequency of PPRC1 mutations in OV and LIHC were 0.7% and 0.5%, respectively (Figure S2).
We analyzed the role of PPRC1 in the prognosis of pan-cancer using Kaplan–Meier plotter and univariate Cox regression statistical methods. The above results suggest that in LIHC, ACC, and OV PPRC1 can be a potentially important prognostic factor.
3.3. Correlation of PPRC1 and Immune Cells
Since immune cells in the tumor microenvironment are an important factor in targeting immunotherapy [23,24], we focused on exploring the correlation between PPRC1 expression and immune cells in pan-cancer. Our results showed that the proportion of tumor immune cells (B cells, CD4+ T cells, CD8+ T cells, neutrophils, macrophages, and dendritic cells) was significantly correlated with PPRC1 expression in 33 out of 38 tumor types. At least four immune cell ratios were significantly correlated with PPRC1 expression in 14 tumors, including LIHC, THCA, PCPG, PRAD, KIPAN, PAAD, KIRP, KICH, KIRC, SKCM-M, SKCM, BLCA, GBMLGG, and OV. In particular, we found a significant correlation between the ratio of immune cells and PPRC1 expression in LIHC, THCA, KIRP, and KICH, and OV, KIRP, KICH, and OV, PPRC1 expression had a positive correlation with the proportion of immune cells, while in SKCM-M and SKCM it had a negative correlation (Figure 5).
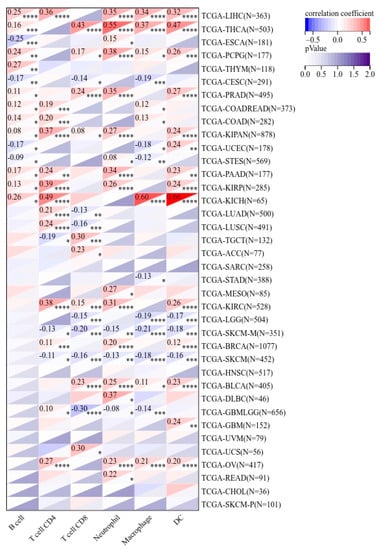
Figure 5.
The correlation of PPRC1 expression and immune cell infiltration. * p < 0.05; ** p < 0.01; *** p < 0.001, **** p < 0.0001.
3.4. Relationship between PPRC1 Expression and Immune-Checkpoint Genes
It is well known that immune checkpoints play an important immunomodulatory function in tumors by suppressing the immune system, maintaining immune tolerance to human autoantigens, and regulating the functional state of target cells through corresponding ligand interactions [25,26]. In the current study, we screened the correlation between the expression of 47 immune-checkpoint genes and PPRC1. Our results showed a significant positive correlation between PPRC1 expression and the expression of 47 immune-checkpoint genes, except for UCEC, TGCT, SKCM, and SARC (Figure 6). Especially in OV and LIHC, PPRC1 expression was also positively correlated with the expression of most immune-checkpoint genes. Taken together, it can be seen that PPRC1 can provide some guidance for tumor immunotherapy and promote personalized treatment of pan-cancer.
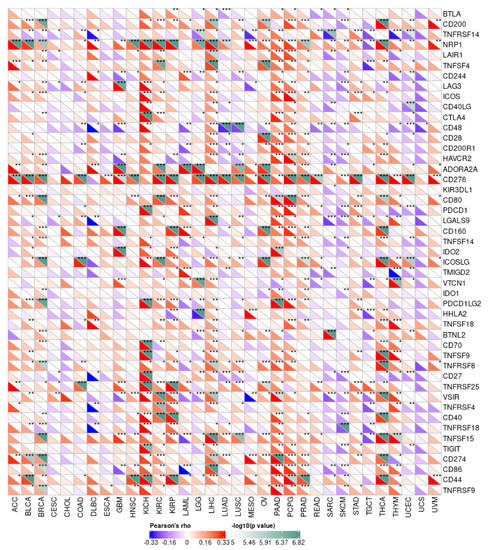
Figure 6.
The correlation of PPRC1 expression and tumor immune checkpoints. * p < 0.05; ** p < 0.01; *** p < 0.001.
3.5. Relationship between PPRC1 Expression and Tumor-Stemness Score
Tumor stem cells are known to promote tumor progression, recurrence, metastasis, and drug resistance [27]. DNA methylation results were used to calculate the tumor-stemness index, called DNAss. Pearson analysis showed that the expression of PPRC1 was negatively correlated with DNAss of OV, GBMLGG, and LIHC, while it was positively correlated with DNAss of TGCT, UVM, and THYM (Figure 7).
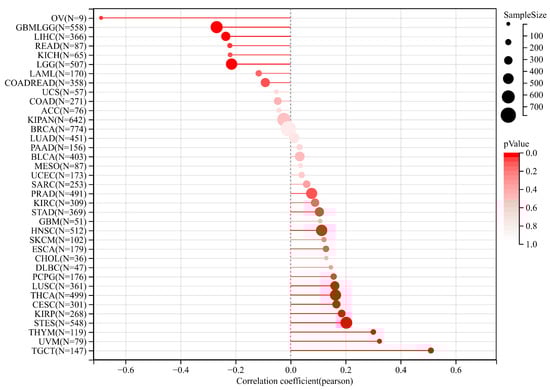
Figure 7.
The correlation of PPRC1 expression and tumor-stemness index.
4. Discussion
Firstly, through comprehensive analysis of data information from multiple databases, we found that the expression level of PPRC1 in different tumors is different. Secondly, combined with clinical-information data, we speculated that the expression of PPRC1 is negatively correlated with survival outcomes in ovarian cancer (OV) and liver hepatocellular carcinoma (LIHC) in terms of OS, DSS, and PFI. We found that the expression of PPRC1 is closely related to the clinical stages of LIHC and OV, indicating that screening for potential biomarkers has important clinical significance in guiding the prognosis of clinical stages. IHC staining can be used to verify the correlation between clinical stages and PPRC1 protein-expression levels. The HPA database is based on proteomics, transcriptomics, and systems biology data, which extensively includes information on protein expression in various tumors and normal tissues. Therefore, we compared the differences in PPRC1 expression among normal tissue, ovarian cancer, and cancer using the HPA database. IHC results showed that PPRC1 protein expression levels were upregulated in ovarian cancer and cancer tissues compared to normal tissues. These data results are consistent with our predicted data results. To confirm that the sequence of PPRC1 in different cancers was complete, we explored the relationship between PPRC1 expression and mutation status through the TIMER database. The results suggested that the tumors with the highest frequency of PPRC1 mutations are UCE, SKCM, and COAD. The frequency of PPRC1 mutations in OV and LIHC was only 0.7% and 0.5%. It can be seen that the expression of PPRC1 is related to the difference in the level of immune-cell infiltration. Our results even showed that the difference in PPRC1 expression was significantly correlated with the infiltration levels of CD4+ T cells, CD8+ T cells, B cells, DC, and macrophages. In particular, in LIHC and OV, the expression of PPRC1 is positively correlated with the proportion of DC, macrophages, and neutrophils, while in SKCM-M and SKCM, it is negatively correlated. In addition, in the tumor microenvironment, we found that PPRC1 expression in LIHC and OV had the same trend as some immune-cell molecular markers such as CD200, CD200R1, and LAIR1, although, in SKCM we found that PPRC1 expression had the opposite trend to that of some immune cell molecular markers. The underlying reason for these phenomena is the differential enrichment patterns in the tumor microenvironment. Finally, the heterogeneity of PPRC1 expression in different tumor types suggests that it is oncogenic, a result consistent with some previous reports in the literature [28,29,30].
In addition, there is a significant positive correlation between the expression of PPRC1 and tumor immunity in OV and LIHC. This is fundamentally due to the fact that CD4+ T cell-mediated cellular dynamics and membrane receptors can stimulate the antitumor activity of cytotoxic T lymphocytes (CTLs) [31,32]. At the same time, the combination of macrophage aggregation, anti-inflammatory macrophage reduction, and pro-inflammatory (anti-tumor) macrophage increase can play a role in tumor immunotherapy [33]. The key links in the occurrence and development of tumors are carcinogenic mutations, proliferation, and functional enhancement of tissue precursor cells (such as tissue damage and regeneration), as well as the establishment of a proinflammatory environment for tumors. Because neutrophils are an important immune component in inflammatory reactions, they play a key role in the occurrence and development of tumors. A large amount of literature has pointed out that neutrophils have a cancer-promoting effect, and they also directly support tumor-cell proliferation through various paracrine signaling pathways. In the tumor microenvironment, neutrophils also exhibit a high degree of plasticity, and together, this drives the cancer-promotion mechanism. Recently, research on the tumor microenvironment has found that there is an interaction between cancer and neutrophils. In addition, another key function of neutrophils is their ability to influence the behavior of other immune cells; inhibiting the anticancer activity of other immune cells is also one of their tumor-promoting functions [34]. Dendritic cells are a heterogeneous group of white blood cells composed of different subpopulations, which not only drive specific types of immune response, but also initiate and regulate adaptive immune responses, thereby exerting an anti-tumor immune response [35]. The expression level of PPRC1 can predict the survival time of patients, and can also infer the infiltration of immune cells in OV and LIHC [36]. Therefore, it is clear that only by fully regulating the expression level of PPRC1 can we indirectly regulate the anti-tumor immune response, thereby exerting an immunotherapeutic effect [37]. Although immunotherapy has been recognized as one of the most promising tumor-treatment methods, its efficacy varies depending on the type of tumor [38]. Therefore, screening new tumor immune markers and potential therapeutic targets is of importance in the anti-tumor field.
Cancer stem cells are not only a class of tumor cell that can self-renew and produce heterogeneity, but they also play an important role in tumor formation, proliferation, metastasis, and recurrence [39,40]. A dryness index based on methylation data is known as DNAss. When the stem-cell index approaches 1, it suggests that cell differentiation tends to decrease and stem-cell characteristics tend to intensify. In the present study, PPRC1 expression was found to be negatively correlated with DNAss in most tumors, especially in OV, GBM, and LIHC, suggesting that low PPRC1 expression corresponds to a strong tumor cell stem, which also suggests easy promotion of tumor proliferation and metastasis. In addition, the negative correlation between PPRC1 expression and DNAss has an important predictive role in determining the efficacy of immunosuppressive therapy.
Unfortunately there were still some shortcomings in this study. Although we used various bioinformatics databases to speculate on the close relationship between PPRC1 and tumor immune cells, there was no way to carry out more experiments to verify this hypothesis. Therefore, future research should focus more on using different experimental methods to verify the diagnostic and prognostic potential of PPRC1 in many cancers. Secondly, although the prognostic value of PPRC1 has been plausibly explained, how PPRC1 exerts a mechanism to regulate immune viability has not been clarified, and this requires more detailed studies at a later stage. In addition to this, further validation of our preliminary screening results at the molecular and clinical levels is needed to clarify the importance of PPRC1 in pan-cancer.
5. Conclusions
Generally speaking, the results of this study have led to the important conclusion that differences in PPRC1 expression in different malignant tumors seriously affect the survival time of tumor patients as PPRC1 expression is upregulated in a variety of cancers and is associated with poorer prognosis. In addition, the results suggest that the expression of PPRC1 may regulate tumor immunity in OV and LIHC. In the future, research on PPRC1 expression and tumor immune microenvironment may help to provide clear answers and provide immune-based anti-cancer strategies.
Supplementary Materials
The following supporting information can be downloaded at: https://www.mdpi.com/article/10.3390/medicina59040784/s1, Figure S1: The differences in PPRC1 expression between normal tissues and ovarian cancer, liver cancer from the HPA database; Figure S2: Correlation between expression of PPRC1 and mutation status in TIMER database.
Author Contributions
X.R. designed the study and wrote the article; G.C. and C.L. were responsible for data collection and statistical analysis; Z.S. contributed to the review of this article. All authors have read and agreed to the published version of the manuscript.
Funding
Guangxi Traditional Chinese Medicine Clinical Excellent Talents Project (GZYF (2022) No. 7).
Institutional Review Board Statement
Not applicable.
Informed Consent Statement
Not applicable.
Data Availability Statement
All data generated or analyzed during this study are included within the article.
Acknowledgments
The authors sincerely thank those who participated in this study for their contributions.
Conflicts of Interest
The authors declare that they have no conflict of interest.
References
- Miller, K.D.; Ortiz, A.P.; Pinheiro, P.S.; Bandi, P.; Minihan, A.; Fuchs, H.E.; Martinez Tyson, D.; Tortolero-Luna, G.; Fedewa, S.A.; Jemal, A.M.; et al. Cancer statistics for the US Hispanic/Latino population, 2021. CA Cancer J. Clin. 2021, 71, 466–487. [Google Scholar] [CrossRef] [PubMed]
- Byrd, D.R.; Brierley, J.D.; Baker, T.P.; Sullivan, D.C.; Gress, D.M. Current and future cancer staging after neoadjuvant treatment for solid tumors. CA Cancer J. Clin. 2021, 71, 140–148. [Google Scholar] [CrossRef] [PubMed]
- Liu, X.; Yu, S.; Feng, C.; Mao, D.; Li, J.; Zhu, X. In Situ Analysis of Cancer Cells Based on DNA Signal Amplification and DNA Nanodevices. Crit. Rev. Anal. Chem. 2021, 51, 8–19. [Google Scholar] [CrossRef] [PubMed]
- Urbanek-Trzeciak, M.O.; Galka-Marciniak, P.; Nawrocka, P.M.; Kowal, E.; Szwec, S.; Giefing, M.; Kozlowski, P. Pan-cancer analysis of somatic mutations in miRNA genes. EBioMedicine 2020, 61, 103051. [Google Scholar] [CrossRef]
- Liu, J.; Wang, Y.; Yin, J.; Yang, Y.; Geng, R.; Zhong, Z.; Ni, S.; Liu, W.; Du, M.; Yu, H.; et al. Pan-Cancer Analysis Revealed SRSF9 as a New Biomarker for Prognosis and Immunotherapy. J. Oncol. 2022, 2022, 3477148. [Google Scholar] [CrossRef]
- Luo, C.; Widlund, H.R.; Puigserver, P. PGC-1 Coactivators: Shepherding the Mitochondrial Biogenesis of Tumors. Trends Cancer 2016, 2, 619–631. [Google Scholar] [CrossRef]
- Puigserver, P.; Wu, Z.; Park, C.W.; Graves, R.; Wright, M.; Spiegelman, B.M. A cold-inducible coactivator of nuclear receptors linked to adaptive thermogenesis. Cell 1998, 92, 829–839. [Google Scholar] [CrossRef]
- Singh, F.; Zoll, J.; Duthaler, U.; Charles, A.L.; Panajatovic, M.V.; Laverny, G.; McWilliams, T.G.; Metzger, D.; Geny, B.; Krähenbühl, S.; et al. PGC-1β modulates statin-associated myotoxicity in mice. Arch. Toxicol. 2019, 93, 487–504. [Google Scholar] [CrossRef]
- Chambers, J.M.; Wingert, R.A. PGC-1α in Disease: Recent Renal Insights into a Versatile Metabolic Regulator. Cells 2020, 9, 2234. [Google Scholar] [CrossRef]
- Victorino, V.J.; Barroso, W.A.; Assunção, A.K.; Cury, V.; Jeremias, I.C.; Petroni, R.; Chausse, B.; Ariga, S.K.; Herrera, A.C.; Panis, C.; et al. PGC-1β regulates HER2-overexpressing breast cancer cells proliferation by metabolic and redox pathways. Tumour Biol. J. Int. Soc. Oncodev. Biol. Med. 2016, 37, 6035–6044. [Google Scholar] [CrossRef]
- Li, Y.; Kasim, V.; Yan, X.; Li, L.; Meliala, I.T.S.; Huang, C.; Li, Z.; Lei, K.; Song, G.; Zheng, X.; et al. Yin Yang 1 facilitates hepatocellular carcinoma cell lipid metabolism and tumor progression by inhibiting PGC-1β-induced fatty acid oxidation. Theranostics 2019, 9, 7599–7615. [Google Scholar] [CrossRef]
- Wang, H.; Yan, X.; Ji, L.Y.; Ji, X.T.; Wang, P.; Guo, S.W.; Li, S.Z. miR-139 Functions as An Antioncomir to Repress Glioma Progression Through Targeting IGF-1 R, AMY-1, and PGC-1β. Technol. Cancer Res. Treat. 2017, 16, 497–511. [Google Scholar] [CrossRef]
- Mori, M.P.; Souza-Pinto, N.C. PPRC1, but not PGC-1α, levels directly correlate with expression of mitochondrial proteins in human dermal fibroblasts. Genet. Mol. Biol. 2020, 43 (Suppl. 1), e20190083. [Google Scholar] [CrossRef]
- Cribbs, A.P.; Terlecki-Zaniewicz, S.; Philpott, M.; Baardman, J.; Ahern, D.; Lindow, M.; Obad, S.; Oerum, H.; Sampey, B.; Mander, P.K.; et al. Histone H3K27me3 demethylases regulate human Th17 cell development and effector functions by impacting on metabolism. Proc. Natl. Acad. Sci. USA 2020, 117, 6056–6066. [Google Scholar] [CrossRef]
- Tsai, H.F.; Chang, Y.C.; Li, C.H.; Chan, M.H.; Chen, C.L.; Tsai, W.C.; Hsiao, M. Type V collagen alpha 1 chain promotes the malignancy of glioblastoma through PPRC1-ESM1 axis activation and extracellular matrix remodeling. Cell Death Discov. 2021, 7, 313. [Google Scholar] [CrossRef]
- Yu, G.; Wang, L.G.; Han, Y.; He, Q.Y. clusterProfiler: An R package for comparing biological themes among gene clusters. Omics A J. Integr. Biol. 2012, 16, 284–287. [Google Scholar] [CrossRef]
- Mou, C.; Liu, B.; Wang, M.; Jiang, M.; Han, T. PGC-1-related coactivator (PRC) is an important regulator of microglia M2 polarization. J. Mol. Neurosci. MN 2015, 55, 69–75. [Google Scholar] [CrossRef]
- Ge, R.; Fang, H.F.; Chang, Y.Q.; Li, Z.; Liu, C.F. Clinicopathological features of polymorphous low-grade neuroepithelial tumor of the young. Zhonghua Bing Li Xue Za Zhi Chin. J. Pathol. 2020, 49, 1131–1135. [Google Scholar]
- Cui, G.; Wang, C.; Lin, Z.; Feng, X.; Wei, M.; Miao, Z.; Sun, Z.; Wei, F. Prognostic and immunological role of Ras-related protein Rap1b in pan-cancer. Bioengineered 2021, 12, 4828–4840. [Google Scholar] [CrossRef]
- Malta, T.M.; Sokolov, A.; Gentles, A.J.; Burzykowski, T.; Poisson, L.; Weinstein, J.N.; Kamińska, B.; Huelsken, J.; Omberg, L.; Gevaert, O.; et al. Machine Learning Identifies Stemness Features Associated with Oncogenic Dedifferentiation. Cell 2018, 173, 338–354.e315. [Google Scholar] [CrossRef]
- Hou, G.X.; Liu, P.; Yang, J.; Wen, S. Mining expression and prognosis of topoisomerase isoforms in non-small-cell lung cancer by using Oncomine and Kaplan-Meier plotter. PLoS ONE 2017, 12, e0174515. [Google Scholar] [CrossRef] [PubMed]
- Lv, Z.; Qi, L.; Hu, X.; Mo, M.; Jiang, H.; Fan, B.; Li, Y. Zic Family Member 2 (ZIC2): A Potential Diagnostic and Prognostic Biomarker for Pan-Cancer. Front. Mol. Biosci. 2021, 8, 631067. [Google Scholar] [CrossRef] [PubMed]
- Lei, X.; Lei, Y.; Li, J.K.; Du, W.X.; Li, R.G.; Yang, J.; Li, J.; Li, F.; Tan, H.B. Immune cells within the tumor microenvironment: Biological functions and roles in cancer immunotherapy. Cancer Lett. 2020, 470, 126–133. [Google Scholar] [CrossRef]
- Soularue, E.; Lepage, P.; Colombel, J.F.; Coutzac, C.; Faleck, D.; Marthey, L.; Collins, M.; Chaput, N.; Robert, C.; Carbonnel, F. Enterocolitis due to immune checkpoint inhibitors: A systematic review. Gut 2018, 67, 2056–2067. [Google Scholar] [CrossRef] [PubMed]
- Hargadon, K.M.; Johnson, C.E.; Williams, C.J. Immune checkpoint blockade therapy for cancer: An overview of FDA-approved immune checkpoint inhibitors. Int. Immunopharmacol. 2018, 62, 29–39. [Google Scholar] [CrossRef]
- Hoos, A. Development of immuno-oncology drugs—From CTLA4 to PD1 to the next generations. Nat. Rev. Drug Discov. 2016, 15, 235–247. [Google Scholar] [CrossRef]
- Lytle, N.K.; Barber, A.G.; Reya, T. Stem cell fate in cancer growth, progression and therapy resistance. Nat. Rev. Cancer 2018, 18, 669–680. [Google Scholar] [CrossRef]
- Huss, J.M.; Torra, I.P.; Staels, B.; Giguère, V.; Kelly, D.P. Estrogen-related receptor alpha directs peroxisome proliferator-activated receptor alpha signaling in the transcriptional control of energy metabolism in cardiac and skeletal muscle. Mol. Cell. Biol. 2004, 24, 9079–9091. [Google Scholar] [CrossRef]
- Alaynick, W.A. Nuclear receptors, mitochondria and lipid metabolism. Mitochondrion 2008, 8, 329–337. [Google Scholar] [CrossRef]
- Kemper, M.F.; Zhao, Y.; Duckles, S.P.; Krause, D.N. Endogenous ovarian hormones affect mitochondrial efficiency in cerebral endothelium via distinct regulation of PGC-1 isoforms. J. Cereb. Blood Flow Metab. 2013, 33, 122–128. [Google Scholar] [CrossRef]
- Anderson, N.R.; Minutolo, N.G.; Gill, S.; Klichinsky, M. Macrophage-Based Approaches for Cancer Immunotherapy. Cancer Res. 2021, 81, 1201–1208. [Google Scholar] [CrossRef]
- Wei, F.; Zhang, T.; Deng, S.C.; Wei, J.C.; Yang, P.; Wang, Q.; Chen, Z.P.; Li, W.L.; Chen, H.C.; Hu, H.; et al. PD-L1 promotes colorectal cancer stem cell expansion by activating HMGA1-dependent signaling pathways. Cancer Lett. 2019, 450, 1–13. [Google Scholar] [CrossRef]
- Santoni, M.; Massari, F.; Montironi, R.; Battelli, N. Manipulating macrophage polarization in cancer patients: From nanoparticles to human chimeric antigen receptor macrophages. Biochim. Biophys. Acta Rev. Cancer 2021, 1876, 188547. [Google Scholar] [CrossRef]
- Giese, M.A.; Hind, L.E.; Huttenlocher, A. Neutrophil plasticity in the tumor microenvironment. Blood 2019, 133, 2159–2167. [Google Scholar] [CrossRef]
- Lee, Y.S.; Radford, K.J. The role of dendritic cells in cancer. Int. Rev. Cell Mol. Biol. 2019, 348, 123–178. [Google Scholar]
- Swann, J.B.; Smyth, M.J. Immune surveillance of tumors. J. Clin. Investig. 2007, 117, 1137–1146. [Google Scholar] [CrossRef]
- Li, B.; Chan, H.L.; Chen, P. Immune Checkpoint Inhibitors: Basics and Challenges. Curr. Med. Chem. 2019, 26, 3009–3025. [Google Scholar] [CrossRef]
- Iwai, Y.; Hamanishi, J.; Chamoto, K.; Honjo, T. Cancer immunotherapies targeting the PD-1 signaling pathway. J. Biomed. Sci. 2017, 24, 26. [Google Scholar] [CrossRef]
- Chen, D.; Menon, H.; Verma, V.; Guo, C.; Ramapriyan, R.; Barsoumian, H.; Younes, A.; Hu, Y.; Wasley, M.; Cortez, M.A.; et al. Response and outcomes after anti-CTLA4 versus anti-PD1 combined with stereotactic body radiation therapy for metastatic non-small cell lung cancer: Retrospective analysis of two single-institution prospective trials. J. Immunother. Cancer 2020, 8, e000492. [Google Scholar] [CrossRef]
- Zeng, D.; Li, M.; Zhou, R.; Zhang, J.; Sun, H.; Shi, M.; Bin, J.; Liao, Y.; Rao, J.; Liao, W. Tumor Microenvironment Characterization in Gastric Cancer Identifies Prognostic and Immunotherapeutically Relevant Gene Signatures. Cancer Immunol. Res. 2019, 7, 737–750. [Google Scholar] [CrossRef]
Disclaimer/Publisher’s Note: The statements, opinions and data contained in all publications are solely those of the individual author(s) and contributor(s) and not of MDPI and/or the editor(s). MDPI and/or the editor(s) disclaim responsibility for any injury to people or property resulting from any ideas, methods, instructions or products referred to in the content. |
© 2023 by the authors. Licensee MDPI, Basel, Switzerland. This article is an open access article distributed under the terms and conditions of the Creative Commons Attribution (CC BY) license (https://creativecommons.org/licenses/by/4.0/).