
New Method of Cardiac Lead Evaluation Using Chest Radiography


Abstract
:1. Introduction
2. Materials and Methods
2.1. Inclusion Criteria
- -
- Assessment of the position of the leads for determining lead dislocations;
- -
- Looking for any damage;
- -
- Planning for the next electrocardiology procedure;
- -
- A current or threatening complication;
- -
- Diagnosing a pneumothorax;
- -
- Diagnosing a perforation and other analyses.
2.2. Exclusion Criteria
- -
- Patients with chest radiography images performed in positions other than those desired, e.g., in a prone position;
- -
- Patients with X-ray images whose technical quality was considered to be insufficient for analysis;
- -
- Patients with other than standard cardiac pacemaker devices implanted such as a cardioverter-defibrillator (ICD) or cardiac resynchronization (CRT);
- -
- Patients with implanted leads whose thickness exceeded 9 Fr;
- -
- Patients with discarded leads whose presence could affect the image of the leads that were selected for analysis.
2.3. Image Analysis
2.4. Measurements
2.5. Statistical Analysis
- ICC below 0.4—poor compliance
- ICC 0.4–0.6—average compliance
- ICC 0.6–0.75—high compliance
- ICC 0.75–1—very high compliance
3. Results
Evaluation of the Reliability/Repeatability of the Measurements
4. Discussion
Study Limitations
5. Conclusions
Author Contributions
Funding
Institutional Review Board Statement
Informed Consent Statement
Data Availability Statement
Conflicts of Interest
Appendix A

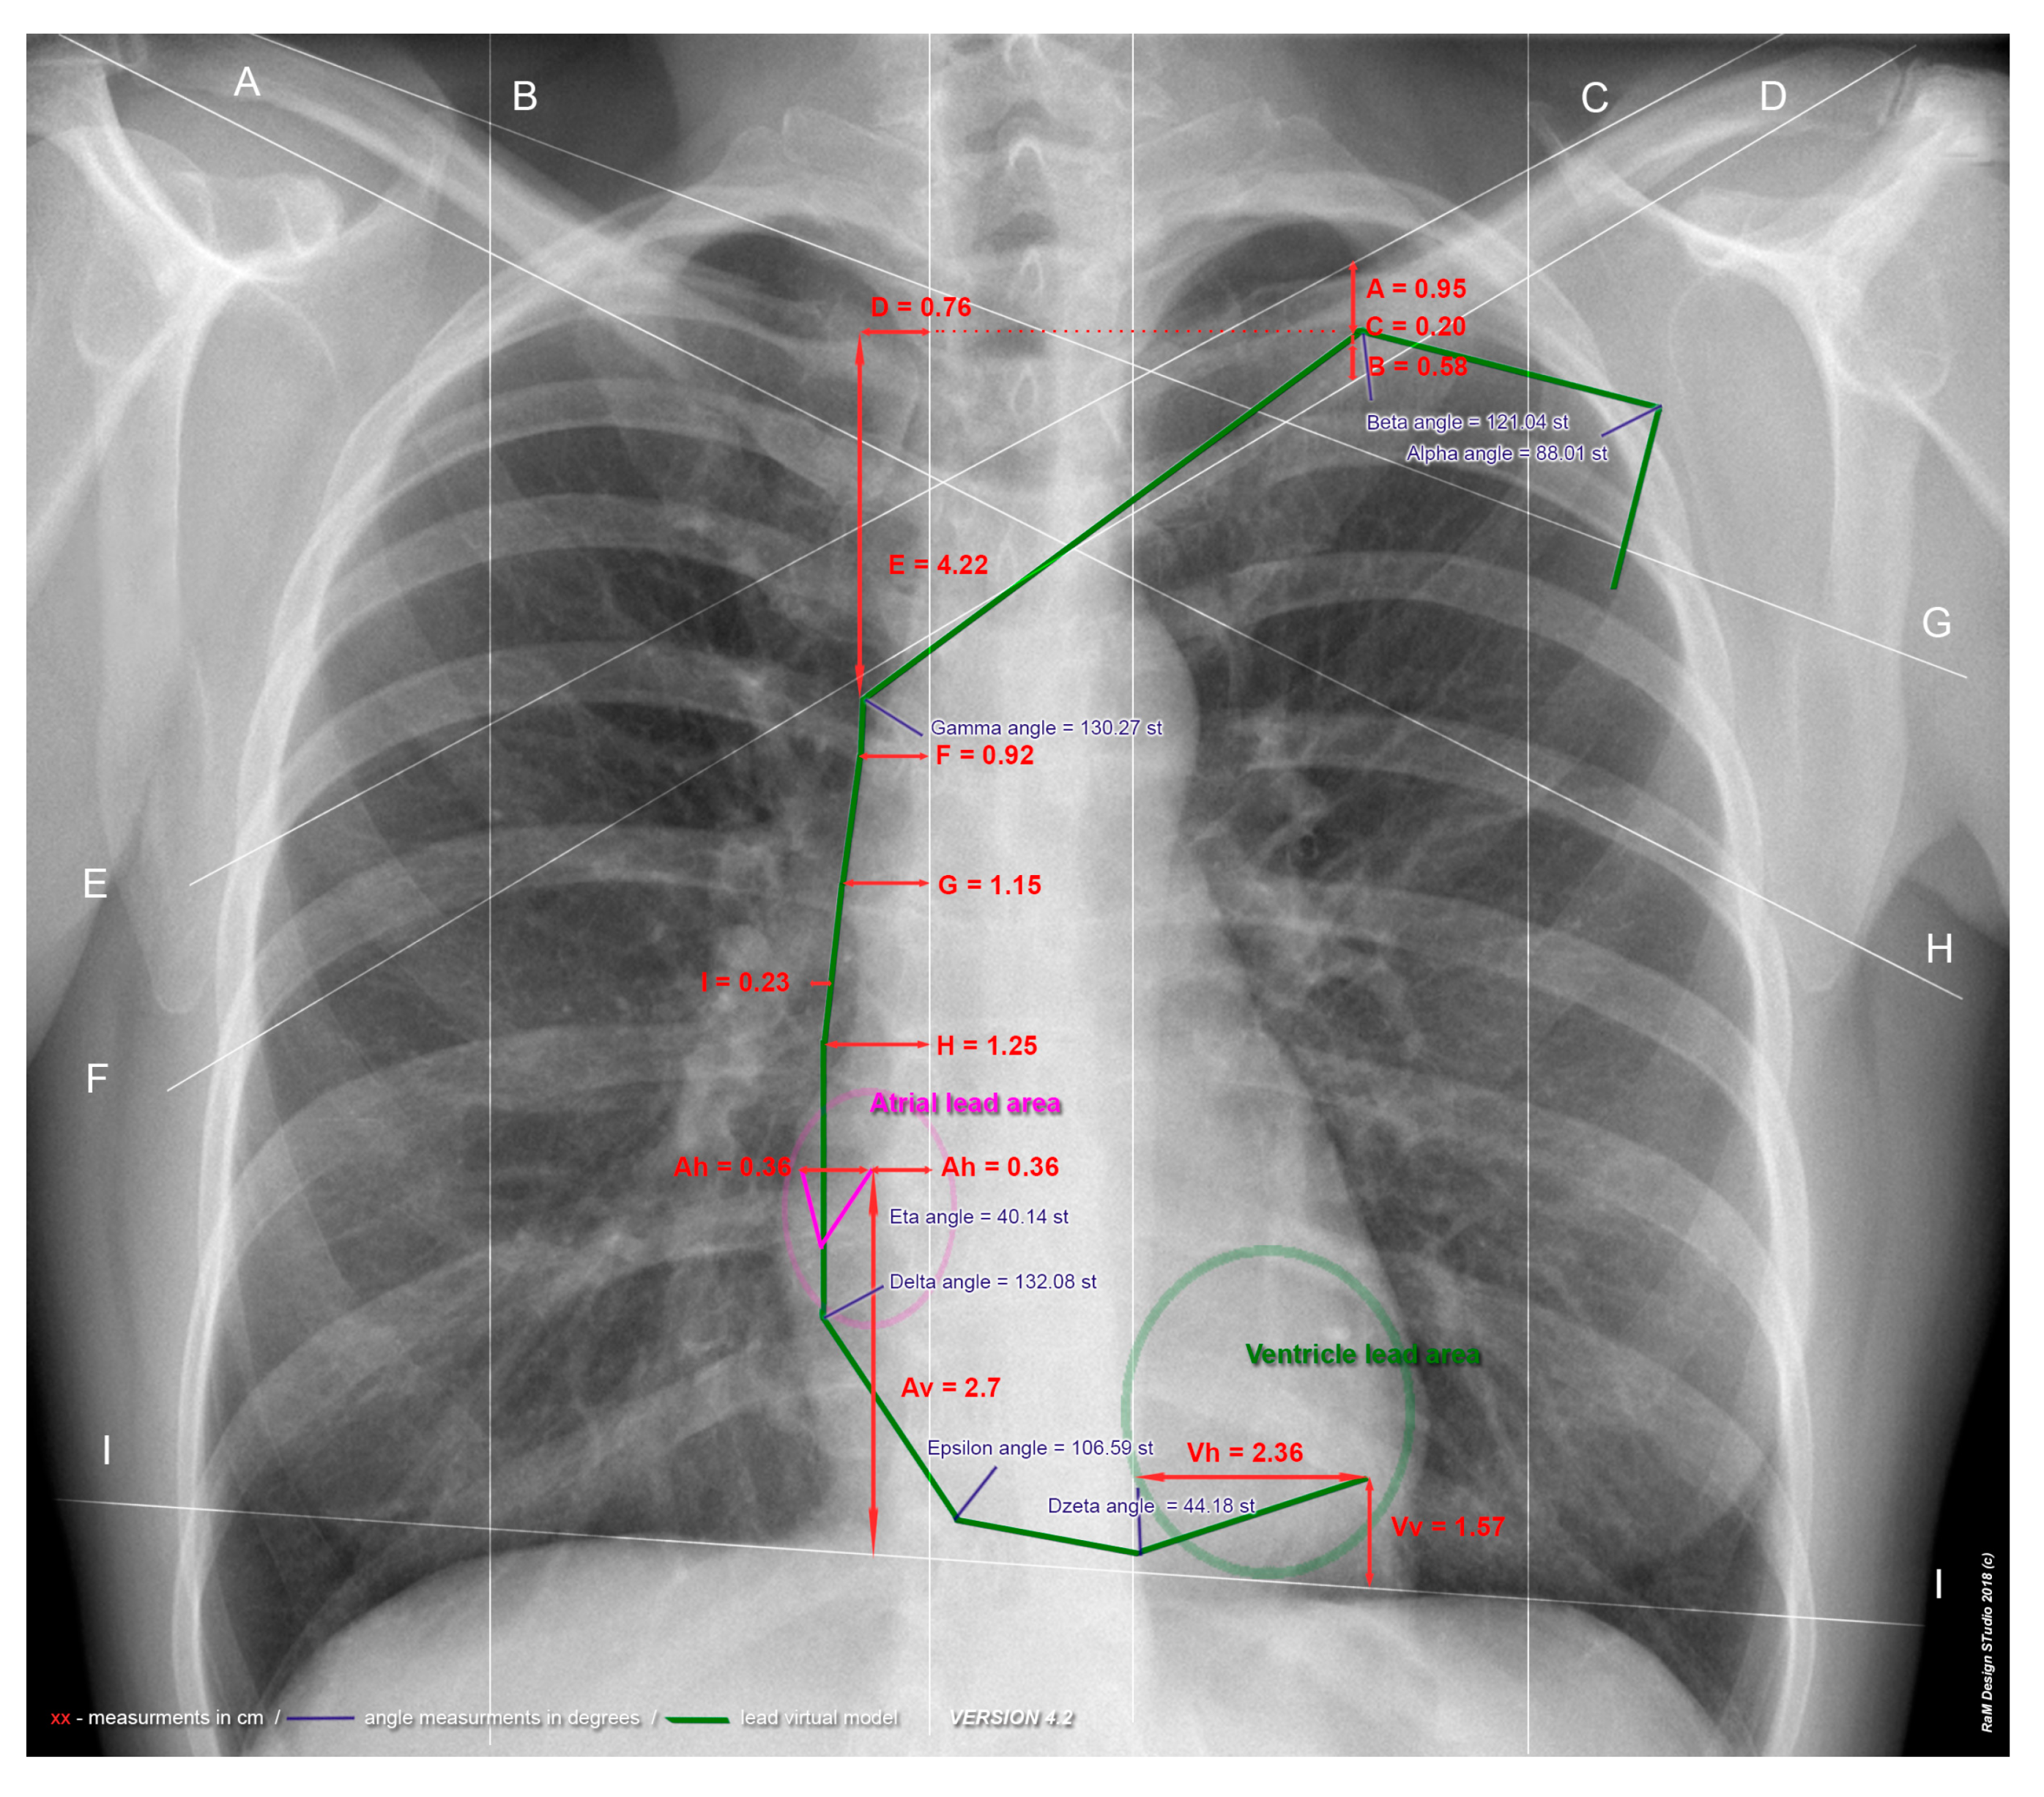
| Parameter | Description |
|---|---|
| Alpha angle | The intersection angle of the two semi-straight lines designated as the tangent lines to the two main lead axes, to the highest point of the highest lead (half straight 1) and to the rightmost point of the lead (half straight 2). |
| Beta angle | Intersection angle of two semi-straight lines designated as tangents to the two main axes of the leads, directed towards the upper edge of the clavicle. |
| A | Distance from the upper edge of the clavicle to the highest lead (the measurement is taken to the center of the lead structure) |
| B | Distance from the lower edge of the clavicle to the lowest lead (the measurement is taken to the center of the lead structure) |
| C | The largest distance between both leads, if applicable (measurement taken to the center of the lead structure). |
| D | Distance from the right sternal line (b) to the furthest swing of the farthest lead from the right sternal line (b). The measurement is made at the highest point of the higher lead. In selected cases, this measurement may be consistent with measurement F. |
| E | Distance from the highest point of the higher lead to the farthest deflection of the farthest lead from the right side (b) |
| Gamma angle | Intersection angle of two semi-straight lines designated as tangents to the two main axes of the leads. In the case of this angle, the beginning of the upper half straight was the point of the highest lead, while in the case of the left half straight, the point of the farthest deflection of the farthest lead from the right intra-castal line (b). Using these points and the course of the leads, semi-straight lines were determined, and the gamma angle was measured at the intersection of the half-straight lines. This angle is the anatomical equivalent of the death bend. |
| F | Distance between the lead closer to the right sternal line (measurement taken to the center of the lead structure) and the right sternal line. Three consecutive measurements taken: F measurement at the place of the hypothetical completion of the death bend; H measurement at the site of the entrance of the superior vena cava to the right atrium; while measuring G halfway between them. |
| G | |
| H | |
| I | Measurement of the largest distance between leads on the section between the measurement of distance F and H. |
| Eta angle | The intersection angle of the two half-straight lines designated for the atrial lead: half-straight line 1 connects to point eta 1 (the descending part of lead A) with the lowest point of the eta 2 bend; half straight 2 connects eta 2 point to eta 3 point (located at the tip of the atrial lead (tip) |
| Ah | The distance from the end of the atrial lead (tip) up to the right atrial line (b). Measurement taken perpendicular to the right intra-sternal line (b). |
| Av | The distance from the end of the atrial lead (tip) up to the line of the diaphragm domes (i). Measurement carried out parallel to the right intra-sternal line (b). |
| Delta angle | The intersection angle of two semi-rectangular lead structures in the center, in the area of the tricuspid valve 20 mm in the proximal and distal direction of the lead. |
| Epsilon angle | Intersection angle of two semi-rectangular lead structures in the center, approximately 15 mm below the tricuspid valve. Half-straight lines were determined as the tangent of the lead 20 mm in the proximal and distal directions of the lead. |
| Dzeta angle | The intersection angle of the two semi-straight lines determined to the lowest point of the ventricular lead (dzeta 2), directed towards the implantation destination (tip—zeta 3). Half straight line 1 was determined to be closer to 20 mm from point dzeta 3. |
| Vh | Distance from the end of the ventricular lead (tip) up to the left lateral sternal line (c). |
| Vv | Distance from the end of the ventricular lead (tip) up to the line of the diaphragm domes (i). In the case where the lead tip was down from line (i) the value was negative. |
References
- Furman, S.; Schwedel, J. An intracardiac pacemaker for Stokes-Adams seizures. N. Engl. J. Med. 1959, 261, 943–948. [Google Scholar] [CrossRef] [PubMed]
- Mond, H.; Sloman, J.; Edwards, R. The first pacemaker. Pacing Clin. Electrophysiol. 1982, 5, 278–282. [Google Scholar] [CrossRef] [PubMed]
- Kargul, W.; Młynarski, R.; Piłat, E. Implantation of pacemakers and cardioverter-defibrillators. Pol. Surg. 2005, 7, 267–279. [Google Scholar]
- European Society of Cardiology (ESC); European Heart Rhythm Association (EHRA); Brignole, M.; Auricchio, A.; Baron-Esquivias, G.; Bordachar, P.; Boriani, G.; Breithardt, O.; Cleland, J.; Deharo, J.; et al. 2013 ESC guidelines on cardiac pacing and cardiac resynchronization therapy: The task force on cardiac pacing and resynchronization therapy of the European Society of Cardiology (ESC). Developed in collaboration with the European Heart Rhythm Association (EHRA). Eur. Heart J. 2013, 15, 1070–1118. [Google Scholar] [CrossRef]
- Aguilera, A.; Volokhina, Y.; Fisher, K. Radiography of cardiac conduction devices: A comprehensive review. Radiographics 2011, 31, 1669–1682. [Google Scholar] [CrossRef] [PubMed]
- R Core Team. R: A Language and Environment for Statistical Computing; R Foundation for Statistical Computing: Vienna, Austria, 2018; Available online: https://www.R-project.org/ (accessed on 14 March 2016).
- Edwards, N.; Varma, M.; Pitcher, D. Routine chest radiography after permanent pacemaker implantation: Is it necessary? J. Postgrad. Med. 2005, 51, 92–96. [Google Scholar] [PubMed]
- Harcombe, A.A.; Newell, S.A.; Ludman, P.F.; Wistowa, T.E.; Sharplesb, L.D.; Schofielda, P.M.; Stonea, D.L.; Shapiroa, L.M.; Colea, T.; Petcha, M.C. Late complications following permanent pacemaker implantation or elective unit replacement. Heart 1998, 80, 240–244. [Google Scholar] [CrossRef] [PubMed] [Green Version]
- Steiner, R.; Tegtmeyer, C.; Morse, D.; Moses, M.; Goodman, L.R.; Nanda, N.; Pavin, C.E.; Parsonnet, V.; Flicker, S. The radiology of cardiac pacemakers. Radiographics 1986, 6, 373–399. [Google Scholar] [CrossRef] [PubMed] [Green Version]
- Bejvan, S.; Ephron, J.; Takasugi, J.; Godwin, J.; Bardy, G. Imaging of cardiac pacemakers. AJR Am. J. Roentgenol. 1997, 169, 1371–1379. [Google Scholar] [CrossRef] [PubMed] [Green Version]
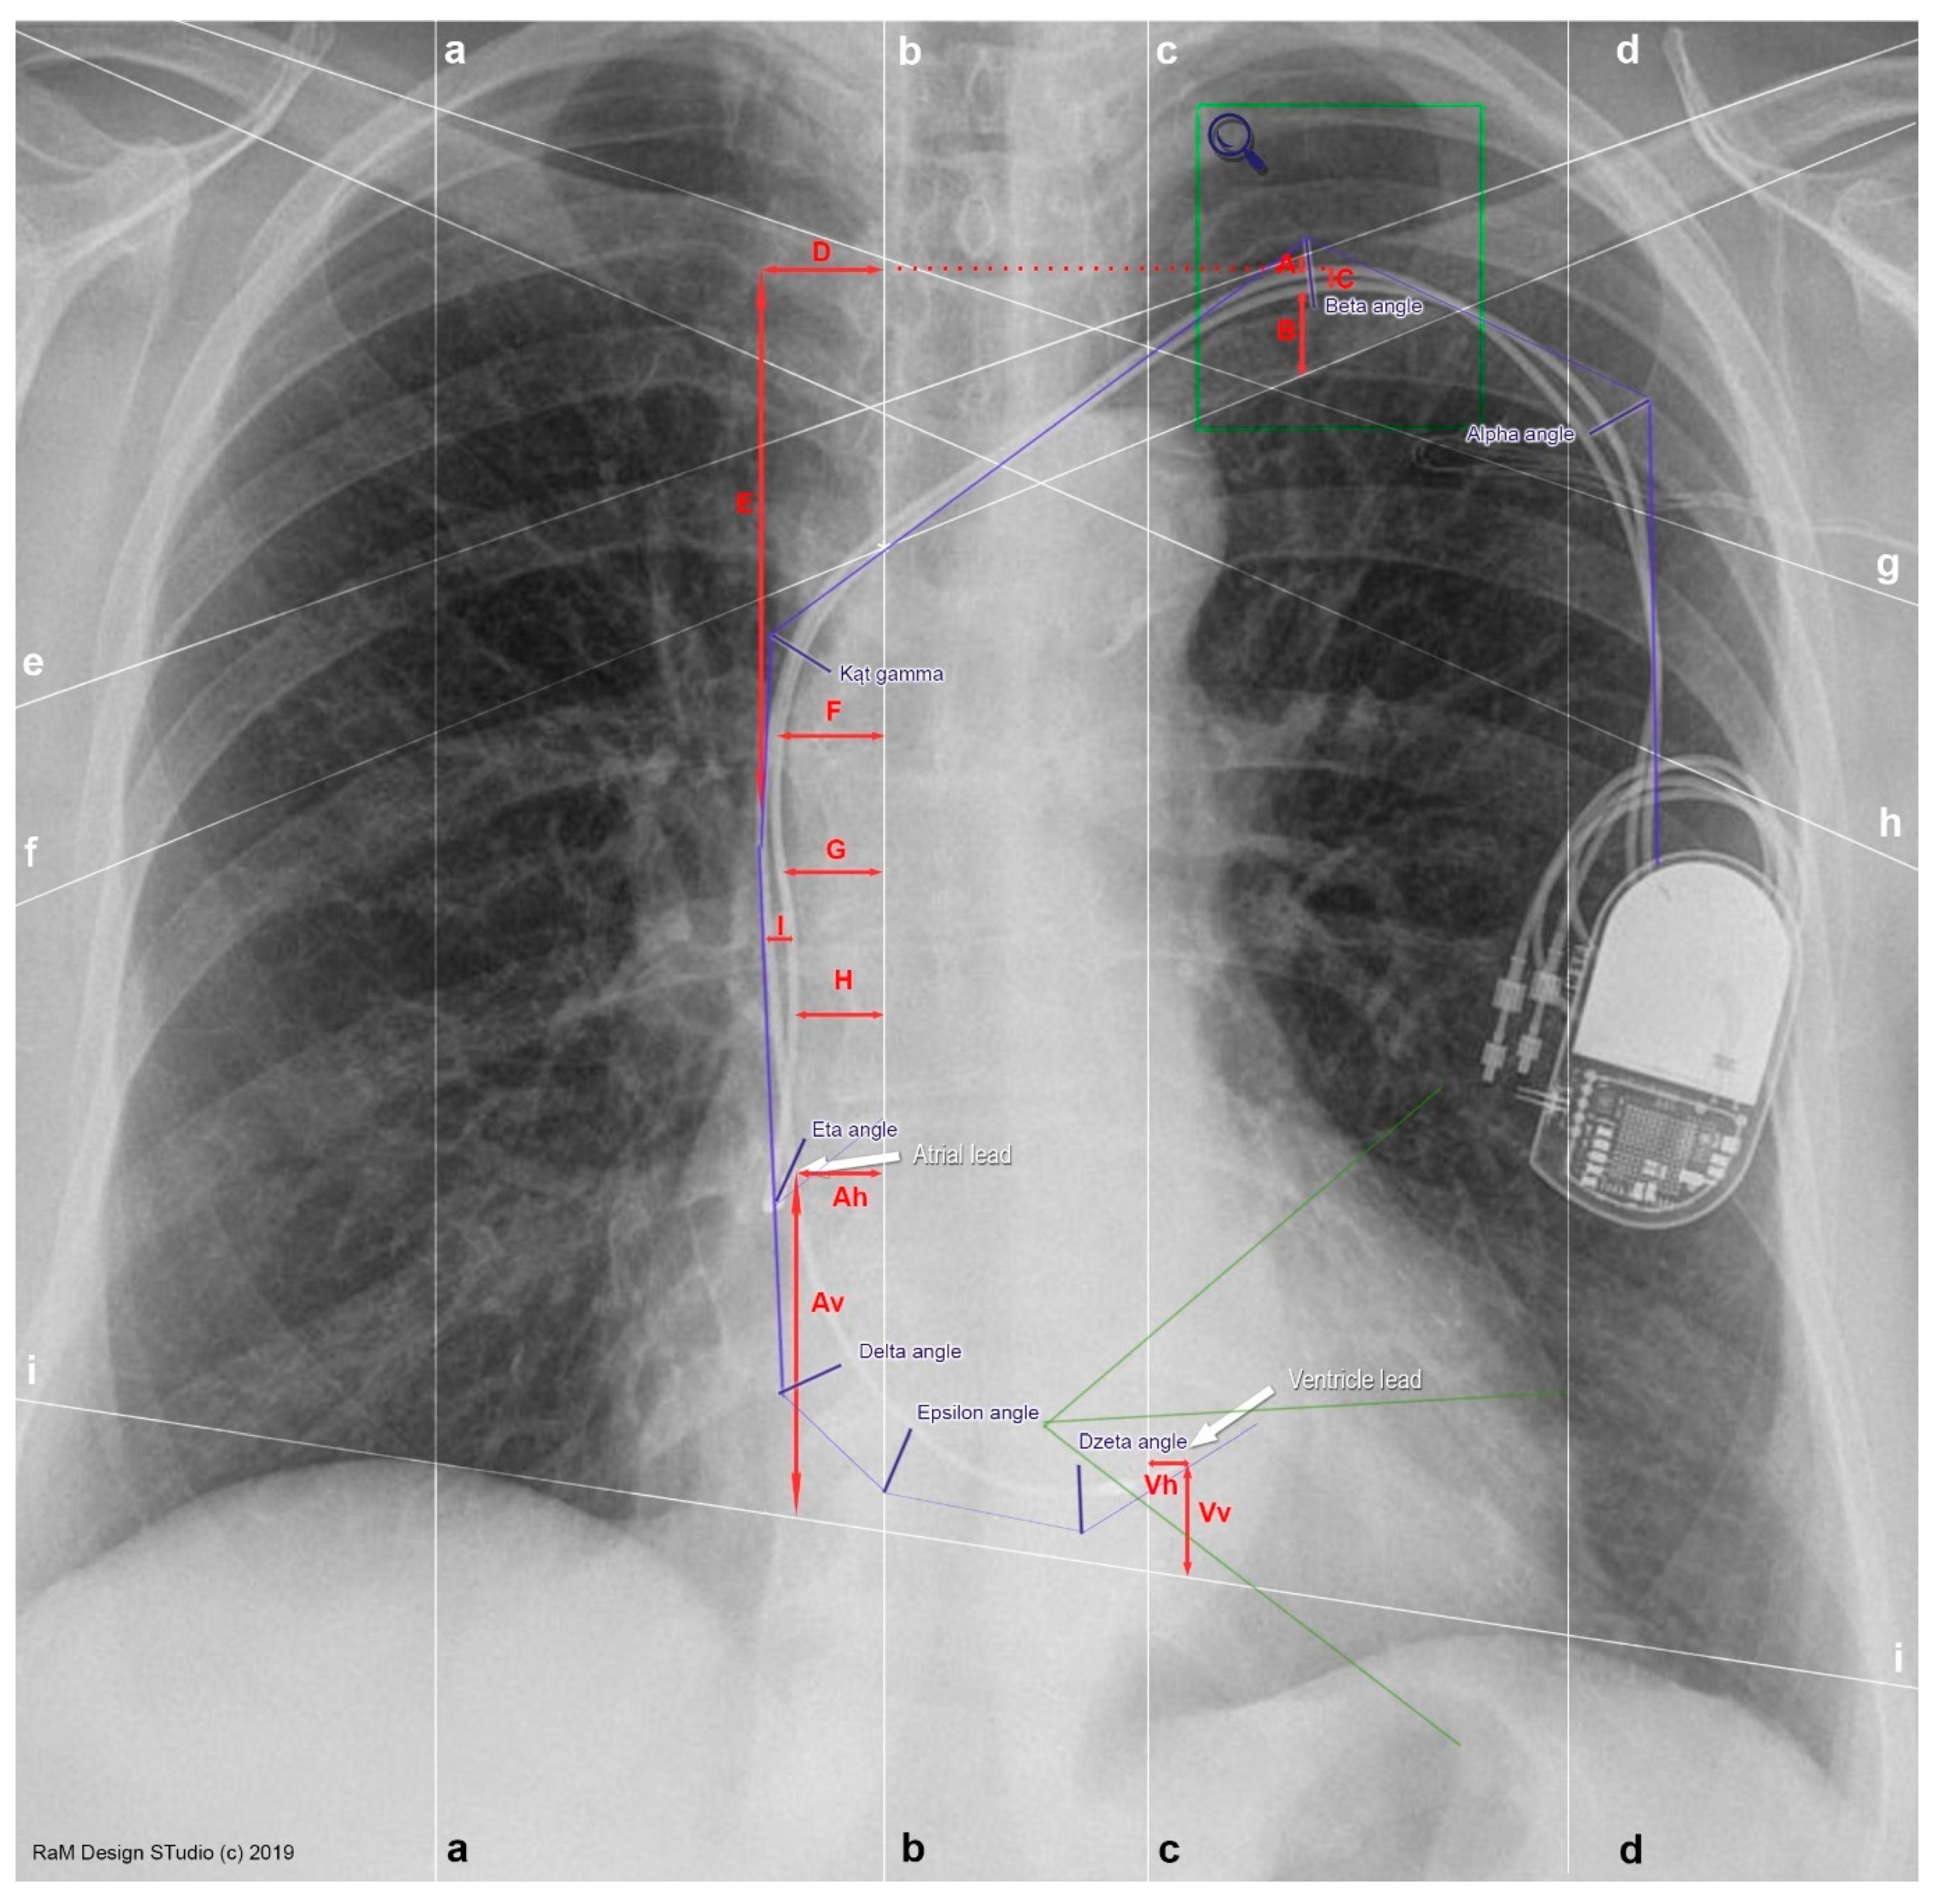
| a | Midclavicular line—right |
| The right midclavicular line runs through the center of the clavicle and then through the right nipple (in women it does not always run through the nipple) and is parallel to the other lines on the chest. | |
| b | Lateral sternal line—right |
| The lateral sternal line runs laterally from the median anterior line along the right lateral edge of the sternum. | |
| c | Lateral sternal line—left |
| The lateral sternal line runs laterally from the median anterior line along the left lateral edge of the sternum. | |
| d | Midclavicular line—left |
| The left midclavicular line runs through the center of the clavicle and then through the right nipple (in women it does not always run through the nipple) and is parallel to the other lines on the chest. | |
| e | Upper clavicular line—left |
| Upper clavicular line—left is the tangent line to the upper, visible surface of the left clavicle passing through the upper part of the sternum end of the clavicle and the conical nodule. | |
| f | Lower clavicular line—left |
| Lower clavicular line—left is the tangent line to the lower, visible surface of the left clavicle passing through the lower part of the sternum, end of the clavicle and the subclavian muscle furrow (if visible). | |
| g | Upper clavicular line—right |
| Upper clavicular line—right is the tangent line to the upper, visible surface of the right clavicle passing through the upper part of the sternum, end of the clavicle and the conical nodule. | |
| h | Lower clavicular line—right |
| Lower clavicular line—right is the tangent line to the lower, visible surface of the right clavicle passing through the lower part of the sternum, end of the clavicle and the subclavian furrow (if visible). | |
| i | Diaphragm dome line |
| A line connecting both diaphragm domes. | |
| Feature | Value ± SD | |
|---|---|---|
| Age (years) | mean ± SD | 72.04 ± 13 |
| Weight (kg) | mean ± SD | 76.53 ± 14.72 |
| Height (cm) | mean ± SD | 164.63 ± 9.1 |
| BMI (kg/m2) | mean ± SD | 28.29 ± 5.26 |
| Gender | Female | 58 (58.59%) |
| Male | 41 (41.41%) | |
| Main reason for the X-ray examination | Pleural edema | 3 (3.03%) |
| Pleural edema and lead position | 11 (11.11%) | |
| Procedure planning | 80 (80.81%) | |
| Lead position | 3 (3.03%) | |
| Lack of data | 2 (2.02%) | |
| Time since pacemaker implantation | Up to 30 days | 77 (77.78%) |
| More than 30 days | 21 (21.21%) | |
| Lack of data | 1 (1.01%) | |
| Feature | Values | Feature | Values |
|---|---|---|---|
| Alfa angle (°) | 88.01 ± 49.79 | F (cm) | 0.92 ± 0.52 |
| Beta angle (°) | 121.04 ± 23.87 | G (cm) | 1.15 ± 0.65 |
| A (cm) | 0.95 ± 0.49 | H (cm) | 1.25 ± 0.71 |
| B (cm) | 0.58 ± 0.57 | I (cm) | 0.23 ± 0.21 |
| C (cm) | 0.2 ± 0.22 | Eta angle (°) | 40.14 ± 40.35 |
| D (cm) | 0.76 ± 0.37 | Ah (cm) | 0.36 ± 1.46 |
| E (cm) | 4.22 ± 1.43 | Av (cm) | 2.7 ± 3.06 |
| Gamma angle (°) | 130.27 ± 15.78 | Delta angle (°) | 132.08 ± 14.15 |
| F (cm) | 0.92 ± 0.52 | Epsilon angle (°) | 106.6 ± 56.53 |
| Parameter/Measurements | Inter-Rater Variability | Intra-Rater Variability | ||
|---|---|---|---|---|
| Alfa angle | 0.999 | very high agreement | 0.99 | very high agreement |
| Beta angle | 0.992 | very high agreement | 0.959 | very high agreement |
| A | 0.935 | very high agreement | 0.922 | very high agreement |
| B | 0.827 | very high agreement | 0.824 | very high agreement |
| C | 0.776 | very high agreement | 0.74 | high agreement |
| D | 0.826 | very high agreement | 0.709 | high agreement |
| E | 0.792 | very high agreement | 0.883 | very high agreement |
| Gamma angle | 0.903 | very high agreement | 0.927 | very high agreement |
| F | 0.94 | very high agreement | 0.946 | very high agreement |
| G | 0.941 | very high agreement | 0.937 | very high agreement |
| H | 0.873 | very high agreement | 0.904 | very high agreement |
| I | 0.812 | very high agreement | 0.858 | very high agreement |
| Eta angle | 0.455 | average agreement | 0.45 | average agreement |
| Ah | 0.983 | very high agreement | 0.986 | very high agreement |
| Av | 0.994 | very high agreement | 0.994 | very high agreement |
| Delta angle | 0.979 | very high agreement | 0.978 | very high agreement |
| Epsilon angle | 0.982 | very high agreement | 0.979 | very high agreement |
| Dzeta angle | 0.833 | very high agreement | 0.854 | very high agreement |
| Vh | 0.994 | very high agreement | 0.995 | very high agreement |
| Vv | 0.992 | very high agreement | 0.988 | very high agreement |
Publisher’s Note: MDPI stays neutral with regard to jurisdictional claims in published maps and institutional affiliations. |
© 2022 by the authors. Licensee MDPI, Basel, Switzerland. This article is an open access article distributed under the terms and conditions of the Creative Commons Attribution (CC BY) license (https://creativecommons.org/licenses/by/4.0/).
Share and Cite
Mlynarski, R.; Glowoc, S.; Mlynarska, A.; Golba, K. New Method of Cardiac Lead Evaluation Using Chest Radiography. Medicina 2022, 58, 222. https://doi.org/10.3390/medicina58020222
Mlynarski R, Glowoc S, Mlynarska A, Golba K. New Method of Cardiac Lead Evaluation Using Chest Radiography. Medicina. 2022; 58(2):222. https://doi.org/10.3390/medicina58020222
Chicago/Turabian StyleMlynarski, Rafal, Sebastian Glowoc, Agnieszka Mlynarska, and Krzysztof Golba. 2022. "New Method of Cardiac Lead Evaluation Using Chest Radiography" Medicina 58, no. 2: 222. https://doi.org/10.3390/medicina58020222
APA StyleMlynarski, R., Glowoc, S., Mlynarska, A., & Golba, K. (2022). New Method of Cardiac Lead Evaluation Using Chest Radiography. Medicina, 58(2), 222. https://doi.org/10.3390/medicina58020222