
Expression of Selected Genes and Circulating microRNAs in Patients with Celiac Disease


 ,
,  ,
,  ,
, 
 , and
, and
Abstract
:1. Introduction
2. Materials and Methods
2.1. Patients and Controls
2.2. RNA Isolation and Quantitative Real-Time Polymerase Chain Reaction (qRT-PCR) Evaluation
- TNF alfa left: 5′ AGCCCATGTTGTAGCAAACC 3′;
- TNF alfa right: 5′ TCTCAGCTCCACGCATT 3′;
- WNT3 left: 5′ CCTGCAAGTAGGGCACCA 3′;
- WNT3 right: 5′ CCCATGAGACTTCGCTGAAT 3′;
- WNT11 left: 5′ AGCTCGCCCCAACTATT 3′;
- WNT 11 right: 5′ ATACACGAAGGCCGACTCC 3′;
- CCND1 left: 5′ GCTGTGCATCTACACCGACA 3′;
- CCND1 right: 5′ TTGAGCTTGTTCACCAGGAG 3′;
- PIK3CA left: 5′ CGAGATCCTCTCTCTGAAATCAC3′;
- PIK3CA right: 5′ GAATTTCGGGGATAGTTACACAA 3′;
- AKT3 left: 5′ TTGCTTTCAGGGCTCTTGAT 3′;
- AKT3 right: 5′ CATAATTTCTTTTGCATCATCTGG 3′;
- MAPK1 left: 5′ GTTCAGAACTACCCCCTGCTT 3′;
- MAPK 1 right: 5′ CAGAGACGCAGAATGACTGG 3′.
- Beta-2-microglobulin (B2M) left: 5′ CACCCCCACTGAAAAAGATGAG 3′;
- B2M right: 5′ CCTCCATGATGCTGCTTACATG 3′;
- Ribosomal protein, large, P0 (RPLPO) left: 5′ CCCAATTGTCCCCTTACCTT 3′;
- RPLPO right: 5′ ACCCAGCTCTGGAGAAGTCA3′;
- miR-194-5p, Life technology, cat No. 477956;
- miR-449a, Life technology, cat No. 478561;
- miR-192-5p, Life technology, cat No. 478262;
- miR-638, Life technology, cat No. 478187;
- U6 small nuclear RNA (U6), Life technology, cat No. 001973;
- Small nucleolar RNA, C/D box 48 (RNU48), Life technology, cat No. 001006.
2.3. Statistical Analysis
3. Results
3.1. General Characteristics of CD Patients and Controls
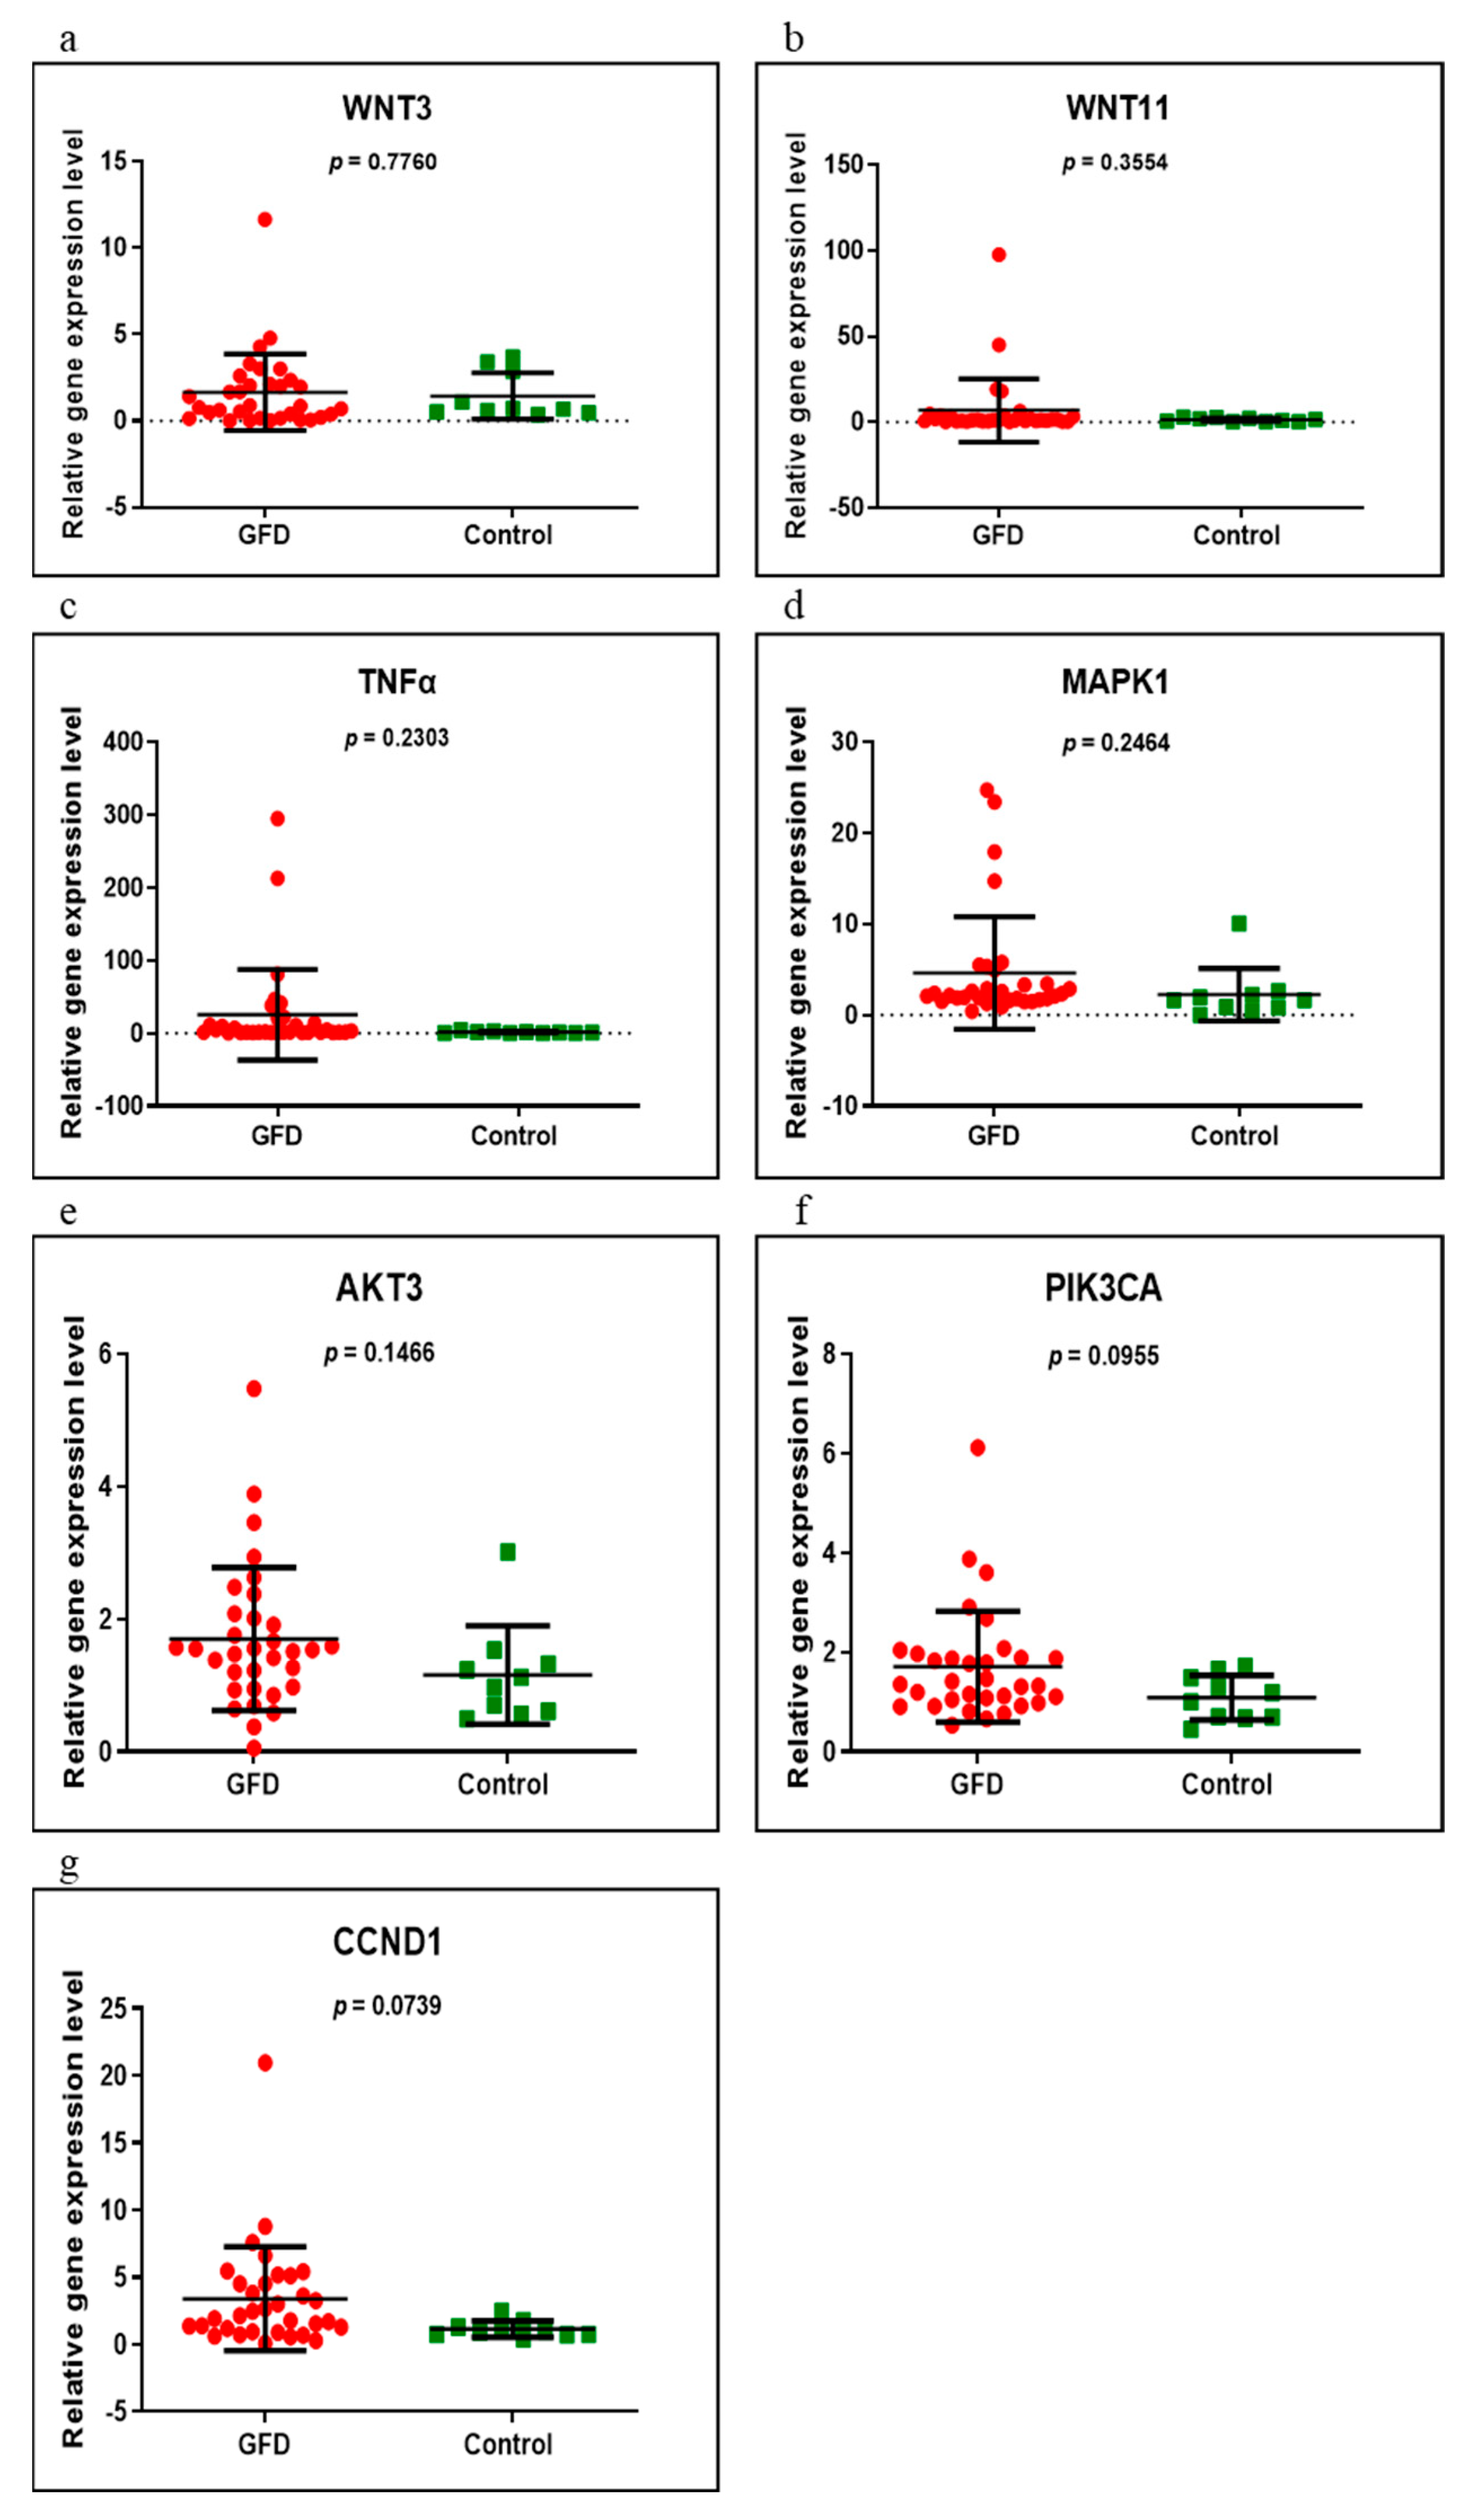
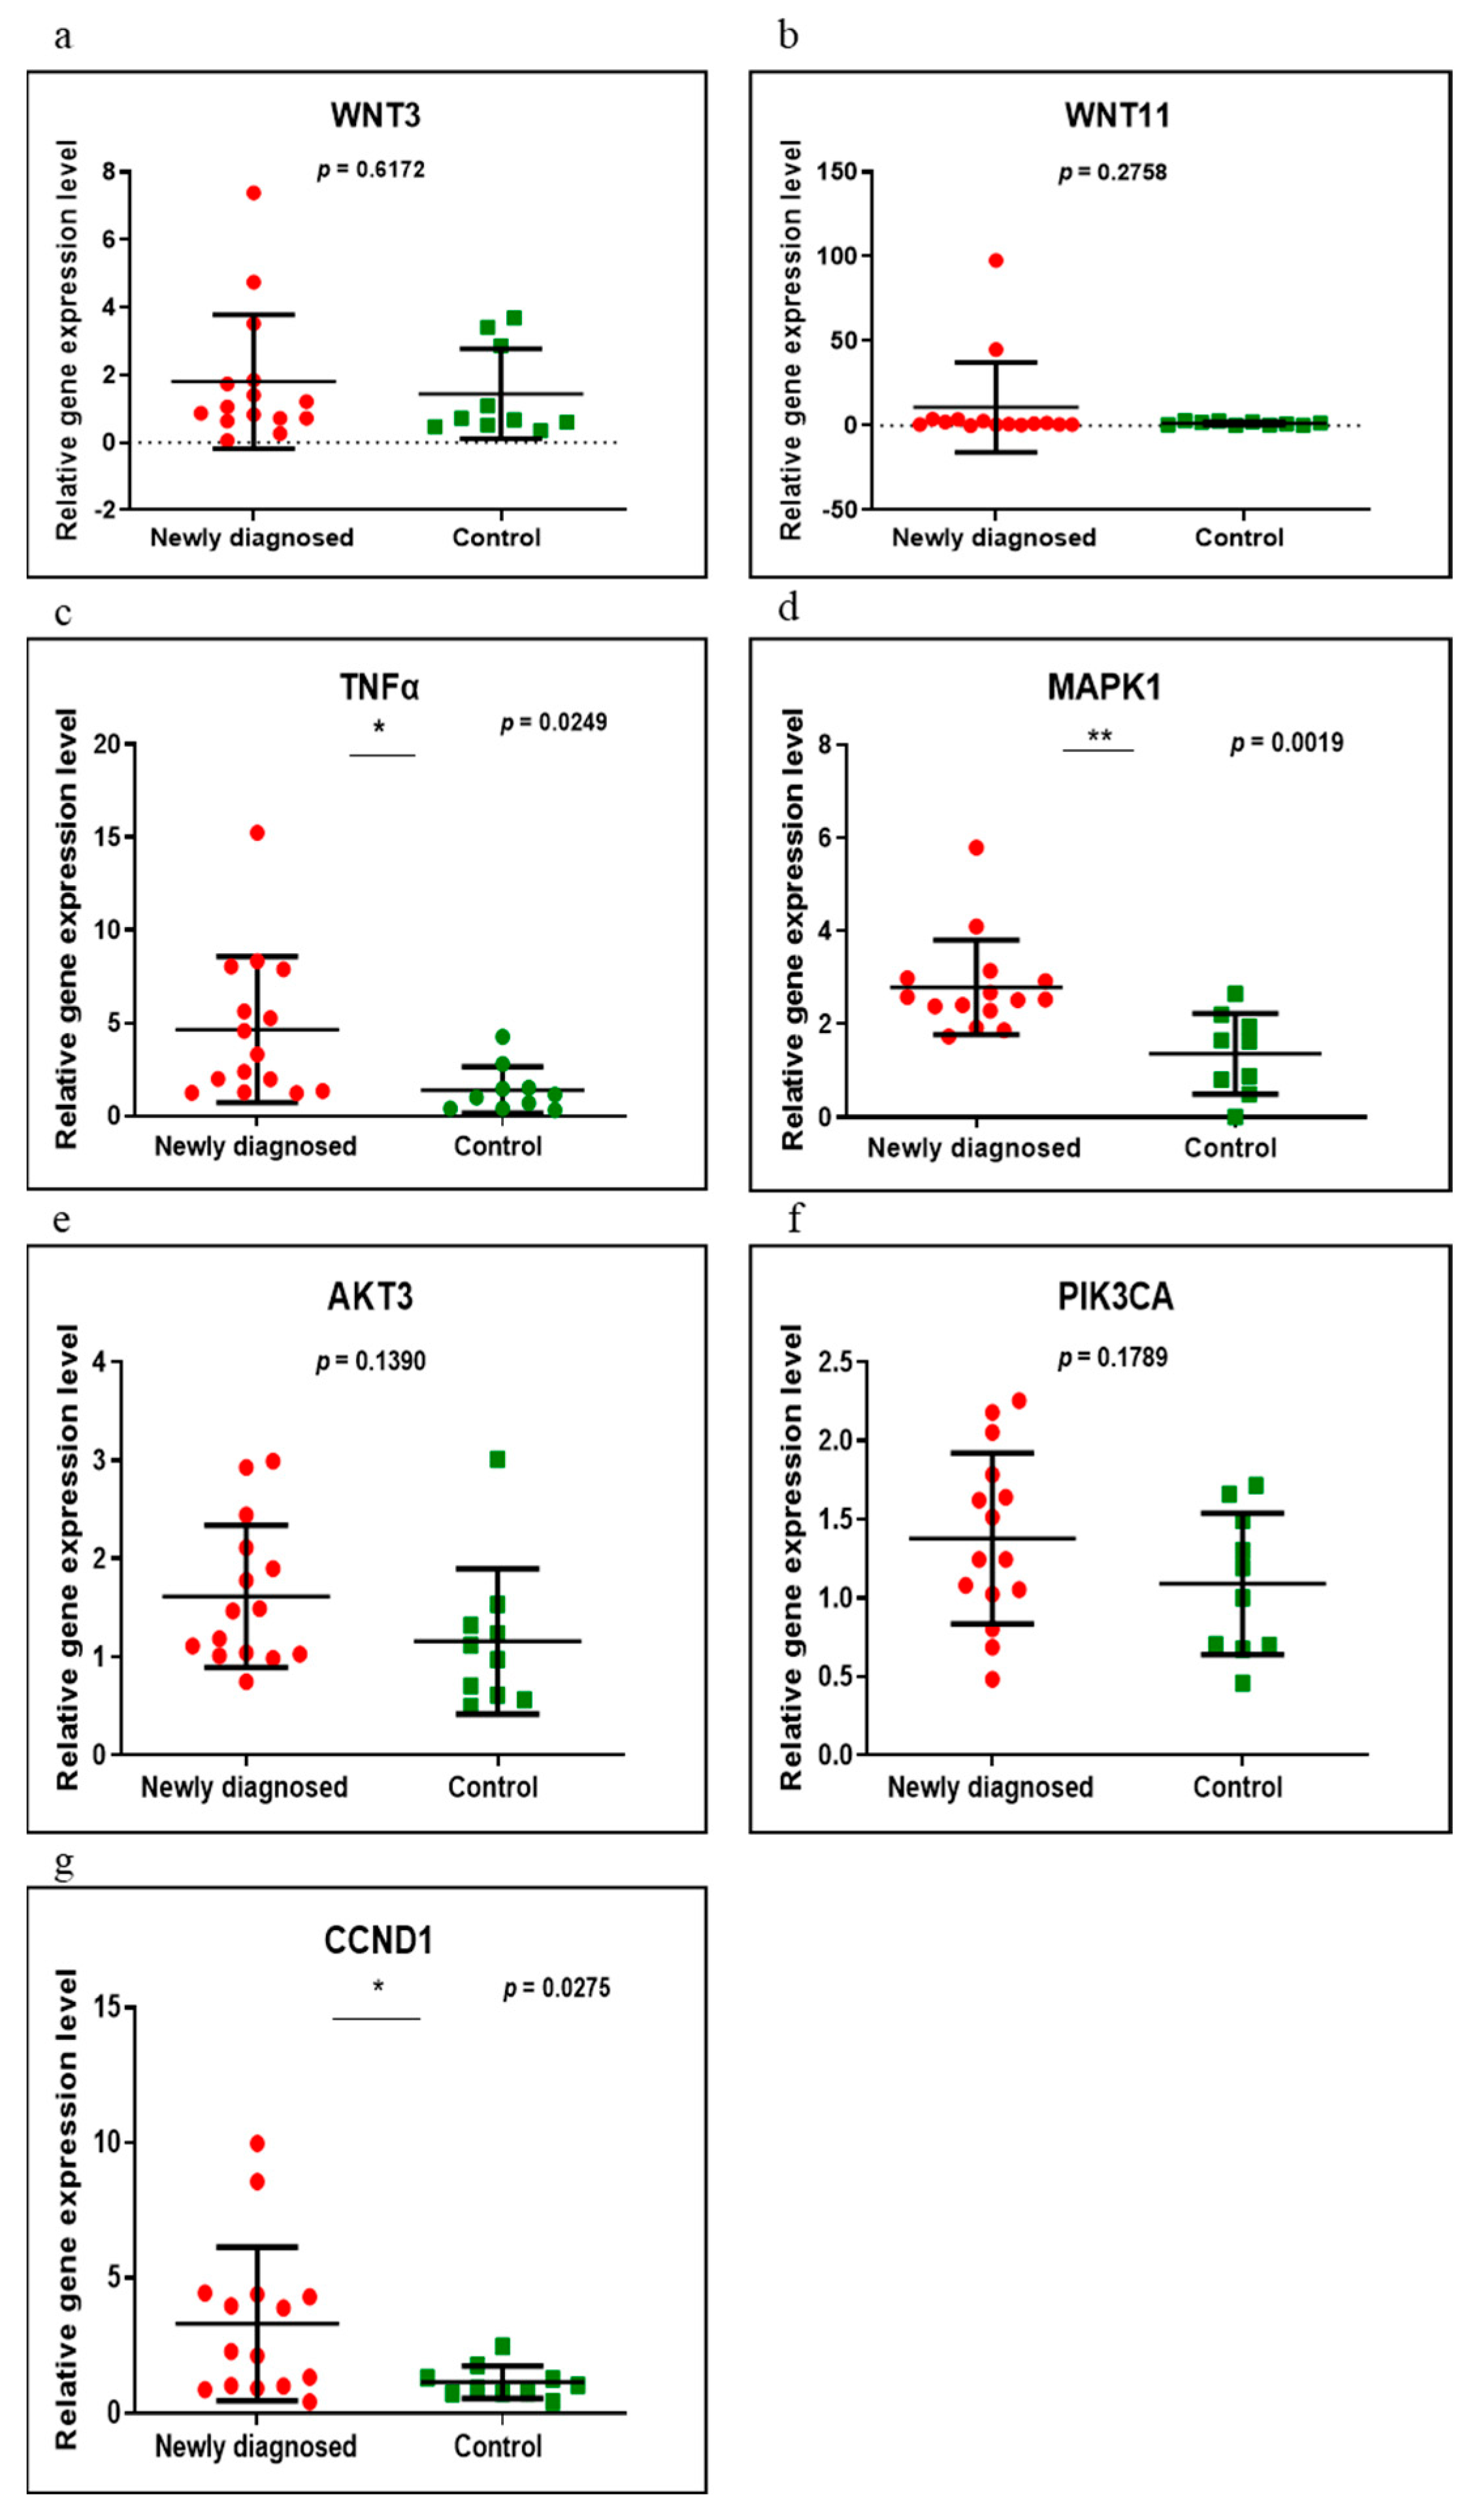
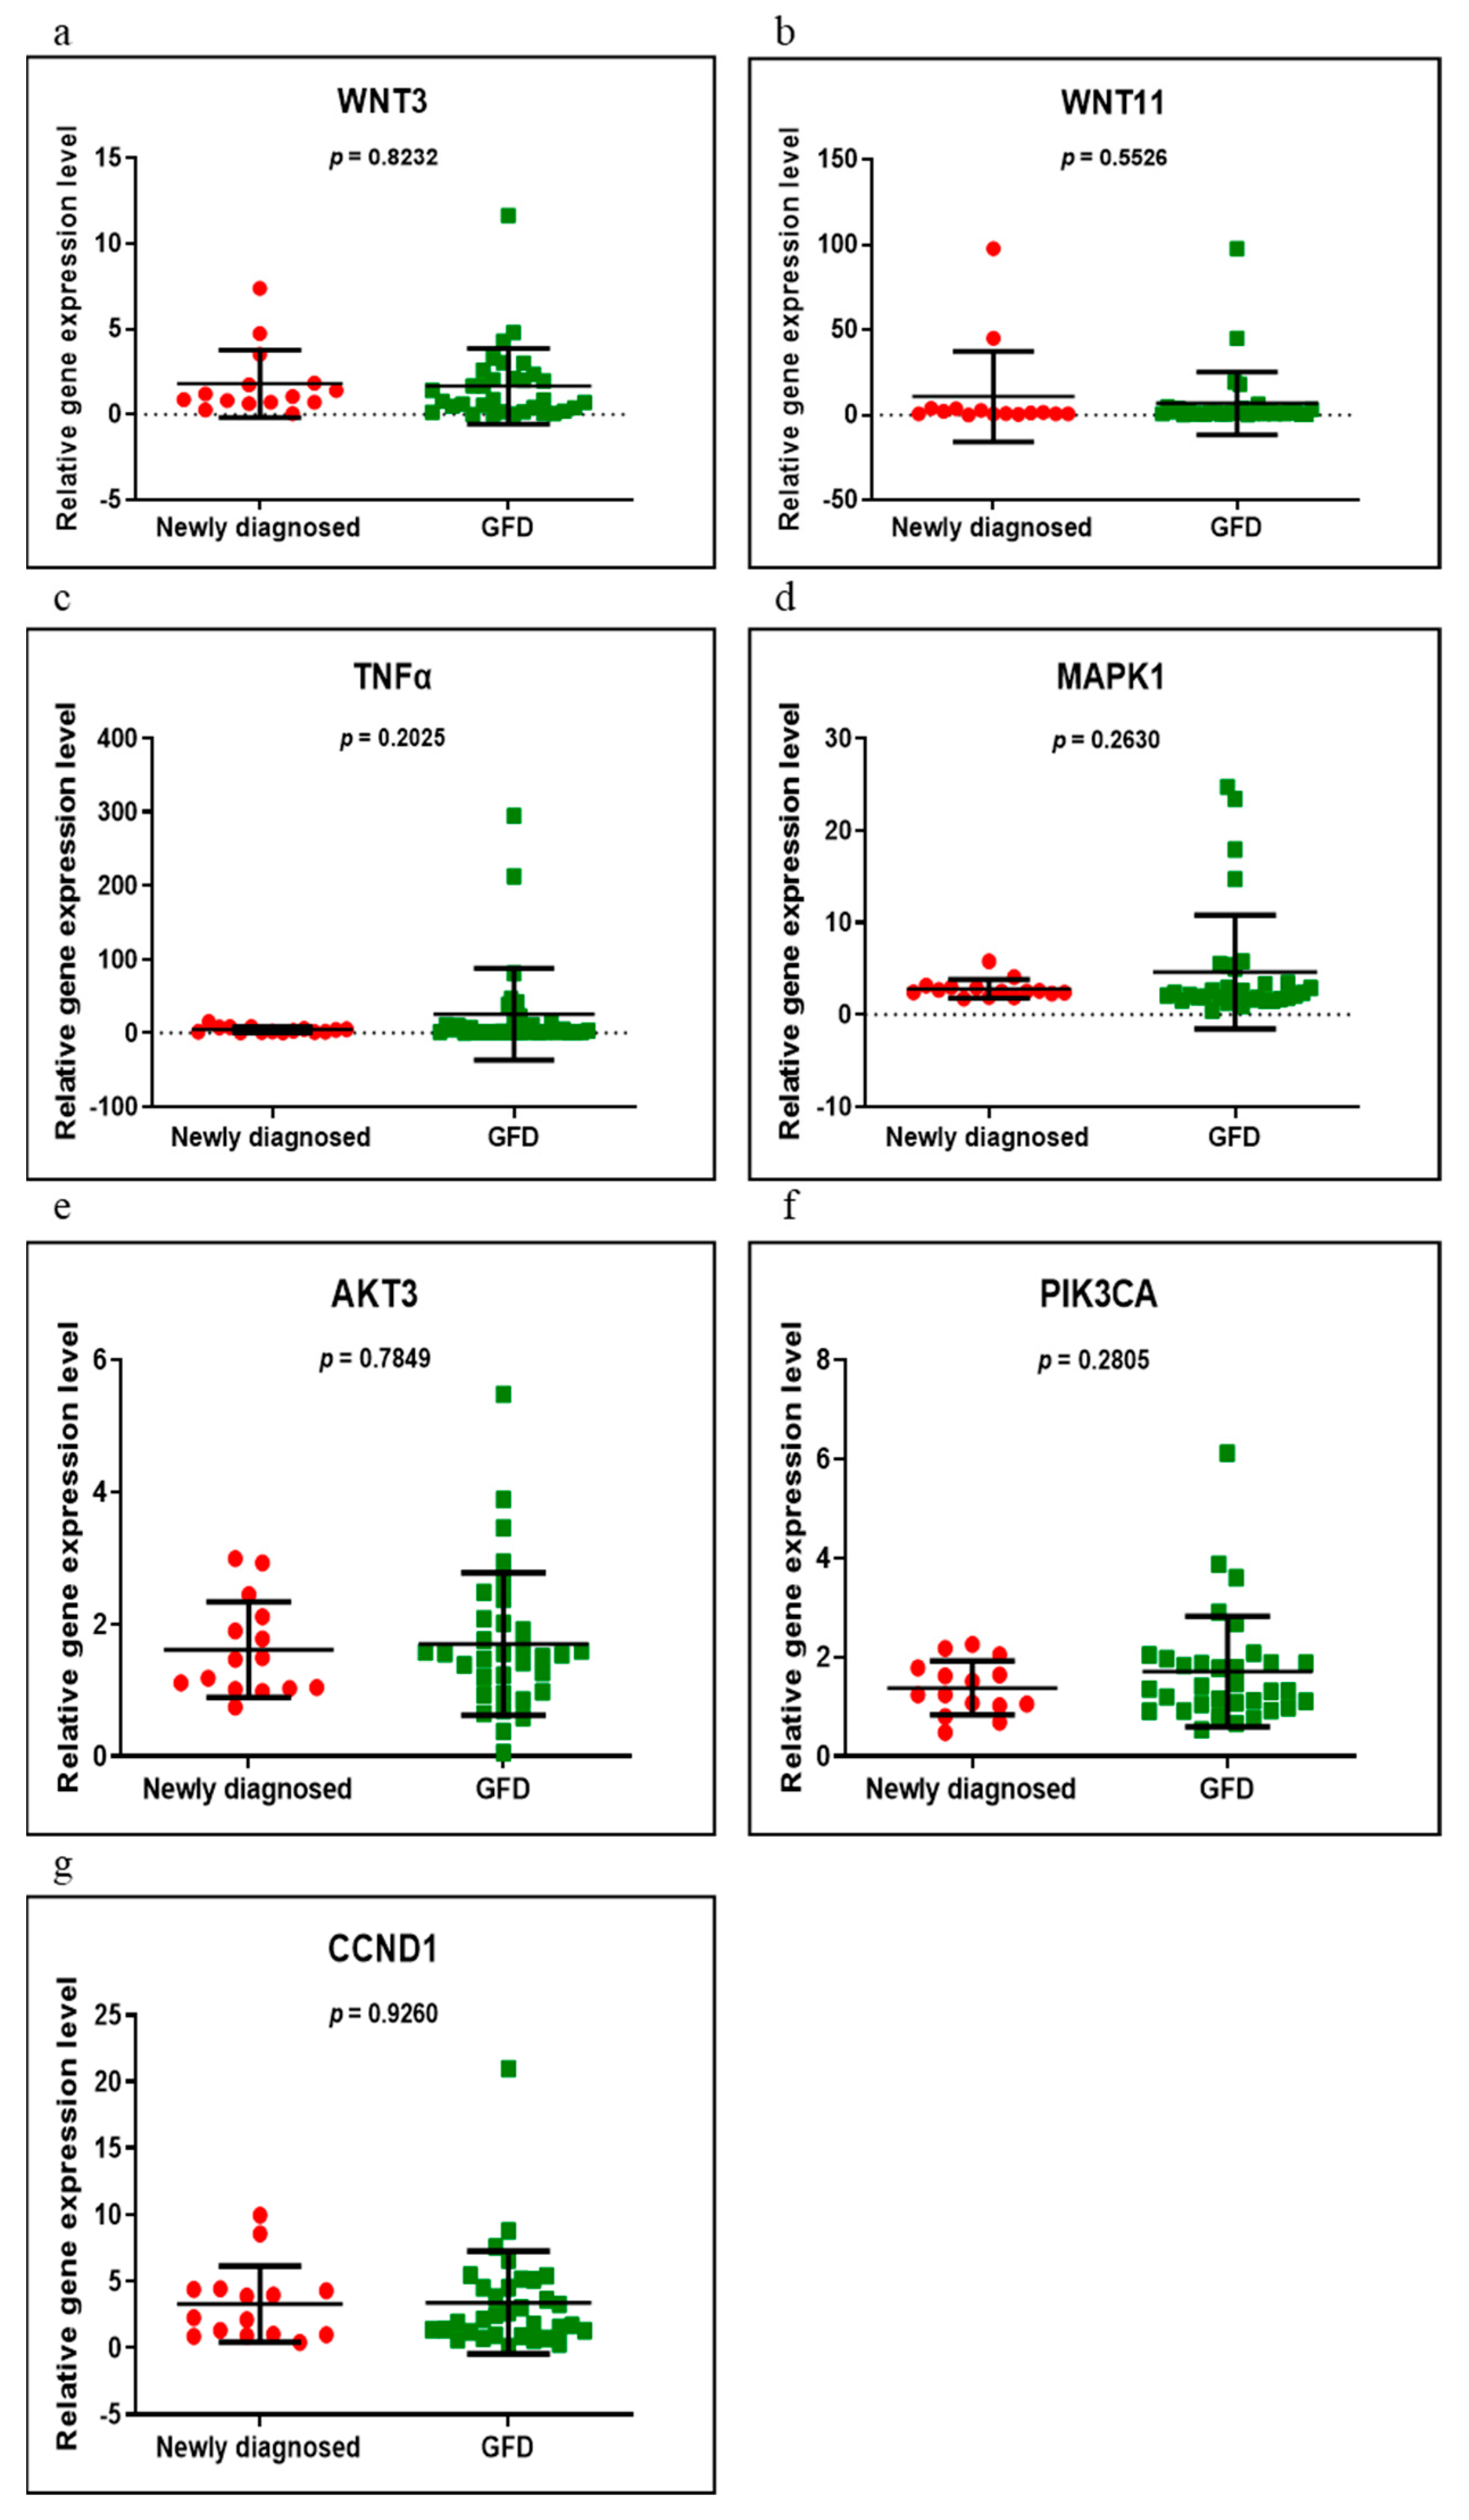
3.2. Gene Expression
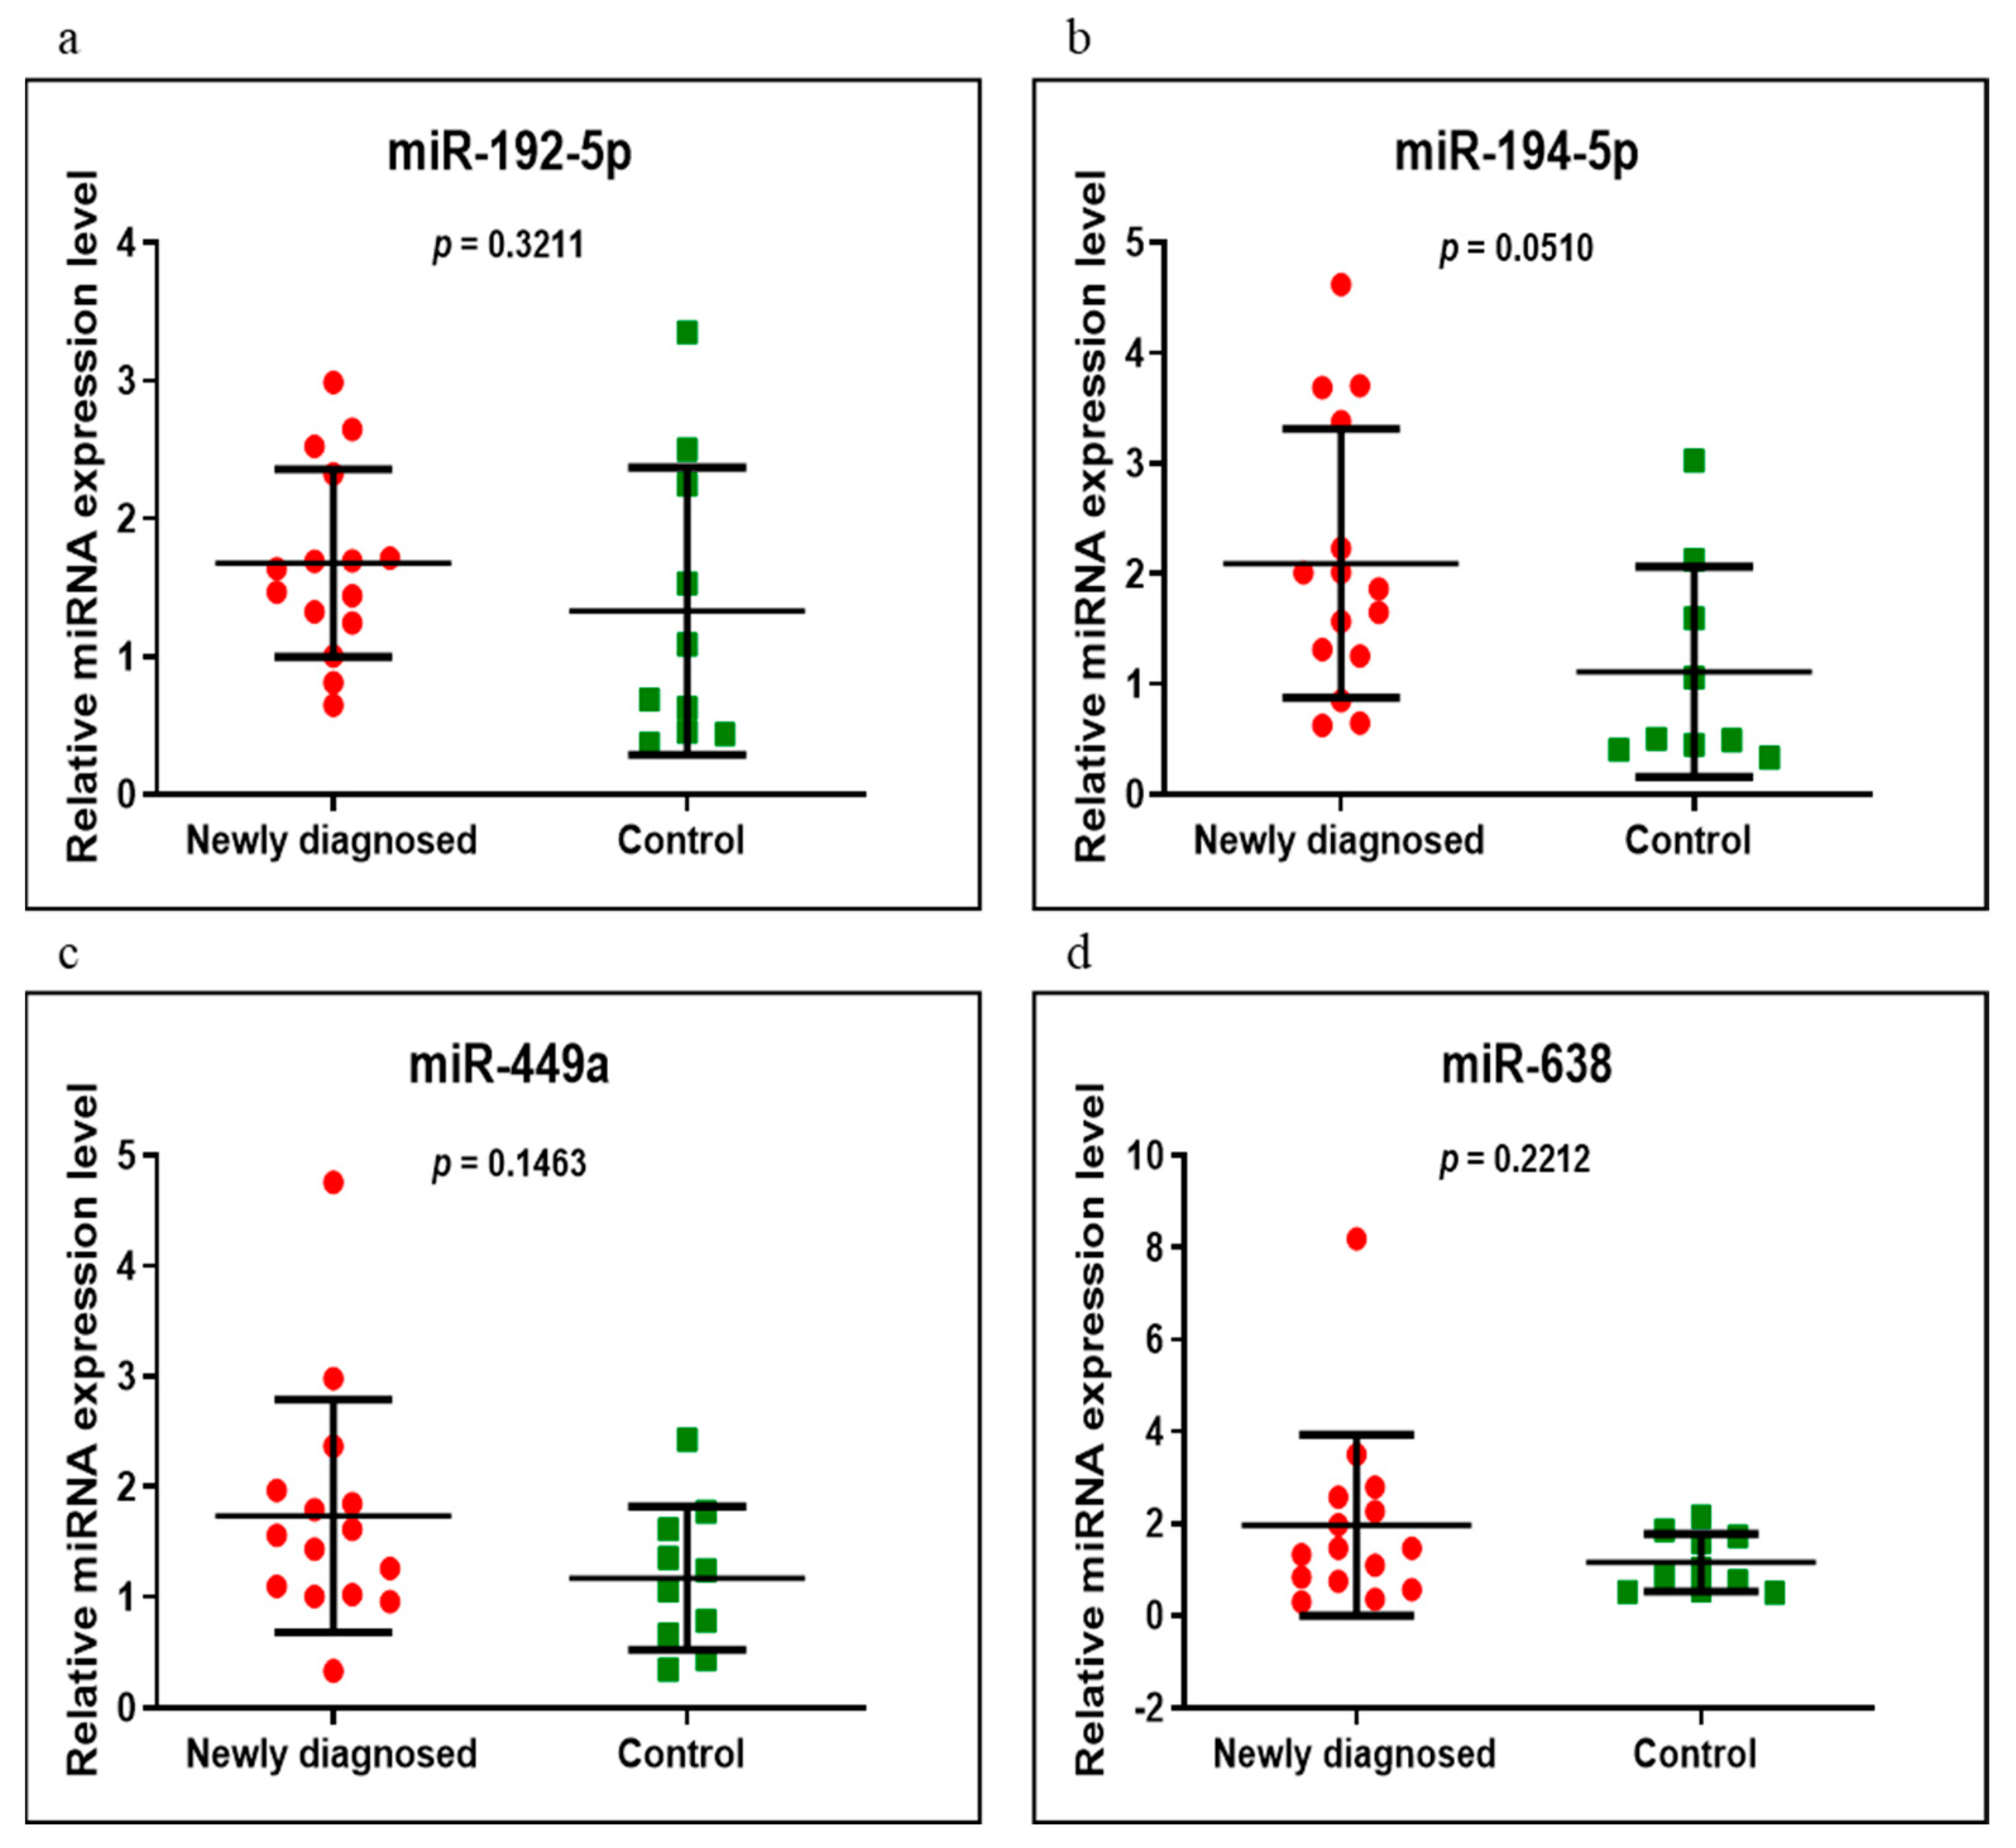
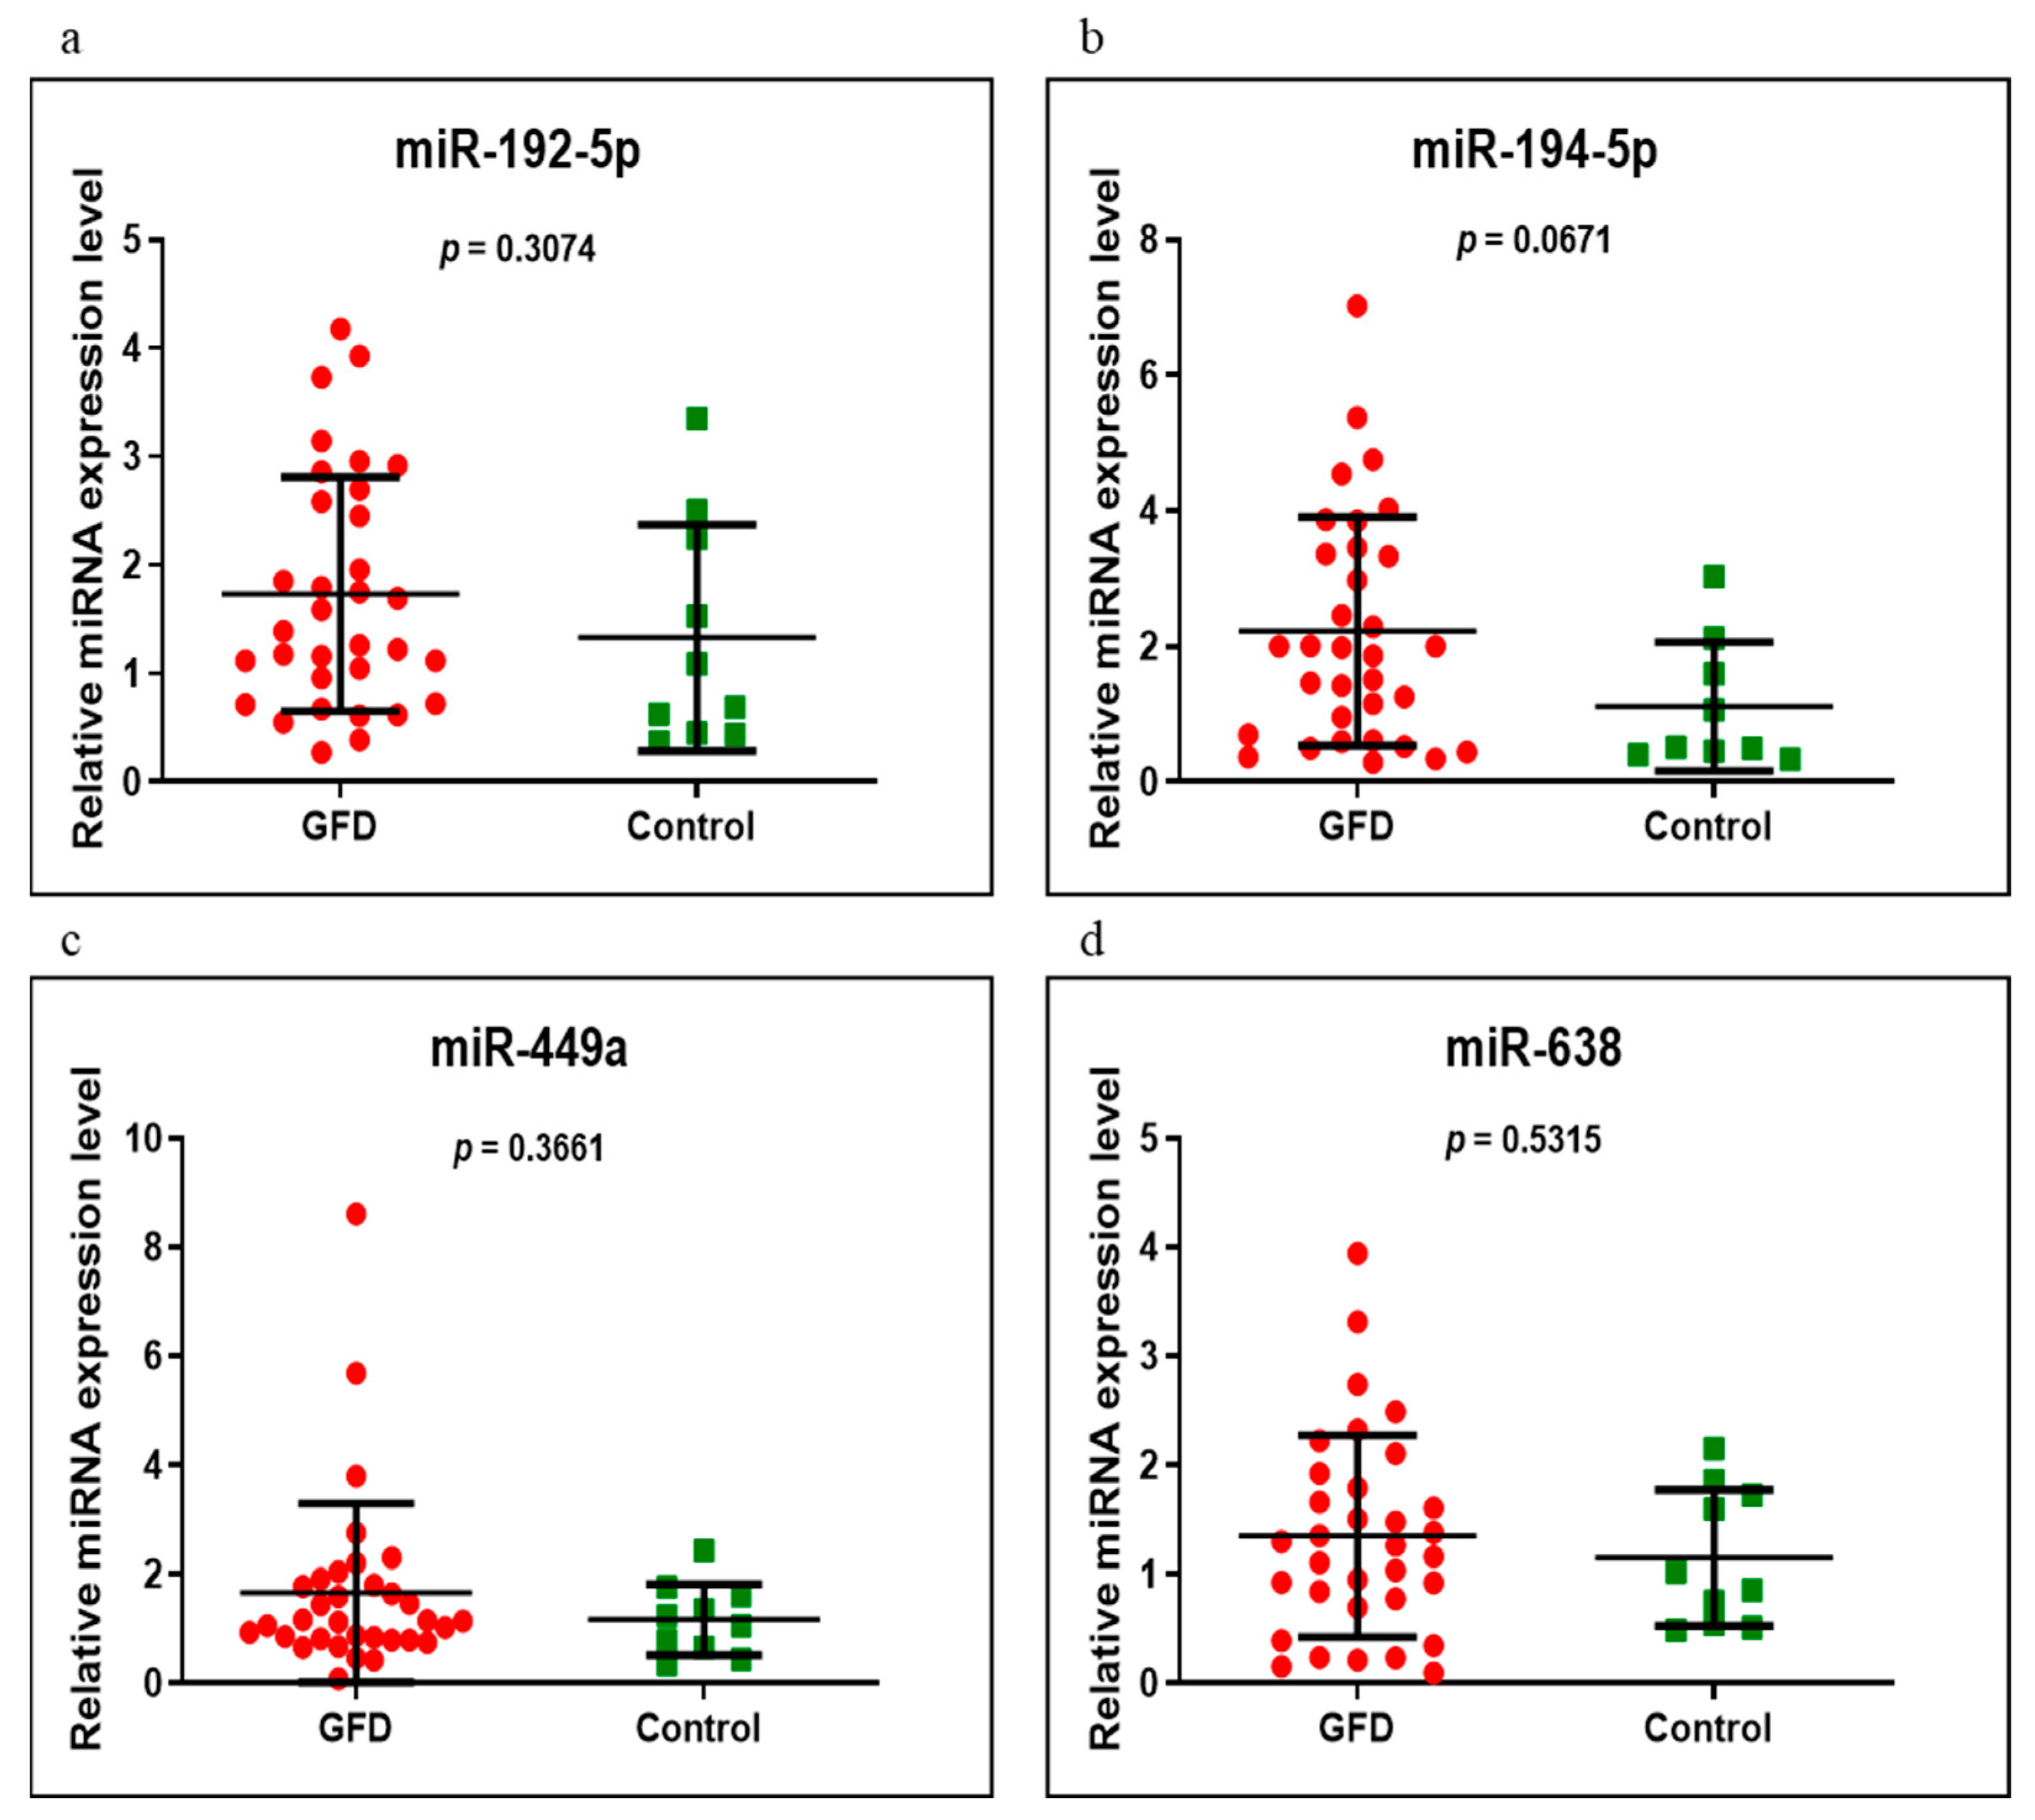
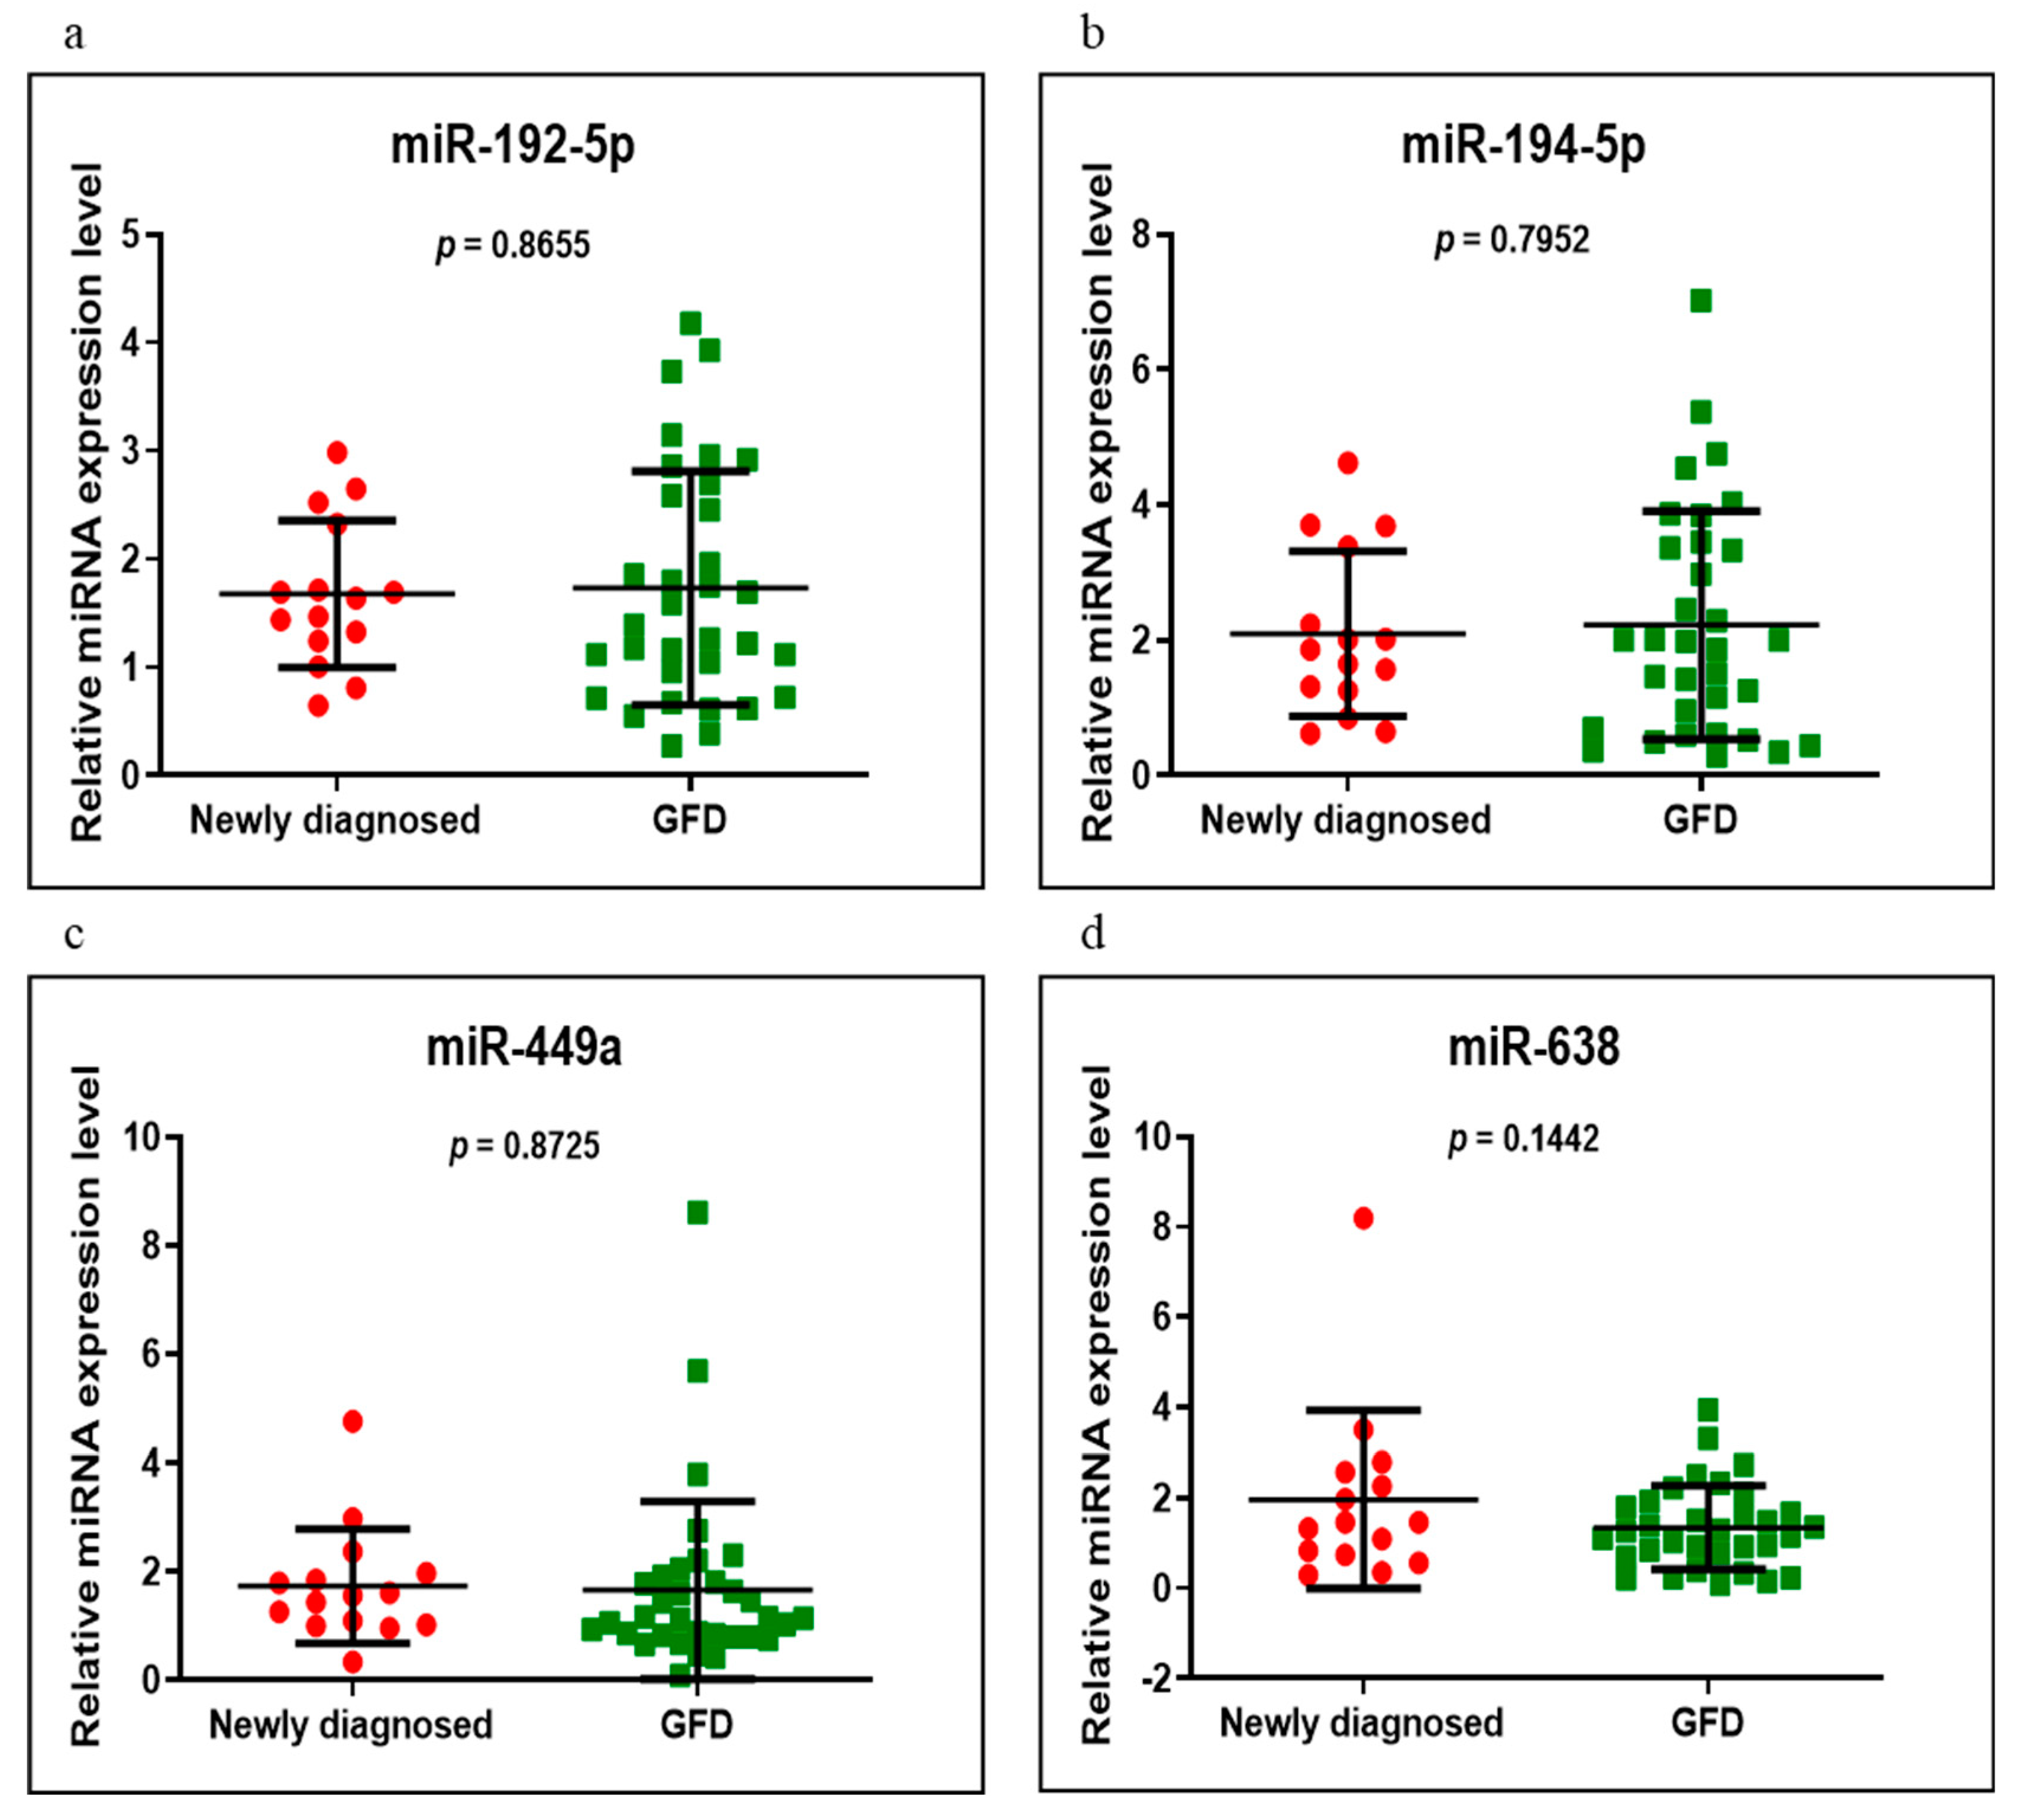
3.3. miRNAs Expression
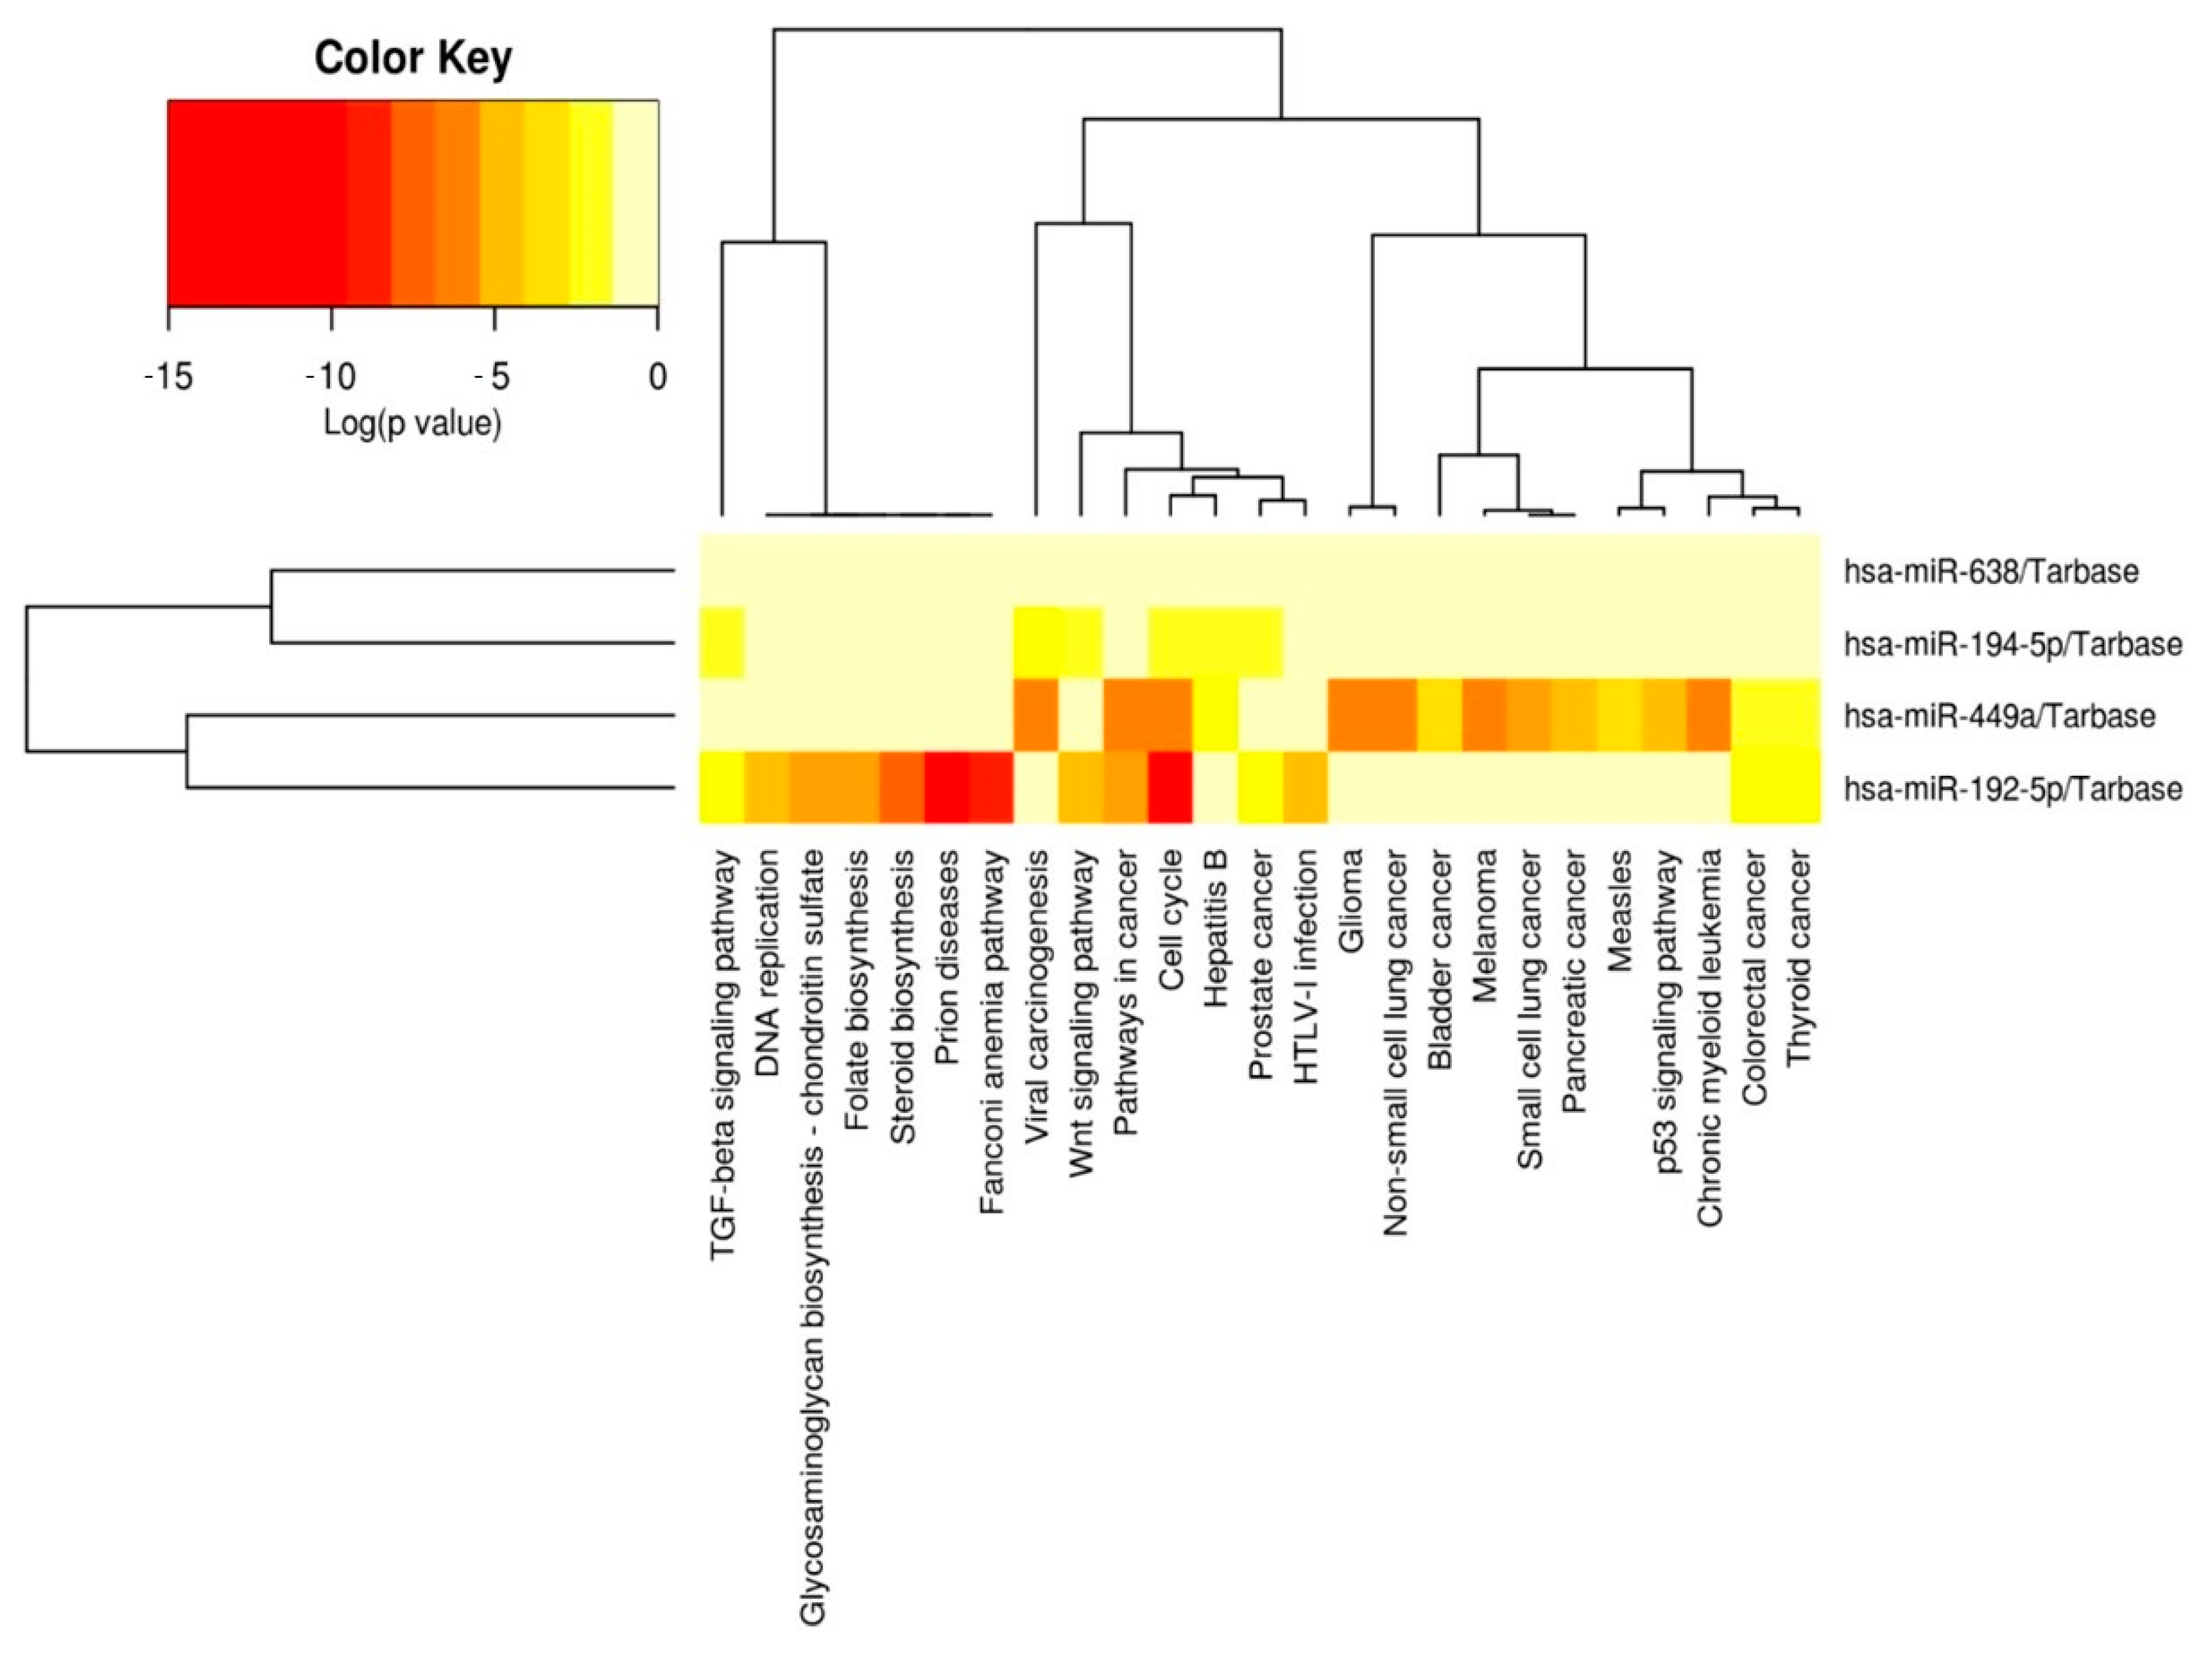
3.4. Networks
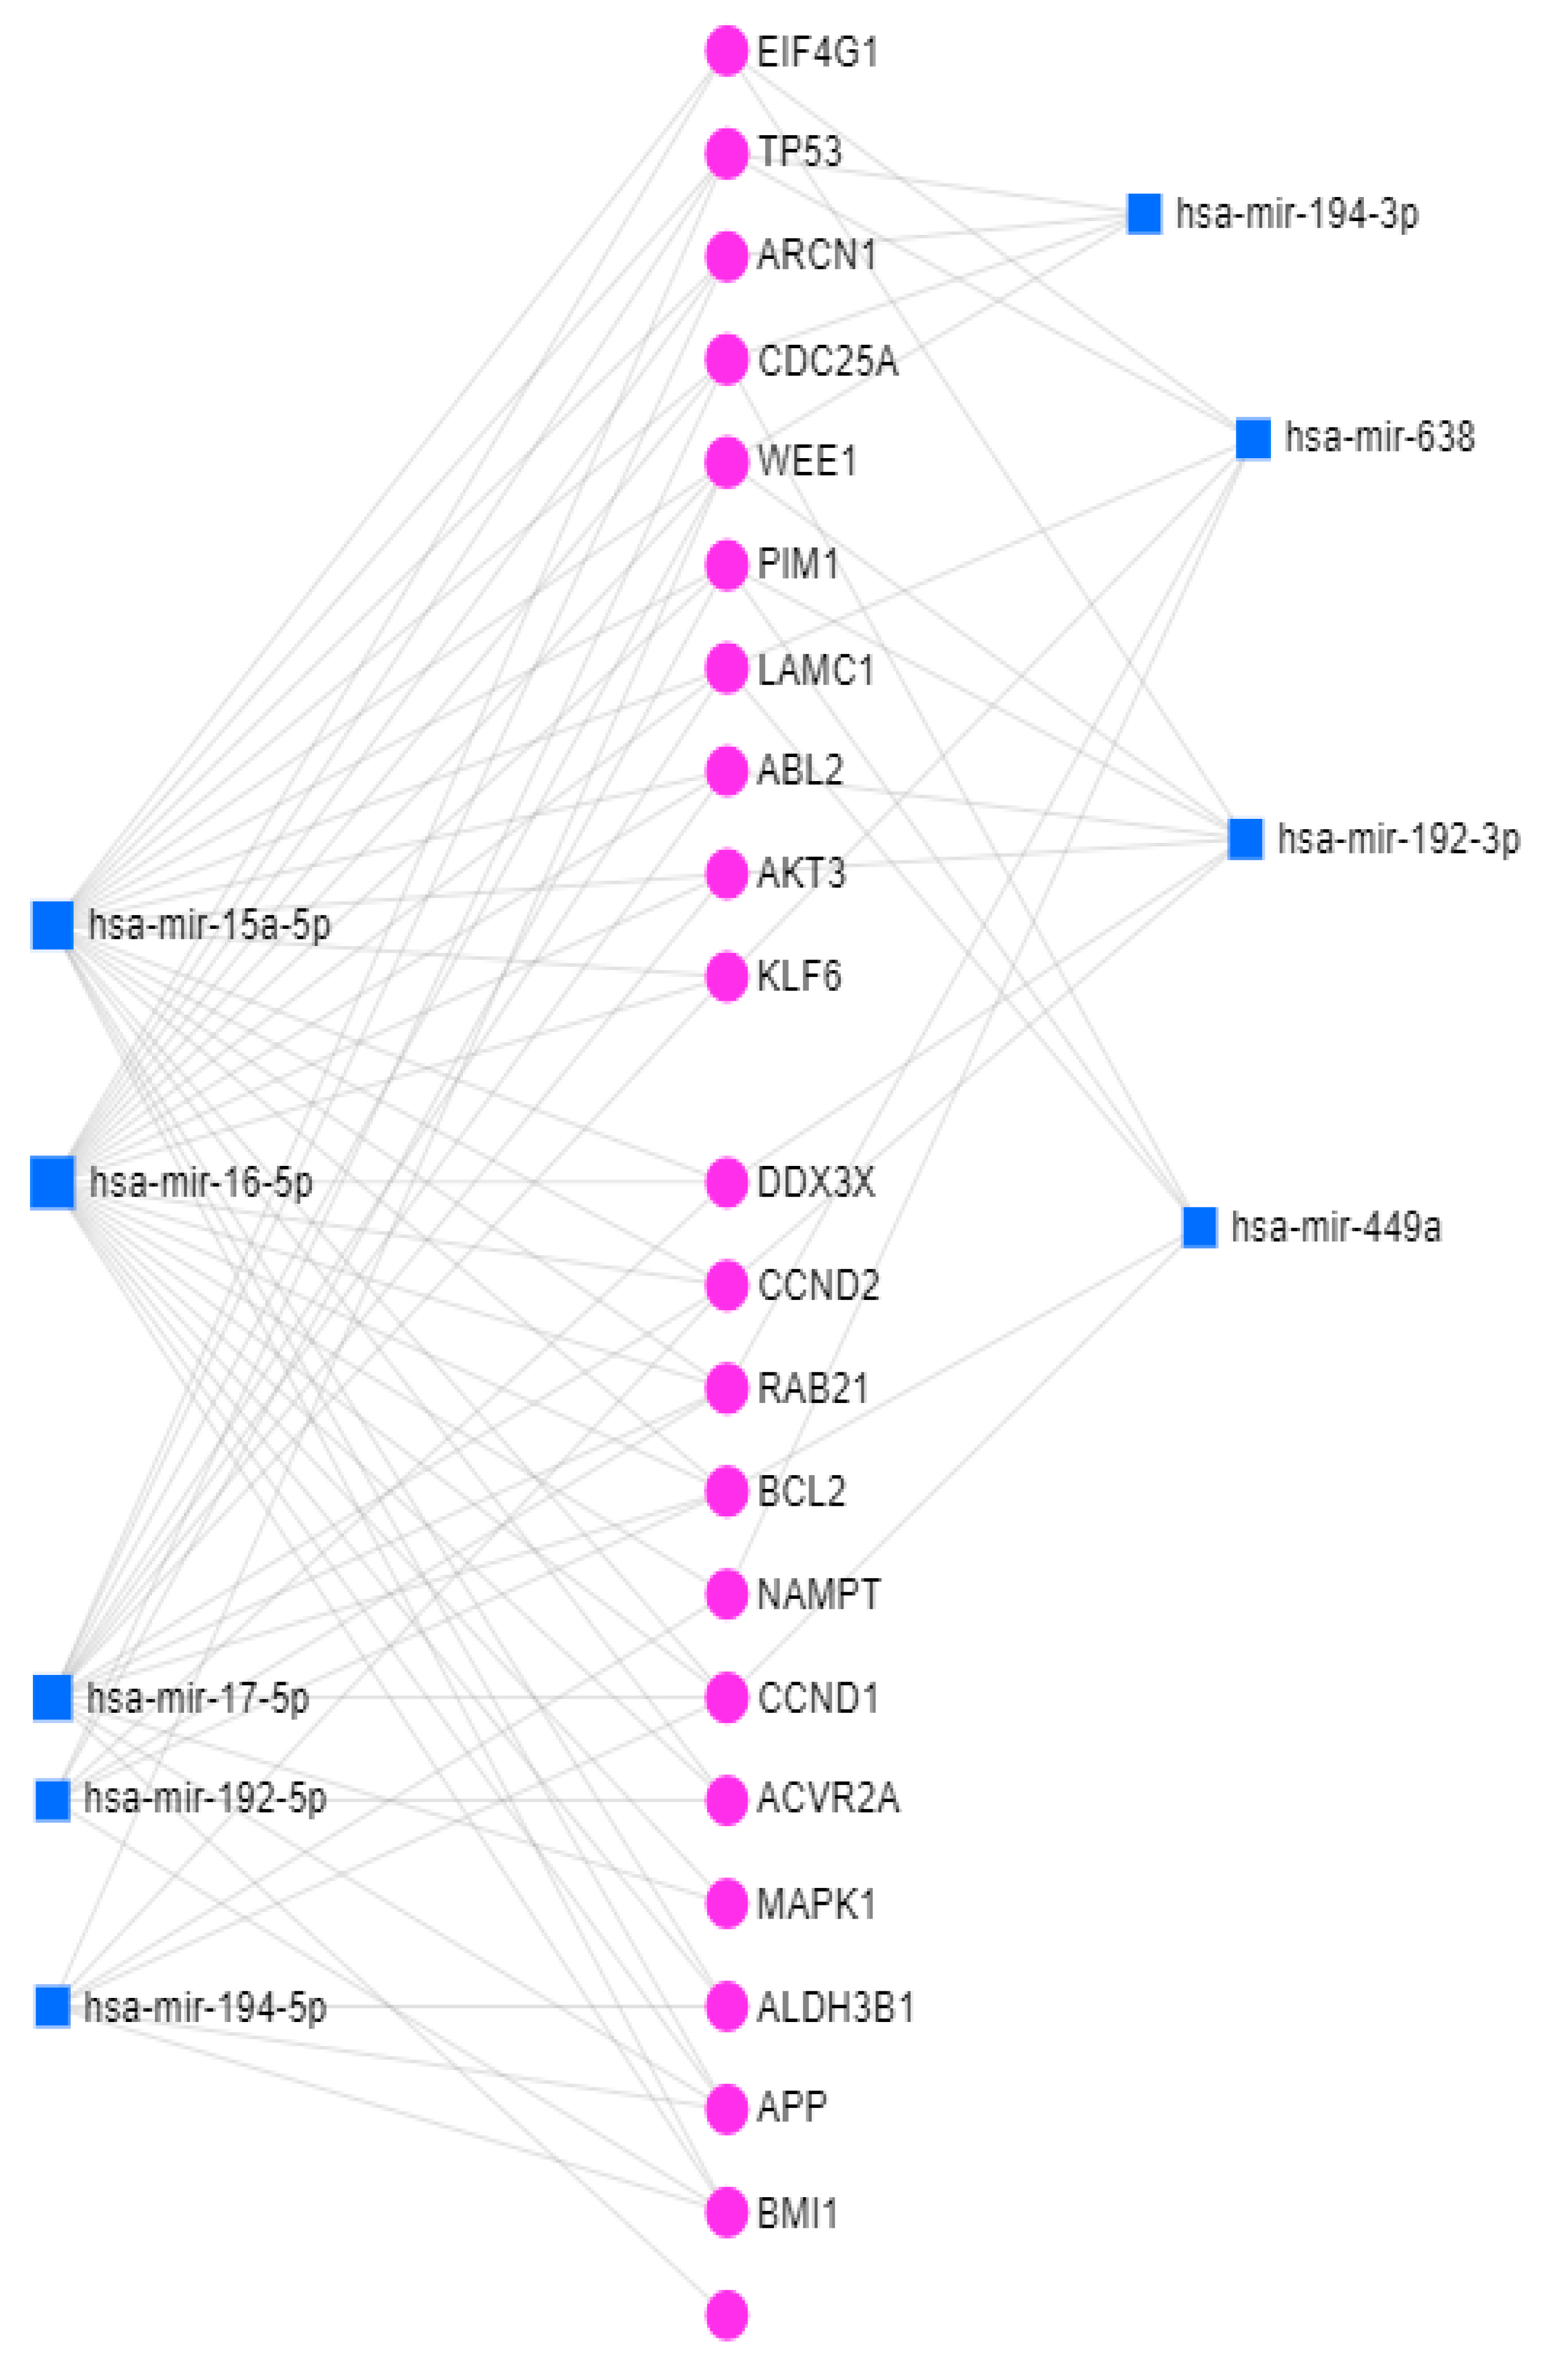
3.5. miRNet
4. Discussion
5. Conclusions
Author Contributions
Funding
Institutional Review Board Statement
Informed Consent Statement
Data Availability Statement
Conflicts of Interest
References
- Giuffrida, P.; Di Sabatino, A. MicroRNAs in Celiac Disease Diagnosis: A miR Curiosity or Game-Changer? Dig. Dis. Sci. 2020, 65, 1877–1879. [Google Scholar] [CrossRef] [PubMed] [Green Version]
- Al-Toma, A.; Volta, U.; Auricchio, R.; Castillejo, G.; Sanders, D.S.; Cellier, C.; Mulder, C.J.; Lundin, K.E. European Society for the Study of Coeliac Disease (ESsCD) guideline for coeliac disease and other gluten-related disorders. United Eur. Gastroenterol. J. 2019, 7, 583–613. [Google Scholar] [CrossRef] [PubMed]
- Domsa, E.M.; Berindan-Neagoe, I.; Para, I.; Munteanu, L.; Matei, D.; Andreica, V. Celiac disease: A multi-faceted medical condition. J. Physiol. Pharmacol. 2020, 71, 3–14. [Google Scholar] [CrossRef]
- Domsa, E.M.; Filip, G.A.; Olteanu, D.; Baldea, I.; Clichici, S.; Muresan, A.; David, L.; Moldovan, B.; Suciu, M.; Achim, M.; et al. Gold nanoparticles phytoreduced with Cornus mas extract mitigate some of gliadin effects on Caco-2 cells. J. Physiol. Pharmacol. 2020, 71, 201–212. [Google Scholar] [CrossRef]
- Felli, C.; Baldassarre, A.; Masotti, A. Intestinal and Circulating MicroRNAs in Coeliac Disease. Int. J. Mol. Sci. 2017, 18, 1907. [Google Scholar] [CrossRef] [PubMed] [Green Version]
- Magni, S.; Buoli Comani, G.; Elli, L.; Vanessi, S.; Ballarini, E.; Nicolini, G.; Rusconi, M.; Castoldi, M.; Meneveri, R.; Muckenthaler, M.U.; et al. miRNAs affect the expression of innate and adaptive immunity proteins in celiac disease. Am. J. Gastroenterol. 2014, 109, 1662–1674. [Google Scholar] [CrossRef] [PubMed]
- Buoli Comani, G.; Panceri, R.; Dinelli, M.; Biondi, A.; Mancuso, C.; Meneveri, R.; Barisani, D. miRNA-regulated gene expression differs in celiac disease patients according to the age of presentation. Genes Nutr. 2015, 10, 482. [Google Scholar] [CrossRef] [Green Version]
- Banaganapalli, B.; Mansour, H.; Mohammed, A.; Alharthi, A.M.; Aljuaid, N.M.; Nasser, K.K.; Ahmad, A.; Saadah, O.I.; Al-Aama, J.Y.; Elango, R.; et al. Exploring celiac disease candidate pathways by global gene expression profiling and gene network cluster analysis. Sci. Rep. 2020, 10, 16290. [Google Scholar] [CrossRef]
- Zamanian Azodi, M.; Peyvandi, H.; Rostami-Nejad, M.; Safaei, A.; Rostami, K.; Vafaee, R.; Heidari, M.; Hosseini, M.; Zali, M.R. Protein-protein interaction network of celiac disease. Gastroenterol. Hepatol. Bed Bench 2016, 9, 268–277. [Google Scholar]
- Krausova, M.; Korinek, V. Wnt signaling in adult intestinal stem cells and cancer. Cell. Signal. 2014, 26, 570–579. [Google Scholar] [CrossRef] [Green Version]
- Marafini, I.; Monteleone, I.; Di Fusco, D.; Cupi, M.L.; Paoluzi, O.A.; Colantoni, A.; Ortenzi, A.; Izzo, R.; Vita, S.; De Luca, E.; et al. TNF-α Producing Innate Lymphoid Cells (ILCs) Are Increased in Active Celiac Disease and Contribute to Promote Intestinal Atrophy in Mice. PLoS ONE 2015, 10, e0126291. [Google Scholar] [CrossRef] [PubMed]
- NCBI. Gene MAPK1. 2015. Available online: http://www.ncbi.nlm.nih.gov/gene/5594 (accessed on 15 March 2015).
- Reyes-Gibby, C.C.; Wang, J.; Silvas, M.R.; Yu, R.; Yeung, S.C.; Shete, S. MAPK1/ERK2 as novel target genes for pain in head and neck cancer patients. BMC Genet. 2016, 17, 40. [Google Scholar] [CrossRef] [PubMed] [Green Version]
- Rostami-Nejad, M.; Vafaee, R.; Ehsani-Ardakani, M.; Aghamohammadi, N.; Keramatinia, A.; Abdi, S.; Moravvej, H. The Screening of Critical Related Genes in Celiac Disease Based on Intraepithelial Lymphocytes Investigation: A Bioinformatics Analysis. Galen Med. J. 2019, 8, e1407. [Google Scholar] [CrossRef] [PubMed] [Green Version]
- Wright, G.L.; Maroulakou, I.G.; Eldridge, J.; Liby, T.L.; Sridharan, V.; Tsichlis, P.N.; Muise-Helmericks, R.C. VEGF stimulation of mitochondrial biogenesis: Requirement of AKT3 kinase. FASEB J. 2008, 22, 3264–3275. [Google Scholar] [CrossRef] [PubMed]
- Moriya, C.; Jinnin, M.; Yamane, K.; Maruo, K.; Muchemwa, F.C.; Igata, T.; Makino, T.; Fukushima, S.; Ihn, H. Expression of matrix metalloproteinase-13 is controlled by IL-13 via PI3K/Akt3 and PKC-δ in normal human dermal fibroblasts. J. Investig. Dermatol. 2011, 131, 655–661. [Google Scholar] [CrossRef] [Green Version]
- Zhang, B.; Sun, T. Transcription Factors That Regulate the Pathogenesis of Ulcerative Colitis. Biomed. Res. Int. 2020, 2020, 7402657. [Google Scholar] [CrossRef]
- Montazer Haghighi, M.; Vahedi, M.; Nazemolhosseini Mojarad, E. Single Nucleotide Polymorphism (A870G) of the CCND1 gene: Association with colorectal cancer susceptibility. Gastroenterol. Hepatol. Bed Bench 2017, 10 (Suppl. S1), S48–S53. [Google Scholar]
- Fan, Y.; Siklenka, K.; Arora, S.K.; Ribeiro, P.; Kimmins, S.; Xia, J. miRNet-dissecting miRNA-target interactions and functional associations through network-based visual analysis. Nucleic Acids Res. 2016, 44, W135–W141. [Google Scholar] [CrossRef]
- Groza, I.M.; Braicu, C.; Jurj, A.; Zanoaga, O.; Lajos, R.; Chiroi, P.; Cojocneanu, R.; Paun, D.; Irimie, A.; Korban, S.S.; et al. Cancer-Associated Stemness and Epithelial-to-Mesenchymal Transition Signatures Related to Breast Invasive Carcinoma Prognostic. Cancers 2020, 12, 3053. [Google Scholar] [CrossRef]
- Amr, K.S.; Bayoumi, F.S.; Eissa, E.; Abu-Zekry, M. Circulating microRNAs as potential non-invasive biomarkers in pediatric patients with celiac disease. Eur. Ann. Allergy Clin. Immunol. 2019, 51, 159–164. [Google Scholar] [CrossRef] [Green Version]
- Bascuñán, K.A.; Pérez-Bravo, F.; Gaudioso, G.; Vaira, V.; Roncoroni, L.; Elli, L.; Monguzzi, E.; Araya, M. A miRNA-Based Blood and Mucosal Approach for Detecting and Monitoring Celiac Disease. Dig. Dis. Sci. 2020, 65, 1982–1991. [Google Scholar] [CrossRef] [PubMed]
- Vaira, V.; Roncoroni, L.; Barisani, D.; Gaudioso, G.; Bosari, S.; Bulfamante, G.; Doneda, L.; Conte, D.; Tomba, C.; Bardella, M.T.; et al. microRNA profiles in coeliac patients distinguish different clinical phenotypes and are modulated by gliadin peptides in primary duodenal fibroblasts. Clin. Sci. 2014, 126, 417–423. [Google Scholar] [CrossRef] [PubMed]
- Capuano, M.; Iaffaldano, L.; Tinto, N.; Montanaro, D.; Capobianco, V.; Izzo, V.; Tucci, F.; Troncone, G.; Greco, L.; Sacchetti, L. MicroRNA-449a overexpression, reduced NOTCH1 signals and scarce goblet cells characterize the small intestine of celiac patients. PLoS ONE 2011, 6, e29094. [Google Scholar] [CrossRef] [Green Version]
- McKenna, L.B.; Schug, J.; Vourekas, A.; McKenna, J.B.; Bramswig, N.C.; Friedman, J.R.; Kaestner, K.H. MicroRNAs control intestinal epithelial differentiation, architecture, and barrier function. Gastroenterology 2010, 139, 1654–1664.e1. [Google Scholar] [CrossRef] [PubMed] [Green Version]
- Street, M.E.; Volta, C.; Ziveri, M.A.; Zanacca, C.; Banchini, G.; Viani, I.; Rossi, M.; Virdis, R.; Bernasconi, S. Changes and relationships of IGFS and IGFBPS and cytokines in coeliac disease at diagnosis and on gluten-free diet. Clin. Endocrinol. 2008, 68, 22–28. [Google Scholar] [CrossRef]
- Vorobjova, T.; Tagoma, A.; Oras, A.; Alnek, K.; Kisand, K.; Talja, I.; Uibo, O.; Uibo, R. Celiac Disease in Children, Particularly with Accompanying Type 1 Diabetes, Is Characterized by Substantial Changes in the Blood Cytokine Balance, Which May Reflect Inflammatory Processes in the Small Intestinal Mucosa. J. Immunol. Res. 2019, 2019, 6179243. [Google Scholar] [CrossRef]
- Wang, F.; Schwarz, B.T.; Graham, W.V.; Wang, Y.; Su, L.; Clayburgh, D.R.; Abraham, C.; Turner, J.R. IFN-gamma-induced TNFR2 expression is required for TNF-dependent intestinal epithelial barrier dysfunction. Gastroenterology 2006, 131, 1153–1163. [Google Scholar] [CrossRef] [Green Version]
- Manavalan, J.S.; Hernandez, L.; Shah, J.G.; Konikkara, J.; Naiyer, A.J.; Lee, A.R.; Ciaccio, E.; Minaya, M.T.; Green, P.H.; Bhagat, G. Serum cytokine elevations in celiac disease: Association with disease presentation. Hum. Immunol. 2010, 71, 50–57. [Google Scholar] [CrossRef]
- Przemioslo, R.T.; Kontakou, M.; Nobili, V.; Ciclitira, P.J. Raised pro-inflammatory cytokines interleukin 6 and tumour necrosis factor alpha in coeliac disease mucosa detected by immunohistochemistry. Gut 1994, 35, 1398–1403. [Google Scholar] [CrossRef] [Green Version]
- Goel, G.; Daveson, A.J.M.; Hooi, C.E.; Tye-Din, J.A.; Wang, S.; Szymczak, E.; Williams, L.J.; Dzuris, J.L.; Neff, K.M.; Truitt, K.E.; et al. Serum cytokines elevated during gluten-mediated cytokine release in coeliac disease. Clin. Exp. Immunol. 2020, 199, 68–78. [Google Scholar] [CrossRef]
- Vanuytsel, T.; Senger, S.; Fasano, A.; Shea-Donohue, T. Major signaling pathways in intestinal stem cells. Biochim. Biophys. Acta 2013, 1830, 2410–2426. [Google Scholar] [CrossRef] [PubMed] [Green Version]
- Piscaglia, A.C. Intestinal stem cells and celiac disease. World J. Stem Cells 2014, 6, 213–229. [Google Scholar] [CrossRef] [PubMed] [Green Version]
- Gregorieff, A.; Pinto, D.; Begthel, H.; Destrée, O.; Kielman, M.; Clevers, H. Expression pattern of Wnt signaling components in the adult intestine. Gastroenterology 2005, 129, 626–638. [Google Scholar] [CrossRef] [PubMed]
- Sato, T.; van Es, J.H.; Snippert, H.J.; Stange, D.E.; Vries, R.G.; Van Den Born, M.; Barker, N.; Shroyer, N.F.; Van De Wetering, M.; Clevers, H. Paneth cells constitute the niche for Lgr5 stem cells in intestinal crypts. Nature 2011, 469, 415–418. [Google Scholar] [CrossRef] [Green Version]
- Nanayakkara, M.; Lania, G.; Maglio, M.; Kosova, R.; Sarno, M.; Gaito, A.; Discepolo, V.; Troncone, R.; Auricchio, S.; Auricchio, R.; et al. Enterocyte proliferation and signaling are constitutively altered in celiac disease. PLoS ONE 2013, 8, e76006. [Google Scholar] [CrossRef] [Green Version]
- Lania, G.; Nanayakkara, M.; Maglio, M.; Auricchio, R.; Porpora, M.; Conte, M.; De Matteis, M.A.; Rizzo, R.; Luini, A.; Discepolo, V.; et al. Author Correction: Constitutive alterations in vesicular trafficking increase the sensitivity of cells from celiac disease patients to gliadin. Commun Biol. 2020, 3, 166. [Google Scholar] [CrossRef] [Green Version]
- Sangineto, M.; Graziano, G.; D’Amore, S.; Salvia, R.; Palasciano, G.; Sabbà, C.; Vacca, M.; Cariello, M. Identification of peculiar gene expression profile in peripheral blood mononuclear cells (PBMC) of celiac patients on gluten free diet. PLoS ONE 2018, 13, e0197915. [Google Scholar] [CrossRef]
- Broide, E.; Scapa, E.; Bloch, O.; Shapiro, M.; Kimchi, N.A.; Ben-Yehudah, G.; Rapoport, M.J. Evidence for aberrant regulation of MAP kinase signal transduction pathway in peripheral blood mononuclear cells in patients with active celiac disease. Dig. Dis. Sci. 2009, 54, 1270–1275. [Google Scholar] [CrossRef]
- Yohannes, D.A.; de Kauwe, A.; Kaukinen, K.; Kurppa, K.; Mäki, M.; Anderson, R.P.; Linnarsson, S.; Greco, D.; Saavalainen, P. Effects of In Vivo Gluten Challenge on PBMC Gene Expression Profiles in Diet Treated Celiac Disease. Front. Immunol. 2020, 11, 594243. [Google Scholar] [CrossRef]
- Sarra, M.; Cupi, M.L.; Monteleone, I.; Franze, E.; Ronchetti, G.; Di Sabatino, A.; Gentileschi, P.; Franceschilli, L.; Sileri, P.; Sica, G.; et al. IL-15 positively regulates IL-21 production in celiac disease mucosa. Mucosal Immunol. 2013, 6, 244–255. [Google Scholar] [CrossRef]
- Guaraldi, F.; Di Nardo, G.; Tarani, L.; Bertelli, L.; Susca, F.C.; Bagnulo, R.; Resta, N. Association of autoimmune thyroiditis and celiac disease with Juvenile Polyposis due to 10q23.1q23.31 deletion: Potential role of PI3K/Akt pathway dysregulation. Eur. J. Med. Genet. 2017, 60, 380–384. [Google Scholar] [CrossRef] [PubMed]
- Martini, M.; De Santis, M.C.; Braccini, L.; Gulluni, F.; Hirsch, E. PI3K/AKT signaling pathway and cancer: An updated review. Ann. Med. 2014, 46, 372–383. [Google Scholar] [CrossRef] [PubMed]
- Shenoy, S. PIK3CA mutations in small bowel adenocarcinoma. Tumori 2015, 101, e85–e87. [Google Scholar] [CrossRef] [PubMed]
- Garrote, J.A.; Gómez, E.; León, A.J.; Bernardo, D.; Calvo, C.; Fernández-Salazar, L.; Blanco-Quirós, A.; Arranz, E. Cytokine, Chemokine and Immune Activation Pathway Profiles in Celiac Disease: An Immune System Activity Screening by Expression Macroarrays. Drug Target Insights 2008, 3, DTI-S399. [Google Scholar] [CrossRef] [Green Version]
- Pauley, K.M.; Cha, S.; Chan, E.K. MicroRNA in autoimmunity and autoimmune diseases. J. Autoimmun. 2009, 32, 189–194. [Google Scholar] [CrossRef] [PubMed] [Green Version]
- Ghafouri-Fard, S.; Shoorei, H.; Taheri, M.; Sanak, M. Emerging role of non-coding RNAs in allergic disorders. Biomed. Pharmacother. 2020, 130, 110615. [Google Scholar] [CrossRef]
- Zauli, D.; Grassi, A.; Granito, A.; Foderaro, S.; De Franceschi, L.; Ballardini, G.; Bianchi, F.B.; Volta, U. Prevalence of silent coeliac disease in atopics. Dig. Liver Dis. 2000, 32, 775–779. [Google Scholar] [CrossRef]
- Granito, A.; Muratori, P.; Cassani, F.; Pappas, G.; Muratori, L.; Agostinelli, D.; Veronesi, L.; Bortolotti, R.; Petrolini, N.; Bianchi, F.B.; et al. Anti-actin IgA antibodies in severe coeliac disease. Clin. Exp. Immunol. 2004, 137, 386–392. [Google Scholar] [CrossRef]
- Ierardi, E.; Losurdo, G.; Piscitelli, D.; Giorgio, F.; Sorrentino, C.; Principi, M.; Montenegro, L.; Amoruso, A.; Di Leo, A. Seronegative celiac disease: Where is the specific setting? Gastroenterol. Hepatol. Bed Bench 2015, 8, 110–116. [Google Scholar]
- Tosco, A.; Maglio, M.; Paparo, F.; Rapacciuolo, L.; Sannino, A.; Miele, E.; Barone, M.V.; Auricchio, R.; Troncone, R. Immunoglobulin A anti-tissue transglutaminase antibody deposits in the small intestinal mucosa of children with no villous atrophy. J. Pediatr. Gastroenterol. Nutr. 2008, 47, 293–298. [Google Scholar] [CrossRef]
- Koskinen, O.; Collin, P.; Lindfors, K.; Laurila, K.; Mäki, M.; Kaukinen, K. Usefulness of small-bowel mucosal transglutaminase-2 specific autoantibody deposits in the diagnosis and follow-up of celiac disease. J. Clin. Gastroenterol. 2010, 44, 483–488. [Google Scholar] [CrossRef] [PubMed]
- Koskinen, O.; Collin, P.; Korponay-Szabo, I.; Salmi, T.; Iltanen, S.; Haimila, K.; Partanen, J.; Mäki, M.; Kaukinen, K. Gluten-dependent small bowel mucosal transglutaminase 2-specific IgA deposits in overt and mild enteropathy coeliac disease. J. Pediatr. Gastroenterol. Nutr. 2008, 47, 436–442. [Google Scholar] [CrossRef] [PubMed]
- Kaukinen, K.; Peräaho, M.; Collin, P.; Partanen, J.; Woolley, N.; Kaartinen, T.; Nuutinen, T.; Halttunen, T.; Mäki, M.; Korponay-Szabo, I. Small-bowel mucosal transglutaminase 2-specific IgA deposits in coeliac disease without villous atrophy: A prospective and randomized clinical study. Scand. J. Gastroenterol. 2005, 40, 564–572. [Google Scholar] [CrossRef]
- Schiepatti, A.; Sanders, D.S.; Biagi, F. Seronegative coeliac disease: Clearing the diagnostic dilemma. Curr. Opin. Gastroenterol. 2018, 34, 154–158. [Google Scholar] [CrossRef] [PubMed]
- Kotze, L.M.S.; Utiyama, S.R.R.; Kotze, L.R.; Nisihara, R. Seronegative celiac disease in Brazilian patients: A series of cases. Arq. Gastroenterol. 2021, 58, 214–216. [Google Scholar] [CrossRef]
- Bernardo, E.V.J.; Manuel, C.C.J.; Federico, P.G. Sero-negative celiac disease: A 12-case series. J. Liver Res. Disord. Ther. 2018, 4, 166–169. [Google Scholar] [CrossRef]
- Volta, U.; Caio, G.; Boschetti, E.; Giancola, F.; Rhoden, K.J.; Ruggeri, E.; Paterini, P.; De Giorgio, R. Seronegative celiac disease: Shedding light on an obscure clinical entity. Dig. Liver Dis. 2016, 48, 1018–1022. [Google Scholar] [CrossRef]
- Aziz, I.; Peerally, M.F.; Barnes, J.H.; Kandasamy, V.; Whiteley, J.C.; Partridge, D.; Vergani, P.; Cross, S.S.; Green, P.H.; Sanders, D.S. The clinical and phenotypical assessment of seronegative villous atrophy; a prospective UK centre experience evaluating 200 adult cases over a 15-year period (2000–2015). Gut 2017, 66, 1563–1572. [Google Scholar] [CrossRef]
- Nardecchia, S.; Auricchio, R.; Discepolo, V.; Troncone, R. Extra-Intestinal Manifestations of Coeliac Disease in Children: Clinical Features and Mechanisms. Front. Pediatr. 2019, 7, 56. [Google Scholar] [CrossRef] [Green Version]
- Yu, X.B.; Uhde, M.; Green, P.H.; Alaedini, A. Autoantibodies in the Extraintestinal Manifestations of Celiac Disease. Nutrients 2018, 10, 1123. [Google Scholar] [CrossRef] [Green Version]
- Popp, A.; Mäki, M. Gluten-Induced Extra-Intestinal Manifestations in Potential Celiac Disease-Celiac Trait. Nutrients 2019, 11, 320. [Google Scholar] [CrossRef] [PubMed] [Green Version]
- Laurikka, P.; Nurminen, S.; Kivelä, L.; Kurppa, K. Extraintestinal Manifestations of Celiac Disease: Early Detection for Better Long-Term Outcomes. Nutrients 2018, 10, 1015. [Google Scholar] [CrossRef] [PubMed] [Green Version]
- Jericho, H.; Sansotta, N.; Guandalini, S. Extraintestinal manifestations of celiac disease: Effectiveness of the gluten-free diet. J. Pediatr. Gastroenterol. Nutr. 2017, 65, 75–79. [Google Scholar] [CrossRef] [PubMed]
- Sansotta, N.; Amirikian, K.; Guandalini, S.; Jericho, H. Celiac disease symptom resolution: Effectiveness of the gluten-free diet. J. Pediatr. Gastroenterol. Nutr. 2018, 66, 48–52. [Google Scholar] [CrossRef]


| Characteristics | Subjects | ||
|---|---|---|---|
| Newly Diagnosed (n = 15) | GFD (n = 33) | Control (n = 10) | |
| Sex, n; females (%) | 13 (86.6) | 27 (81.8) | 6 (60) |
| Mean age, years; ± S.D. | 42.3 ± 12.3 | 45 ± 14.9 | 51.3 ± 13.2 |
| Gastrointestinal manifestations, % | 40 | 51.5 | 0 |
| GFD duration, years; mean ± S.D. | 0 | 5.4 ± 6.2 | 0 |
| Family history for: | |||
| 0 | 15.1 | 0 |
| 20 | 15.1 | 0 |
| Marsh–Oberhuber stage, n (%) | T3a = 4 (26.6) T3b = 6 (40) T3c = 5 (33,3) | T0 = 8 (24.2) T1 = 1 (3.03) T2 = 4 (12.1) T3a = 9 (27.2) T3b = 8 (24.2) T3c = 3 (9.09) | normal duodenal histology |
| Positive IgA tTG and/or IgA EMA, n (%) | 6 (40) | 14 (42.4) | 0 |
Publisher’s Note: MDPI stays neutral with regard to jurisdictional claims in published maps and institutional affiliations. |
© 2022 by the authors. Licensee MDPI, Basel, Switzerland. This article is an open access article distributed under the terms and conditions of the Creative Commons Attribution (CC BY) license (https://creativecommons.org/licenses/by/4.0/).
Share and Cite
Domsa, E.M.; Berindan-Neagoe, I.; Budisan, L.; Braicu, C.; Para, I.; Tantau, A.I.; Orasan, O.H.; Ciobanu, L.; Pop, T.A.; Filip, G.A.; et al. Expression of Selected Genes and Circulating microRNAs in Patients with Celiac Disease. Medicina 2022, 58, 180. https://doi.org/10.3390/medicina58020180
Domsa EM, Berindan-Neagoe I, Budisan L, Braicu C, Para I, Tantau AI, Orasan OH, Ciobanu L, Pop TA, Filip GA, et al. Expression of Selected Genes and Circulating microRNAs in Patients with Celiac Disease. Medicina. 2022; 58(2):180. https://doi.org/10.3390/medicina58020180
Chicago/Turabian StyleDomsa, Elena Maria, Ioana Berindan-Neagoe, Livia Budisan, Cornelia Braicu, Ioana Para, Alina Ioana Tantau, Olga Hilda Orasan, Lidia Ciobanu, Teodora Atena Pop, Gabriela Adriana Filip, and et al. 2022. "Expression of Selected Genes and Circulating microRNAs in Patients with Celiac Disease" Medicina 58, no. 2: 180. https://doi.org/10.3390/medicina58020180
APA StyleDomsa, E. M., Berindan-Neagoe, I., Budisan, L., Braicu, C., Para, I., Tantau, A. I., Orasan, O. H., Ciobanu, L., Pop, T. A., Filip, G. A., Leach, N., Negrean, V., Matei, D., & Andreica, V. (2022). Expression of Selected Genes and Circulating microRNAs in Patients with Celiac Disease. Medicina, 58(2), 180. https://doi.org/10.3390/medicina58020180