Article

Fibrinogen-like Protein 1 as a Predictive Marker for the Incidence of Severe Acute Pancreatitis and Infectious Pancreatic Necrosis

1
Department of Pancreatic and Biliary Surgery, The First Affiliated Hospital of Harbin Medical University, Harbin 150001, China
2
Department of Abdominal Surgery, Guiqian International General Hospital, Guiyang 550024, China
3
Key Laboratory of Hepatosplenic Surgery, Ministry of Education, Harbin 150001, China
*
Authors to whom correspondence should be addressed.
These authors contributed equally to this work.
Medicina 2022, 58(12), 1753; https://doi.org/10.3390/medicina58121753
Submission received: 2 October 2022 / Revised: 17 November 2022 / Accepted: 22 November 2022 / Published: 29 November 2022
(This article belongs to the Special Issue Acute and Chronic Pancreatitis, Pancreatic Malignancies)

Abstract

:
Background and Objectives: Acute pancreatitis (AP) is defined as an acute inflammatory disorder of the pancreas and is a common gastrointestinal disease. Since currently used indicators lack specifics and cannot accurately reflect the phase of disease, better diagnostic approaches need to be explored. Fibrinogen-like protein 1 (FGL-1) is a reactant in acute inflammatory diseases and is increased in the plasma of AP patients. In the current study, we aim to investigate the clinical benefits of FGL-1 in predicting the severity of AP and infected pancreatic necrosis (IPN), which can improve the diagnostic efficiency of AP. Materials and Methods: In this study, 63 patients diagnosed with AP from December 2018 to September 2019 were enrolled. Regarding the severity of AP, patients were separated into severe acute pancreatitis (SAP, n = 12) and No-SAP groups (n = 51). On the basis of infective conditions, patients were divided into IPN (n = 9) and No-IPN (n = 54) groups. The demographic data (sex and age) and blood parameters (WBC, HCT, glucose, calcium, FIB, APTT, PCT, CRP, and FGL-1) were retrospectively analyzed. Results: The plasma FGL-1 levels were increased in both SAP (p < 0.01) and IPN (p < 0.05) subgroups compared to the healthy control group. Multivariate analysis showed that elevated plasma FGL-1 (p < 0.01) and PCT levels (p < 0.05) within 72 h after the onset of AP were positively correlated with the severity of AP, while increased plasma FGL-1 (p < 0.01) and CRP (p < 0.05) levels were positively correlated with the occurrence of IPN. The combination of FGL-1 and PCT showed superiority to both individual markers in SAP prediction. However, the combination of FGL-1 and CRP showed no diagnostic advantage over CRP in IPN prediction. Conclusions: Plasma FGL-1 within 72 h after the onset could be used for the stratification of AP and its infectious complications. The combination of PCT and FGL-1 presents an enormous advantage for the early identification of SAP.

1. Introduction

Acute pancreatitis (AP) is an inflammatory disease caused by activated trypsin, leading to pancreatic autodigestion, edema, and even infection or necrosis. AP is a common acute abdomen disease in emergency rooms that can be stratified to mild, moderate, and severe according to the revised Atlanta Classification [1]. Mild pancreatitis is usually presented as a self-limiting disease from which patients can recover within one week. The prolonged and recurrent AP can develop to chronic pancreatitis or pancreatic intraepithelial neoplasia, ultimately increasing the risk of pancreatic cancer [2]. Severe acute pancreatitis (SAP) is characterized by rapid onset and higher mortality ranging from 15% to 30% [3,4,5]. The occurrence of multiple organ failure (MOF) and infected pancreatic necrosis (IPN) are major risk factors for poor prognosis. Due to lacking predictability of diagnosis and management, the best timing of therapy may be delayed. Thus, it is urgent to discover biomarkers for early and timely diagnosis that may effectively predict the severity and complications of AP.
The severity score classification systems which are commonly used in AP include Ranson, Glasgow, Acute Physiology and Chronic Health Evaluation II (APACHE-II), and CT severity index (CTSI) (or modified CTSI). However, there are limited uses in clinics due to complicated operation and lack of timeliness [6]. In recent years, the early achievable severity index (EASY) has been considered as a practical tool for identifying patients with a high risk of SAP, with an average area under curve (AUC) score of 0.81 ± 0.033 and accuracy of 89.1%. Nevertheless, none of the single parameters, as well as complex evaluation of multiple clinical, radiological, and biochemical parameters, can precisely identify patients with a high risk of SAP in the early phase of disease. Many studies have explored useful biomarkers for evaluating the severity of AP and predicting related complications. Several biomarkers have been selected as candidates for predicting patients’ outcome, such as interleukin-6 (IL-6), C-reactive protein (CRP), procalcitonin (PCT), and copeptin [7,8,9,10]. CRP and PCT are regarded as the most promising parameters, but their sensitivity and specificity are still limited [7,11]. Fibrinogen-like protein 1 (FGL-1), a member of the fibrinogen family, is derived from hepatocytes, and plays crucial roles in hepatic steatosis and insulin resistance [12]. Similar to CRP, FGL-1 is an acute-phase reactant synthesized by hepatocytes that responses to local and systemic inflammatory processes. Moreover, IL-6 increases FGL-1 expression and directly exacerbates downstream acute inflammatory response [13]. A previous study has shown increased circulating FGL-1 levels in acute alcoholic pancreatitis, but few studies have discussed the association between elevated FGL-1 level and the stratification of inflammatory diseases [14].
In the current study, the plasma level of FGL-1 was tested in AP patients within the onset time point of 72 h. Herein, we investigate the efficacy of FGL-1 to evaluate the severity of AP and the occurrence of IPN.

2. Materials and Methods

2.1. Patients

As a retrospective study, a total of 67 patients diagnosed with AP in the First Affiliated Hospital of Harbin Medical University from December 2018 to September 2019 were recruited; 63 (39 males and 24 females) patients fulfilled the inclusion criteria and were finally enrolled, and 4 patients were excluded due to incomplete clinical data. All patients met the criteria for AP according to the revised Atlanta 2012 criteria. SAP is defined as persistent organ failure lasting for more than 48 h with or without local or systemic complications. The diagnostic criteria for organ failure was following the modified Marshall score system (with a score of 2 or more indicating the presence of organ failure in any system). IPN diagnosis can be suspected through the patient’s clinical course (fever) or the presence of gas within the collection in CECT. Patients with pancreatic parenchymal necrosis and/or peripancreatic necrosis, including acute necrotic collection (ANC) in the early stage and walled-off necrosis (WON) in the late stage, were diagnosed with IPN. Fine-needle aspiration is a valuable procedure for the evaluation of necrosis. The inclusion criteria of AP patients were as follows: (1) diagnosed with AP; (2) older than 18 years old; (3) first onset and within 72 h. The exclusion criteria were as follows: (1) pregnant women and children; (2) patients with malignancies; (3) combined with immune deficiency disease or autoimmune pancreatitis; (4) patients with incomplete clinical data. Patients were divided into SAP and No-SAP groups by incidence of organ failure and its duration. Regarding the basis of clinical symptoms, imaging, and pus puncture bacterial culture, patients were divided into IPN and No-IPN groups. The clinical data of the patients’ age, sex, and other general data are shown in Table 1. All participated patients signed informed consent, and this study was approved by the ethics committee of the First Affiliated Hospital of Harbin Medical University.

2.2. Clinical Data Collection

Clinical data of patients who met the inclusion criteria were collected: (1) general data, including sex, age, smoking history, onset time of abdominal pain, length of hospital, etiology and complications (heart disease, diabetes and hypertension); (2) laboratory parameters, such as white blood cells (WBC), hematocrit (HCT), activated partial thromboplastin time (APTT), fibrinogen (FIB), blood glucose, blood calcium, CRP and PCT in plasma for the first time after admission; (3) FGL-1 determination: the plasma of AP patients within the time point of onset for 72 h was collected and spun at 1000× g 4 °C for 15 min, then stored at −80 °C for use. The plasma FGL-1 concentration was determined by Human Fibrinogen-Like Protein 1 (FGL1) ELISA Kit (Cusabio, Wuhan, Hunan, China). Briefly, FGL1 antibody was precoated in a microplate. Standards and samples (50 μL) and detection antibody solution were loaded. The plate was incubated for 2 h at room temperature. After removing unbound substances, the avidin-conjugated horseradish peroxidase (HRP) was added and incubated for 30 min. Then, the stop solution was added and the optical density (OD) was obtained from a spectrophotometer using 450 nm as reference and 630 nm as correction wavelength (Thermo Fisher Scientific, Waltham, MA, USA). The standard curve was generated and the concentration of samples were calculated.

2.3. Statistical Analysis

SPSS software (IBM SPSS25.0, SPSS Inc., Chicago, IL, USA) was used for data analysis, and ROC curves were plotted using GraphPad Prism 9.0. The categorical variables were expressed in numbers and percentages (n, %), while Pearson chi-square test or Fisher exact probability test were used for significance analysis. Continuous variables were expressed as mean and standard deviation (x ± SD) or median and interquartile range (IQR). A non-parametric Mann–Whitney test of skewness distribution variables or a t-test of normal distribution variables was used for different intergroup comparison. Independent predictors were determined by a multiple logistic regression model. p < 0.05 was recognized as statistically significant.

3. Results

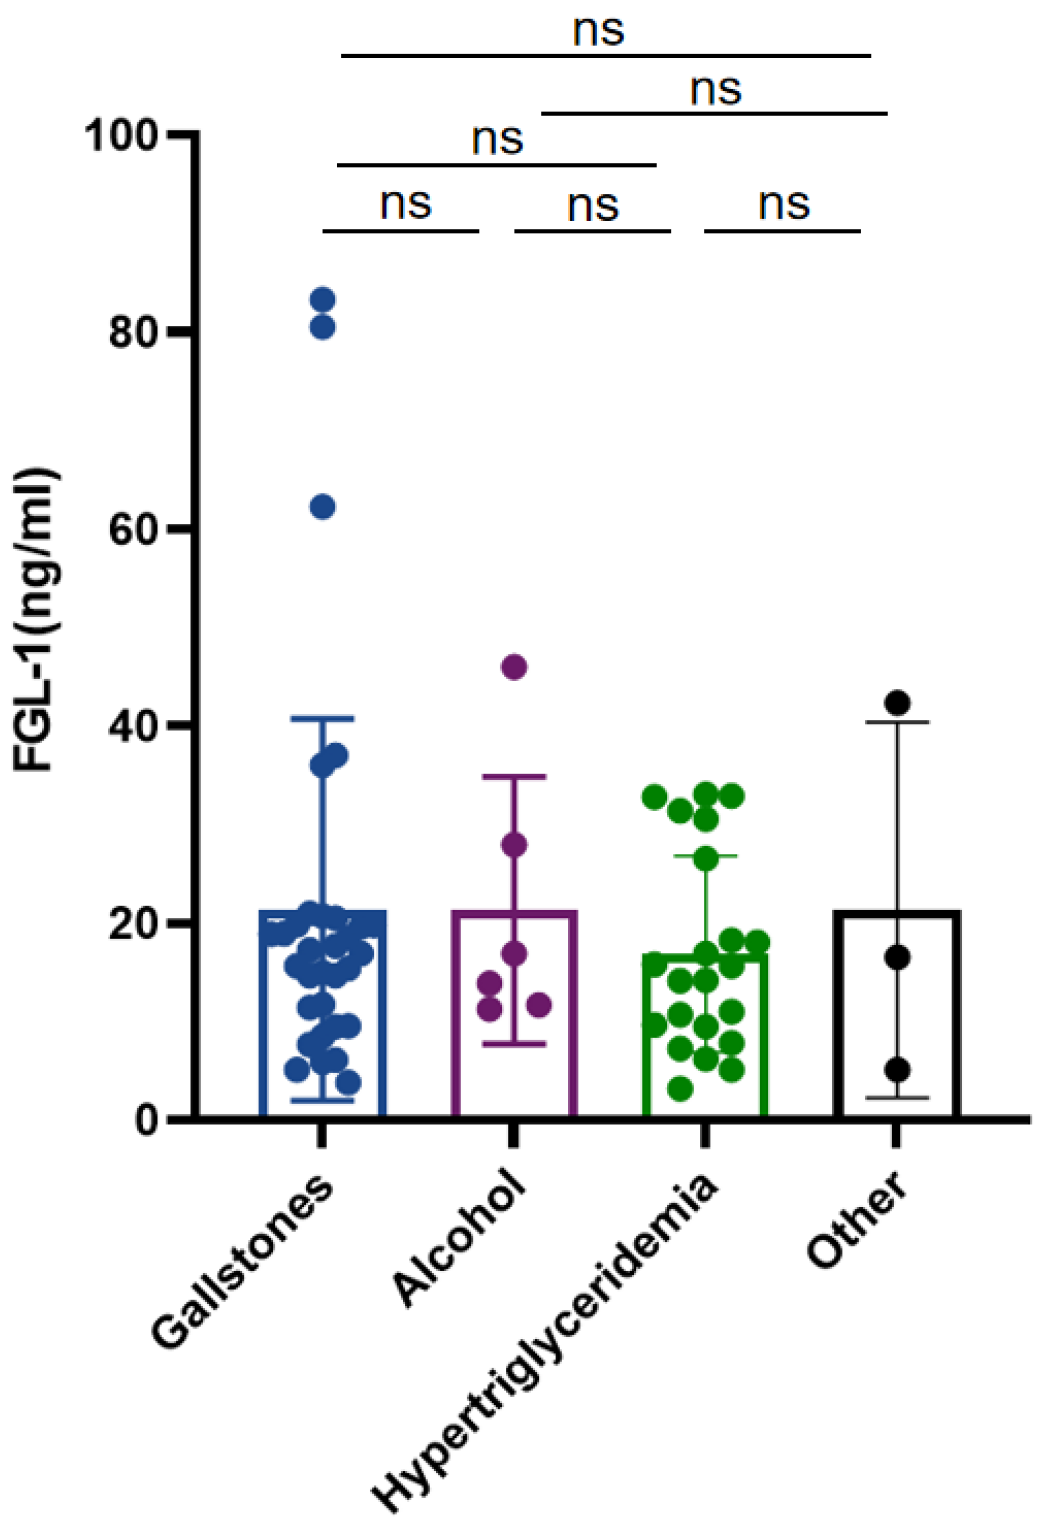
3.1. Patient Characteristics

A total of 63 patients diagnosed with AP were enrolled in this study. According to 2012 Atlanta Classification, patients were divided into MAP (n = 48), MSAP (n = 3) and SAP (n = 12). Since only three patients comprised the diagnosed-with-MSAP group, they were not defined as a subgroup. Patients were divided into a SAP group (n = 12) and No-SAP group (n = 51). Subsequently, patients were divided into an IPN group (n = 9) and No-IPN group (n = 54) according to whether they were complicated with IPN.
No difference was found in gender, age, smoking history, complications and etiology between the SAP and No-SAP groups. The hospitalization time was longer in the SAP group compared to the No-SAP group (26.0 (10.5~34.8) vs. 8.0 (6.0~12.0), p < 0.001) (Table 1). No difference was found between the IPN and Non-IPN groups in gender, age, smoking history, complications and etiology. Similarly, the hospitalization time was longer in the IPN group than the No-IPN group (18.5 (33.0~50.0) vs. 8.0 (5.75~11.25), p < 0.001) (Table 2). Among all of the etiologies, gallstones were the main cause of AP, followed by hypertriglyceridemia. The FGL-1 level showed no difference among different etiologies (Figure 1).

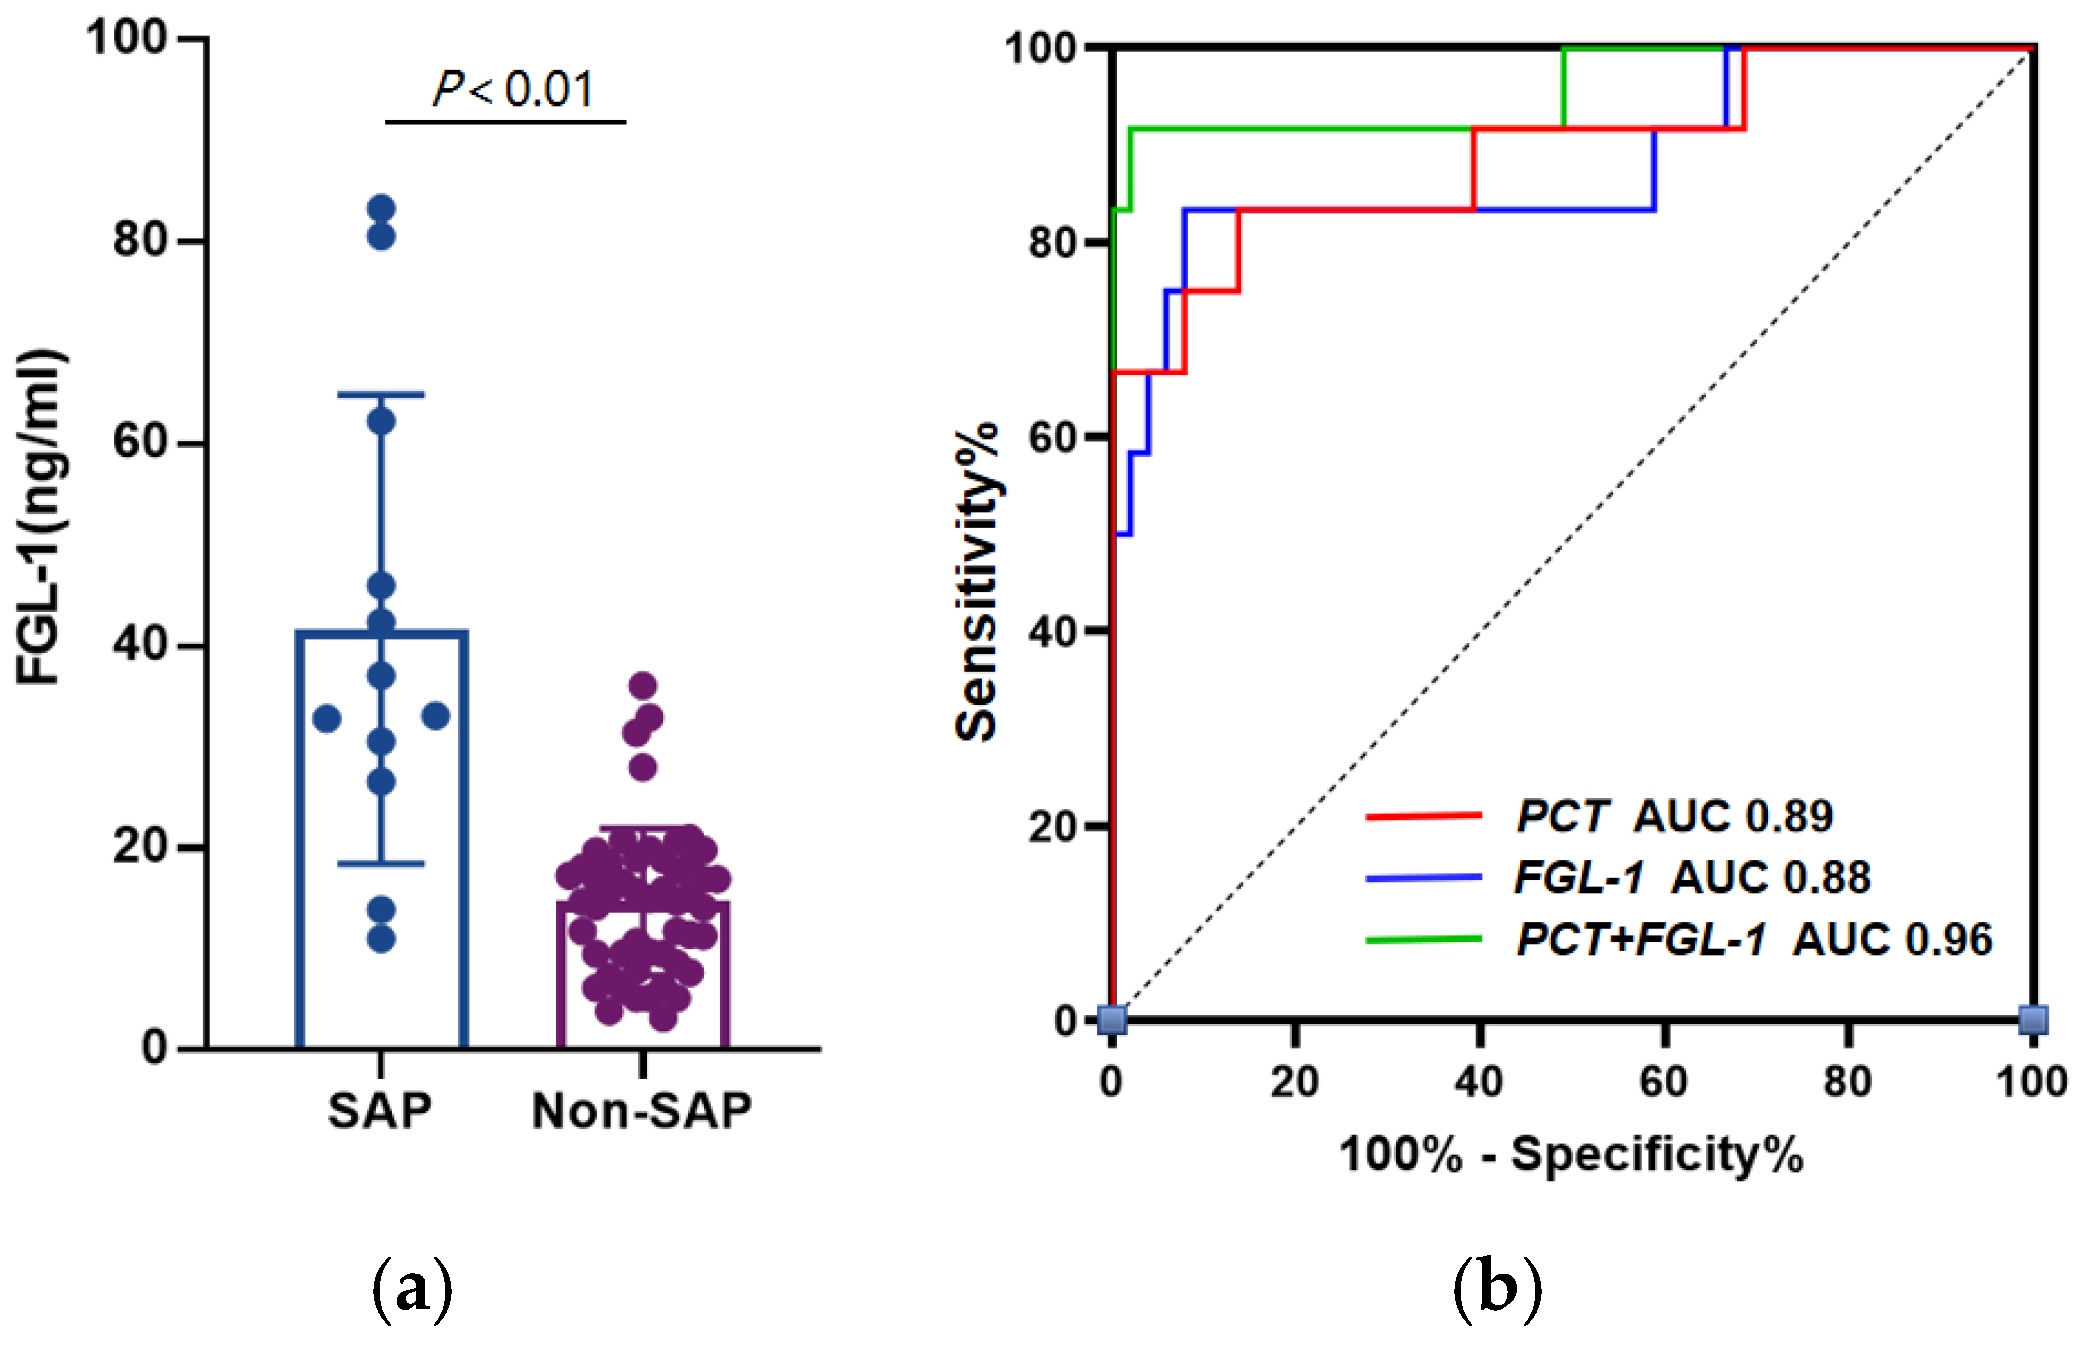
3.2. FGL-1 and PCT Shows Excellent Diagnostic Power in SAP

It was found that the plasma FGL-1 level was significantly higher in the SAP group than the No-SAP group ((41.63 ± 23.20) ng/mL vs. (14.66 ± 7.27) ng/mL, p = 0.002) (Figure 2a). Univariate analysis revealed that plasma PCT (p = 0.002), CRP (p = 0.031) and FGL-1 (p < 0.001) levels within 72 h after the onset of AP showed a positive correlation with the onset of SAP (Table 3). Multivariate analysis indicated that PCT > 0.5 ng/mL (p = 0.049) and FGL-1 > 23.78 ng/mL (p = 0.001) were independent risk factors for SAP (Table 4). The ROC curves were then used to explore the efficacy of the above markers for predicting SAP (Figure 2b). The areas under the ROC curves of PCT and FGL-1 were 0.89 (95% CI, 0.77–1.00) and 0.88 (95% CI, 0.75–1.00), respectively. The sensitivity, specificity and cutoff value of PCT were 83.33%, 88.24% and 1.26 ng/mL, and those of FGL-1 were 83.33%, 94.12% and 23.78 ng/mL.

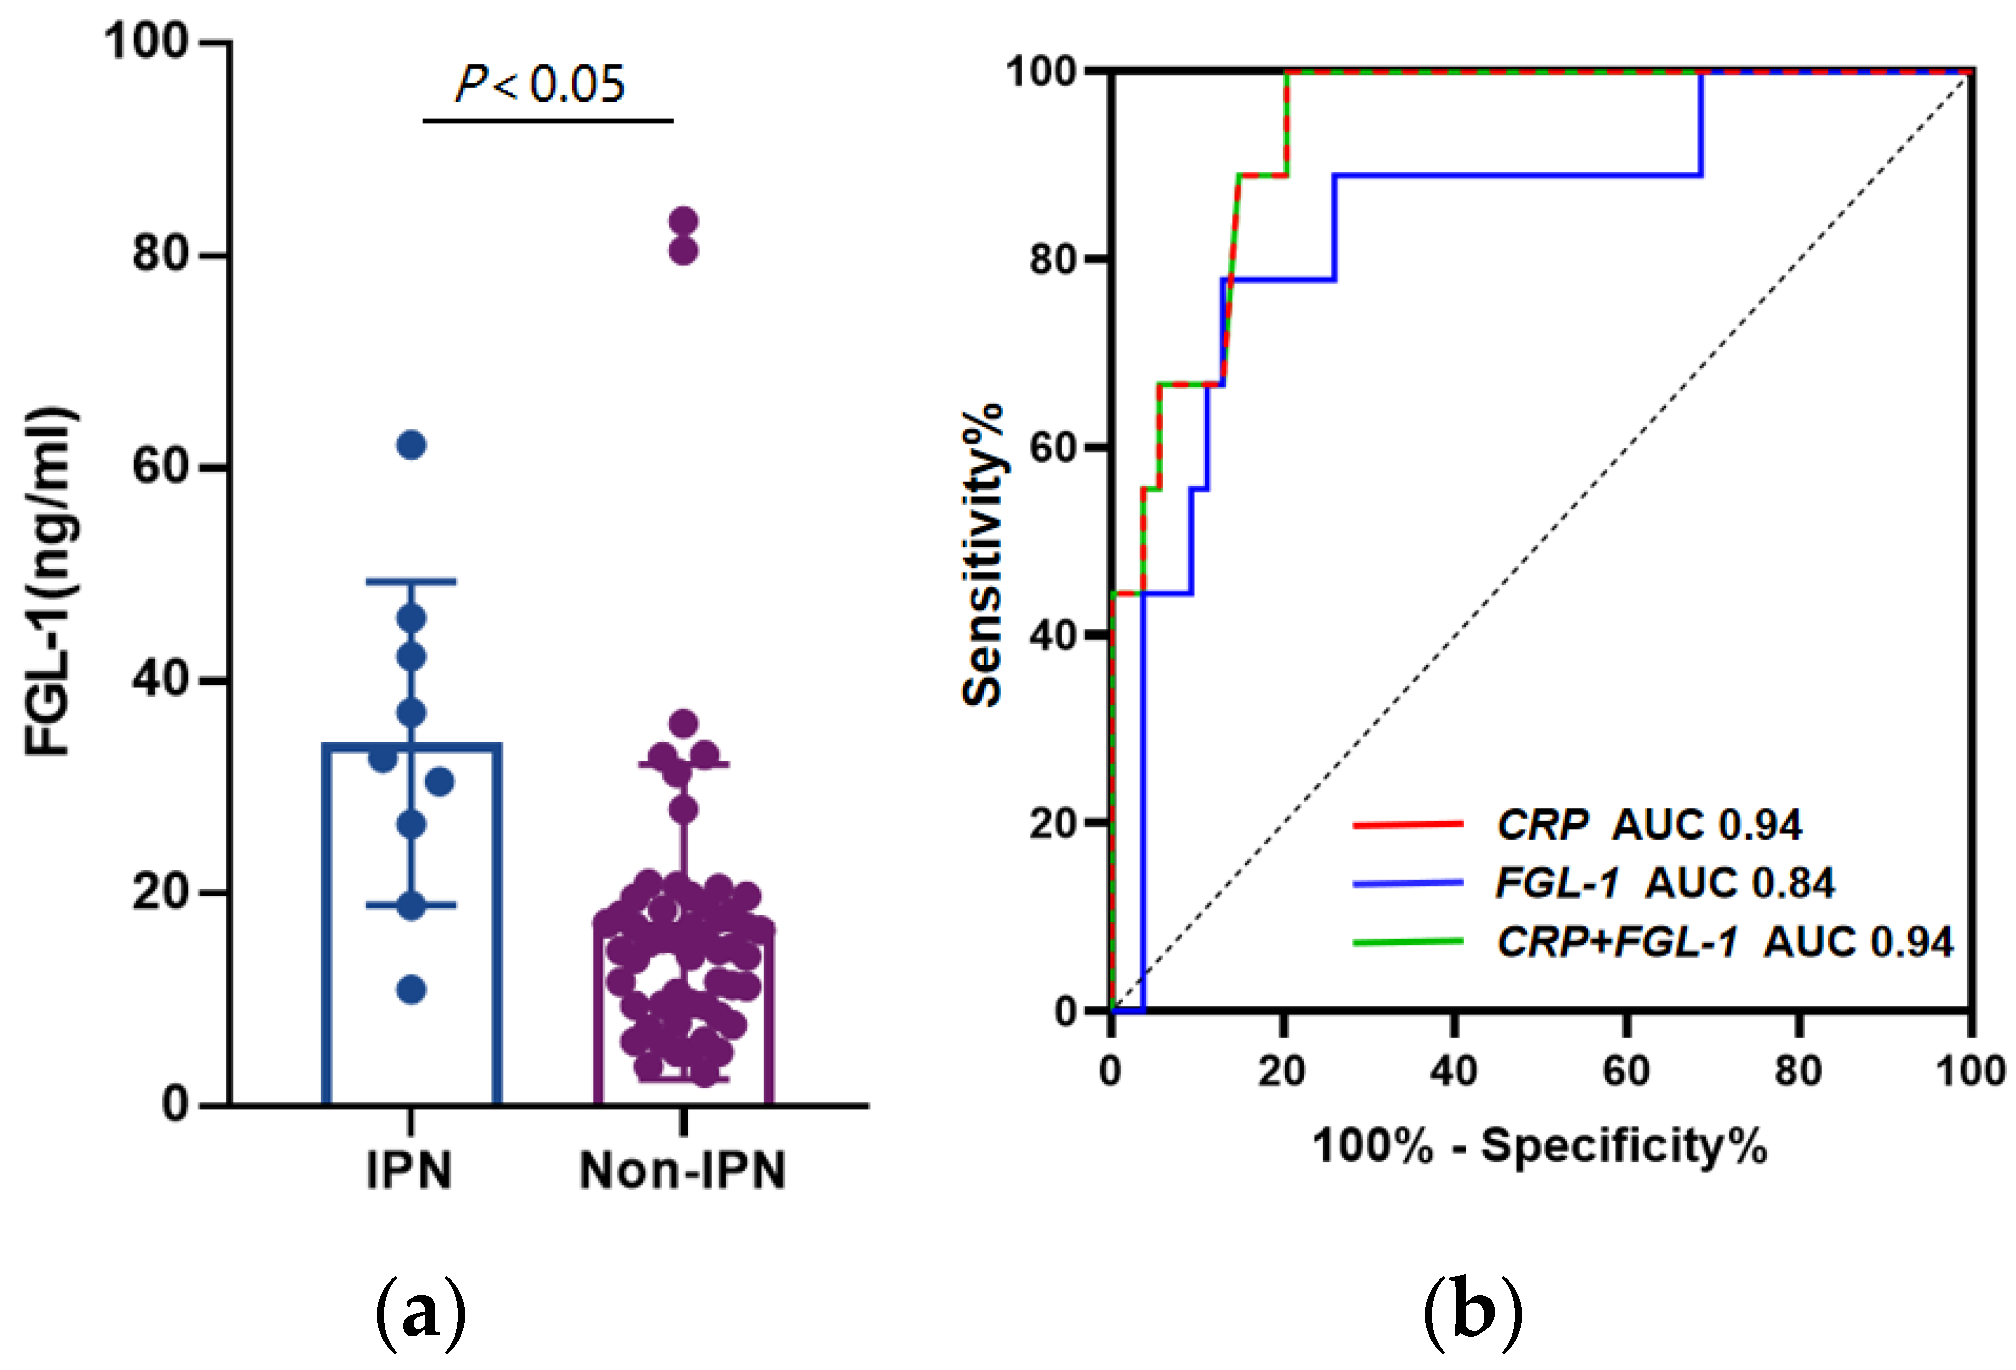
3.3. FGL-1 and CRP Shows Better Diagnostic Power in IPN

Our data revealed that the plasma FGL-1 level was significantly higher in the IPN group compared with the No-IPN group ((34.17 ± 15.19) ng/mL vs. (17.40 ± 14.80) ng/mL, p = 0.011) (Figure 3a). Univariate analysis demonstrated that plasma PCT, CRP and FGL-1 levels were positively correlated with the occurrence of IPN (p < 0.001) (Table 3). Multivariate analysis suggested that CRP > 430 mg/dL (p = 0.021) and FGL-1 > 23.79 ng/mL (p = 0.006) were independent risk factors for IPN (Table 4). Since both FGL-1 and CRP levels were increased in IPN patients, ROC curves were plotted to investigate the efficacy of either, or in combination, in IPN prediction (Figure 3b). The areas under the ROC curves of CRP and FGL-1 were 0.94 (95% CI, 0.87–1.00) and 0.84 (95% CI, 0.70–0.99), respectively, and the sensitivity, specificity and cutoff value of CRP were 100%, 79.63% and 397 mg/dL, and these of FGL-1 were 77.78%, 87.04% and 23.79 ng/mL.

3.4. Combination of FGL-1 and PCT Improves the Predictive Capability for SAP

In the prediction model of SAP, the areas under the ROC curves of PCT combined with FGL-1 was 0.96 (95% CI, 0.88–1.00), and the sensitivity and specificity were 91.67% and 98.04% (Figure 2b). In the prediction model of IPN, the areas under the ROC curves of CRP combined with FGL-1 was 0.94 (95% CI, 0.87–1.00), and the sensitivity and specificity were 100% and 79.63%, which was similar to CRP (Figure 3b). Furthermore, a combined diagnostic model was developed using logistic regression analysis. The AUC, sensitivity, specificity, accuracy, positive likelihood ratio (LR+), negative likelihood ratio (LR−), positive predictive value (PPV) and negative predictive value (NPV) of combined detection are shown in Table 5 and Table 6.

4. Discussion

AP is a potentially life-threatening inflammatory disease with two death peaks. Multiple organ failure caused by inflammatory reactions induces the first death peak. IPN-related infectious complications are the factors leading to sepsis or organ failure, which cause the second death peak in later stage [15,16,17]. The outcome of AP is rapidly changing and fluctuates unpredictably [18]. Currently, clinical scoring systems, for instance, Ranson, Glasgow and APACHE-II, are complicated to calculate and take at least 48 h to determine. These shortcomings reflect the urgency to figure out simple biochemical parameters to estimate the development of AP at an early stage, and effective intervention can be achieved prior to rapid exacerbation [19]. In addition, identifying mild diseases will avoid over-treatment and cut the economic burden.
Fibrinogen-like protein 1 (FGL-1), also known as hepassocin, is a member of the fibrinogen family. FGL-1 induces hepatocyte proliferation and repairs liver injury by activating the epidermal growth factor receptor (EGFR) and SRC-dependent pathways [20,21,22]. FGL-1 was initially found to be highly expressed in human liver. It also exists in plasma, and approximately 20% of FGL-1 is in an unbound free state, indicating that its biological effects may be systemic [12,23,24]. FGL-1 is increased in cross types of cancers, including lung cancer, pancreatic cancer, colorectal cancer and melanoma, and a higher level in tumors indicates poor prognosis. Additionally, FGL-1 is the main immune ligand of lymphocyte-activation gene 3 (LAG-3) that negatively regulates T cells’ activation and plays a vital role in hepatocyte regeneration, glucose and lipid metabolism, as well as serving as a potential target for cancer immunotherapy [25,26,27]. Moreover, FGL-1 is considered as a promoter of inflammatory processes and causes liver injury through activating the IL-6/STAT3 signaling pathway [12]. Protein omics suggest that FGL1 acts as a biomarker for predicting rheumatoid arthritis progression and could be used for evaluating the pathogenesis of Crohn’s disease [28,29]. These findings hint at the potential effects of FGL-1 in immune activation and inflammatory development in AP.
Our study revealed that the plasma FGL-1 level was significantly increased in SAP patients and those accompanied with IPN (p < 0.05) (Figure 2a and Figure 3a), and increased FGL-1 level was positively associated with SAP and IPN. FGL-1 level has been found to be elevated in acute alcoholic pancreatitis [14,23]. However, our data indicated no difference between different AP subtypes, suggesting that AP induced FGL1 elevation in an etiology-independent manner (Figure 1). Cholelithiasis is the top cause of AP in China, followed by alcoholic factors. Due to the changes in dietary pattern and lifestyle shift, the incidence of hypertriglyceridemic pancreatitis is increasing and becoming the second leading cause [30]. PCT and CRP are satisfactory biomarkers and indicate beneficial effects of predicting the severity of AP and incidence of IPN. CRP, with a concentration over 150 mg/dL, is regarded as an accurate index to evaluate the incidence of SAP, and the sensitivity and specificity are 80~86% and 61~84% [7,8]. PCT has been considered as an early indicator of systemic bacterial infection, sepsis and organ failure [9]. The sensitivity and specificity for SAP prediction are 73% and 87% when the concentration is over 0.5 ng/mL [11]. In the current study, CRP showed no benefit in SAP prediction, while a higher PCT level presented positive relevance to SAP (p < 0.05) (Table 4). The possible causes could be either the plasma FGL-1 level reaching the peak around 72 h or that it is susceptible to other inflammatory diseases. Rau et al. have found that PCT > 3.5 ng/mL and CRP > 430 mg/dL are indicators for IPN. The sensitivity and specificity of PCT are 93% and 88% and those of CRP are 40% and 100%, which delineate the superiority of PCT over CRP [31]. Nevertheless, PCT showed no more power than CRP in our study (Table 6).
Our findings indicated that FGL-1 and PCT had exactly the same sensitivity (83.33%) in SAP prediction, and the specificity of FGL-1 was higher than PCT (94.12% vs. 88.24%). The combination was superior to both single indexes (AUC: 0.96, sensitivity: 91.67%, specificity: 98.04%). In the occurrence of IPN, the sensitivity of CRP was more remarkable than FGL-1 (100% vs. 77.78%), but the specificity was relatively poor (79.63% vs. 87.04%). In addition, the efficacy of the combination was consistent with CRP alone, demonstrating less necessity to integrate both markers for IPN evaluation. FGL-1 acts as a key regulator of organ failure in SAP patients. A previous study has reported that the activation of fibrin-like protein 2 (FGL-2), as the homologous protein of FGL-1, leads to the deposition of fibrin and the formation of microthrombosis, which exhibits the severity of AP [32]. Since FGL-1 and FGL-2 share parts of similar biological properties, further studies need to be raised to elucidate their biological roles in AP progression.
This study’s limitations are that it was a single-center study with a small sample size; a multi-center and large-sample study needs to be launched. Nevertheless, the current study presents novel non-invasive markers and views of tracking the development of AP, which will improve AP patients’ outcome.

5. Conclusions

In summary, our study discovers that increased plasma level of FGL-1 within 72 h after the onset is associated with the severity of AP. The combination of FGL-1 and PCT is superior to single indexes in SAP prediction, which provides a new approach for the stratification of AP.

Author Contributions

Conceptualization, Y.S. and Z.Z.; methodology, Y.S.; software, Z.Z.; validation, Y.S., Z.Z. and T.Z.; formal analysis, Y.S.; investigation, Y.Z.; resources, L.L. (Le Li) and H.T.; data curation, G.L. and L.L. (Liwei Liu); writing—original draft preparation, Y.S.; writing—review and editing, L.L. (Le Li); visualization, Y.S. and L.L. (Le Li); supervision, B.S.; project administration, L.L. (Le Li); funding acquisition, B.S., H.T. and L.L. (Le Li). All authors have read and agreed to the published version of the manuscript.

Funding

This work was supported by The National Natural Science Foundation of China (NO. 82270666, NO. 82070658, NO. 81871974); the Fund of scientific research innovation of First Affiliated Hospital of Harbin Medical University (NO. 2020M15) and 2021 Heilongjiang Natural Science Foundation Joint Project (NO.LH2021H048); and the Youth Innovation Talent Training Program of the General Undergraduate Colleges and Universities in Heilongjiang province (NO.UNPYSCT-2020157) and the Science Fund for Excellent Young Scholars of First Affiliated Hospital of Harbin Medical University (NO. HYD2020YQ0009).

Institutional Review Board Statement

The study was conducted in accordance with the Declaration of Helsinki, and approved by the Institutional Review Board of The First Affiliated Hospital of Harbin Medical University (protocol code 201822 and date of approval 4 September 2018).

Informed Consent Statement

Written informed consent has been obtained from the patients to publish this paper.

Data Availability Statement

Not applicable.

Conflicts of Interest

The authors declare no conflict of interest.

References

  1. Banks, P.A.; Bollen, T.L.; Dervenis, C.; Gooszen, H.G.; Johnson, C.D.; Sarr, M.G.; Tsiotos, G.G.; Vege, S.S. Acute Pancreatitis Classification Working Group. Classification of acute pancreatitis—2012: Revision of the Atlanta classification and definitions by international consensus. Gut 2013, 62, 102–111. [Google Scholar] [CrossRef]
  2. Lazzarin, G.; Romano, L.; Coletti, G.; Di Sibio, A.; Vicentini, V.; Fatayer, M.W.A.; Schietroma, M.; Pessia, B.; Leone, M.; Carlei, F.; et al. Branch Duct—IPMN and PanIN, in IgG4-Autoimmune pancreatitis: A case report. Clin. Case Rep. 2020, 10, 2111–2115. [Google Scholar] [CrossRef]
  3. Lodewijkx, P.J.; Besselink, M.G.; Witteman, B.J.; Schepers, N.J.; Gooszen, H.G.; van Santvoort, H.C.; Bakker, O.J.; Dutch Pancreatitis Study Group. Nutrition in acute pancreatitis: A critical review. Expert Rev. Gastroenterol. Hepatol. 2016, 10, 571–580. [Google Scholar] [CrossRef] [PubMed]
  4. Gukovskaya, A.S.; Gukovsky, I.; Algül, H.; Habtezion, A. Autophagy, inflammation, and immune dysfunction in the pathogenesis of pancreatitis. Gastroenterology 2017, 153, 1212–1226. [Google Scholar] [CrossRef] [Green Version]
  5. Kylänpää, M.L.; Repo, H.; Puolakkainen, P.A. Inflammation and immunosuppression in severe acute pancreatitis. World J. Gastroenterol. 2010, 16, 2867–2872. [Google Scholar] [CrossRef]
  6. Matull, W.R.; Pereira, S.P.; O’Donohue, J.W. Biochemical markers of acute pancreatitis. J. Clin. Pathol. 2006, 59, 340–344. [Google Scholar] [CrossRef] [PubMed] [Green Version]
  7. Khanna, A.K.; Meher, S.; Prakash, S.; Tiwary, S.K.; Singh, U.; Srivastava, A.; Dixit, V.K. Comparison of Ranson, Glasgow, MOSS, SIRS, BISAP, APACHE-II, CTSI Scores, IL-6, CRP, and Procalcitonin in Predicting Severity, Organ Failure, Pancreatic Necrosis, and Mortality in Acute Pancreatitis. HPB Surg. 2013, 2013, 367581. [Google Scholar] [CrossRef] [Green Version]
  8. Neoptolemos, J.P.; Kemppainen, E.A.; Mayer, J.M.; Fitzpatrick, J.M.; Raraty, M.G.; Slavin, J.; Beger, H.G.; Hietaranta, A.J.; Puolakkainen, P.A. Early prediction of severity in acute pancreatitis by urinary trypsinogen activation peptide: A multicentre study. Lancet 2000, 355, 1955–1960. [Google Scholar] [CrossRef]
  9. Woo, S.M.; Noh, M.H.; Kim, B.G.; Hsing, C.T.; Han, J.S.; Ryu, S.H.; Seo, J.M.; Yoon, H.A.; Jang, J.S.; Choi, S.R.; et al. Comparison of serum procalcitonin with Ranson, APACHE-II, Glasgow and Balthazar CT severity index scores in predicting severity of acute pancreatitis. Korean J. Gastroenterol. 2011, 5, 831–837. [Google Scholar] [CrossRef] [Green Version]
  10. Isman, F.K.; Zulfikaroglu, B.; Isbilen, B.; Ozalp, N.; Ozmen, M.M.; Bilgic, I.; Koc, M. Copeptin is a predictive biomarker of severity in acute pancreatitis. Am. J. Emerg. Med. 2013, 31, 690–692. [Google Scholar] [CrossRef]
  11. Mofidi, R.; Suttie, S.A.; Patil, P.V.; Ogston, S.; Parks, R.W. The value of procalcitonin at predicting the severity of acute pancreatitis and development of infected pancreatic necrosis: Systematic review. Surgery 2009, 146, 72–81. [Google Scholar] [CrossRef]
  12. Wu, H.T.; Chen, S.C.; Fan, K.C.; Kuo, C.H.; Lin, S.Y.; Wang, S.H.; Chang, C.J.; Li, H.Y. Targeting fibrinogen-like protein 1 is a novel therapeutic strategy to combat obesity. FASEB J. 2020, 34, 2958–2967. [Google Scholar] [CrossRef] [PubMed]
  13. Liu, Z.; Ukomadu, C. Fibrinogen-like protein 1, a hepatocyte derived protein is an acute phase reactant. Biochem. Biophys. Res. Commun. 2008, 365, 729–734. [Google Scholar] [CrossRef] [Green Version]
  14. Waldron, R.T.; Lugea, A.; Gulla, A.; Pandol, S.J. Proteomic Identification of Novel Plasma Biomarkers and Pathobiologic Pathways in Alcoholic Acute Pancreatitis. Front. Physiol. 2018, 9, 1215. [Google Scholar] [CrossRef] [Green Version]
  15. Bhatia, M.; Brady, M.; Shokuhi, S.; Christmas, S.; Neoptolemos, J.P.; Slavin, J. Inflammatory mediators in acute pancreatitis. J. Pathol. 2000, 190, 117–125. [Google Scholar] [CrossRef]
  16. Bhatia, M.; Wong, F.L.; Cao, Y.; Lau, H.Y.; Huang, J.; Puneet, P.; Chevali, L. Pathophysiology of acute pancreatitis. Pancreatology 2005, 5, 132–144. [Google Scholar] [CrossRef] [PubMed]
  17. Widdison, A.L.; Karanjia, N.D. Pancreatic infection complicating acute pancreatitis. Br. J. Surg. 1993, 80, 148–154. [Google Scholar] [CrossRef]
  18. Phillip, V.; Steiner, J.M.; Algül, H. Early phase of acute pancreatitis: Assessment and management. World J. Gastrointest. Pathophysiol. 2014, 5, 158–168. [Google Scholar] [CrossRef]
  19. Meher, S.; Mishra, T.S.; Sasmal, P.K.; Rath, S.; Sharma, R.; Rout, B.; Sahu, M.K. Role of Biomarkers in Diagnosis and Prognostic Evaluation of Acute Pancreatitis. J. Biomark. 2015, 2015, 519–534. [Google Scholar] [CrossRef] [PubMed] [Green Version]
  20. Gao, M.; Zhan, Y.Q.; Yu, M.; Ge, C.H.; Li, C.Y.; Zhang, J.H.; Wang, X.H.; Ge, Z.Q.; Yang, X.M. Hepassocin activates the EGFR/ERK cascade and induces proliferation of L02 cells through the Src-dependent pathway. Cell Signal. 2014, 26, 2161–2166. [Google Scholar] [CrossRef] [PubMed]
  21. Li, C.Y.; Cao, C.Z.; Xu, W.X.; Cao, M.M.; Yang, F.; Dong, L.; Yu, M.; Zhan, Y.Q.; Gao, Y.B.; Li, W.; et al. Recombinant human hepassocin stimulates proliferation of hepatocytes in vivo and improves survival in rats with fulminant hepatic failure. Gut 2010, 59, 817–826. [Google Scholar] [CrossRef]
  22. Calvaruso, V. Hepassocin as a treatment for fulminant hepatic failure: Will it translate from rats to human? Gut 2010, 59, 709–710. [Google Scholar] [CrossRef]
  23. Hara, H.; Yoshimura, H.; Uchida, S.; Toyoda, Y.; Aoki, M.; Sakai, Y.; Morimoto, S.; Shiokawa, K. Molecular cloning and functional expression analysis of a cDNA for human hepassocin, a liver-specific protein with hepatocyte mitogenic activity. Biochim. Biophys. Acta 2001, 1520, 45–53. [Google Scholar] [CrossRef]
  24. Rijken, D.C.; Dirkx, S.P.; Luider, T.M.; Leebeek, F.W. Hepatocyte-derived fibrinogen-related protein-1 is associated with the fibrin matrix of a plasma clot. Biochem. Biophys. Res. Commun. 2006, 350, 191–194. [Google Scholar] [CrossRef] [PubMed]
  25. Yu, J.; Li, J.; Shen, J.; Du, F.; Wu, X.; Li, M.; Chen, Y.; Cho, C.H.; Li, X.; Xiao, Z.; et al. The role of Fibrinogen-like proteins in Cancer. Int. J. Biol. Sci. 2021, 17, 1079–1087. [Google Scholar] [CrossRef] [PubMed]
  26. Liu, X.H.; Qi, L.W.; Alolga, R.N.; Liu, Q. Implication of the hepatokine, fibrinogen-like protein 1 in liver diseases, metabolic disorders and cancer: The need to harness its full potential. Int. J. Biol. Sci. 2022, 18, 292–300. [Google Scholar] [CrossRef]
  27. Wang, J.; Sanmamed, M.F.; Datar, I.; Su, T.T.; Ji, L.; Sun, J.; Chen, L.; Chen, Y.; Zhu, G.; Yin, W.; et al. Fibrinogen-like Protein 1 Is a Major Immune Inhibitory Ligand of LAG-3. Cell 2019, 176, 334–347. [Google Scholar] [CrossRef] [Green Version]
  28. Liu, S.; Guo, Y.; Lu, L.; Lu, J.; Ke, M.; Xu, T.; Lu, Y.; Chen, W.; Wang, J.; Kong, D.; et al. Fibrinogen-Like Protein 1 Is a Novel Biomarker for Predicting Disease Activity and Prognosis of Rheumatoid Arthritis. Front. Immunol. 2020, 11, 579228. [Google Scholar] [CrossRef]
  29. Sun, X.L.; Qiao, L.C.; Gong, J.; Wen, K.; Xu, Z.Z.; Yang, B.L. Proteomics identifies a novel role of fibrinogen-like protein 1 in Crohn’s disease. World J. Gastroenterol. 2021, 27, 5946–5957. [Google Scholar] [CrossRef]
  30. Zhang, G.Q.; Wang, G.; Li, L.; Hu, J.S.; Ji, L.; Li, Y.L.; Tian, F.Y.; Sun, B. Plasma D-Dimer Level Is an Early Predictor of Severity of Acute Pancreatitis Based on 2012 Atlanta Classification. Med. Sci. Monit. 2019, 25, 9019–9027. [Google Scholar] [CrossRef] [PubMed]
  31. Rau, B.M.; Kemppainen, E.A.; Gumbs, A.A.; Büchler, M.W.; Wegscheider, K.; Bassi, C.; Puolakkainen, P.A.; Beger, H.G. Early assessment of pancreatic infections and overall prognosis in severe acute pancreatitis by procalcitonin (PCT): A prospective international multicenter study. Ann. Surg. 2007, 245, 745–754. [Google Scholar] [CrossRef] [PubMed]
  32. Ye, X.H.; Chen, T.Z.; Huai, J.P.; Lu, G.R.; Zhuge, X.J.; Chen, R.P.; Chen, W.J.; Wang, C.; Huang, Z.M. Correlation of fibrinogen-like protein 2 with progression of acute pancreatitis in rats. World J. Gastroenterol. 2013, 19, 2492–2500. [Google Scholar] [CrossRef] [PubMed]
Figure 1. Comparison of Fibrinogen-like protein 1 (FGL-1) levels among different etiologies in AP. ns: presents no significant difference.
Medicina 58 01753 g001
Figure 2. (a) Comparison of plasma Fibrinogen-like protein 1 (FGL-1) levels between severe acute pancreatitis (SAP) and Non-SAP groups; (b) Receiver operating characteristic (ROC) curves of FGL-1, procalcitonin (PCT) and combination model in the prediction of SAP.
Medicina 58 01753 g002
Figure 3. (a) Comparison of plasma Fibrinogen-like protein 1 (FGL-1) levels among different groups in severe acute pancreatitis (SAP); (b) Receiver operating characteristic (ROC) curves for FGL-1, C-reactive protein (CRP) and combination model in the prediction of infected pancreatic necrosis (IPN).
Medicina 58 01753 g003
Table 1. Demographic data and clinical characteristics of SAP and No-SAP groups.
SAP (n = 12)No SAP (n = 51)p-Value
Age—years50.5 (39.8–62.0)49.0 (41.0–64.0)0.951
Gender—M/F8/431/200.706
Comorbidities—no. (%)
Heart disease1/12 (8.33%)9/51 (17.65%)0.427
Diabetes2/12 (16.67%)14/51 (27.45%)0.440
Hypertension4/12 (33.33%)13/51 (25.49%)0.582
hLOS—days26.0 (10.5–34.8)8.0 (6.0–12.0)<0.001
Etiology—no. (%)
Gallstones4/12 (33.33%)28/51 (54.90%)0.327
Alcohol2/12 (16.67%)4/51 (7.84%)0.349
Hypertriglyceridemia5/12 (41.67%)17/51 (33.33%)0.586
Other1/12 (8.33%)2/51 (3.92%)0.518
Smoking history—no. (%)4/12 (33.33%)12/39 (30.77%)0.483
Abbreviations: SAP, severe acute pancreatitis; hLOS, length of hospital stay.
Table 2. Demographic data and clinical characteristics of IPN and No-IPN groups.
IPN (n = 9)No IPN (n = 54)p-Value
Age—years44.0 (39.0–56.0)49.0 (41.0–64.0)0.298
Gender—M/F7/232/220.290
Comorbidities—no. (%)
Heart disease0/9 (0%)9/54 (16.67%)0.225
Diabetes3/9 (33.33%)13/54 (24.07%)0.555
Hypertension2/9 (22.22%)15/54 (27.78%)0.728
hLOS—days18.5 (33.0–50.0)8.0 (5.75–11.25)<0.001
Etiology—no. (%)
Gallstones3/9 (33.33%)29/54 (53.70%)0.258
Alcohol1/9 (11.11%)5/54 (9.26%)0.861
Hypertriglyceridemia4/9 (44.44%)18/54 (33.33%)0.517
Other1/9 (11.11%)2/54 (3.70%)0.334
Smoking history—no. (%)2/9 (22.22%)14/54 (25.93%)0.910
Abbreviations: IPN, infected pancreatic necrosis; hLOS, length of hospital stay.
Table 3. Univariate and multivariate analyses for identifying potential predictors of SAP.
SeverityUnivariate AnalysisMultivariate Analysis
Variable n = 63SAP (n = 12)No-SAP (n = 51)X2p-ValueOR95% CIp-Value
WBC (109/mL) 0.4590.549---
≤1027423
>1036828
HCT (%) 0.1650.685---
≤4545837
>4518414
Blood glucose (mmol/L) 0.9320.334---
≤719514
>744737
Ca2+ (mmol/L) 1.2810.285---
<2.25421032
≥2.2521219
FIB (g/L) 0.4660.496---
≤4.6637631
>4.6626620
APTT (s) 0.0460.830---
≤27.228523
>27.235728
PCT (ng/mL) 9.9080.0020.0470.002~0.9910.049
≤0.531130
>0.5321121
CRP (mg/dL) 4.6320.0312.2410.165~30.3840.544
≤15028226
>150351025
FGL-1 (ng/mL) 32.029<0.0010.0130.001~0.1570.001
≤23.7849247
>23.7814104
Abbreviations: SAP, severe acute pancreatitis; WBC, white blood cell; HCT, hematocrit; FIB, fibrinogen; APTT, activated partial thromboplastin time; PCT, procalcitonin; CRP, C-reactive protein; FGL-1, Fibrinogen-like protein 1.
Table 4. Univariate and multivariate analyses for identifying potential predictors of IPN.
IPNUnivariate AnalysisMultivariate Analysis
Variable n = 63IPN
(n = 9)
No-IPN
(n = 54)
X2p-ValueOR95% CIp-Value
WBC (109/mL) 0.3890.533---
≤1027324
>1036630
HCT (%) 0.1170.733---
≤4545639
>4518315
Blood glucose (mmol/L) 0.0500.823---
≤719316
>744638
Ca2+ (mmol/L) 2.3330.127---
<2.2542834
≥2.2521120
FIB (g/L) 0.8840.347---
≤4.6637433
>4.6626521
APTT (s) 0.5250.469---
≤27.228325
>27.235629
PCT (ng/mL) 14.860<0.0010.4470.038~5.2640.522
≤3.557552
>3.5642
CRP (mg/dL) 13.585<0.0010.0600.006~0.6490.021
≤43050347
>4301367
FGL-1 (ng/mL) 20.935<0.0010.0340.003~0.3840.006
≤23.7850248
>23.781376
Abbreviations: IPN, infected pancreatic necrosis; WBC, white blood cell; HCT, hematocrit; FIB, fibrinogen; APTT, activated partial thromboplastin time; PCT, procalcitonin; CRP, C-reactive protein; FGL-1, Fibrinogen-like protein 1.
Table 5. Diagnostic value of FGL-1 and PCT and methodological comparison in SAP.
AUC (95% CI)Cut-OffSensitivitySpecificityPPVNPVLR+LR−
PCT (ng/mL)0.89 (0.77–1.00)1.2683.33%88.24%62.50%95.74%7.090.19
FGL-1 (ng/mL)0.88 (0.75–1.00)23.7883.33%94.12%76.92%96.00%19.230.24
FGL-1 + PCT0.96 (0.88–1.00)-91.67%98.04%91.67%98.04%46.770.08
Abbreviations: AUC, area under curve; CI, confidence interval; PPV, positive predictive value; NPV, negative predictive value; LR+, positive likelihood ratios; LR−, negative likelihood ratios; PCT, procalcitonin; FGL-1, Fibrinogen-like protein 1.
Table 6. Diagnostic value of FGL-1 and CRP and methodological comparison in IPN.
AUC (95% CI)Cut-OffSensitivitySpecificityPPVNPVLR+LR−
CRP (mg/dL)0.94 (0.87–1.00)397100%79.63%45.00%100%4.910
FGL-1 (ng/mL)0.84 (0.70–0.99)23.7977.78%87.04%50.00%95.92%6.000.26
FGL-1 + CRP0.94 (0.87–1.00)-100%79.63%91.67%98.04%4.910
Abbreviations: AUC, area under curve; CI, confidence interval; PPV, positive predictive value; NPV, negative predictive value; LR+, positive likelihood ratios; LR−, negative likelihood ratios; CRP, C-reactive protein; FGL-1, Fibrinogen-like protein 1.
Publisher’s Note: MDPI stays neutral with regard to jurisdictional claims in published maps and institutional affiliations.

