
Risk Assessment and Determination of Factors That Cause the Development of Hyperinsulinemia in School-Age Adolescents

 ,
,  ,
, 
 ,
,
Abstract
:1. Introduction
- The risk assessment of each adolescent may suffer.
- Changes in the entire study group, i.e., population, can be monitored because each change is updated without re-analyzing all data.
- The risk can be monitored for a certain period.
- Risk assessment can be monitored according to set criteria, without additional analysis.
- Risk assessment is more efficient with minor model errors.
2. Related Work
3. Research Study
3.1. Sample Structure
3.2. Subject and Goal of the Research
3.3. Applied Methodology
3.3.1. Statistical and Factor Analysis
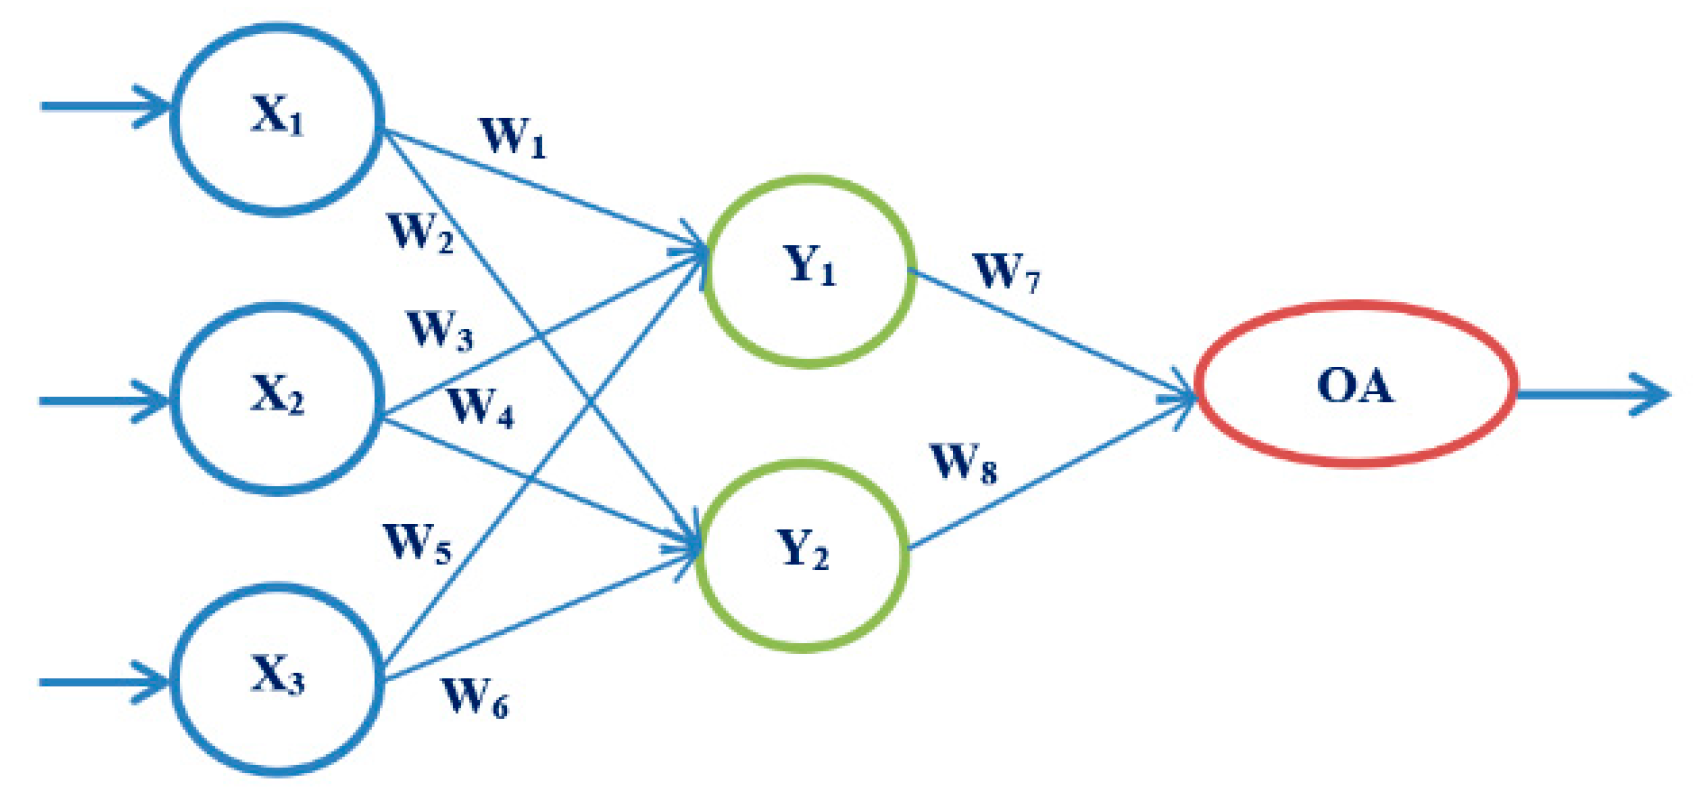
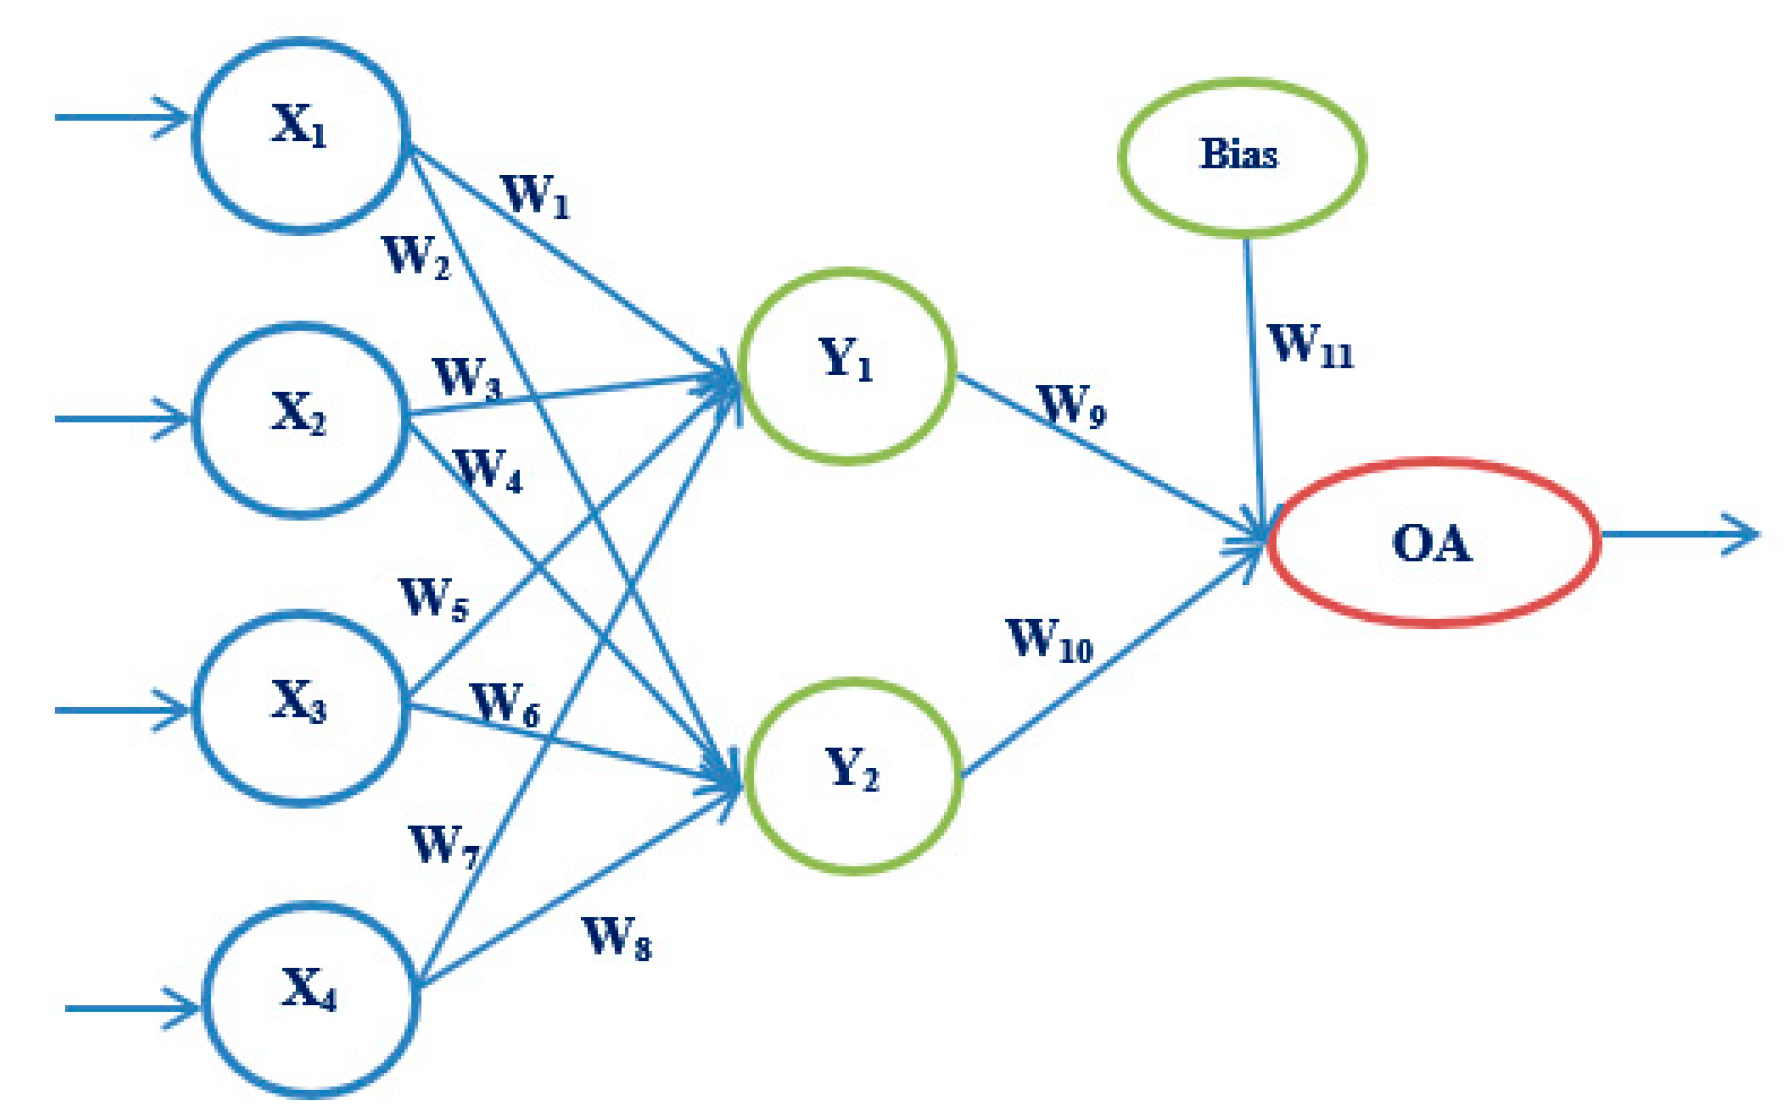
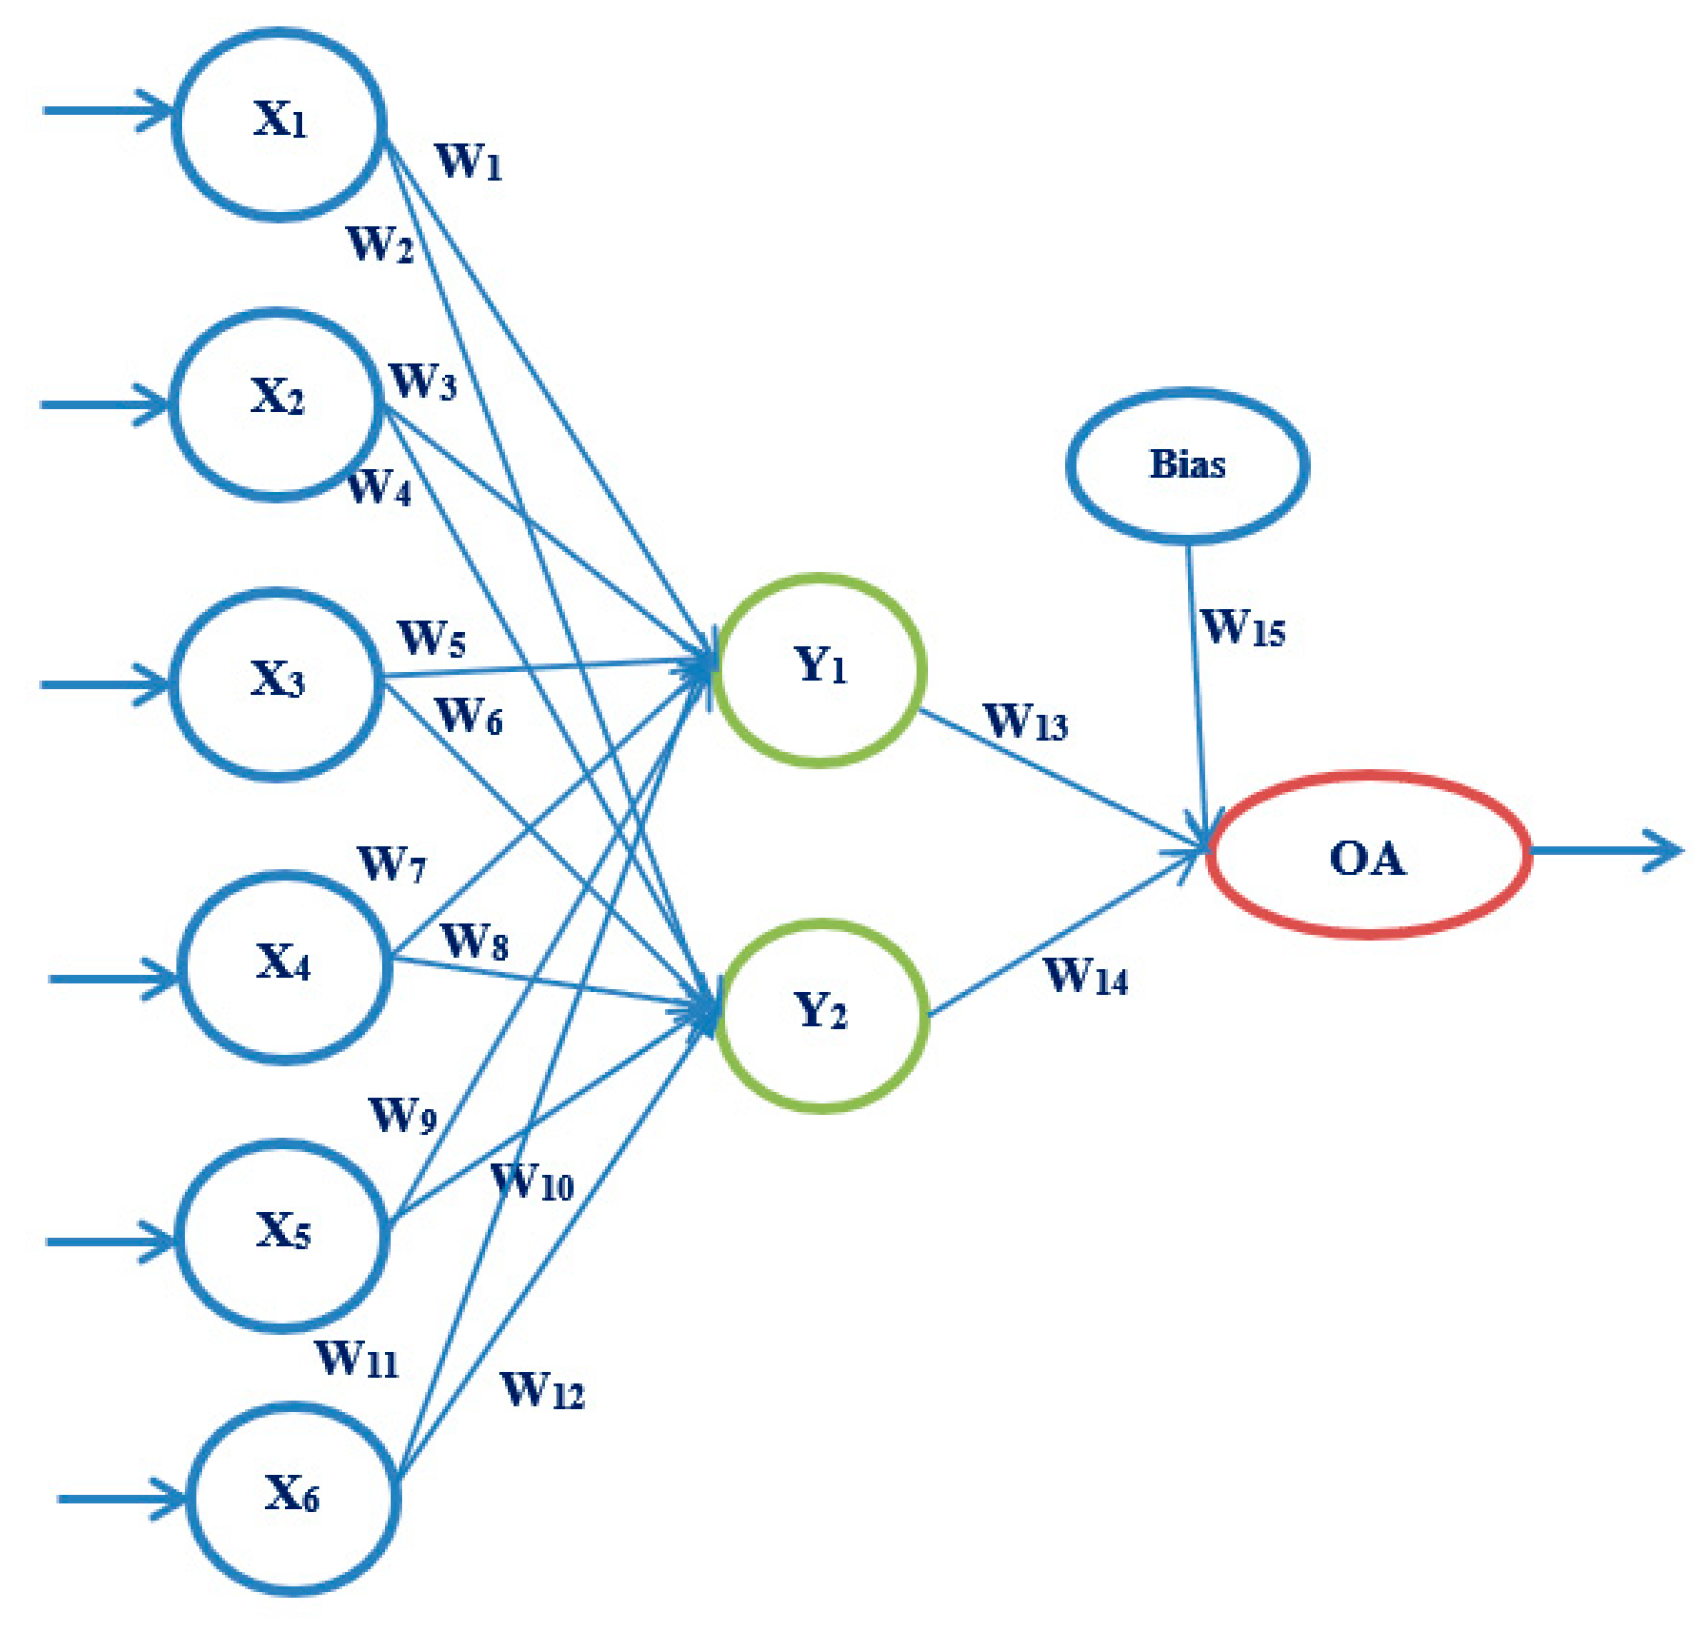
3.3.2. Artificial Neural Networks
4. Analysis of the Obtained Results
4.1. Results of Factor Analysis
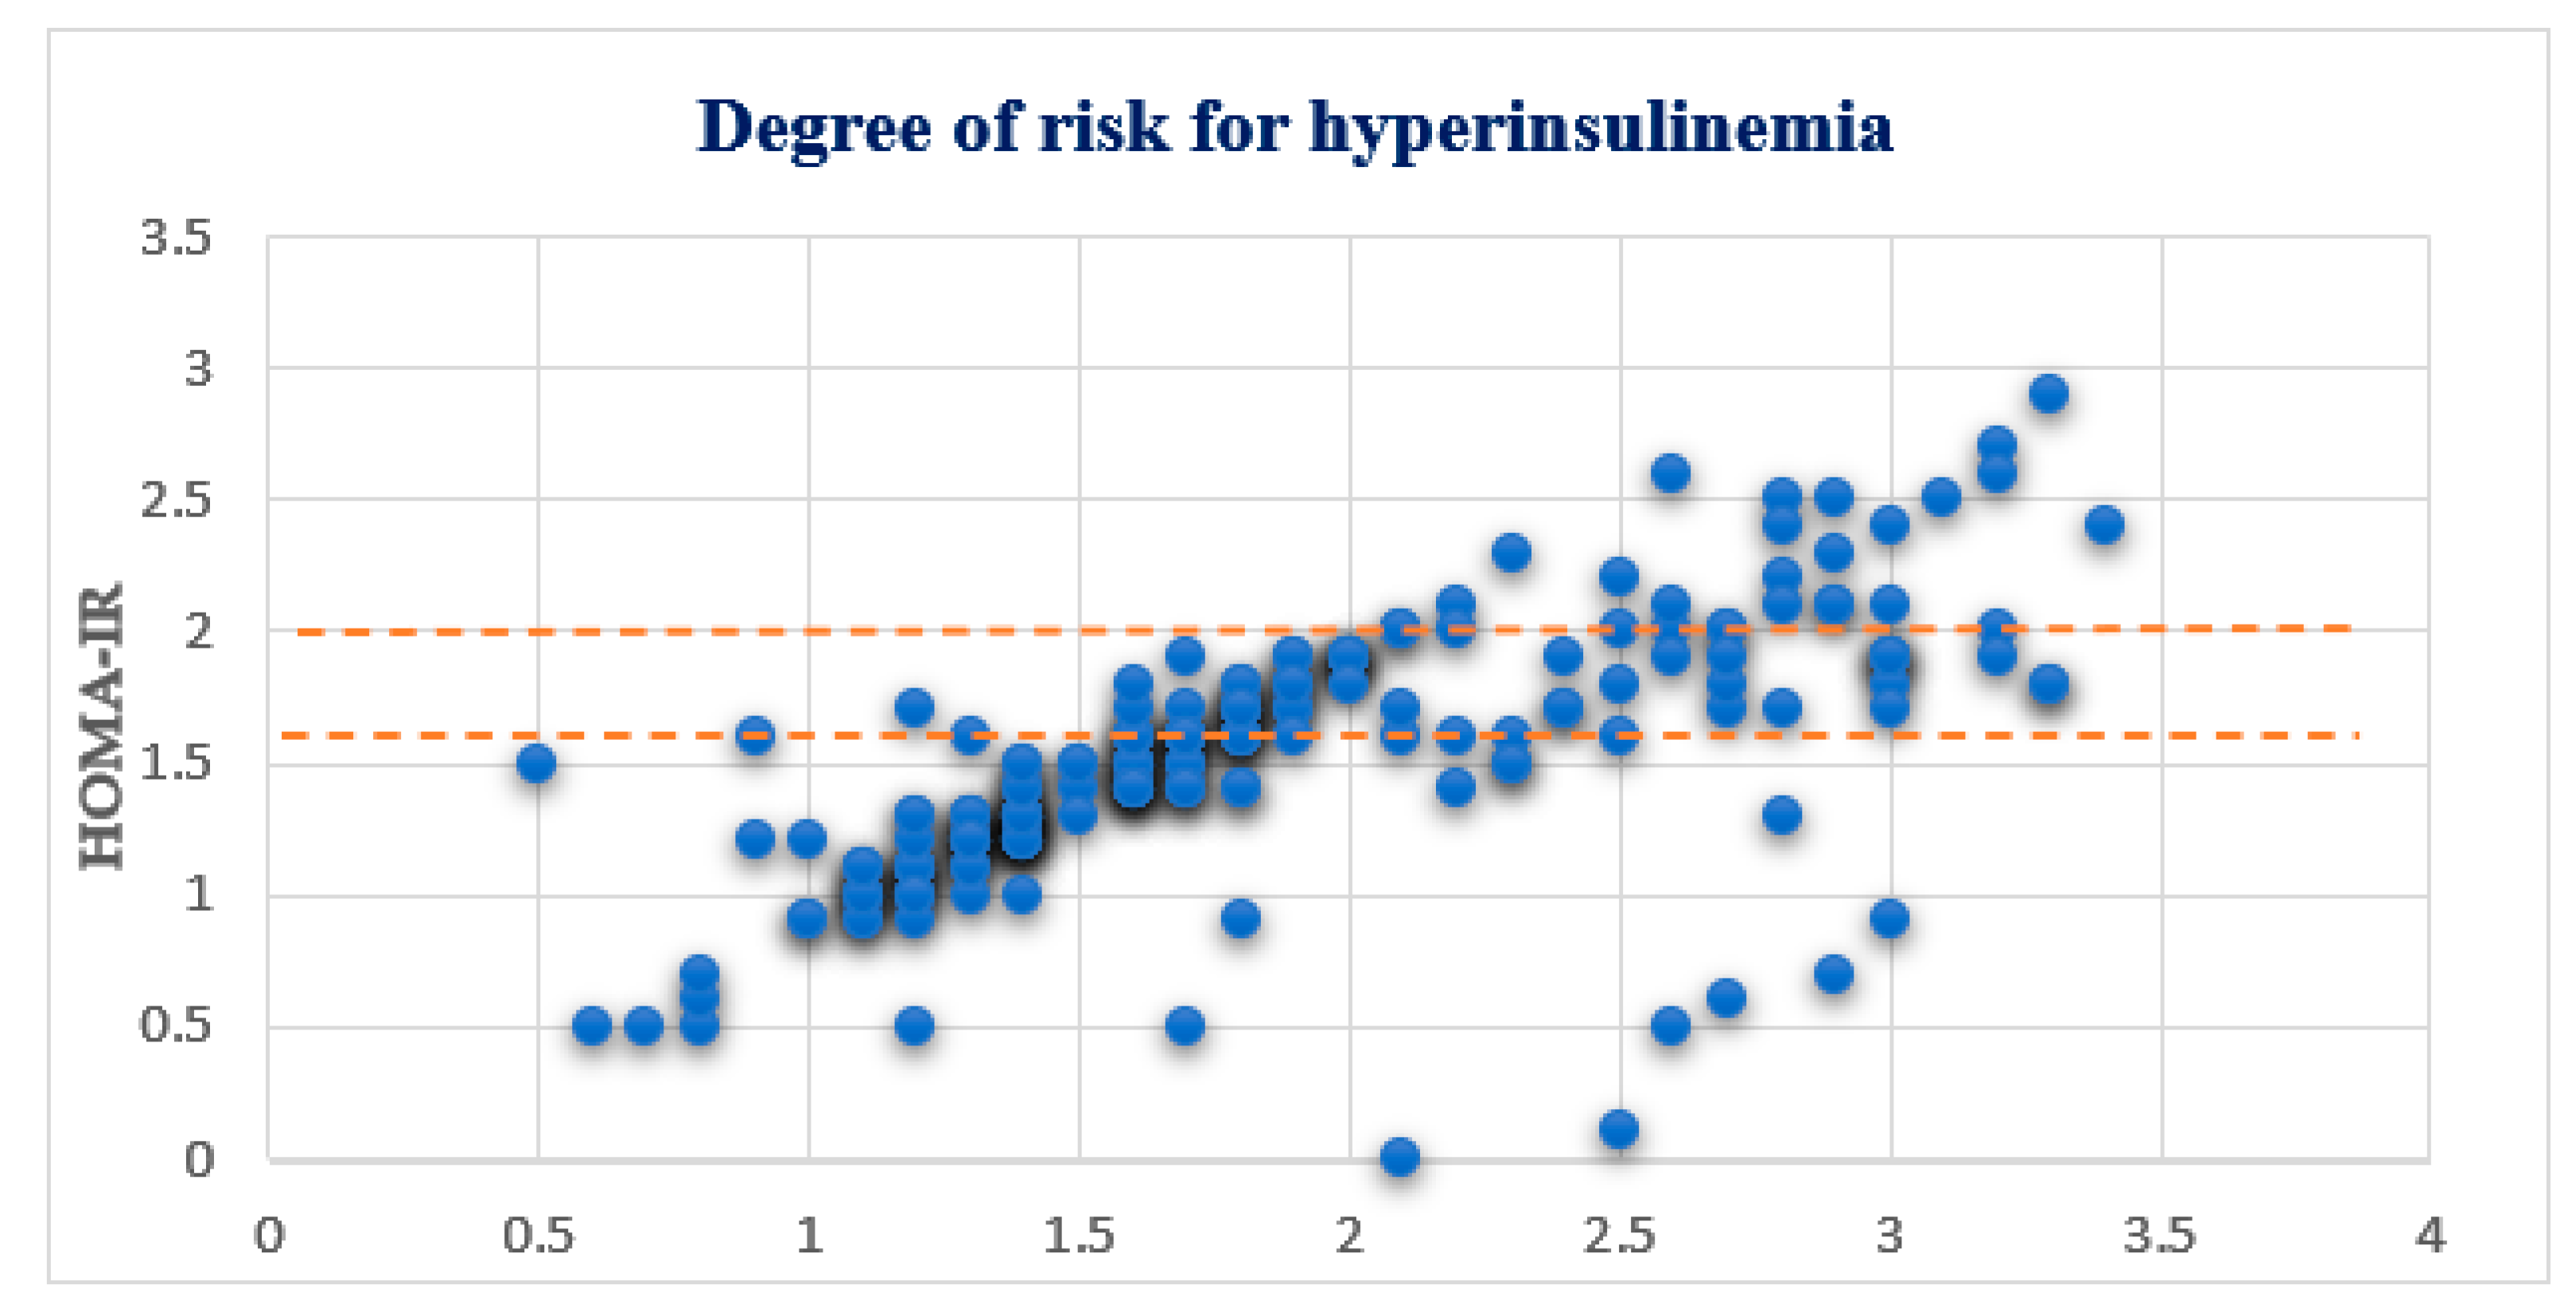
4.2. OGTT and HOMA-IR Test Results
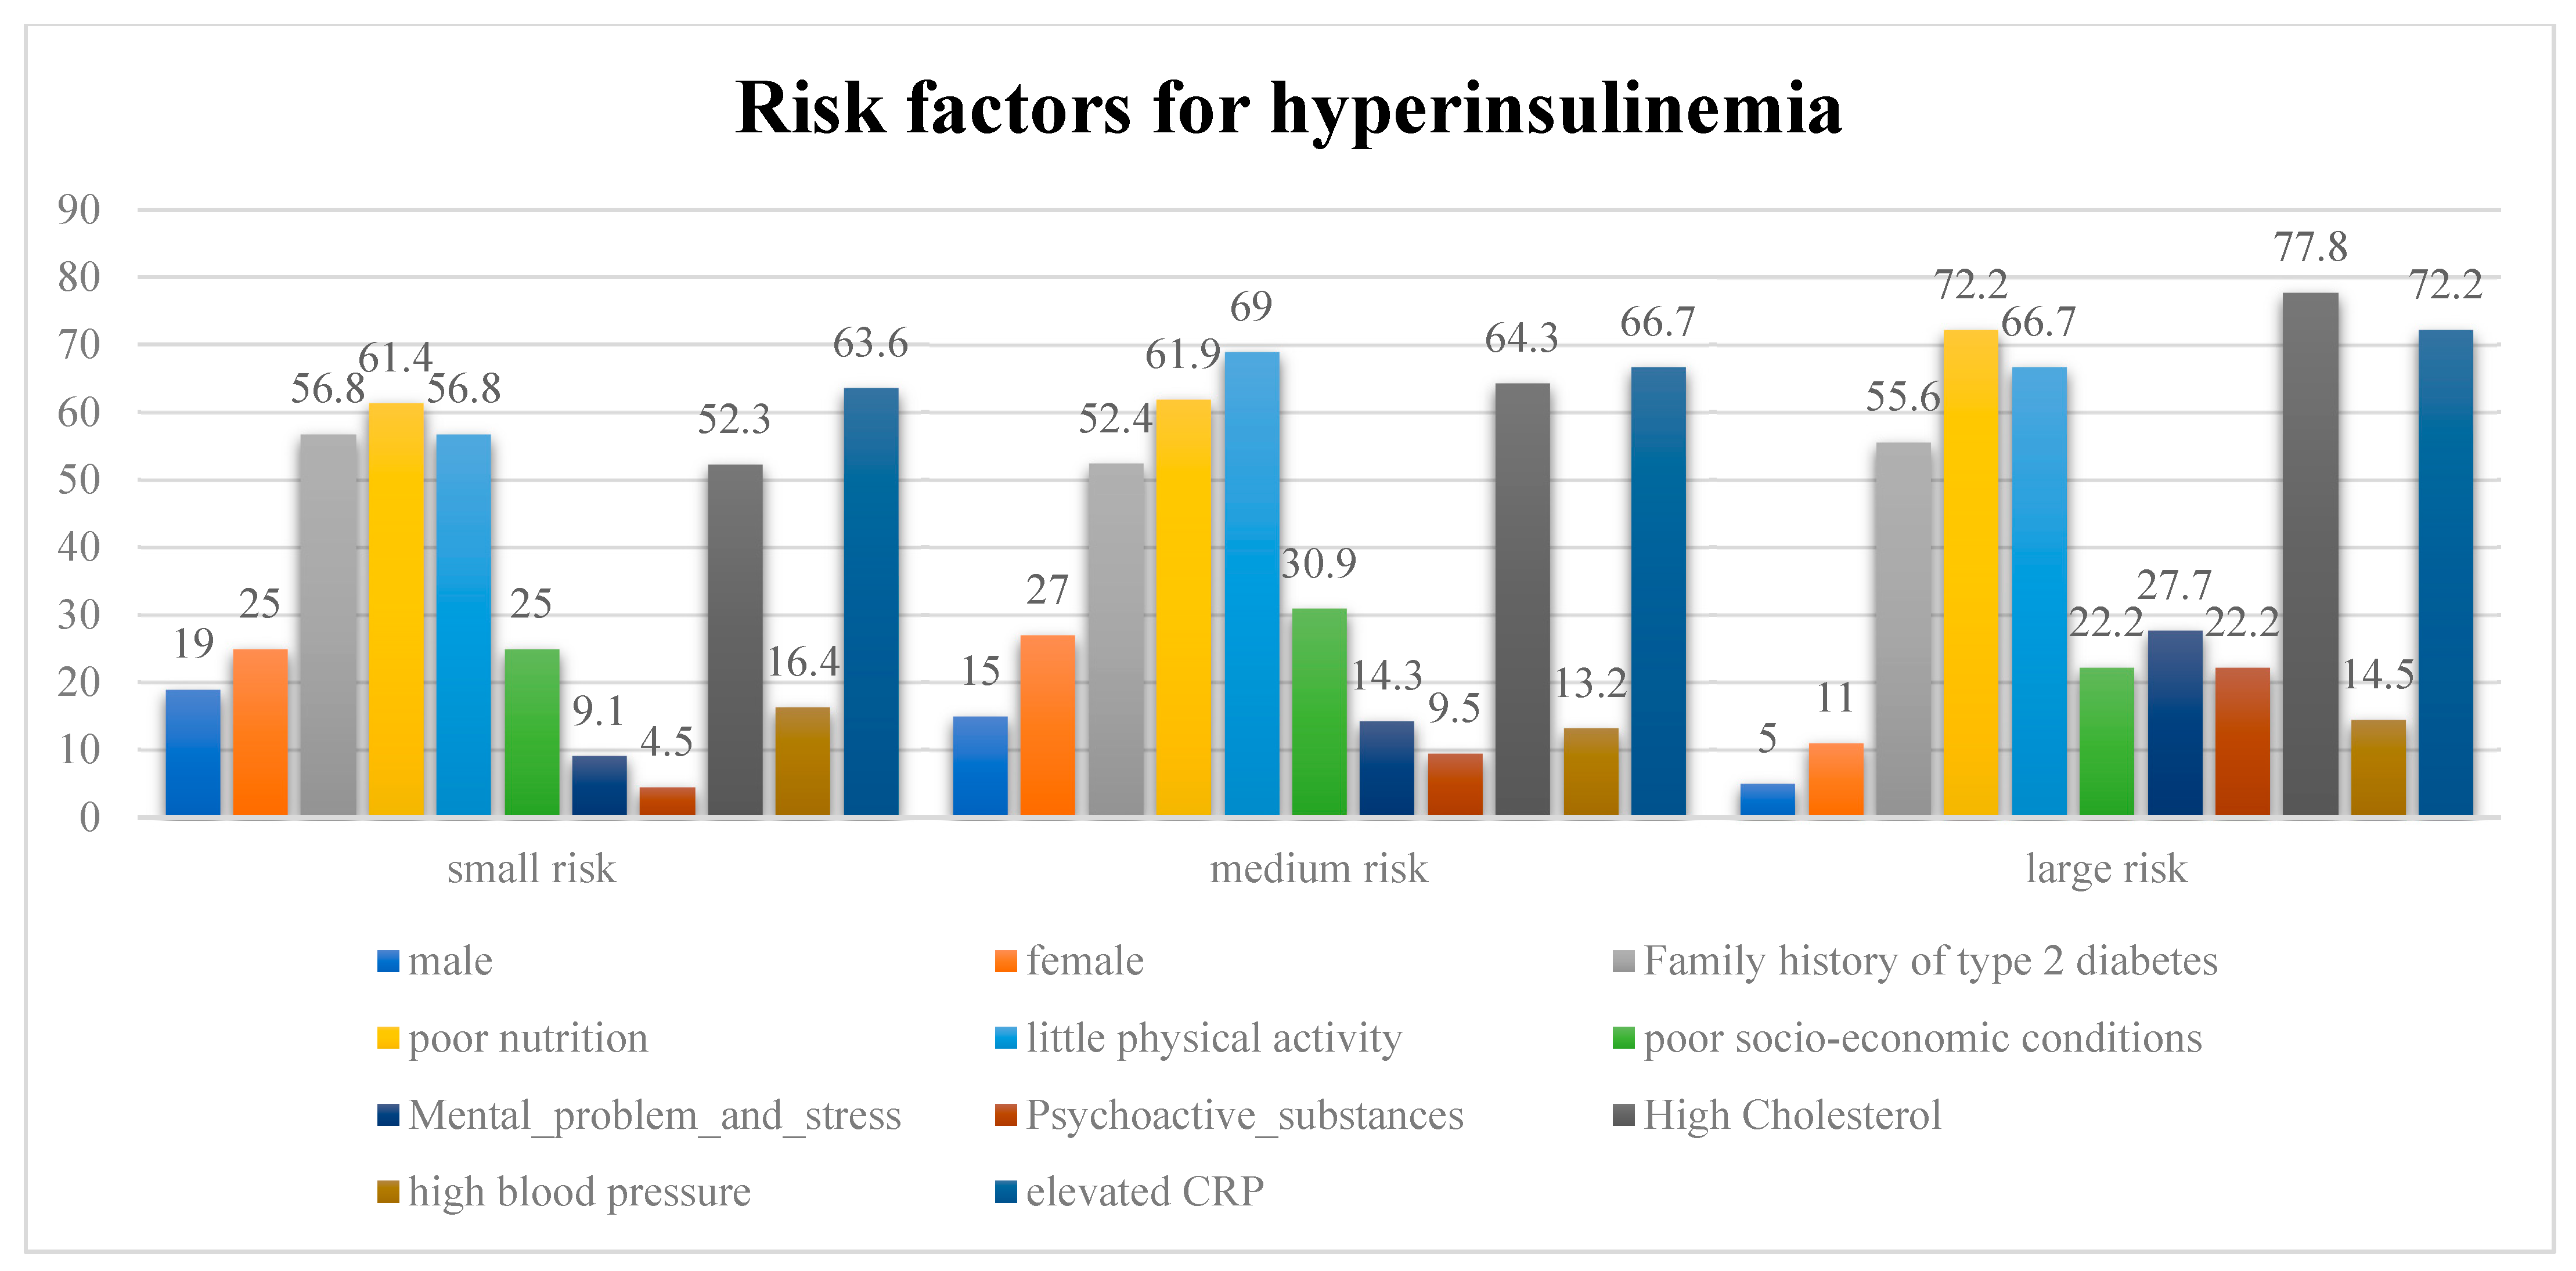
4.3. Risk Factors
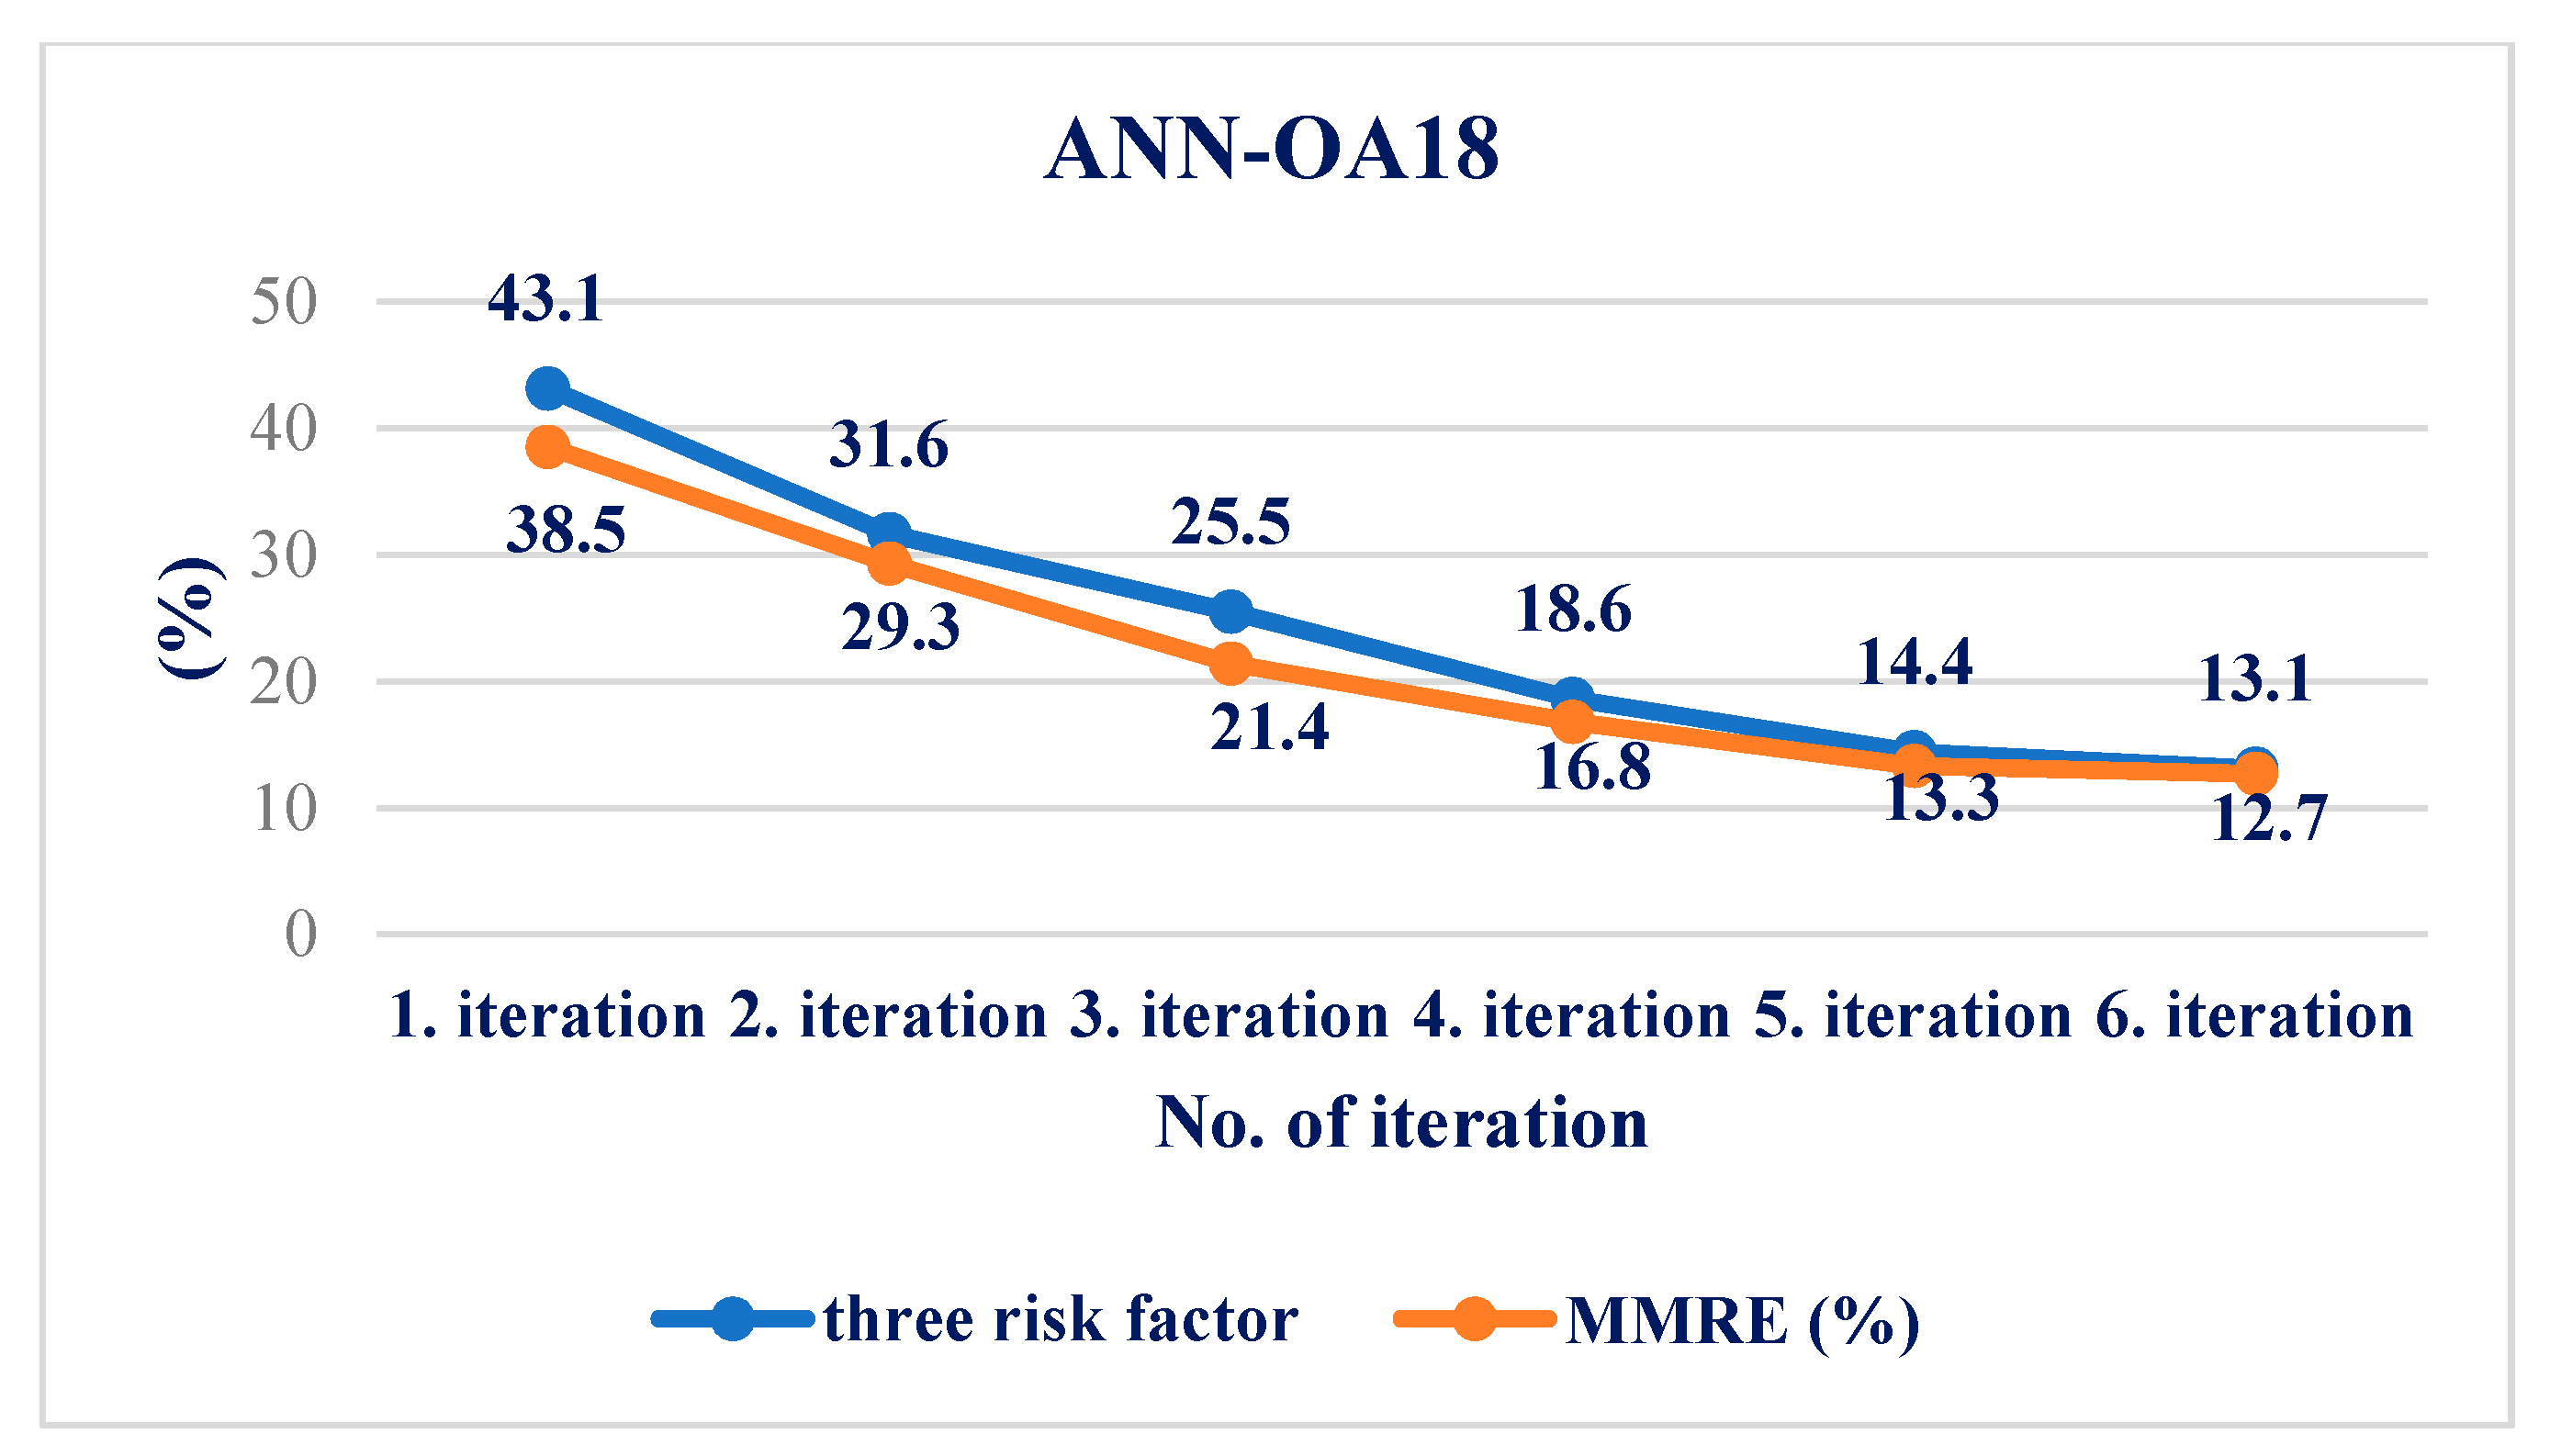
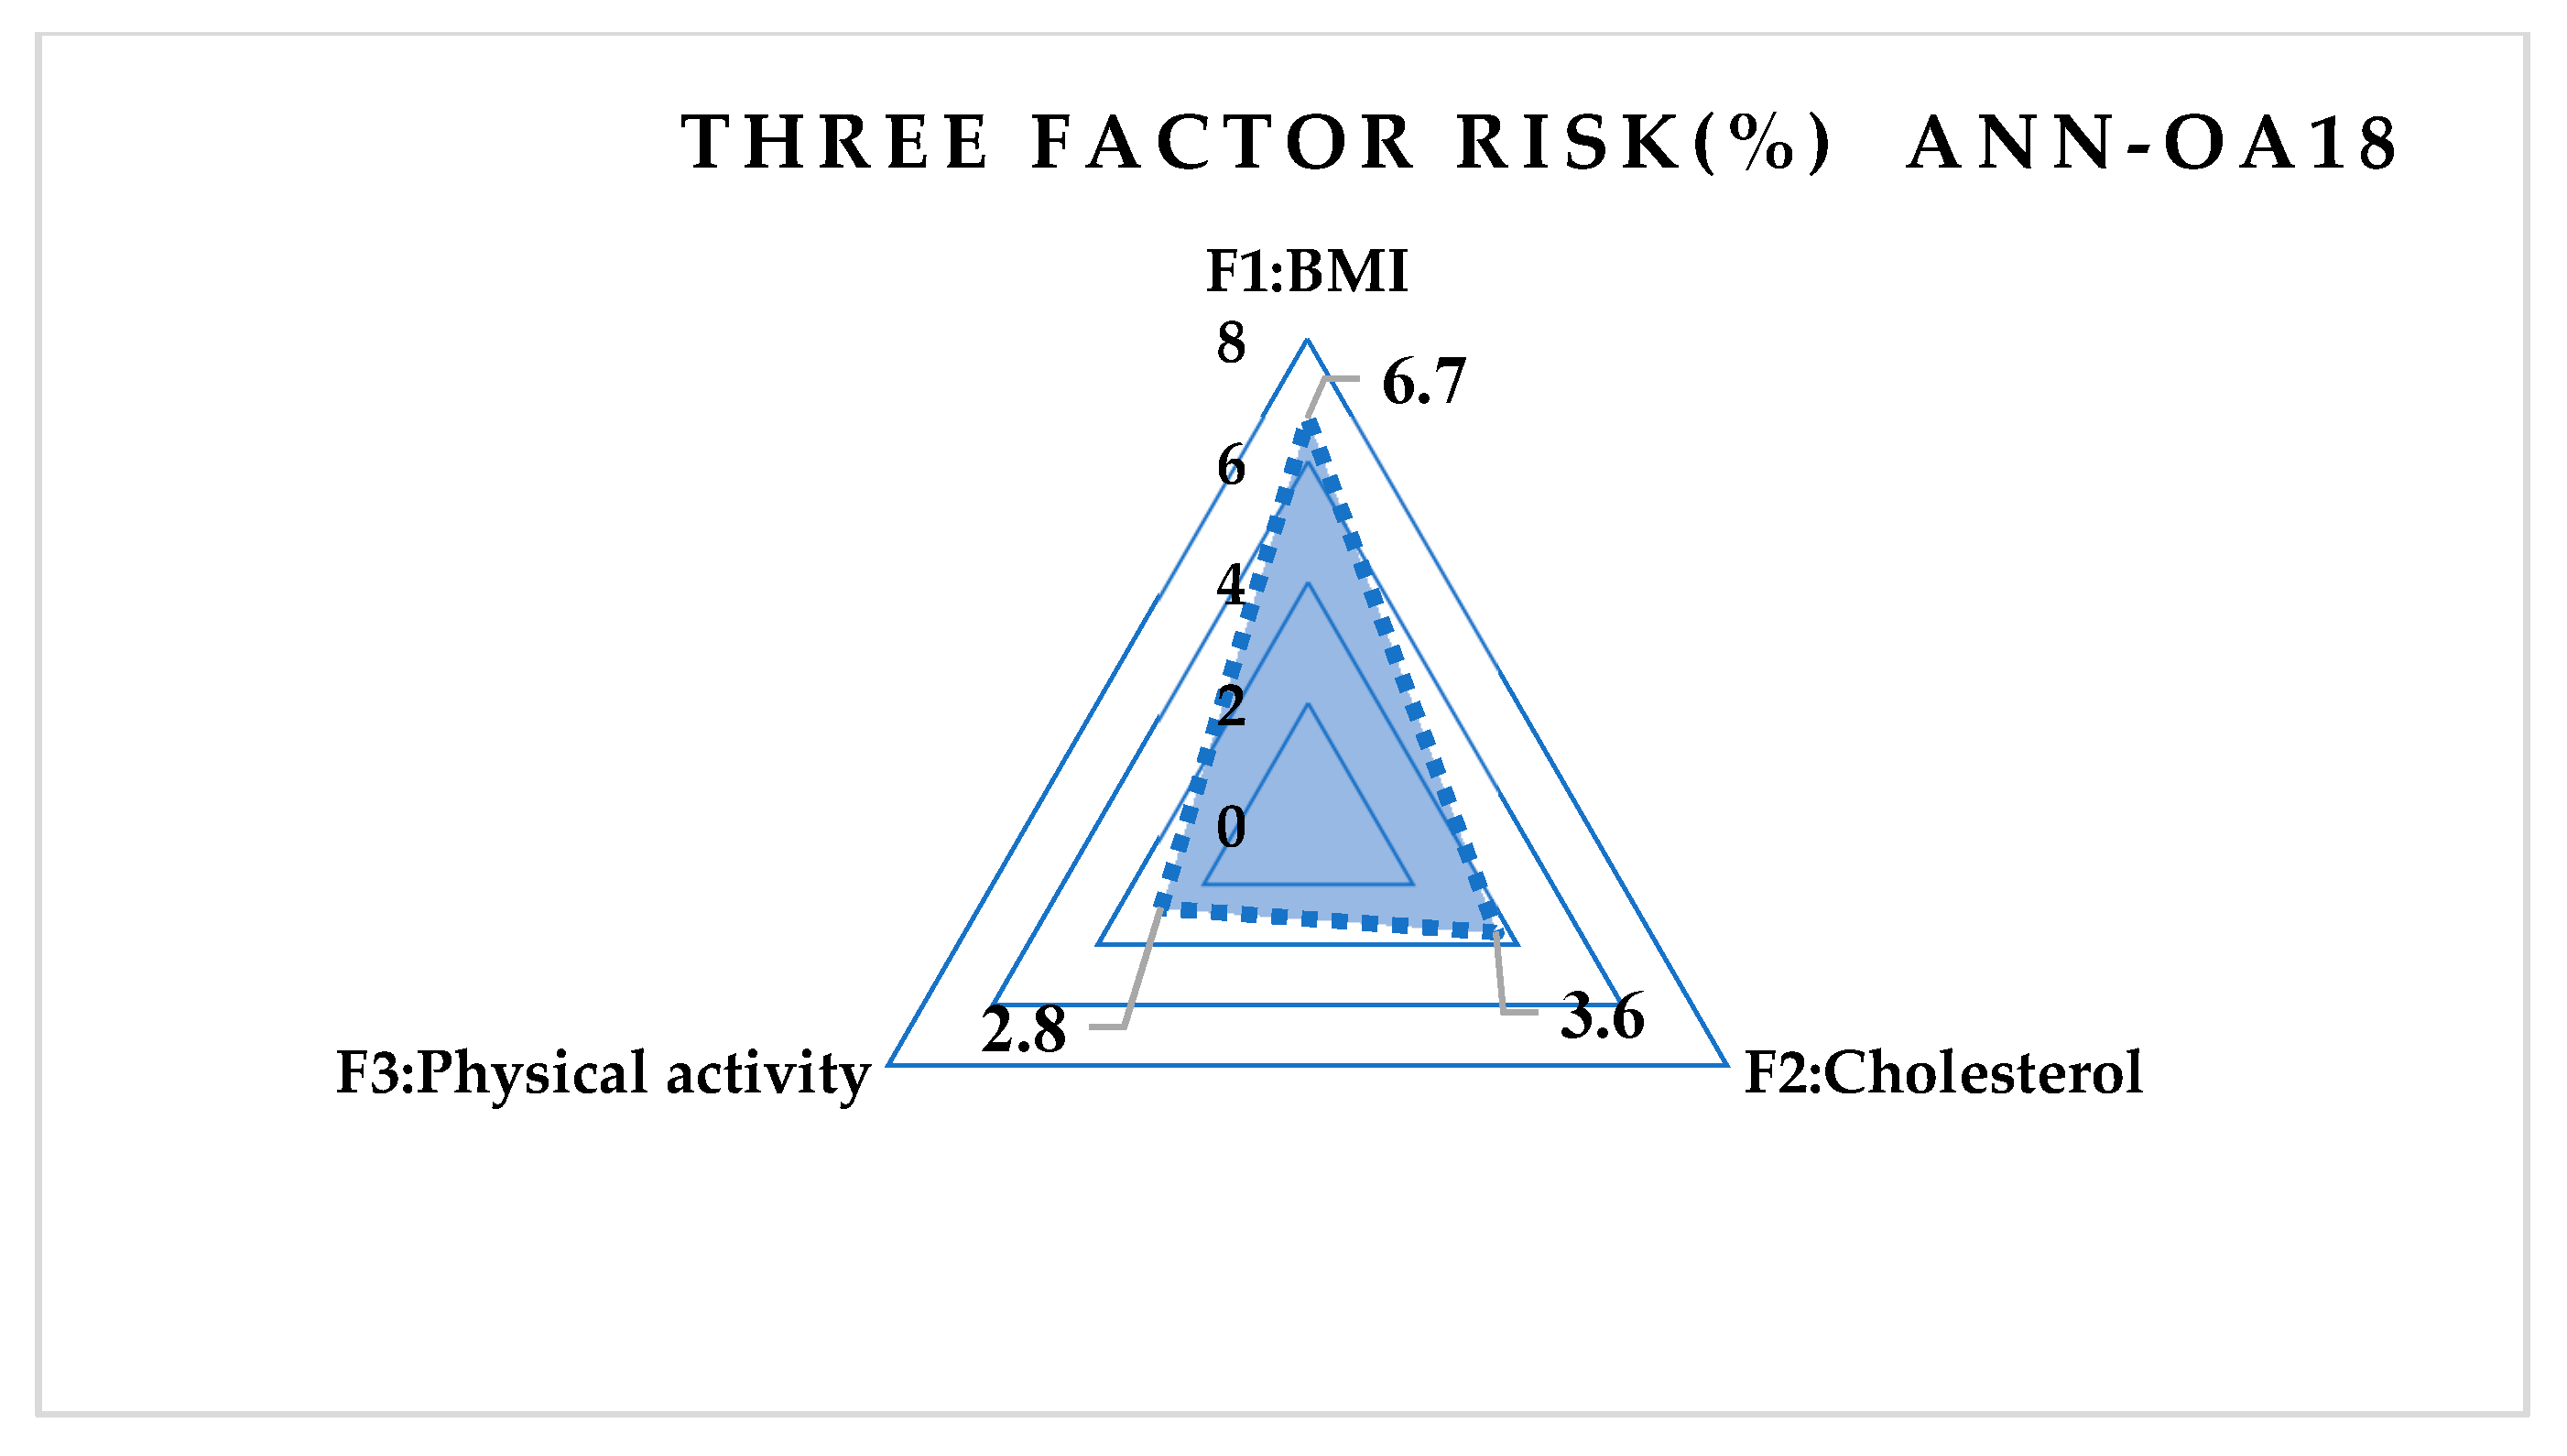
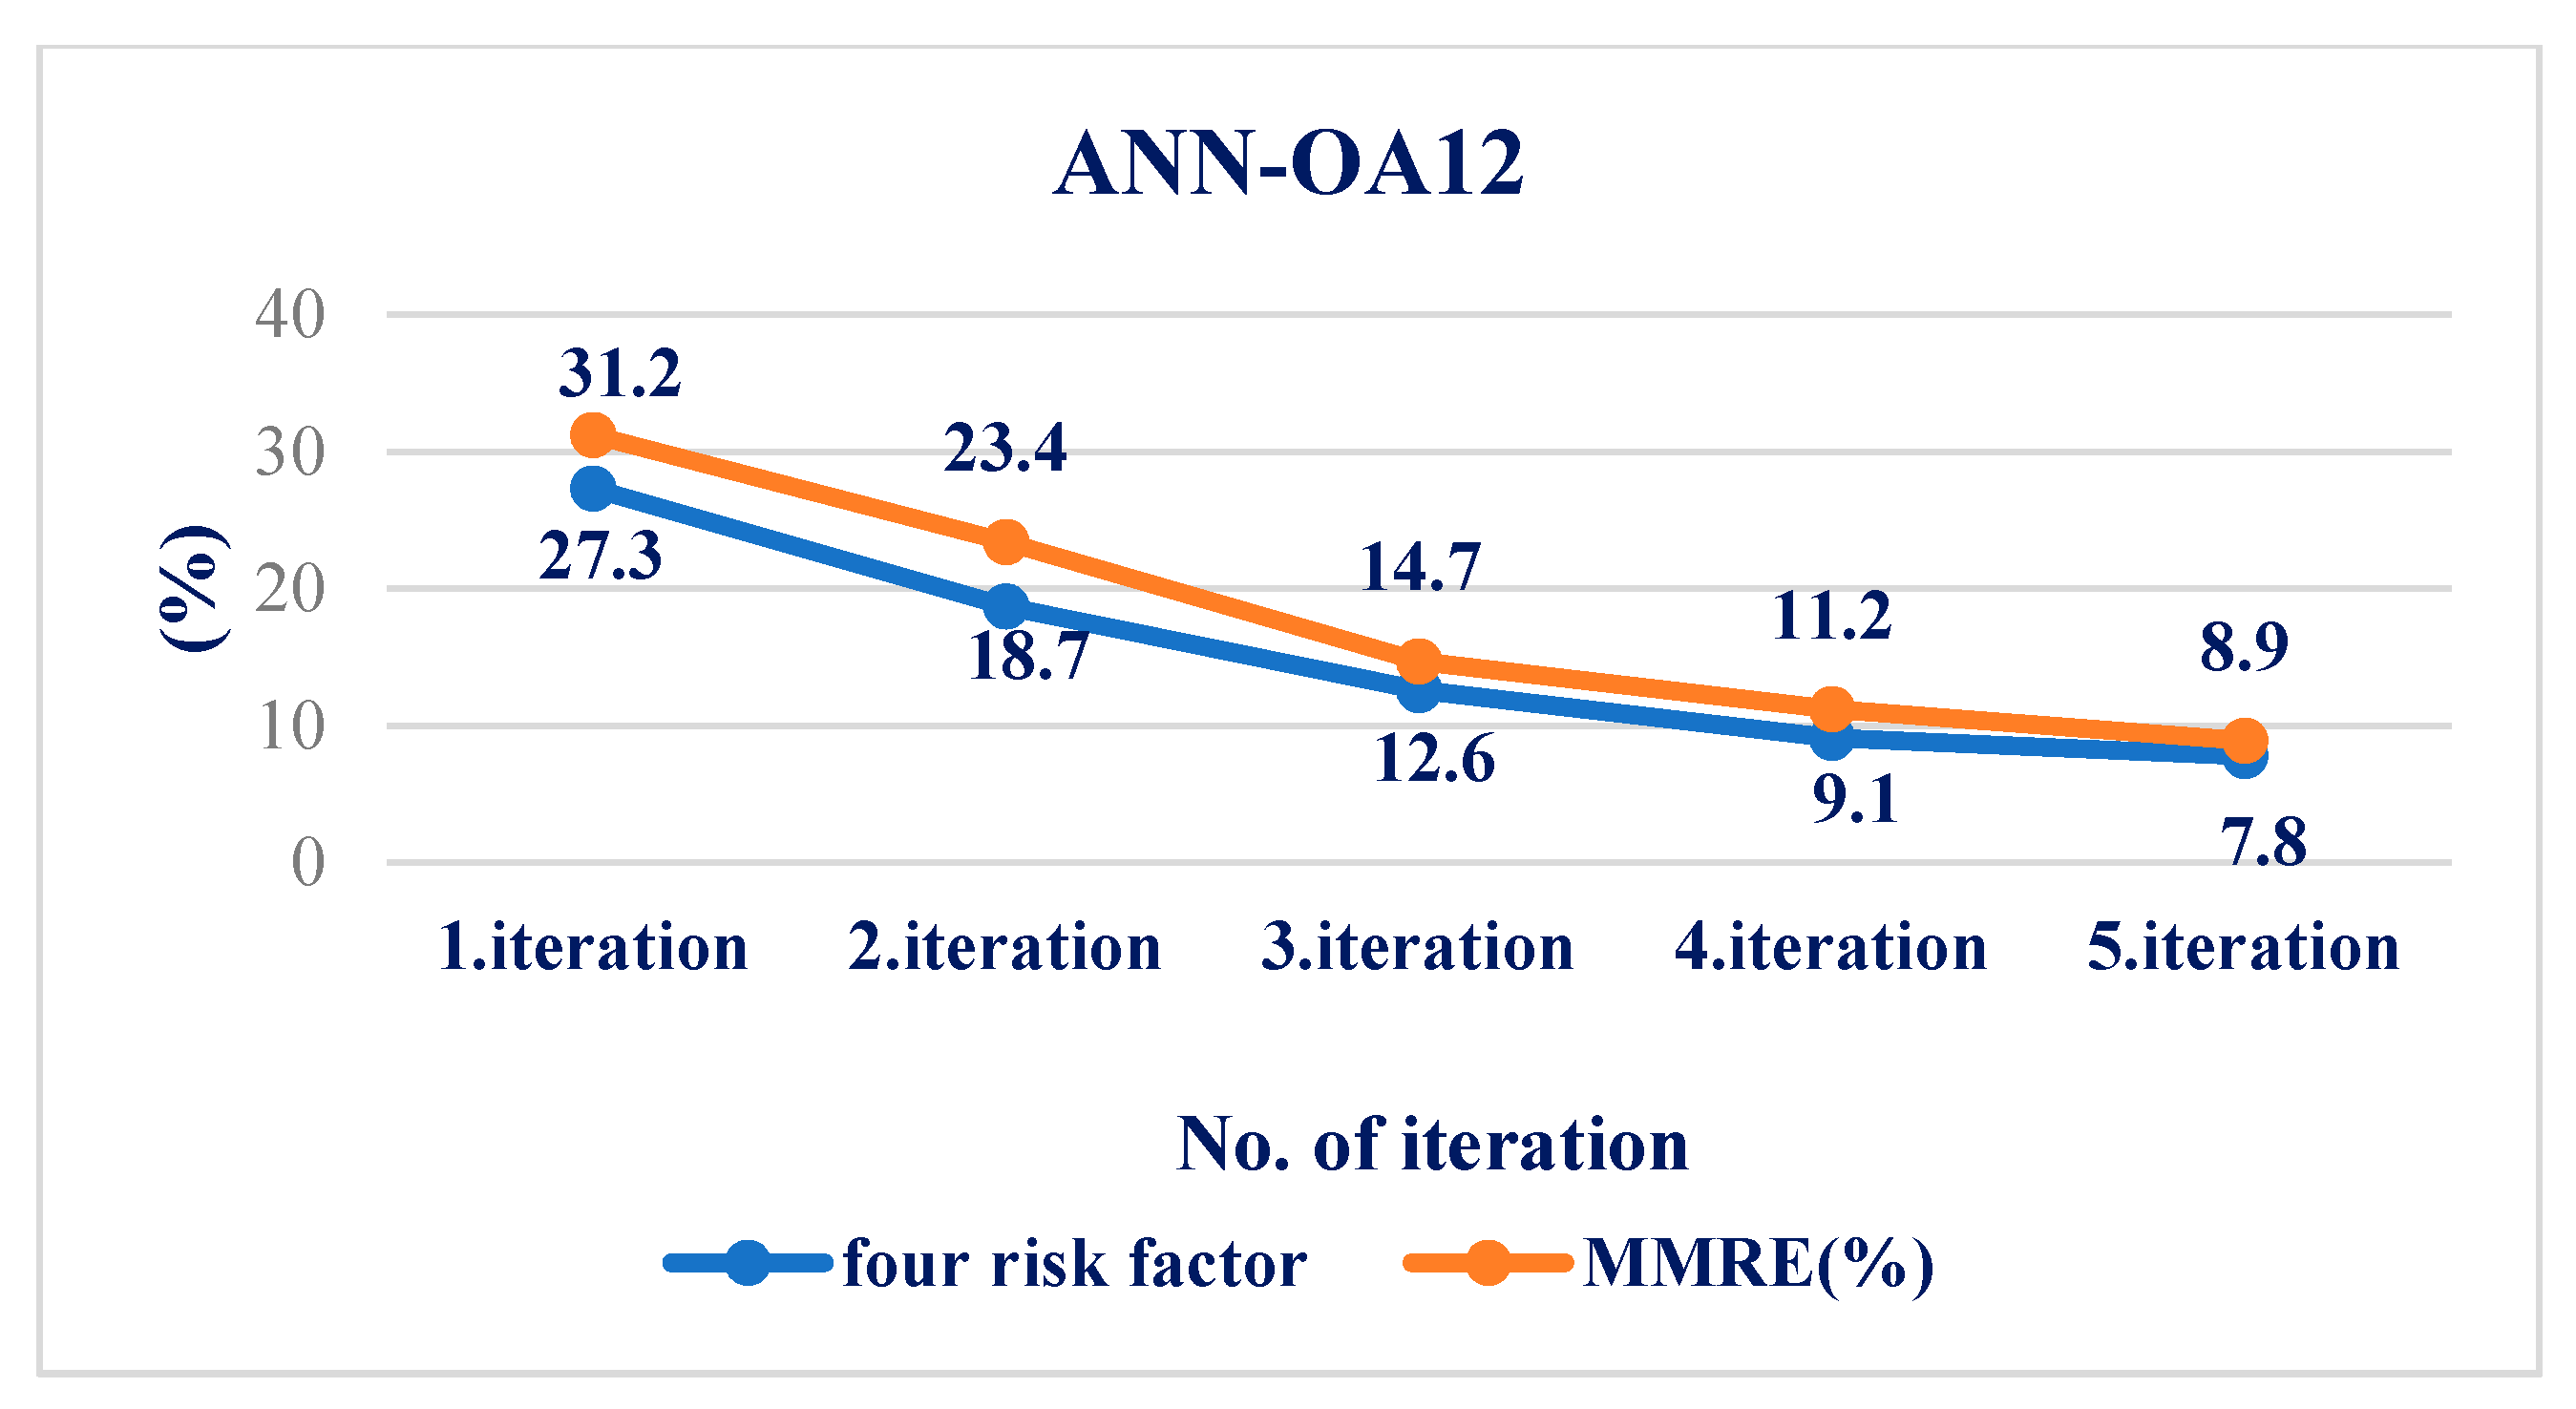
4.4. Results Obtained Using ANN
5. Discussion
6. Conclusions
Author Contributions
Funding
Institutional Review Board Statement
Informed Consent Statement
Data Availability Statement
Conflicts of Interest
Appendix A
- The influence of the first input parameter and his value is calculated as (A10)–(A13): (ANN-OA12)
- 2.
- The influence of the second input parameter and his value is calculated as:
- 3.
- The influence of the third input parameter and his value is calculated as:
- 4.
- The influence of the fourth input parameter and his value is calculated as:
References
- Zdravković, V.M. Relationship between Insulin Resistance and Secretion Disorders in Obese Adolescents with a High Risk for Type 2 Diabetes. Doctoral Dissertation, University in Belgrade, Belgrade, Serbia, 2015. [Google Scholar]
- American Diabetes Association. Approaches to glycemic treatment. Sec. 7. Diabetes Care 2015, 38 (Suppl. 1), S41–S48. [Google Scholar] [CrossRef] [Green Version]
- Lin, L.; Shen, F.; Yang, Q.; Yi, S.; Qin, Z.; Zhang, Q.; Luo, J.; Gao, X.; He, S. Analysis of genetic variants in four children with congenital hyperinsulinemia. Zhonghua Yi Xue Yi Chuan Xue Za Zhi = Zhonghua Yixue Yichuanxue Zazhi = Chin. J. Med. Genet. 2021, 38, 635–638. [Google Scholar]
- Thomas, D.D.; Corkey, B.E.; Istfan, N.W.; Apovian, C.M. Hyperinsulinemia: An early indicator of metabolic dysfunction. J. Endocr. Soc. 2019, 3, 1727–1747. [Google Scholar] [CrossRef]
- Močnik, M.; Marčun Varda, N. Cardiovascular Risk Factors in Children with Obesity, Preventive Diagnostics and Possible Interventions. Metabolites 2021, 11, 551. [Google Scholar] [CrossRef] [PubMed]
- Amiel, S.A.; Caprio, S.; Sherwin, R.S.; Plewe, G.; Haymond, M.W.; Tamborlane, W.V. Insulin resistance of puberty: A defect restricted to peripheral glucose metabolism. J. Clin. Endocrinol. Metab. 1991, 72, 277–282. [Google Scholar] [CrossRef] [PubMed]
- Rodríguez-Moran, M.; Gamboa-Gómez, C.I.; Preza-Rodríguez, L.; Guerrero-Romero, F. Lipoprotein (a) and Hyperinsulinemia in Healthy Normal-weight, Prepubertal Mexican Children. Endocr. Res. 2021, 46, 87–91. [Google Scholar] [CrossRef]
- Hui, P.P.; Zhang, W.; Zeng, Q.; Zhang, L.; Liu, M.; Yan, J.; Wu, Y.J.; Sang, Y.M. Analysis of clinical and genetic characteristics of Chinese children with congenital hyperinsulinemia that is spontaneously relieved. Endocrine 2021, 72, 116–123. [Google Scholar]
- Lukić, I.; Ranković, N.; Ranković, D. Risk assessment for diabetes type 2 conditions for nature in nutrition in adolescents. Med. Glas. Spec. Boln. Za Boles. Štitaste Žlezde I Boles. Metab. 2021, 26, 72–107. [Google Scholar] [CrossRef]
- Proctor, M.H.; Moore, L.L.; Gao, D.; Cupples, L.A.; Bradlee, M.L.; Hood, M.Y.; Ellison, R.C. Television viewing and change in body fat from preschool to early adolescence: The Framingham Children’s Study. Int. J. Obes. 2003, 27, 827–833. [Google Scholar] [CrossRef] [Green Version]
- Ten, S.; Maclaren, N. Insulin resistance syndrome in children. J. Clin. Endocrinol. Metab. 2004, 89, 2526–2539. [Google Scholar] [CrossRef]
- Giannini, C.; Weiss, R.; Cali, A.; Bonadonna, R.; Santoro, N.; Pierpont, B.; Shaw, M.; Caprio, S. Evidence for early defects in insulin sensitivity and secretion before the onset of glucose dysregulation in obese youths: A longitudinal study. Diabetes 2012, 61, 606–614. [Google Scholar] [CrossRef] [Green Version]
- Meigs, J.B.; Nathan, D.M.; Wilson, P.W.; Cupples, L.A.; Singer, D.E. Metabolic risk factors worsen continuously across the spectrum of nondiabetic glucose tolerance. The Framingham Offspring Study. Ann. Intern. Med. 1998, 128, 524–533. [Google Scholar] [CrossRef]
- The HEALTHY Study Group. A School-Based Intervention for Diabetes Risk Reduction. N. Engl. J. Med. 2010, 363, 443–453. [Google Scholar] [CrossRef] [Green Version]
- Gungor, N.; Bacha, F.; Saad, R.; Janosky, J.; Arslanian, S. Youth type 2 diabetes: Insulin resistance, beta-cell failure, or both? Diabetes Care 2005, 28, 638–644. [Google Scholar] [CrossRef] [Green Version]
- Egshatyan, L.; Kashtanova, D.; Popenko, A.; Tkacheva, O.; Tyakht, A.; Alexeev, D.; Karamnova, N.; Kostryukova, E.; Babenko, V.; Vakhitova, M.; et al. Gut microbiota and diet in patients with different glucose tolerance. Endocr. Connect. 2016, 5, 1–9. [Google Scholar] [CrossRef] [PubMed]
- Gobato, A.O.; Vasques AC, J.; Zambon, M.P.; Barros AD, A.; Hessel, G. Metabolic syndrome and insulin resistance in obese adolescents. Rev. Paul. Pediatr. 2014, 32, 55–59. [Google Scholar] [CrossRef] [PubMed]
- Koren, D.; Gozal, D.; Philby, M.F.; Bhattacharjee, R.; Kheirandish-Gozal, L. Impact of obstructive sleep apnoea on insulin resistance in nonobese and obese children. Eur. Respir. J. 2016, 47, 1152–1161. [Google Scholar] [CrossRef] [Green Version]
- Sharma, S.; Lustig, R.H.; Fleming, S.E. Peer Reviewed: Identifying Metabolic Syndrome in African American Children Using Fasting HOMA-IR in Place of Glucose. Prev. Chronic Dis. 2011, 8, A64. [Google Scholar] [PubMed]
- Kurtiş, B.; Develioğlu, H.; Taner, I.L.; Baloş, K.; Tekin, I.O. IL-6 levels in gingival crevicular fluid (GCF) from patients with non-insulin dependent diabetes mellitus (NIDDM), adult periodontitis and healthy respondents. J. Oral Sci. 1999, 41, 163–167. [Google Scholar] [CrossRef]
- Barlow, S.E.; Dietz, W.H. Obesity evaluation and treatment: Expert Committee recommendations. The Maternal and Child Health Bureau, Health Resources and Services Administration and the Department of Health and Human Services. Pediatrics 1998, 102, e29. [Google Scholar] [CrossRef] [PubMed] [Green Version]
- Bowden, S.A.; Duck, M.M.; Hoffman, R.P. Young children (<5 yr) and adolescents (>12 yr) with type 1 diabetes mellitus have low rate of partial remission: Diabetic ketoacidosis is an important risk factor. Pediatric Diabetes 2008, 9, 197–201. [Google Scholar] [CrossRef] [PubMed]
- Siu, A.L. Screening for abnormal blood glucose and type 2 diabetes mellitus: U.S. Preventive Services Task Force recommendation statement. Ann. Intern. Med. 2015, 163, 861–868. [Google Scholar] [CrossRef] [PubMed] [Green Version]
- Juárez-López, C.; Klünder-Klünder, M.; Medina-Bravo, P.; Madrigal-Azcárate, A.; Mass-Díaz, E.; Flores-Huerta, S. Insulin resistance and its association with the components of the metabolic syndrome among obese children and adolescents. BMC Public Health 2010, 10, 318. [Google Scholar] [CrossRef] [Green Version]
- Centers for Disease Control and Prevention/National Center for Health Statistics. CDC Growth Charts, United States; Department of Health and Human Services: Hyattsville, MD, USA, 2000. [Google Scholar]
- Lin, C.L.; Lin, J.L.; Ko, T.C. Optimisation of the EDM process based on the orthogonal array with fuzzy logic and grey relational analysis method. Int. J. Adv. Manuf. Technol. 2002, 19, 271–277. [Google Scholar] [CrossRef]
- Yildizel, S.A.; Çöğürcü, M.T.; Mehmet, U.Z.U.N.; Armağan, K. Optimal retirement age for construction workers exposed to vibration: A case study in Turkey. Avrupa Bilim Teknoloji Dergisi 2019, 17, 1294–1306. [Google Scholar]
- Tremblay, M.S.; Willms, J.D. Secular trends in the body mass index of Canadian children. CMAJ 2000, 163, 1429–1433. [Google Scholar]
- Ramavandi, B.; Asgari, G.; Faradmal, J.; Sahebi, S.; Roshani, B. Abatement of Cr (VI) from wastewater using a new adsorbent, cantaloupe peel: Taguchi L 16 orthogonal array optimization. Korean J. Chem. Eng. 2014, 31, 2207–2214. [Google Scholar] [CrossRef]
- Zivkovic, Z.; Nikolic, S.T.; Doroslovacki, R.; Lalic, B.; Stankovic, J.; Zivkovic, T. Fostering creativity by a specially designed Doris tool. Think. Ski. Creat. 2015, 17, 132–148. [Google Scholar] [CrossRef]
- Akanji, A. Clinical experience with adolescent diabetes in a Nigerian teaching hospital. J. Natl. Med. Assoc. 1996, 88, 101. [Google Scholar]
- Rankin, D.; Harden, J.; Barnard, K.; Bath, L.; Noyes, K.; Stephen, J.; Lawton, J. Barriers and fascilitators to taking on diabetes self-management tasks in pre-adolescent children with type 1 diabetes: A qualitative study. BMC Endocr. Disord. 2018, 18, 1–9. [Google Scholar] [CrossRef] [Green Version]
- Sigwalt, F.R.; Silva, R.C.R.D. Resistência à insulina em adolescentes com e sem excesso de peso de município da Grande Florianópolis-SC. Rev. Bras. Enferm. 2014, 67, 43–47. [Google Scholar] [PubMed] [Green Version]
- Rankovic, D.; Rankovic, N.; Ivanovic, M.; Lazic, L. Convergence rate of Artificial Neural Networks for estimation in software development projects. In Information and Software Technology Journal; Elsevier: Amsterdam, The Netherlands, 2021. [Google Scholar] [CrossRef]
- Rankovic, N.; Rankovic, D.; Ivanovic, M.; Lazic, L. A New Approach to Software Effort Estimation Using Different Artificial Neural Network Architectures and Taguchi Orthogonal Arrays. IEEE Access 2021, 9, 26926–26936. [Google Scholar] [CrossRef]
- Rankovic, N.; Rankovic, D.; Ivanovic, M.; Lazic, L. Improved Effort and Cost Estimation Model Using Artificial Neural Networks and Taguchi Method with Different Activation Functions. Entropy 2021, 23, 854. [Google Scholar] [CrossRef] [PubMed]
- Rankovic, N.; Rankovic, D.; Ivanovic, M.; Lazic, L. A Novel UCP Model Based on Artificial Neural Networks and Orthogonal Arrays. Appl. Sci. 2021, 11, 8799. [Google Scholar] [CrossRef]

| Correlation | ANN-OA18 | ANN-OA12 | ANN-OA16 |
|---|---|---|---|
| Pearson | 0.743 | 0.853 | 0.872 |
| Spearman | 0.726 | 0.845 | 0.925 |
| R2 Linear | 0.815 | 0.827 | 0.934 |
| R2 Quadratic | 0.826 | 0.868 | 0.958 |
| R2 Cubic | 0.967 | 0.893 | 0.875 |
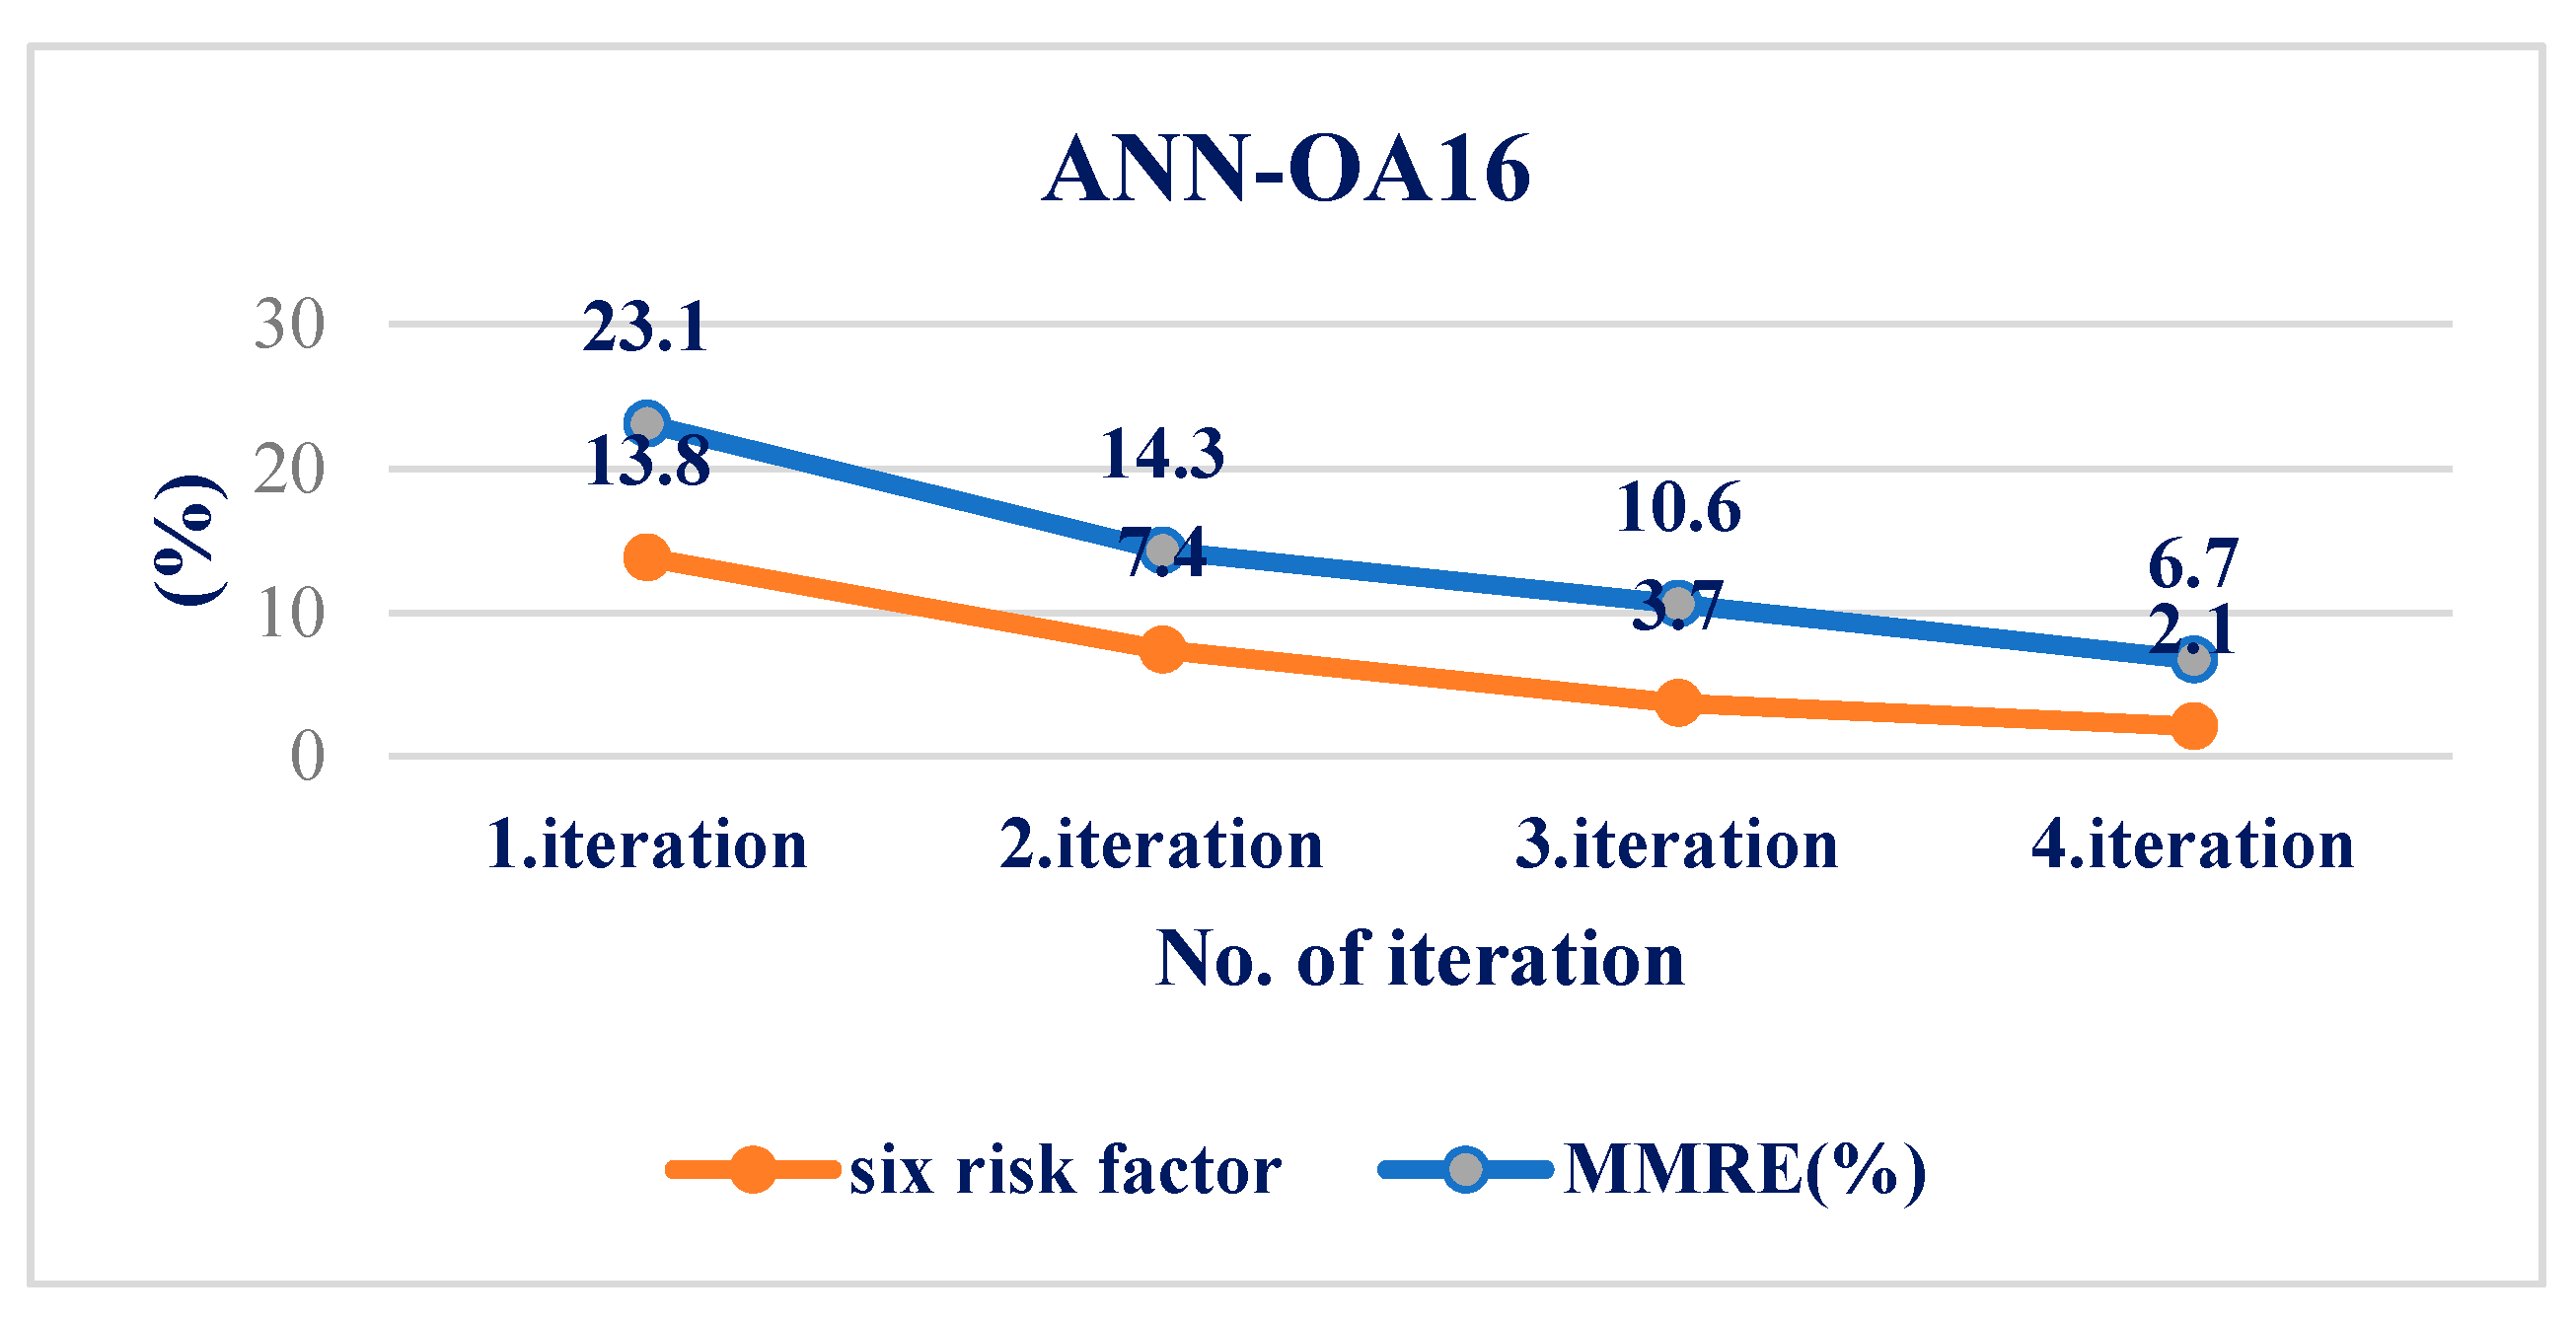
| MMRE (%) | 12.7 | 8.9 | 2.1 |
Publisher’s Note: MDPI stays neutral with regard to jurisdictional claims in published maps and institutional affiliations. |
© 2021 by the authors. Licensee MDPI, Basel, Switzerland. This article is an open access article distributed under the terms and conditions of the Creative Commons Attribution (CC BY) license (https://creativecommons.org/licenses/by/4.0/).
Share and Cite
Lukic, I.; Savic, N.; Simic, M.; Rankovic, N.; Rankovic, D.; Lazic, L. Risk Assessment and Determination of Factors That Cause the Development of Hyperinsulinemia in School-Age Adolescents. Medicina 2022, 58, 9. https://doi.org/10.3390/medicina58010009
Lukic I, Savic N, Simic M, Rankovic N, Rankovic D, Lazic L. Risk Assessment and Determination of Factors That Cause the Development of Hyperinsulinemia in School-Age Adolescents. Medicina. 2022; 58(1):9. https://doi.org/10.3390/medicina58010009
Chicago/Turabian StyleLukic, Igor, Nikola Savic, Maja Simic, Nevena Rankovic, Dragica Rankovic, and Ljubomir Lazic. 2022. "Risk Assessment and Determination of Factors That Cause the Development of Hyperinsulinemia in School-Age Adolescents" Medicina 58, no. 1: 9. https://doi.org/10.3390/medicina58010009
APA StyleLukic, I., Savic, N., Simic, M., Rankovic, N., Rankovic, D., & Lazic, L. (2022). Risk Assessment and Determination of Factors That Cause the Development of Hyperinsulinemia in School-Age Adolescents. Medicina, 58(1), 9. https://doi.org/10.3390/medicina58010009