
Serum Osteoprotegerin Level Is Negatively Associated with Bone Mineral Density in Patients Undergoing Maintenance Hemodialysis


Abstract
1. Introduction
2. Materials and Methods
2.1. Patients
2.2. Biochemical and Anthropometric Analysis
2.3. Bone Mineral Density Measurements
2.4. Statistical Analysis
3. Results
4. Discussion
5. Conclusions
Author Contributions
Funding
Institutional Review Board Statement
Informed Consent Statement
Data Availability Statement
Conflicts of Interest
References
- Hwang, S.J.; Lin, M.Y.; Chen, H.C.; Hwang, S.C.; Yang, W.C.; Hsu, C.C.; Chiu, H.C.; Mau, L.W. Increased risk of mortality in the elderly population with late-stage chronic kidney disease: A cohort study in Taiwan. Nephrol. Dial. Transplant. 2008, 23, 3192–3198. [Google Scholar] [CrossRef]
- Jamal, S.A.; Hayden, J.A.; Beyene, J. Low bone mineral density and fractures in long-term hemodialysis patients: A meta-analysis. Am. J. Kidney Dis. 2007, 49, 674–681. [Google Scholar] [CrossRef]
- Kwon, Y.E.; Choi, H.Y.; Kim, S.; Ryu, D.R.; Oh, H.J.; ESRD Registry Committee of the Korean Society of Nephrology. Fracture risk in chronic kidney disease: A Korean population-based cohort study. Kidney Res. Clin. Pract. 2019, 38, 220–228. [Google Scholar] [CrossRef]
- Naylor, K.L.; McArthur, E.; Leslie, W.D.; Fraser, L.A.; Jamal, S.A.; Cadarette, S.M.; Pouget, J.G.; Lok, C.E.; Hodsman, A.B.; Adachi, J.D.; et al. The three-year incidence of fracture in chronic kidney disease. Kidney Int. 2014, 86, 810–818. [Google Scholar] [CrossRef] [PubMed]
- Khan, M.I.; Syed, G.M.; Khan, A.I.; Sirwal, I.A.; Anwar, S.K.; Al-Oufi, A.R.; Balbaid, K.A. Mean bone mineral density and frequency of occurrence of osteopenia and osteoporosis in patients on hemodialysis: A single-center study. Saudi J. Kidney Dis. Transpl. 2014, 25, 38–43. [Google Scholar] [CrossRef] [PubMed]
- Slouma, M.; Sahli, H.; Bahlous, A.; Laadhar, L.; Smaoui, W.; Rekik, S.; Gharsallah, I.; Sallami, M.; Moussa, F.B.; Elleuch, M.; et al. Mineral bone disorder and osteoporosis in hemodialysis patients. Adv. Rheumatol. 2020, 60, 15. [Google Scholar] [CrossRef]
- Hsu, C.Y.; Chen, L.R.; Chen, K.H. Osteoporosis in patients with chronic kidney diseases: A systemic review. Int. J. Mol. Sci. 2020, 21, 6846. [Google Scholar] [CrossRef] [PubMed]
- Jamal, S.A.; West, S.L.; Miller, P.D. Fracture risk assessment in patients with chronic kidney disease. Osteoporos. Int. 2012, 23, 1191–1198. [Google Scholar] [CrossRef] [PubMed]
- Rochette, L.; Meloux, A.; Rigal, E.; Zeller, M.; Cottin, Y.; Vergely, C. The role of osteoprotegerin in the crosstalk between vessels and bone: Its potential utility as a marker of cardiometabolic diseases. Pharmacol. Ther. 2018, 182, 115–132. [Google Scholar] [CrossRef]
- Mizuno, A.; Amizuka, N.; Irie, K.; Murakami, A.; Fujise, N.; Kanno, T.; Sato, Y.; Nakagawa, N.; Yasuda, H.; Mochizuki, S.; et al. Severe osteoporosis in mice lacking osteoclastogenesis inhibitory factor/osteoprotegerin. Biochem. Biophys. Res. Commun. 1998, 247, 610–615. [Google Scholar] [CrossRef]
- Simonet, W.S.; Lacey, D.L.; Dunstan, C.R.; Kelley, M.; Chang, M.S.; Luthy, R.; Nguyen, H.Q.; Wooden, S.; Bennett, L.; Boone, T.; et al. Osteoprotegerin: A novel secreted protein involved in the regulation of bone density. Cell 1997, 89, 309–319. [Google Scholar] [CrossRef]
- Nascimento, M.M.; Hayashi, S.Y.; Riella, M.C.; Lindholm, B. Elevated levels of plasma osteoprotegerin are associated with all-cause mortality risk and atherosclerosis in patients with stages 3 to 5 chronic kidney disease. Braz. J. Med. Biol. Res. 2014, 47, 995–1002. [Google Scholar] [CrossRef][Green Version]
- Demir, P.; Erdenen, F.; Aral, H.; Emre, T.; Kose, S.; Altunoglu, E.; Dolgun, A.; Inal, B.B.; Turkmen, A. Serum osteoprotegerin levels related with cardiovascular risk factors in chronic kidney disease. J. Clin. Lab. Anal. 2016, 30, 811–817. [Google Scholar] [CrossRef]
- Morena, M.; Terrier, N.; Jaussent, I.; Leray-Moragues, H.; Chalabi, L.; Rivory, J.P.; Maurice, F.; Delcourt, C.; Cristol, J.P.; Canaud, B.; et al. Plasma osteoprotegerin is associated with mortality in hemodialysis patients. J. Am. Soc. Nephrol. 2006, 17, 262–270. [Google Scholar] [CrossRef]
- Nakashima, A.; Carrero, J.J.; Qureshi, A.R.; Hirai, T.; Takasugi, N.; Ueno, T.; Taniguchi, Y.; Lindholm, B.; Yorioka, N. Plasma osteoprotegerin, arterial stiffness, and mortality in normoalbuminemic Japanese hemodialysis patients. Osteoporos. Int. 2011, 22, 1695–1701. [Google Scholar] [CrossRef] [PubMed]
- Avbersek-Luznik, I.; Malesic, I.; Rus, I.; Marc, J. Increased levels of osteoprotegerin in hemodialysis patients. Clin. Chem. Lab. Med. 2002, 40, 1019–1023. [Google Scholar] [CrossRef]
- Barreto, F.C.; Barreto, D.V.; Moyses, R.M.; Neves, C.L.; Jorgetti, V.; Draibe, S.A.; Canziani, M.E.; Carvalho, A.B. Osteoporosis in hemodialysis patients revisited by bone histomorphometry: A new insight into an old problem. Kidney Int. 2006, 69, 1852–1857. [Google Scholar] [CrossRef] [PubMed]
- Nakashima, A.; Yorioka, N.; Doi, S.; Takasugi, N.; Shigemoto, K.; Kohno, N. Osteoprotegerin and bone mineral density in hemodialysis patients. Osteoporos. Int. 2006, 17, 841–846. [Google Scholar] [CrossRef] [PubMed]
- Moldovan, D.; Rusu, C.; Potra, A.; Moldovan, I.; Patiu, I.M.; Gherman-Caprioara, M.; Kacso, I.M. Osteoprotegerin and uremic osteoporosis in chronic hemodialysis patients. Int. Urol. Nephrol. 2017, 49, 895–901. [Google Scholar] [CrossRef]
- Kim, C.S.; Bae, E.H.; Ma, S.K.; Han, S.H.; Choi, K.H.; Lee, J.; Chae, D.W.; Oh, K.H.; Ahn, C.; Kim, S.W.; et al. Association of serum osteoprotegerin levels with bone loss in chronic kidney disease: Insights from the KNOW-CKD Study. PLoS ONE 2016, 11, e0166792. [Google Scholar] [CrossRef] [PubMed]
- Wu, W.T.; Lee, R.P.; Wang, C.H.; Fang, T.C.; Lin, N.T.; Chen, I.H.; Hsu, B.G. The association of serum osteoprotegerin and osteoporosis in postmenopausal hemodialysis patients: A pilot study. J. Womens Health 2010, 19, 785–790. [Google Scholar] [CrossRef]
- Doumouchtsis, K.K.; Kostakis, A.I.; Doumouchtsis, S.K.; Tziamalis, M.P.; Stathakis, C.P.; Diamanti-Kandarakis, E.; Dimitroulis, D.; Perrea, D.N. Associations between osteoprotegerin and femoral neck BMD in hemodialysis patients. J. Bone Miner. Res. 2008, 26, 66–72. [Google Scholar] [CrossRef] [PubMed]
- Lin, W.C.; Tsai, J.P.; Lai, Y.H.; Lin, Y.L.; Kuo, C.H.; Wang, C.H.; Hsu, B.G. Serum osteoprotegerin level is positively associated with peripheral artery disease in patients with peritoneal dialysis. Ren. Fail. 2020, 42, 131–136. [Google Scholar] [CrossRef] [PubMed]
- Lu, C.W.; Wang, C.H.; Lin, Y.L.; Kuo, C.H.; Lai, Y.H.; Hsu, B.G.; Tsai, J.P. Serum irisin level is positively associated with bone mineral density in patients on maintenance hemodialysis. Int. J. Endocrinol. 2021, 2021, 8890042. [Google Scholar] [CrossRef]
- Kanis, J.A.; Melton, L.J., 3rd; Christiansen, C.; Johnston, C.C.; Khaltaev, N. The diagnosis of osteoporosis. J. Bone Miner. Res. 1994, 9, 1137–1141. [Google Scholar] [CrossRef] [PubMed]
- Kidney Disease: Improving Global Outcomes (KDIGO) CKD-MBD Update Work Group. KDIGO 2017 Clinical practice guideline update for the diagnosis, evaluation, prevention, and treatment of chronic kidney disease-mineral and bone disorder (CKD-MBD). Kidney Int. Suppl. 2017, 7, 1–59. [Google Scholar] [CrossRef]
- West, S.L.; Lok, C.E.; Langsetmo, L.; Cheung, A.M.; Szabo, E.; Pearce, D.; Fusaro, M.; Wald, R.; Weinstein, J.; Jamal, S.A. Bone mineral density predicts fractures in chronic kidney disease. J. Bone Miner. Res. 2015, 30, 913–919. [Google Scholar] [CrossRef]
- Hyun, Y.Y.; Lee, K.B.; Han, S.H.; Choi, K.H.; Park, H.C.; Oh, Y.K.; Park, S.K.; Oh, K.H.; Ahn, C.; KoreaN cohort study for Outcome in patients With CKD (KNOW-CKD) Study Group. Risk factors and renal outcomes of low bone mineral density in patients with non-dialysis chronic kidney disease. Osteoporos. Int. 2020, 31, 2373–2382. [Google Scholar] [CrossRef]
- Fidan, N.; Inci, A.; Coban, M.; Ulman, C.; Kursat, S. Bone mineral density and biochemical markers of bone metabolism in predialysis patients with chronic kidney disease. J. Investig. Med. 2016, 64, 861–866. [Google Scholar] [CrossRef]
- Malluche, H.H.; Davenport, D.L.; Cantor, T.; Monier-Faugere, M.C. Bone mineral density and serum biochemical predictors of bone loss in patients with CKD on dialysis. Clin. J. Am. Soc. Nephrol. 2014, 9, 1254–1262. [Google Scholar] [CrossRef]
- Ito, K.; Ookawara, S.; Hibino, Y.; Imai, S.; Fueki, M.; Bandai, Y.; Yasuda, M.; Kamimura, T.; Kakuda, H.; Kiryu, S.; et al. Skeletal muscle mass index is positively associated with bone mineral density in hemodialysis patients. Front. Med. 2020, 7, 187. [Google Scholar] [CrossRef]
- Bucay, N.; Sarosi, I.; Dunstan, C.R.; Morony, S.; Tarpley, J.; Capparelli, C.; Scully, S.; Tan, H.L.; Xu, W.; Lacey, D.L.; et al. Osteoprotegerin-deficient mice develop early onset osteoporosis and arterial calcification. Genes Dev. 1998, 12, 1260–1268. [Google Scholar] [CrossRef]
- Min, H.; Morony, S.; Sarosi, I.; Dunstan, C.R.; Capparelli, C.; Scully, S.; Van, G.; Kaufman, S.; Kostenuik, P.J.; Lacey, D.L.; et al. Osteoprotegerin reverses osteoporosis by inhibiting endosteal osteoclasts and prevents vascular calcification by blocking a process resembling osteoclastogenesis. J. Exp. Med. 2000, 192, 463–474. [Google Scholar] [CrossRef] [PubMed]
- Huang, Q.X.; Li, J.B.; Huang, N.; Huang, X.W.; Li, Y.L.; Huang, F.X. Elevated osteoprotegerin concentration predicts increased risk of cardiovascular mortality in patients with chronic kidney disease: A systematic review and meta-analysis. Kidney Blood Press. Res. 2020, 45, 565–575. [Google Scholar] [CrossRef] [PubMed]
- West, S.L.; Lok, C.E.; Jamal, S.A. Osteoprotegerin and fractures in men and women with chronic kidney disease. J. Bone Miner. Metab. 2014, 32, 428–433. [Google Scholar] [CrossRef] [PubMed]
- Indridason, O.S.; Franzson, L.; Sigurdsson, G. Serum osteoprotegerin and its relationship with bone mineral density and markers of bone turnover. Osteoporos. Int. 2005, 16, 417–423. [Google Scholar] [CrossRef]


| Characteristics | All Patients (n = 75) | Normal (n = 48) | Osteopenia (n = 20) | Osteoporosis (n = 7) | p Value |
|---|---|---|---|---|---|
| Age (years) | 66.04 ± 9.08 | 63.94 ± 8.89 | 70.25 ± 8.84 | 68.43 ± 7.09 | 0.023 * |
| Female, n (%) | 38 (50.7) | 17 (35.4) | 15 (75.0) | 6 (85.7) | 0.002 * |
| Diabetes mellitus, n (%) | 37 (49.3) | 27 (56.3) | 8 (40.0) | 2 (28.6) | 0.244 |
| Hypertension, n (%) | 33 (44.0) | 21 (43.8) | 9 (45.0) | 3 (42.9) | 0.993 |
| Hemodialysis duration (months) | 49.00 (21.00–110.00) | 52.00 (19.00–114.00) | 46.00 (24.00–108.00) | 98.00 (17.00–255.00) | 0.658 |
| Body mass index (kg/m2) | 24.78 ± 4.86 | 25.92 ± 5.01 | 23.61 ± 3.94 | 20.26 ± 2.26 | 0.006 * |
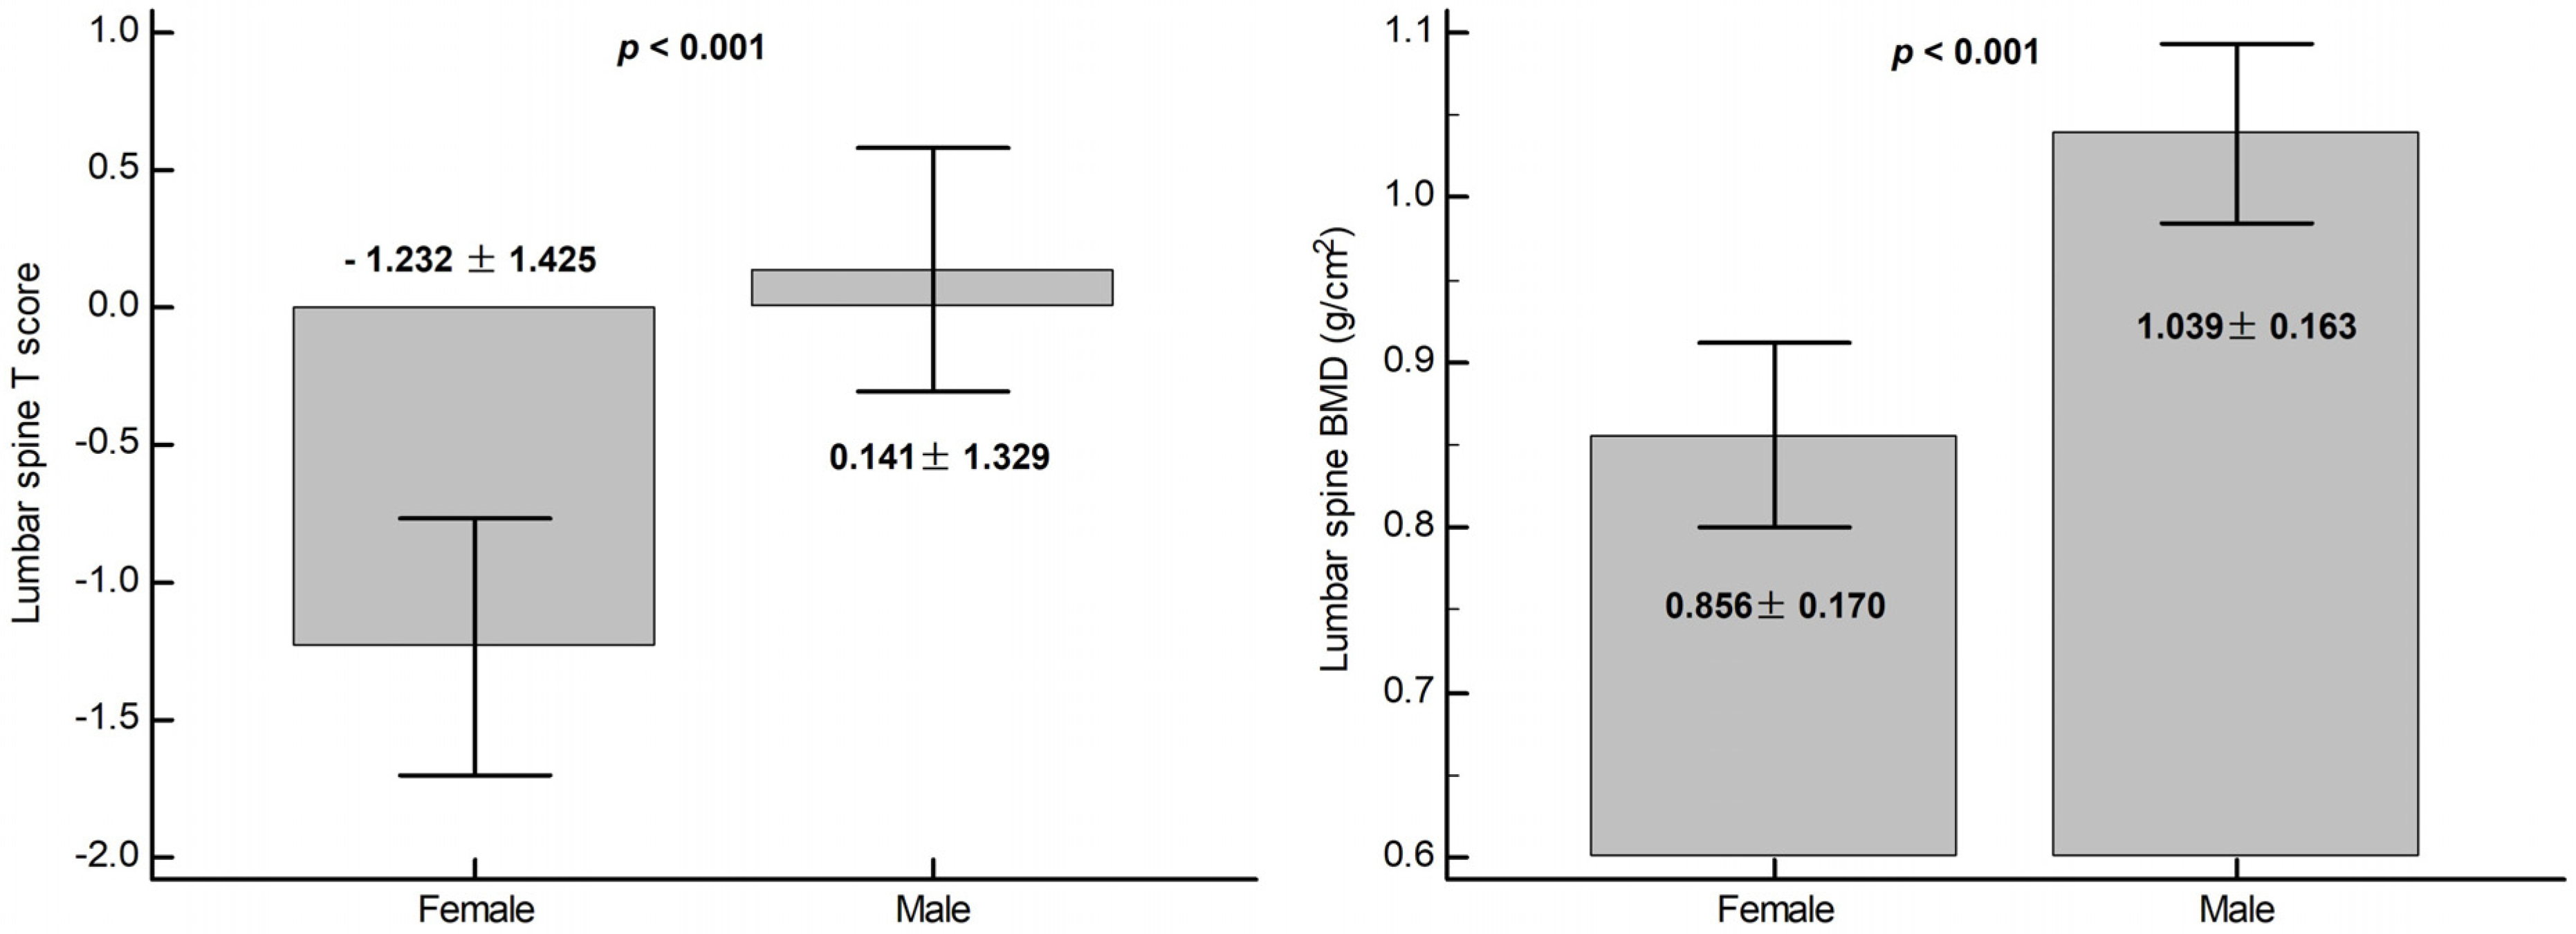
| Lumbar bone mineral density (g/cm2) | 0.95 ± 0.19 | 1.06 ± 0.13 | 0.79 ± 0.07 | 0.65 ± 0.05 | <0.001 * |
| Lumbar T-score | −0.55 ± 1.53 | 0.34 ± 1.07 | −1.83 ± 0.56 | −3.01 ± 0.43 | <0.001 * |
| Systolic blood pressure (mmHg) | 139.89 ± 26.26 | 142.46 ± 24.68 | 141.00 ± 28.39 | 119.14 ± 24.90 | 0.086 |
| Diastolic blood pressure (mmHg) | 73.64 ± 14.00 | 74.77 ± 14.70 | 74.65 ± 12.20 | 63.00 ± 10.38 | 0.107 |
| Albumin (mg/dL) | 4.10 (3.80–4.40) | 4.10 (3.90–4.40) | 4.10 (3.85–4.25) | 3.70 (3.60–5.20) | 0.728 |
| Total cholesterol (mg/dL) | 145.31 ± 33.99 | 142.75 ± 34.85 | 149.95 ± 31.97 | 149.57 ± 36.82 | 0.691 |
| Triglyceride (mg/dL) | 126.00 (90.00–200.00) | 157.50 (104.50–219.50) | 97.00 (84.00–144.00) | 101.00 (53.00–131.00) | 0.020 * |
| Glucose (mg/dL) | 135.00 (110.00–185.00) | 143.50 (110.00–196.00) | 124.00 (107.00–159.25) | 132.00 (103.00–142.00) | 0.360 |
| Blood urea nitrogen (mg/dL) | 57.55 ± 13.12 | 55.92 ± 12.48 | 59.30 ± 14.35 | 63.71 ± 13.15 | 0.269 |
| Creatinine (mg/dL) | 9.11 ± 1.83 | 9.33 ± 1.85 | 8.75 ± 1.82 | 8.64 ± 1.77 | 0.387 |
| Alkaline phosphatase (U/L) | 88.80 ± 36.06 | 82.25 ± 33.87 | 96.90 ± 37.15 | 110.57 ± 39.56 | 0.077 |
| Total calcium (mg/dL) | 8.96 ± 0.73 | 8.90 ± 0.67 | 9.19 ± 0.81 | 8.75 ± 0.85 | 0.231 |
| Phosphorus (mg/dL) | 4.49 ± 1.23 | 4.59 ± 1.10 | 4.42 ± 1.44 | 4.06 ± 1.50 | 0.543 |
| Intact parathyroid hormone (pg/mL) | 231.68 ± 185.34 | 198.68 ± 174.60 | 287.26 ± 192.13 | 299.21 ± 208.87 | 0.119 |
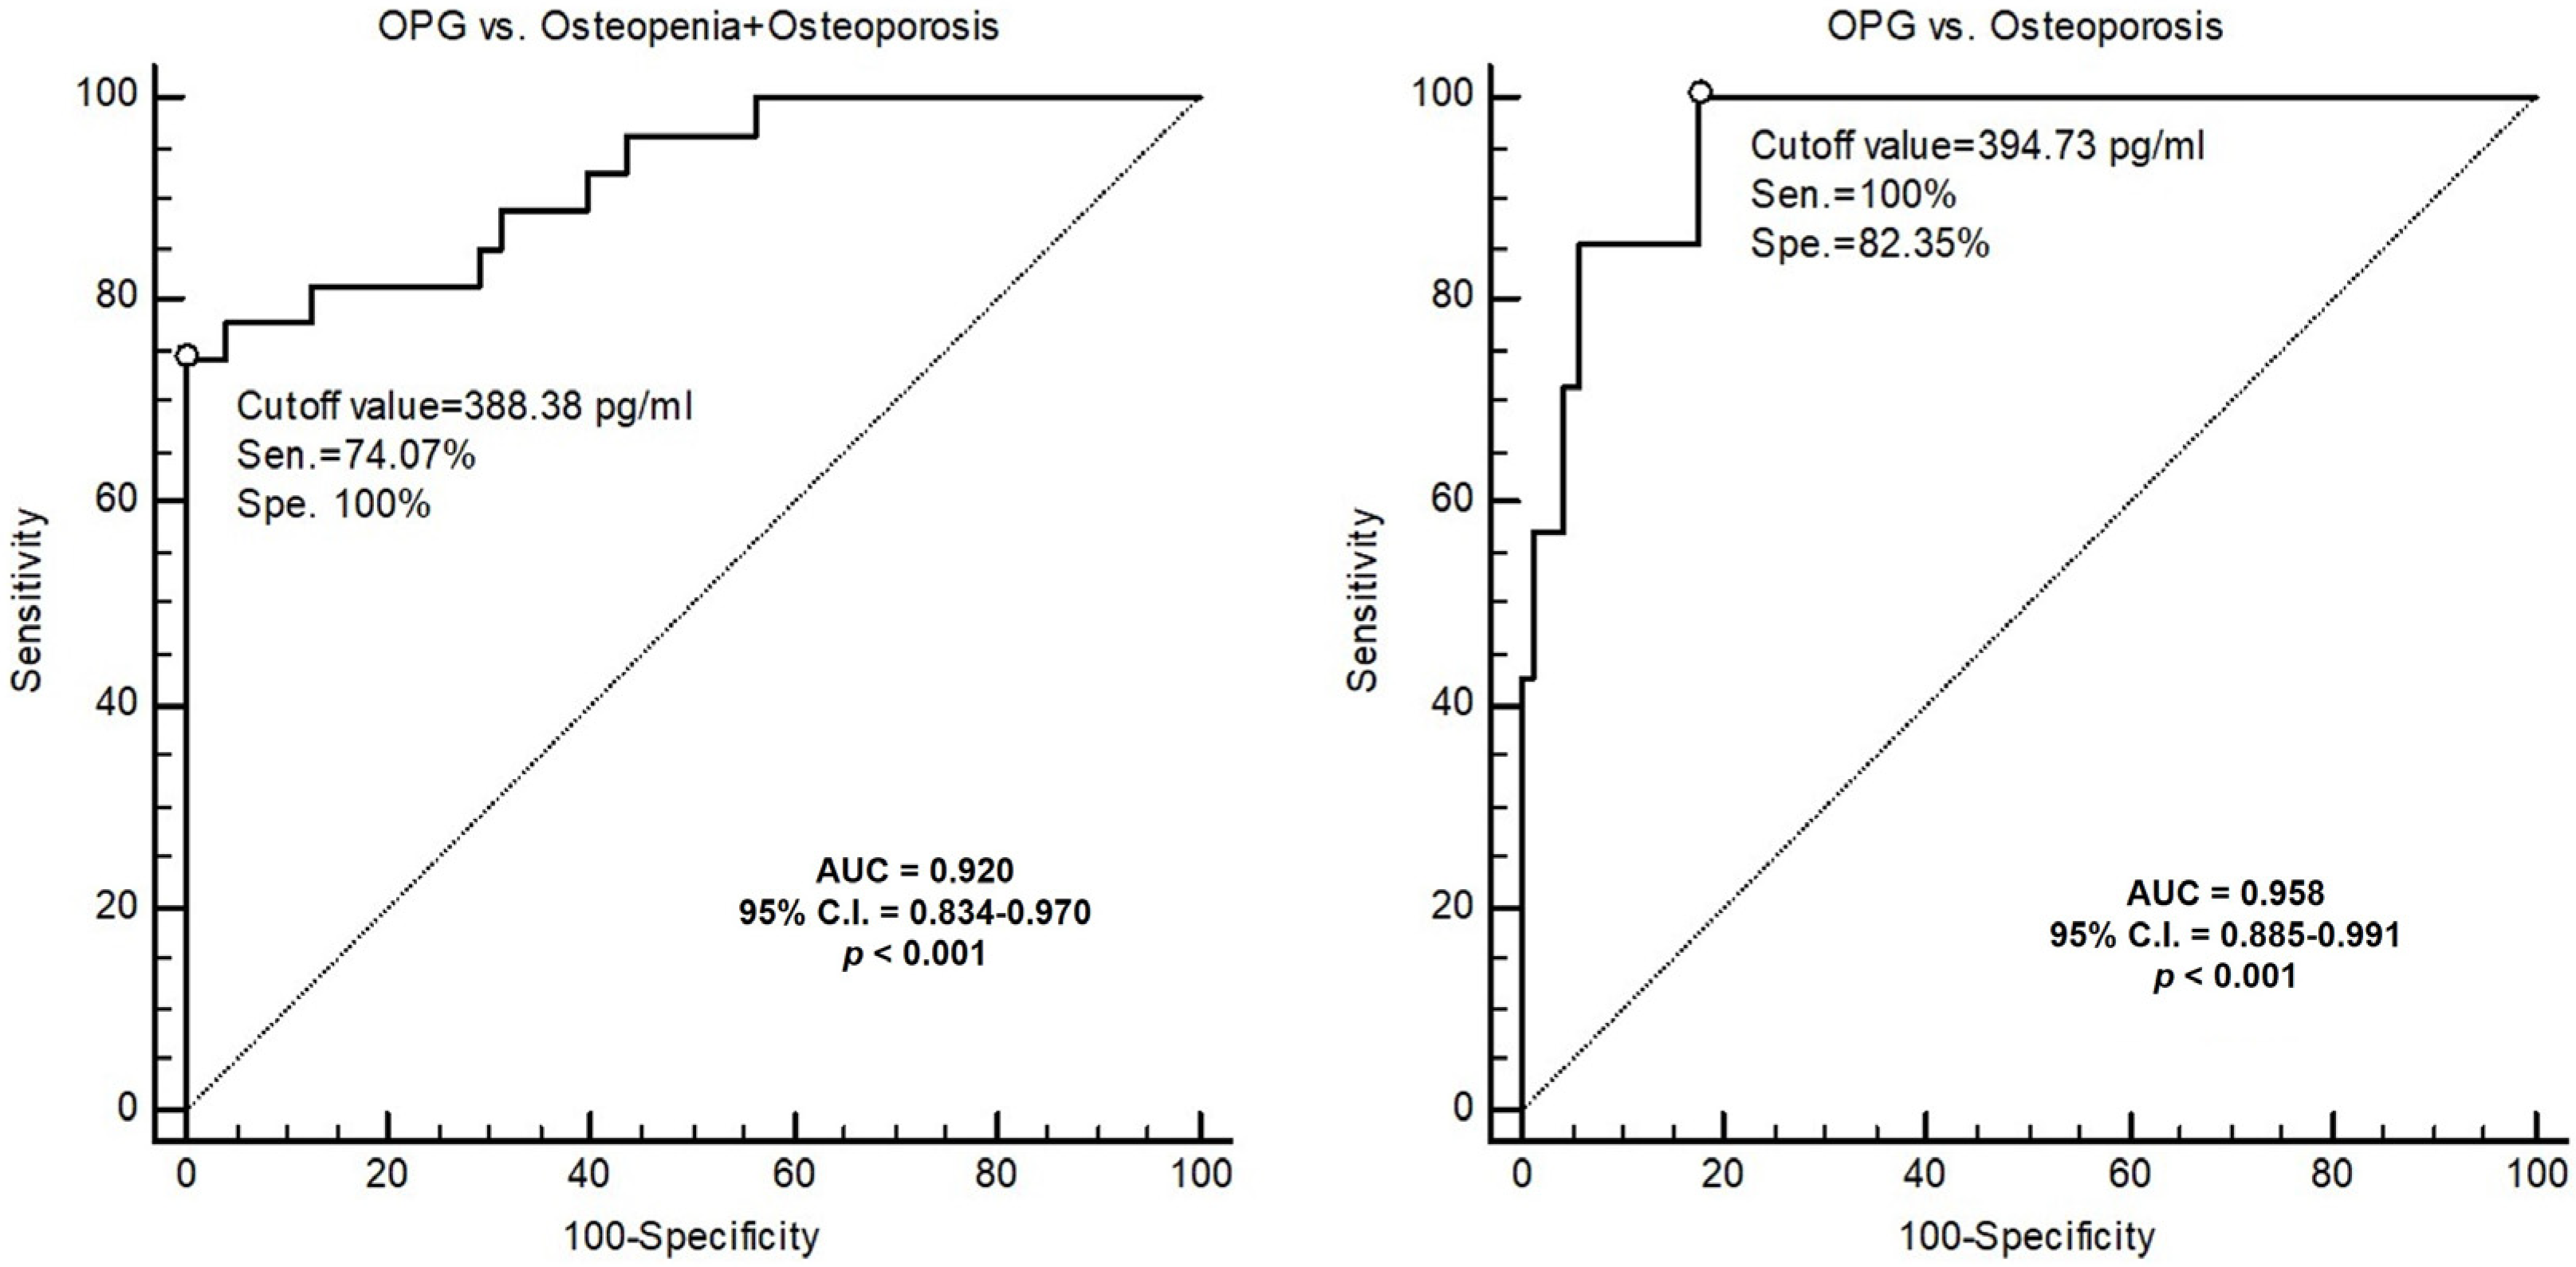
| Osteoprotegerin (pg/mL) | 320.48 ± 172.17 | 231.27 ± 82.47 | 413.87 ± 118.05 | 665.37 ± 191.45 | <0.001 * |
| Urea reduction rate | 0.74 ± 0.04 | 0.73 ± 0.04 | 0.75 ± 0.04 | 0.76 ± 0.04 | 0.021 * |
| Kt/V (Gotch) | 1.34 ± 0.17 | 1.30 ± 0.16 | 1.41 ± 0.17 | 1.44 ± 0.17 | 0.027 * |
| Variable | OR | 95% CI | p Value | aOR | 95% CI | p Value |
|---|---|---|---|---|---|---|
| Age (years) | 1.080 | 1.019–1.144 | 0.001 * | — | — | — |
| Female | 6.382 | 2.161–18.85 | <0.001 * | 13.37 | 2.049–87.30 | 0.007 * |
| Diabetes mellitus | 0.458 | 0.174–1.204 | 0.113 | — | — | — |
| Hypertension | 1.029 | 0.398–2.658 | 0.954 | — | — | — |
| Hemodialysis duration (months) | 1.004 | 0.997–1.012 | 0.237 | — | — | — |
| Body mass index (kg/m2) | 0.844 | 0.792–0.960 | 0.010 * | — | — | — |
| Albumin (mg/dL) | 0.727 | 0.215–2.462 | 0.609 | — | — | — |
| Total cholesterol (mg/dL) | 1.006 | 0.992–1.020 | 0.385 | — | — | — |
| Triglyceride (mg/dL) | 0.993 | 0.987–1.0 | 0.041 * | — | — | — |
| Glucose (mg/dL) | 0.995 | 0.987–1.003 | 0.203 | — | — | — |
| Blood urea nitrogen (mg/dL) | 1.028 | 0.990–1.068 | 0.155 | — | — | — |
| Creatinine (mg/dL) | 0.825 | 0.626–1.086 | 0.170 | — | — | — |
| Kt/V (Gotch) | 23.00 | 2.021–261.7 | 0.012 * | — | — | — |
| Alkaline phosphatase (U/L) | 1.014 | 1.001–1.028 | 0.042 * | — | — | — |
| Total calcium (mg/dL) | 1.414 | 0.729–2.741 | 0.306 | — | — | — |
| Phosphorus (mg/dL) | 0.835 | 0.561–1.241 | 0.372 | — | — | — |
| Intact parathyroid hormone (pg/mL) | 1.003 | 1.000–1.005 | 0.043 | — | — | — |
| Osteoprotegerin (pg/mL) | 1.020 | 1.010–1.029 | <0.001 * | 1.022 | 1.011–1.034 | <0.001 * |
| Variable | OR | 95% CI | p Value | aOR | 95% CI | p Value |
|---|---|---|---|---|---|---|
| Age (years) | 1.033 | 0.947–1.127 | 0.465 | — | — | — |
| Female | 6.750 | 0.771–59.11 | 0.085 | — | — | — |
| Diabetes mellitus | 0.377 | 0.068–2.080 | 0.263 | — | — | — |
| Hypertension | 0.950 | 0.197–4.574 | 0.949 | — | — | — |
| Hemodialysis duration (months) | 1.010 | 1.000–1.020 | 0.056 | — | — | — |
| Body mass index (kg/m2) | 0.691 | 0.518–0.993 | 0.012 * | — | — | — |
| Albumin (mg/dL) | 1.716 | 0.262–11.24 | 0.573 | — | — | — |
| Total cholesterol (mg/dL) | 1.004 | 0.982–1.027 | 0.726 | — | — | — |
| Triglyceride (mg/dL) | 0.993 | 0.981–1.005 | 0.251 | — | — | — |
| Glucose (mg/dL) | 0.990 | 0.972–1.008 | 0.269 | — | — | — |
| Blood urea nitrogen (mg/dL) | 1.042 | 0.979–1.109 | 0.194 | — | — | — |
| Creatinine (mg/dL) | 0.849 | 0.539–1.337 | 0.479 | — | — | — |
| Kt/V (Gotch) | 25.40 | 0.649–994.8 | 0.084 | — | — | — |
| Alkaline phosphatase (U/L) | 1.016 | 0.997–1.035 | 0.106 | — | — | — |
| Total calcium (mg/dL) | 0.636 | 0.212–1.909 | 0.419 | — | — | — |
| Phosphorus (mg/dL) | 0.707 | 0.355–1.407 | 0.323 | — | — | — |
| Intact parathyroid hormone (pg/mL) | 1.002 | 0.998–1.006 | 0.316 | — | — | — |
| Osteoprotegerin (pg/mL) | 1.015 | 1.005–1.026 | 0.004 * | 1.015 | 1.005–1.026 | 0.004 * |
Publisher’s Note: MDPI stays neutral with regard to jurisdictional claims in published maps and institutional affiliations. |
© 2021 by the authors. Licensee MDPI, Basel, Switzerland. This article is an open access article distributed under the terms and conditions of the Creative Commons Attribution (CC BY) license (https://creativecommons.org/licenses/by/4.0/).
Share and Cite
Lu, C.-W.; Wang, C.-H.; Hsu, B.-G.; Tsai, J.-P. Serum Osteoprotegerin Level Is Negatively Associated with Bone Mineral Density in Patients Undergoing Maintenance Hemodialysis. Medicina 2021, 57, 762. https://doi.org/10.3390/medicina57080762
Lu C-W, Wang C-H, Hsu B-G, Tsai J-P. Serum Osteoprotegerin Level Is Negatively Associated with Bone Mineral Density in Patients Undergoing Maintenance Hemodialysis. Medicina. 2021; 57(8):762. https://doi.org/10.3390/medicina57080762
Chicago/Turabian StyleLu, Chia-Wen, Chih-Hsien Wang, Bang-Gee Hsu, and Jen-Pi Tsai. 2021. "Serum Osteoprotegerin Level Is Negatively Associated with Bone Mineral Density in Patients Undergoing Maintenance Hemodialysis" Medicina 57, no. 8: 762. https://doi.org/10.3390/medicina57080762
APA StyleLu, C.-W., Wang, C.-H., Hsu, B.-G., & Tsai, J.-P. (2021). Serum Osteoprotegerin Level Is Negatively Associated with Bone Mineral Density in Patients Undergoing Maintenance Hemodialysis. Medicina, 57(8), 762. https://doi.org/10.3390/medicina57080762