
Improved Methods for Mid-Term Blood Glucose Level Prediction Using Dietary and Insulin Logs


Abstract
:1. Introduction

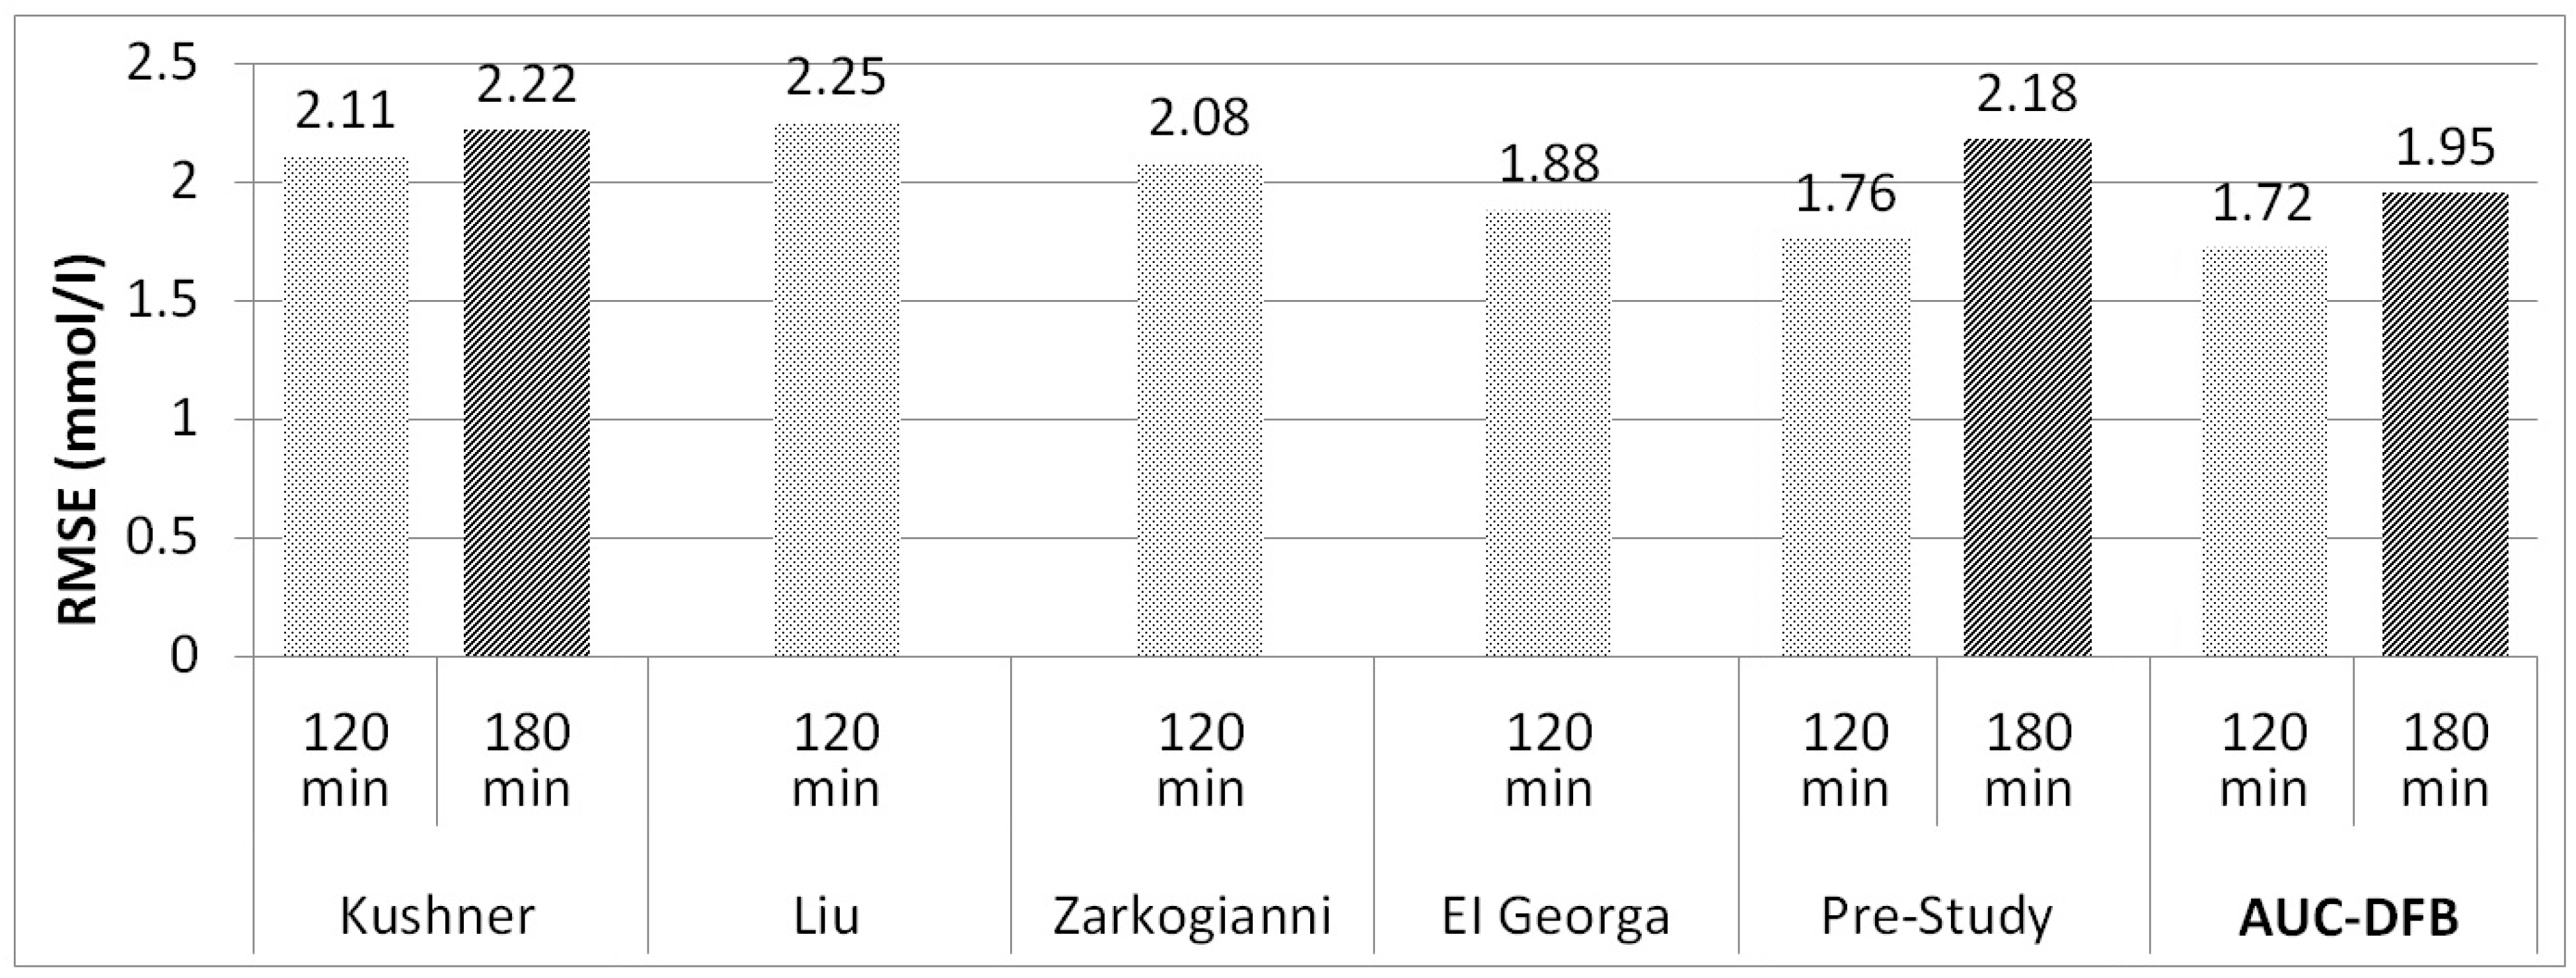
| Author and Year | Method and Model Inputs | Patients and Training Data Sets | Results RMSE [mmol/L] for each PH |
|---|---|---|---|
| Kushner 2020 [14] | FNN, shallow neural networks Inputs: CGM, insulin | 24 patients, duration: N/A | 90 min: 1.83 |
| 120 min: 2.11 | |||
| 180 min: 2.22 | |||
| 240 min: 2.39 | |||
| Montaser 2020 [19] | Seasonal autoregressive integrative moving average Inputs: CGM, insulin, and energy expenditure | 18 patients with closed-loop CGM/insulin pump, duration: 60 h | 30 min: 0.57 |
| 60 min: 1.04 | |||
| 90 min: 1.24 | |||
| Liu 2019 [7] | Physiological model Inputs: CGM, CH | 10 patients, duration: 14 days | 60 min: 1.68 |
| 90 min: 2.12 | |||
| 120 min: 2.25 | |||
| Aliberti 2019 [12] | Non-linear autoregressive NN Inputs: CGM only | 451 patients, duration: more than 2 days | 60 min: 0.73 |
| 90 min: 1.59 | |||
| Frandes 2016 [8] | Auto-regressive NN Inputs: CGM only | 17 patients, duration: 4–7 days | 30 min: 0.13 |
| 60 min: 0.24 | |||
| 90 min: 1.23 | |||
| Zarkogianni 2014–2015 [9,22] | Adaptive neuro-fuzzy inference Inputs: CGM, physical activity | 10 patients, duration: 6 days | 60 min: 1.26 |
| 120 min: 2.08 | |||
| Mathiyazhagan 2014 [20] | Adaptive network-based fuzzy inference system Inputs: CGM, insulin, and CH | 2 patients, duration: 52 days | 30 min: 1.72 |
| 60 min: 3.16 | |||
| 120 min: 5.71 | |||
| El Georga 2010 [10] | Support vector regression Inputs: CGM, insulin, and CH | 2 patients, duration: 5, 11 days | 60 min: 1.28 |
| 120 min: 1.88 | |||
| Finan 2009 [23] | Autoregressive moving average Inputs: CGM only | 6 patients, duration: 2–8 days | 30 min: 1.50 |
| 60 min: 2.50 | |||
| 90 min: 3.39 | |||
| Pre-study 2020 [21] | FNN Inputs: CGM, insulin, and glucose absorption curve from model | 5 patients, duration:1 1–23 days | 60 min: 1.12 |
| 90 min: 1.62 | |||
| 120 min: 1.76 | |||
| 180 min: 2.18 |
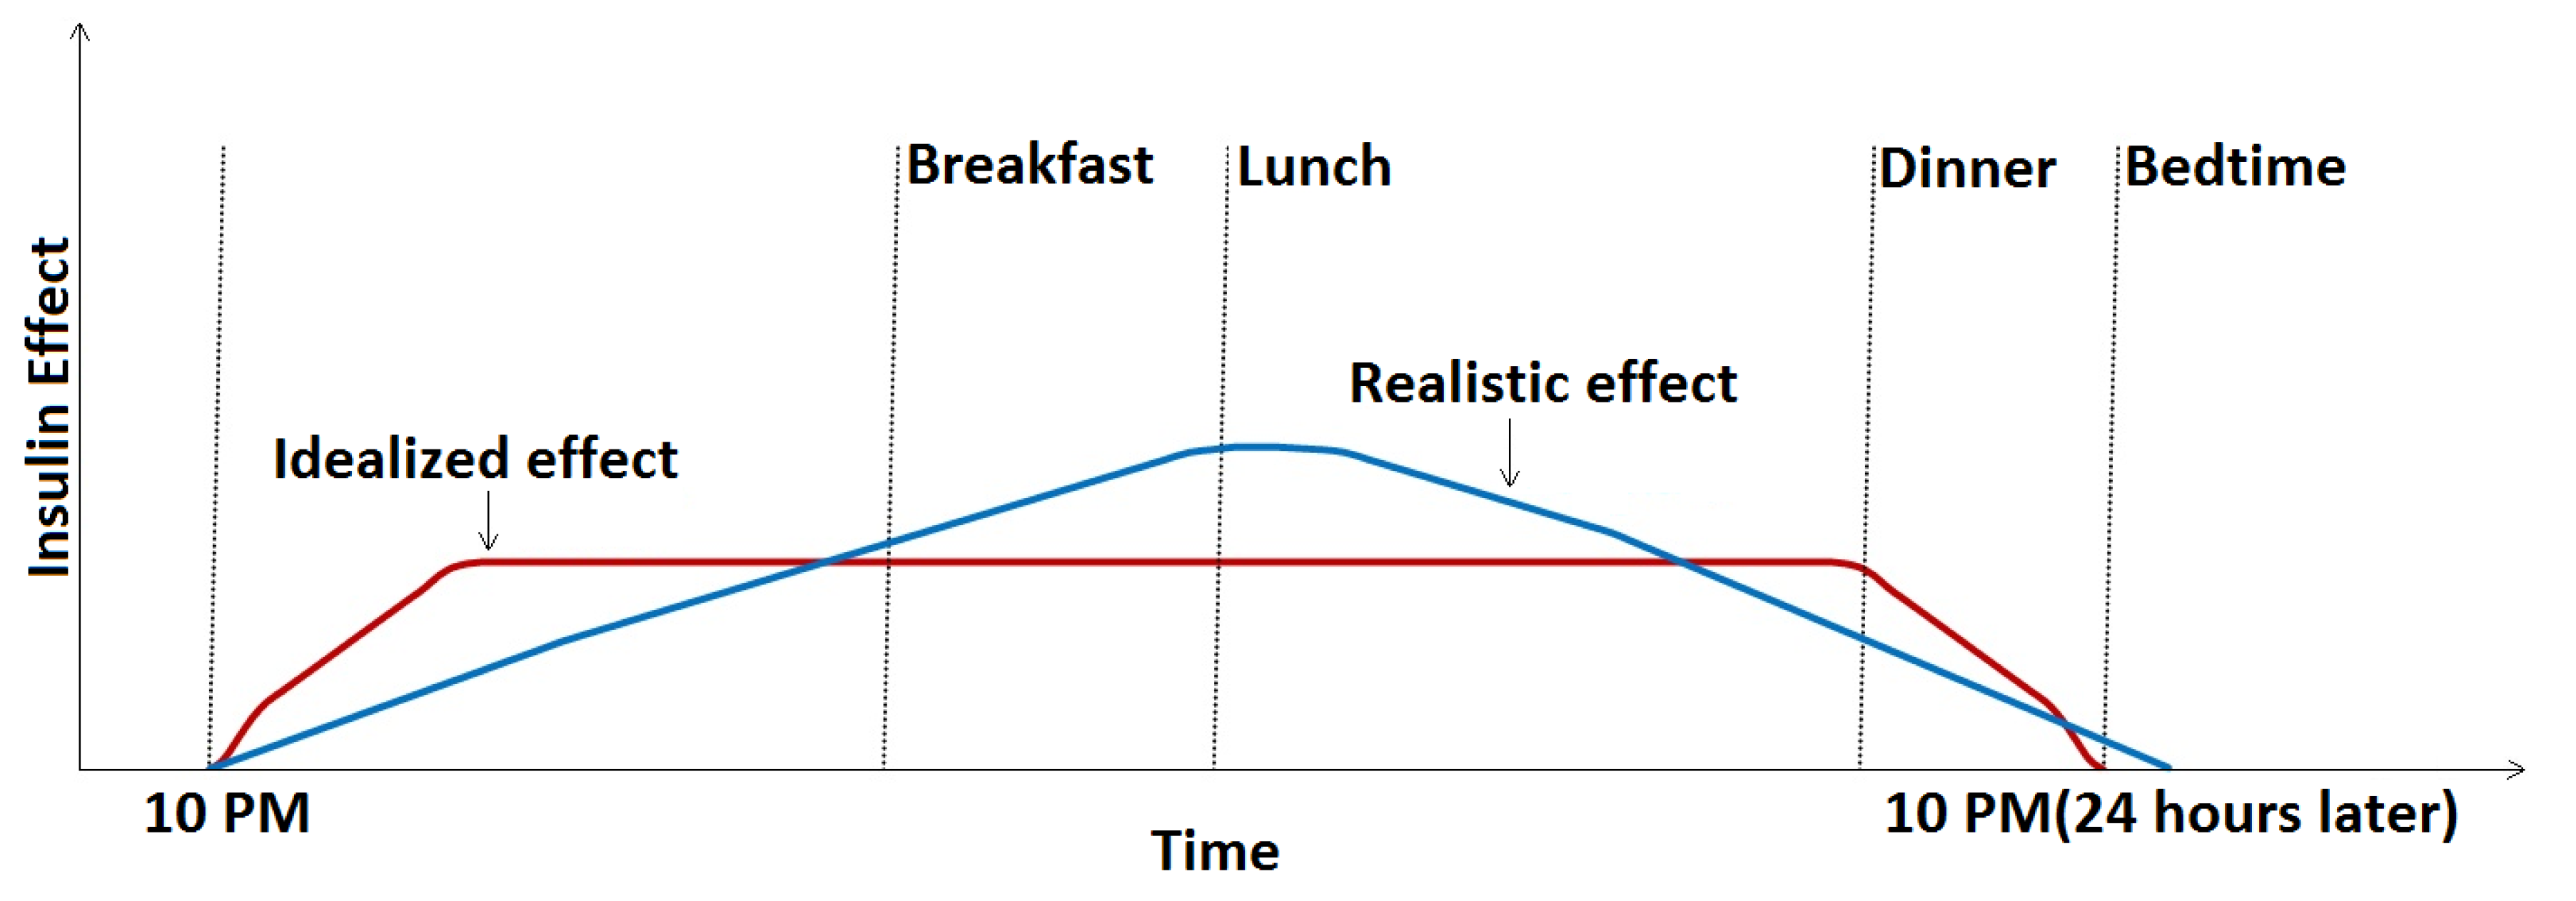
- The model does not account for the slowly weakening effect of the basal insulin. Ideally, basal insulin should very quickly produce a constant base insulin effect that is maintained for 24 h and drops sharply to zero by the time of the next basal injection, but the build-up and cessation of the effect are, in fact, gradual [3], similar to that shown in Figure 1. As basal insulin adds to the bolus insulin, we can thus expect that the same bolus amount will have less of an effect for a meal at noon than in the evening before applying the next basal dose. Thus, if basal insulin information could be included in the prediction model inputs, we expect that the model could better adapt to this slowly changing effect.
- The pre-study used absorption parameters that characterized only the first one hour of the absorption process. Mid-term (120 and 180 min) predictions are expected to benefit from adding more information about the process’s whole duration.
2. Methods
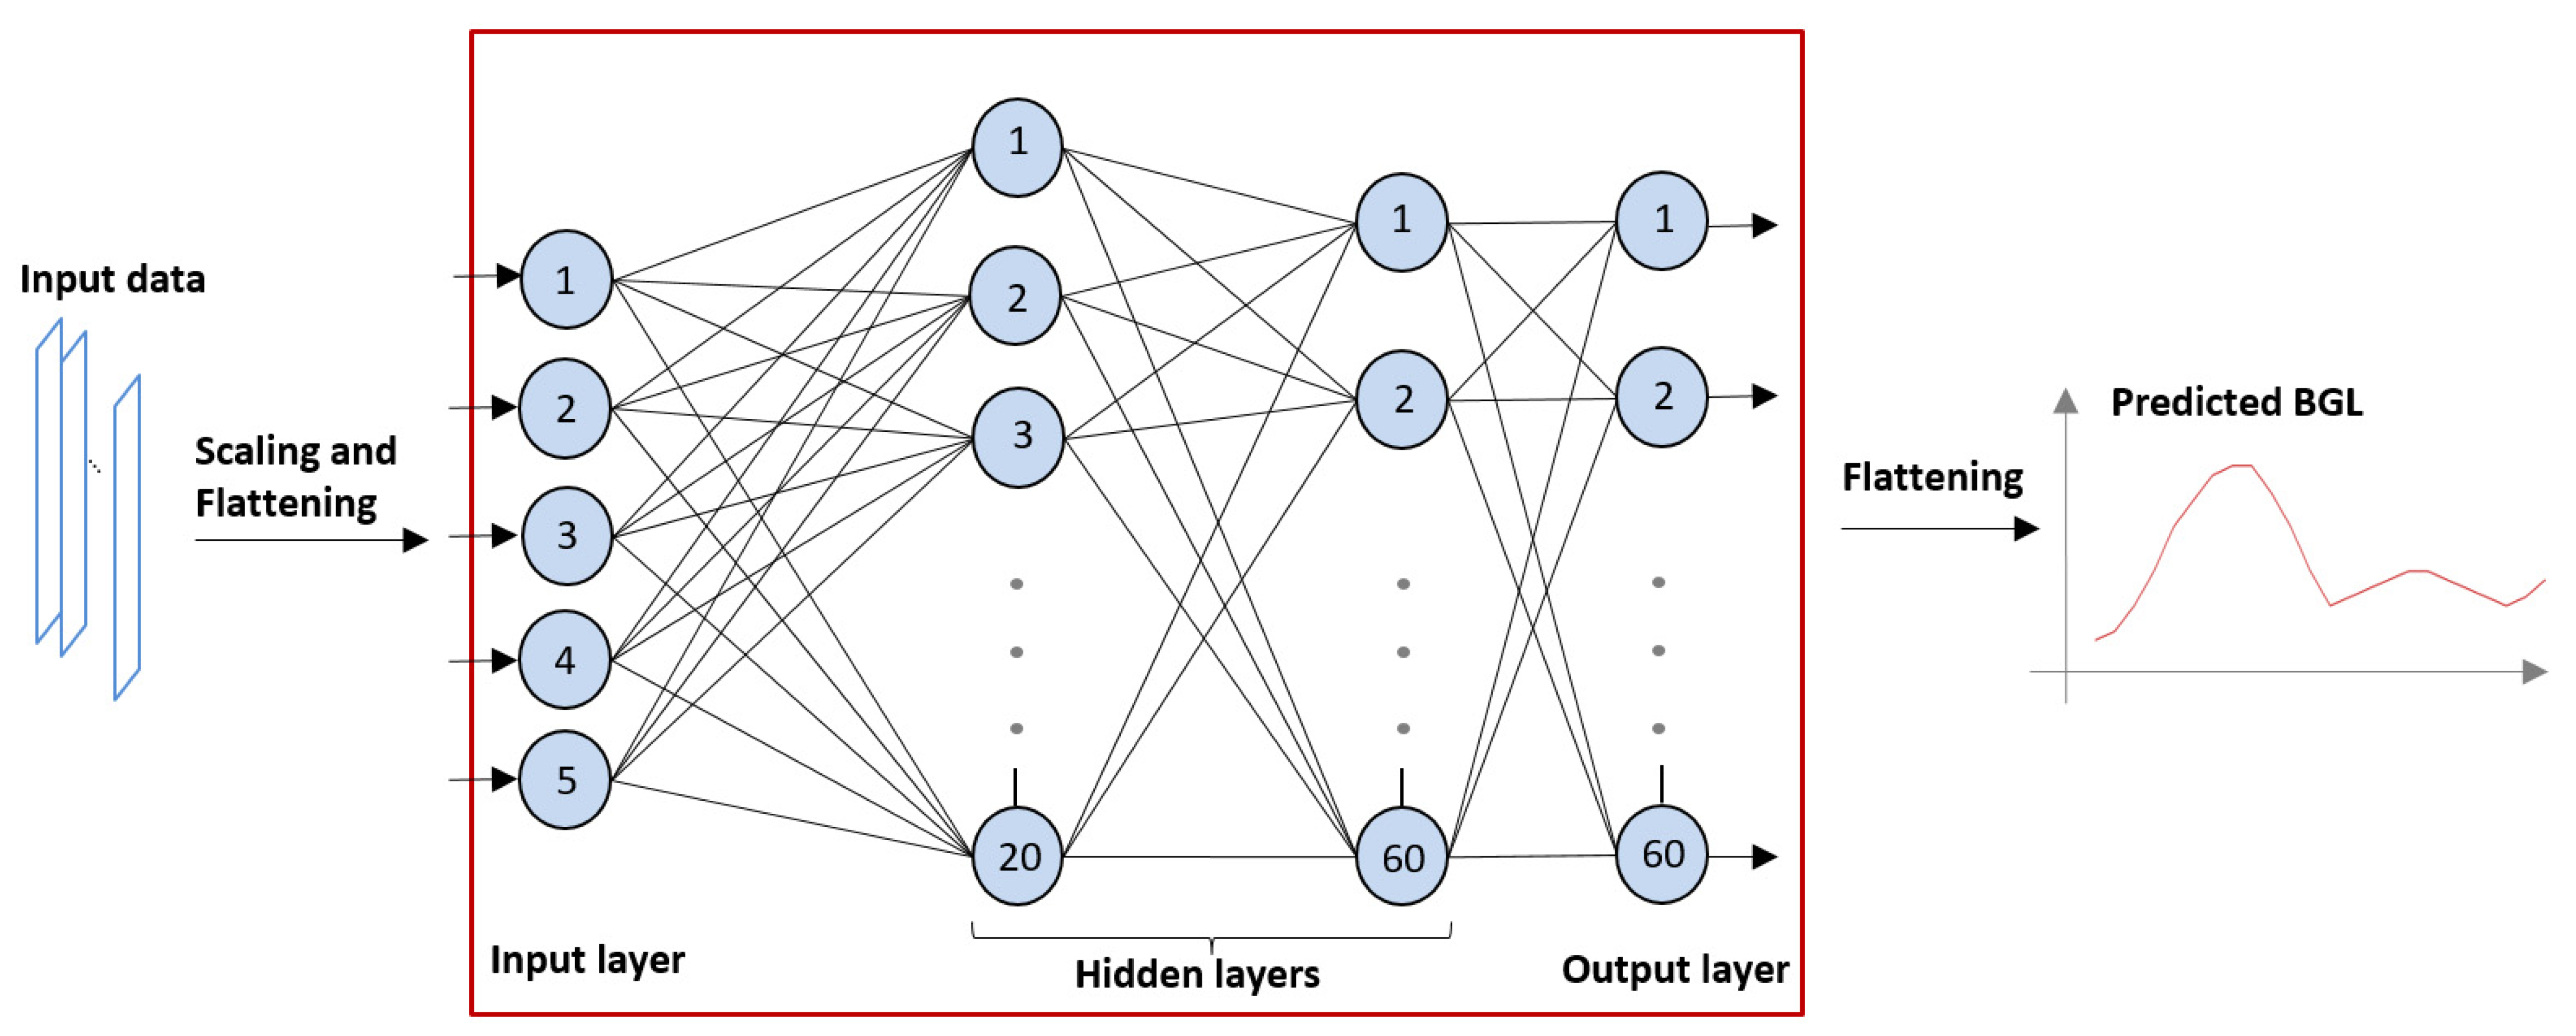
2.1. The Artificial Neural Network
- The FNN is initialized with a set of default weights;
- The expected output, in our case, the recorded BGL values, is loaded in the nodes in the output layer, comparing them to the current output, and computing the error;
- The error is used in the underlying layers to change the synaptic weights according to a ‘learning’ regime [24];
- This process is iterated several times. The training is successful if the error is gradually decreasing across several iterations, i.e., the network converges;
- The next input/output training sample is loaded into the FNN, and the training is continued with the final synaptic weight set of the previous training sample as the startup weight set.
- The FNN has some algorithmic parameters that must be tuned for a particular application and training set in order for the network to converge. In our survey, these parameters were determined empirically to achieve the best results as follows.
- The quasi-Newton method was used as the training regime [25];
- The neurons’ activation function was set to hyperbolic tangent, a smooth transition function used most often for NN training;
- For the learning regime, a method faster than traditional back-propagation, the Brent training rate method, was used with a training tolerance rate of 0.000001 [26];
- The number of hidden layers was set to 2, the first layer containing 20 neurons and the second containing 60 (as shown in Figure 1);
- The maximum number of iteration cycles was set to 118. Using more hidden layers or more iteration cycles was found to result in over-training (the model was too specific for the training sample), producing worse predictions;
- In order to transform the value ranges of the inputs into a common range, scaling was performed for two of the input parameters via division by 100 or 1000 (see the proposed input list below Figure 3);
- The error threshold was set to 10 × 10−16, i.e., an error below this threshold terminated the training process.
2.2. The Inputs of the FNN
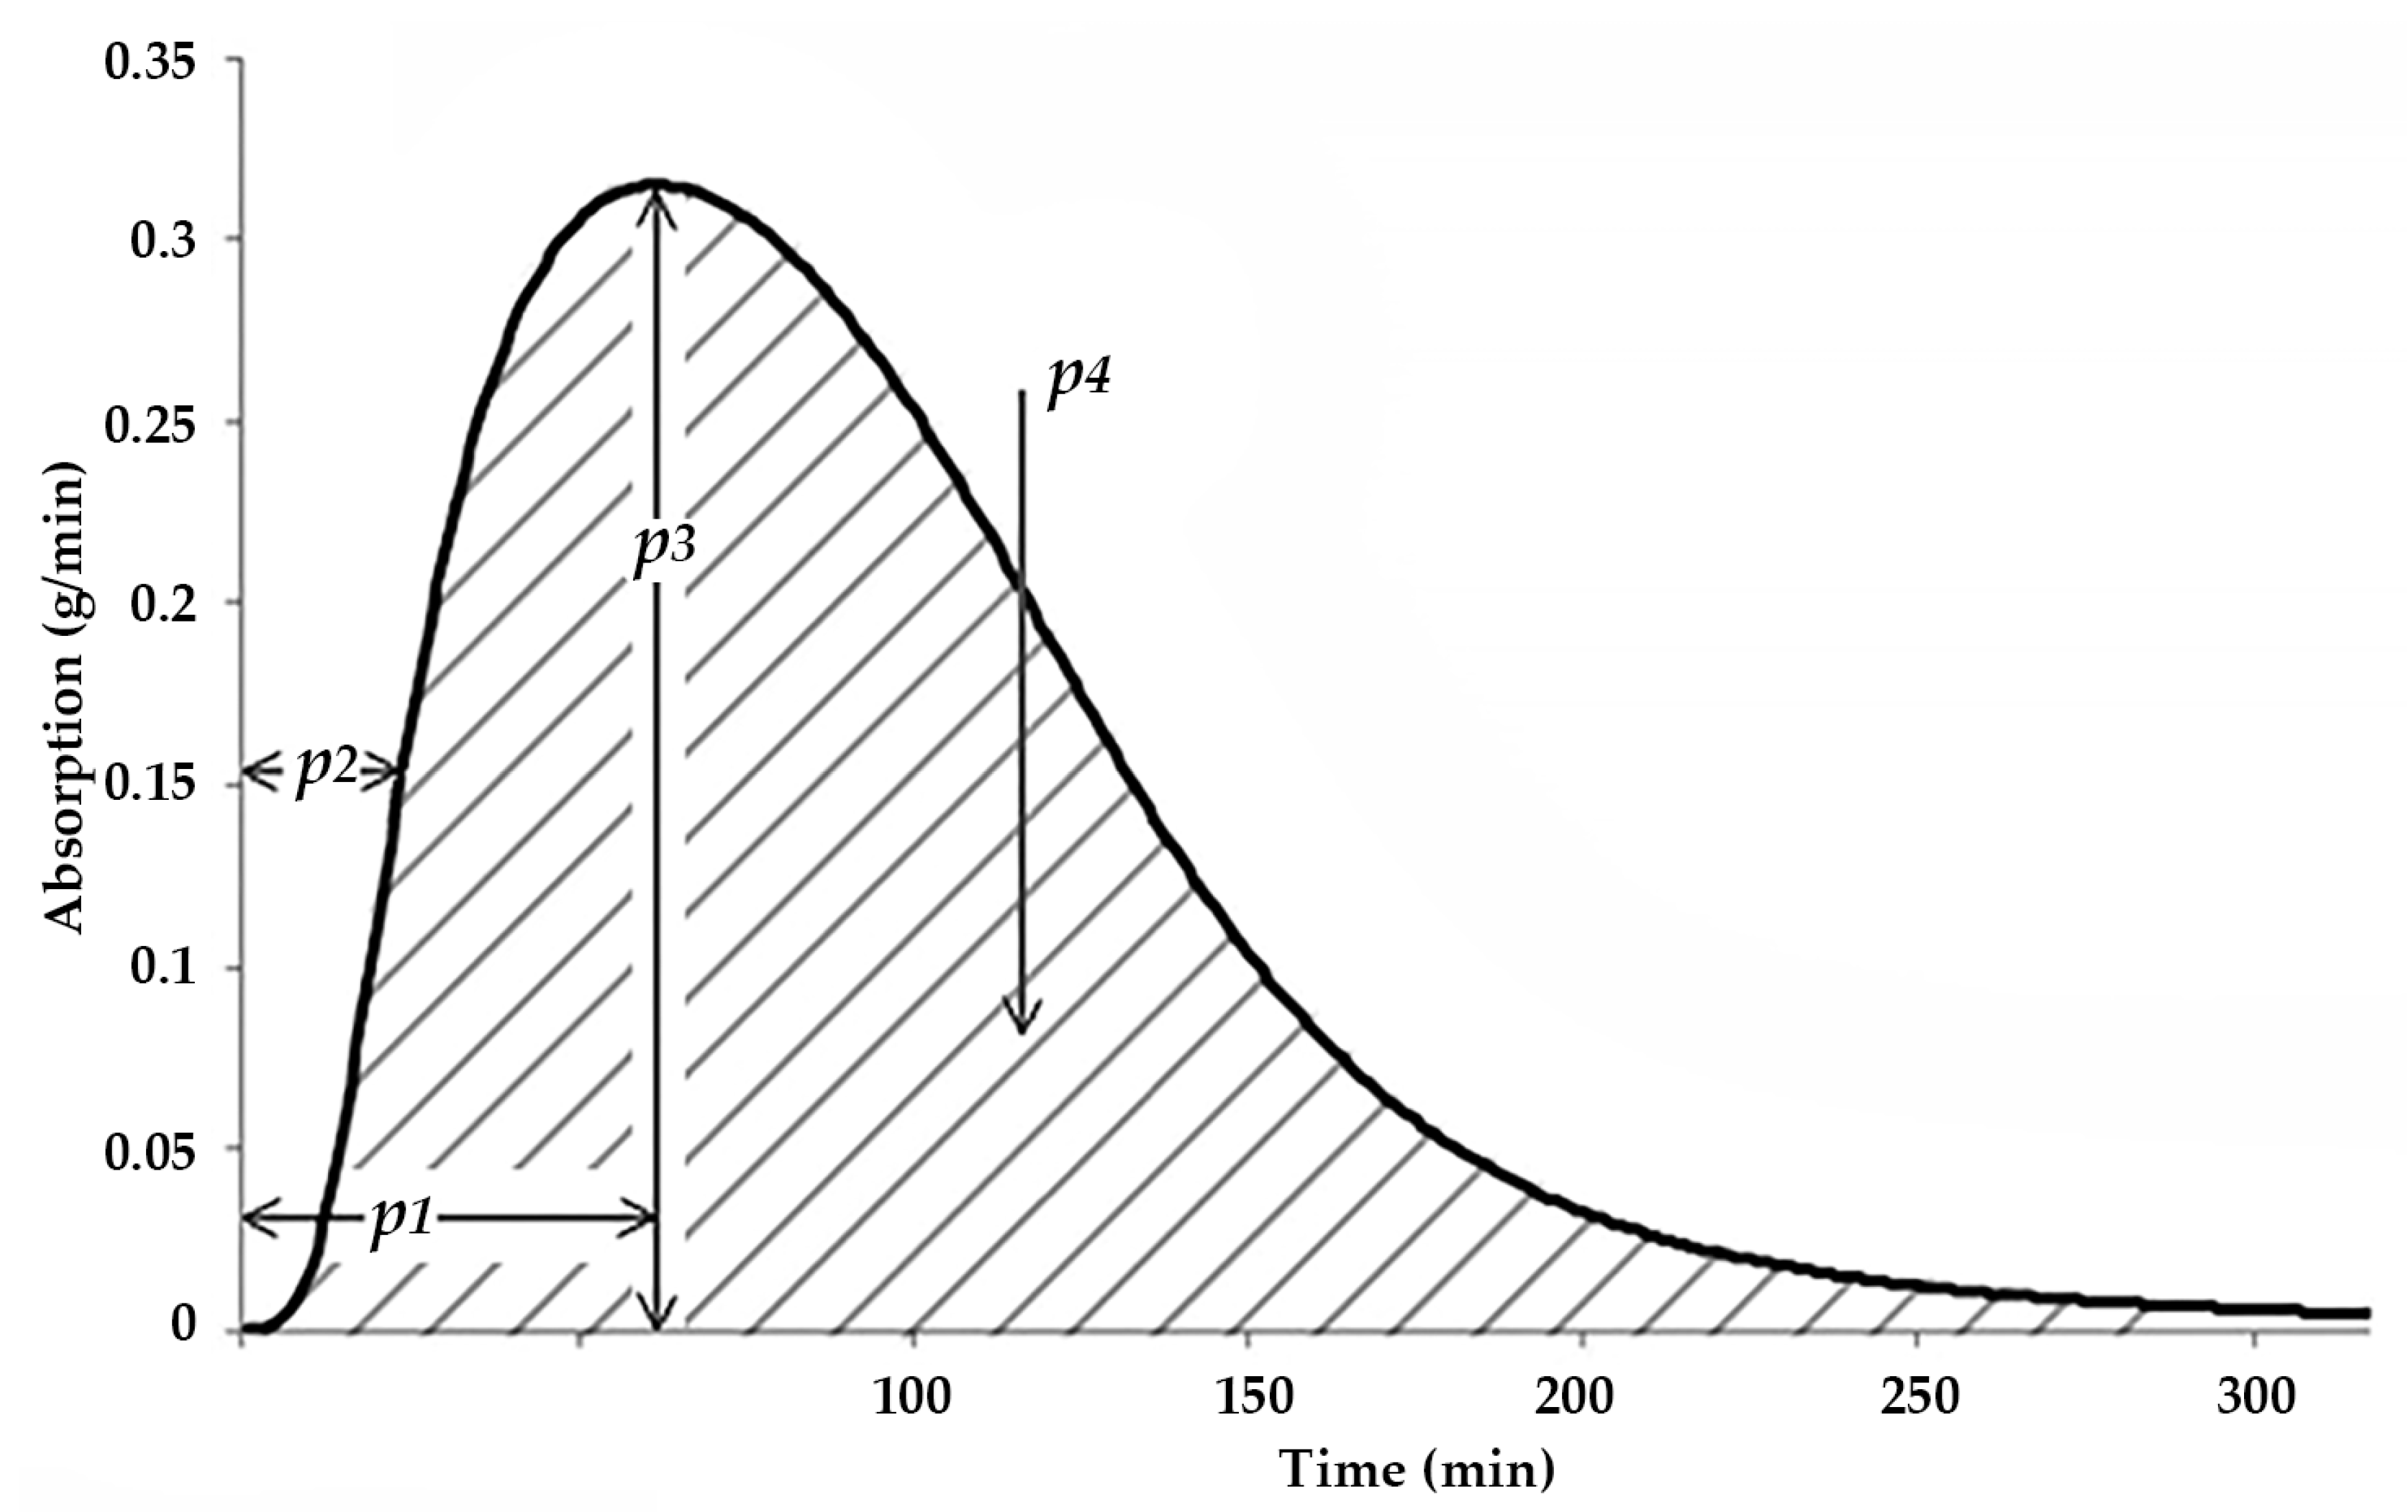
- The area under the whole absorption curve (AuC, p4 in Figure 3). This parameter is expected to describe the longer-term effect of the current meal;
- The time elapsed since the application of the last basal insulin injection (DfB). This parameter is expected to exert a smaller, but positive effect in all meals.
- BI: The applied bolus insulin dose, in [pmol/1000];
- SBGL: The startup BGL, in [mmol/L];
- MaxCH (p3 in Figure 3): The maximal rate of CH absorption, in [g/minute];
- AuC (p4 in Figure 3): The area under the absorption curve, in [g];
- DfB: The time elapsed since the last basal insulin, in [minute/100].
2.3. The Clinical Trial Protocol
2.4. Data Used for Training and Validation
2.5. Training and Validation Methods
- ‘AUC’ version: the TPeak parameter is used instead of the DfB parameter;
- ‘DFB’ version: the TPeak parameter is used instead of the AuC parameter.
2.6. Medical Devices and Data Processing Tools
3. Results
3.1. Accuracy Results of the Various Model Versions
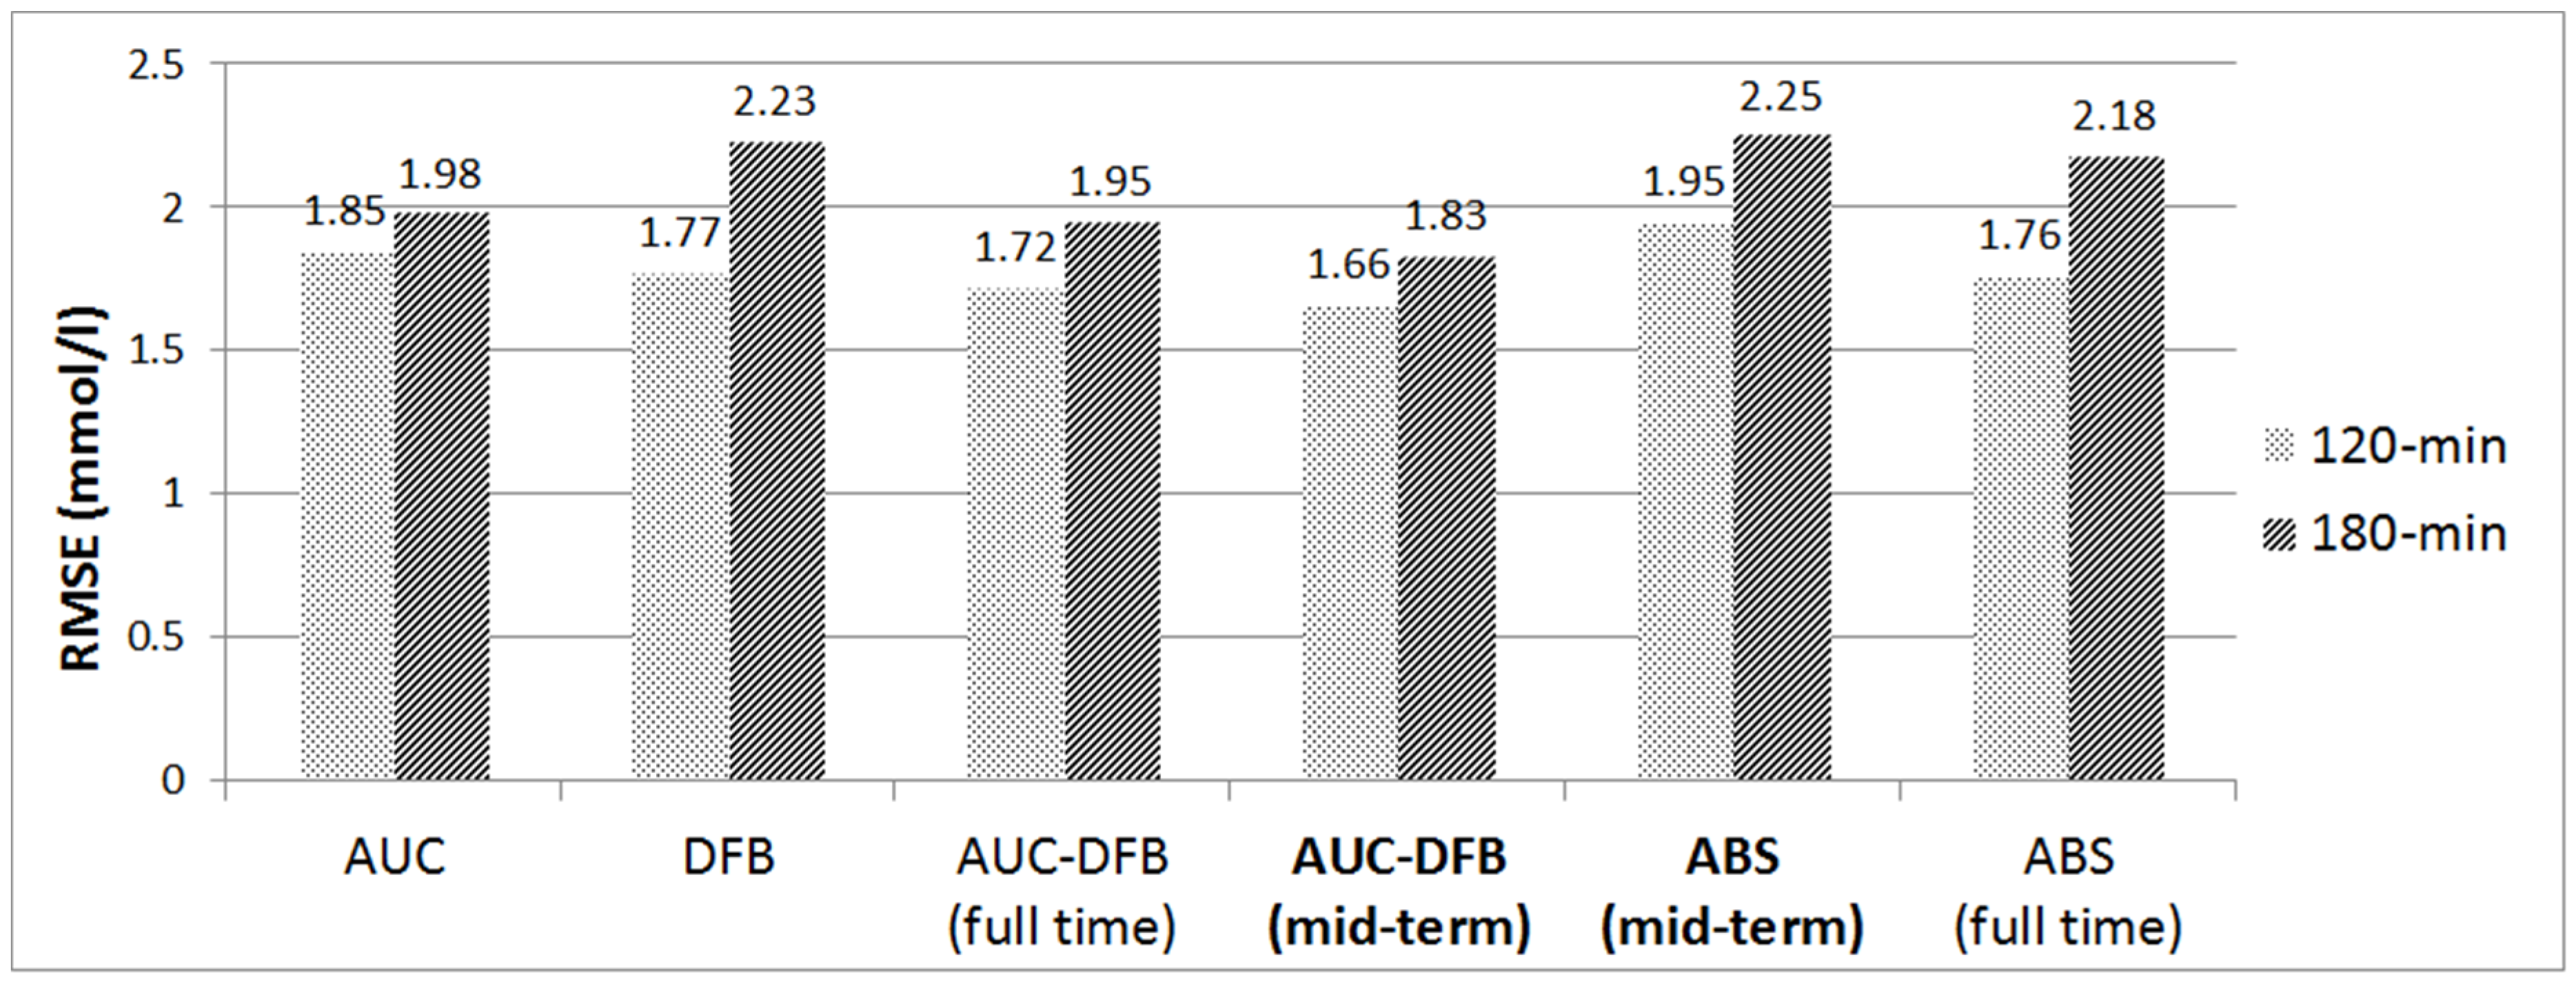
3.2. Performance of AUC-DFB Compared with the Pre-Study and the AUC/DFB Versions
3.3. Accuracy Results of Cross-Validation and with Limited Data Set Size
4. Discussion
4.1. Comparison of Model Training Versions
4.2. The Effect of Data Set Size and Selection
4.3. Clinical Significance of the Improvement
4.4. Comparison of the Results to Results Published by Others
- either the patient has to wear a CGM all the time (in which case the model can identify a typical BGL excursion in real time based on past CGM patterns);
- or the contents and daily scheduling of the patient’s meals must be very similar (in which case the model can assume that similarly scheduled BGL patterns will appear every day).
4.5. A Proposed Application Scenario
4.6. Limitations of the Study
5. Conclusions
Supplementary Materials
Author Contributions
Funding
Institutional Review Board Statement
Informed Consent Statement
Data Availability Statement
Acknowledgments
Conflicts of Interest
References
- Saeedi, P.; Petersohn, I.; Salpea, P.; Malanda, B.; Karuranga, S.; Unwin, N.; Colagiuri, S.; Guariguata, L.; Motala, A.A.; Ogurtsova, K.; et al. Global and Regional Diabetes Prevalence Estimates for 2019 and Projections for 2030 and 2045: Results from the International Diabetes Federation Diabetes Atlas, 9th Edition. Diabetes Res. Clin. Pract. 2019, 157, 107843. [Google Scholar] [CrossRef] [PubMed] [Green Version]
- Mobasseri, M.; Shirmohammadi, M.; Amiri, T.; Vahed, N.; Hosseini Fard, H.; Ghojazadeh, M. Prevalence and Incidence of Type 1 Diabetes in the World: A Systematic Review and Meta-Analysis. Health Promot. Perspect. 2020, 10, 98–115. [Google Scholar] [CrossRef] [PubMed]
- Barnett, A. Insulin Glargine in the Treatment of Type 1 and Type 2 Diabetes. Vasc. Health Risk Manag. 2006, 2, 59–67. [Google Scholar] [CrossRef] [PubMed] [Green Version]
- Adams, O.P. The Impact of Brief High-Intensity Exercise on Blood Glucose Levels. Diabetes Metab. Syndr. Obes. 2013, 6, 113–122. [Google Scholar] [CrossRef] [PubMed] [Green Version]
- Goetsch, V.L.; Wiebe, D.J.; Veltum, L.G.; van Dorsten, B. Stress and Blood Glucose in Type II Diabetes Mellitus. Behav. Res. Ther. 1990, 28, 531–537. [Google Scholar] [CrossRef]
- Nardacci, E.A.; Bode, B.W.; Hirsch, I.B. Individualizing Care for the Many. Diabetes Educ. 2010, 36 (Suppl. 1), 4S–19S. [Google Scholar] [CrossRef]
- Liu, C.; Vehí, J.; Avari, P.; Reddy, M.; Oliver, N.; Georgiou, P.; Herrero, P. Long-Term Glucose Forecasting Using a Physiological Model and Deconvolution of the Continuous Glucose Monitoring Signal. Sensors 2019, 19, 4338. [Google Scholar] [CrossRef] [Green Version]
- Frandes, M.; Timar, B.; Lungeanu, D. A Risk Based Neural Network Approach for Predictive Modeling of Blood Glucose Dynamics. Stud. Health Technol. Inform. 2016, 228, 577–581. [Google Scholar] [CrossRef]
- Zarkogianni, K.; Mitsis, K.; Litsa, E.; Arredondo, M.-T.; Ficο, G.; Fioravanti, A.; Nikita, K.S. Comparative Assessment of Glucose Prediction Models for Patients with Type 1 Diabetes Mellitus Applying Sensors for Glucose and Physical Activity Monitoring. Med. Biol. Eng. Comput. 2015, 53, 1333–1343. [Google Scholar] [CrossRef]
- Georga, E.I.; Protopappas, V.C.; Polyzos, D.; Fotiadis, D.I. Predictive Modeling of Glucose Metabolism Using Free-Living Data of Type 1 Diabetic Patients. In Proceedings of the 2010 Annual International Conference of the IEEE Engineering in Medicine and Biology, Buenos Aries, Argentina, 31 August–4 September 2010; IEEE: Piscataway, NJ, USA, 2010; pp. 589–592. [Google Scholar]
- Amar, Y.; Shilo, S.; Oron, T.; Amar, E.; Phillip, M.; Segal, E. Clinically Accurate Prediction of Glucose Levels in Patients with Type 1 Diabetes. Diabetes Technol. Ther. 2020, 22, 562–569. [Google Scholar] [CrossRef]
- Aliberti, A.; Pupillo, I.; Terna, S.; Macii, E.; Di Cataldo, S.; Patti, E.; Acquaviva, A. A Multi-Patient Data-Driven Approach to Blood Glucose Prediction. IEEE Access 2019, 7, 69311–69325. [Google Scholar] [CrossRef]
- De Bois, M.; El Yacoubi, M.A.; Ammi, M. Adversarial Multi-Source Transfer Learning in Healthcare: Application to Glucose Prediction for Diabetic People. Comput. Methods Programs Biomed. 2021, 199, 105874. [Google Scholar] [CrossRef]
- Kushner, T.; Breton, M.D.; Sankaranarayanan, S. Multi-Hour Blood Glucose Prediction in Type 1 Diabetes: A Patient-Specific Approach Using Shallow Neural Network Models. Diabetes Technol. Ther. 2020, 22, 883–891. [Google Scholar] [CrossRef]
- Wang, Y.; Wang, T. Application of Improved LightGBM Model in Blood Glucose Prediction. Appl. Sci. 2020, 10, 3227. [Google Scholar] [CrossRef]
- Woldaregay, A.Z.; Årsand, E.; Walderhaug, S.; Albers, D.; Mamykina, L.; Botsis, T.; Hartvigsen, G. Data-Driven Modeling and Prediction of Blood Glucose Dynamics: Machine Learning Applications in Type 1 Diabetes. Artif. Intell. Med. 2019, 98, 109–134. [Google Scholar] [CrossRef]
- Ajmera, I.; Swat, M.; Laibe, C.; Le Novère, N.; Chelliah, V. The Impact of Mathematical Modeling on the Understanding of Diabetes and Related Complications. CPT Pharmacomet. Syst. Pharmacol. 2013, 2, e54. [Google Scholar] [CrossRef] [PubMed]
- Gyuk, P.; Vassanyi, I.; Kosa, I. Blood Glucose Level Prediction for Diabetics Based on Nutrition and Insulin Administration Logs Using Personalized Mathematical Models. J. Healthc. Eng. 2019, 2019, 8605206. [Google Scholar] [CrossRef]
- Montaser, E.; Díez, J.-L.; Rossetti, P.; Rashid, M.; Cinar, A.; Bondia, J. Seasonal Local Models for Glucose Prediction in Type 1 Diabetes. IEEE J. Biomed. Health Inform. 2020, 24, 2064–2072. [Google Scholar] [CrossRef] [PubMed]
- Mathiyazhagan, N.; Schechter, H.B. Soft Computing Approach for Predictive Blood Glucose Management Using a Fuzzy Neural Network. In 2014 IEEE Conference on Norbert Wiener in the 21st Century: Driving Technology’s Future, 21CW 2014—Incorporating the Proceedings of the 2014 North American Fuzzy Information Processing Society Conference, NAFIPS 2014, Conference Proceedings; IEEE: Piscataway, NJ, USA, 2014; pp. 1–3. [Google Scholar] [CrossRef]
- Karim, R.A.H.; Vassányi, I.; Kósa, I. After-Meal Blood Glucose Level Prediction Using an Absorption Model for Neural Network Training. Comput. Biol. Med. 2020, 125, 103956. [Google Scholar] [CrossRef] [PubMed]
- Zarkogianni, K.; Mitsis, K.; Arredondo, M.-T.; Fico, G.; Fioravanti, A.; Nikita, K. Neuro-Fuzzy Based Glucose Prediction Model for Patients with Type 1 Diabetes Mellitus. In Proceedings of the IEEE-EMBS International Conference on Biomedical and Health Informatics (BHI), Valencia, Spain, 1–4 June 2014; IEEE: Piscataway, NJ, USA, 2014; pp. 252–255. [Google Scholar] [CrossRef]
- Finan, D.A.; Doyle, F.J.; Palerm, C.C.; Bevier, W.C.; Zisser, H.C.; Jovanovič, L.; Seborg, D.E. Experimental Evaluation of a Recursive Model Identification Technique for Type 1 Diabetes. J. Diabetes Sci. Technol. 2009, 3, 1192–1202. [Google Scholar] [CrossRef] [Green Version]
- Nielsen, M.A. Neural Networks and Deep Learning; Determination Press: San Francisco, CA, USA, 2015; Volume 2018. [Google Scholar]
- Broyden, C.G. Quasi-Newton Methods and Their Application to Function Minimisation. Math. Comput. 1967, 21, 368–381. [Google Scholar] [CrossRef]
- Brent, R. Fast Training Algorithms. IEEE Trans. Neural Netw. 1991, 1991, 346–354. [Google Scholar] [CrossRef]
- Martin, P.; Barranquero, C.; Sanchez, J.; Gestoso, G.; Andres, J.A.; Refoyo, D.; Garcia, C.; Fernadez, A.; Lopez, R. OpenNN: Open Neural Network Library. Available online: https://www.opennn.net/ (accessed on 2 April 2019).
- Arleth, T. Optimisation and Test of a Diabetes Insulin Advisory System. Doctoral Dissertation, Aalborg University, Center for Model-based Medical Decision Support, Aalborg, Denmark, 2005. [Google Scholar]
- Arleth, T.; Andreassen, S.; Orsini-Federici, M.; Timi, A.; Massi-Benedetti, M. A Model of Glucose Absorption from Mixed Meals. IFAC Proc. Vol. 2000, 33, 307–312. [Google Scholar] [CrossRef]
- Alwosheel, A.; van Cranenburgh, S.; Chorus, C.G. Is Your Dataset Big Enough? Sample Size Requirements When Using Artificial Neural Networks for Discrete Choice Analysis. J. Choice Model. 2018, 28, 167–182. [Google Scholar] [CrossRef]
- Medtrum. Medtrum S7 EasySense® CGM System. Available online: https://www.medtrum.com/S7.html (accessed on 13 April 2020).
- MongoDB. MongoDB Database. Available online: https://www.mongodb.com (accessed on 10 April 2020).
- Kósa, I.; Vassányi, I.; Nemes, M.; Kálmánné, K.H.; Pinter, B.; Kohut, L. A Fast, Android Based Dietary Logging Application to Support the Life Change of Cardio-Metabolic Patients. In Global Telemedicine and eHealth Updates: Knowledge Resources; International Society for Telemedicine & eHealth: Grimbergen, Belgium, 2014; Volume 7, pp. 553–556. [Google Scholar]
- Gyuk, P.; Lorincz, T.; Karim, R.A.H.; Vassanyi, I. Diabetes Lifestyle Support with Improved Glycemia Prediction Algorithm. In Proceedings of the Seventh International Conference on eHealth, Telemedicine, and Social Medicine (eTELEMED 2015), Lisbon, Portugal, 22–27 February 2015; pp. 95–100. [Google Scholar]
- Shah, V.N.; Garg, S.K. Managing Diabetes in the Digital Age. Clin. Diabetes Endocrinol. 2015, 1, 16. [Google Scholar] [CrossRef] [Green Version]
- Sangave, N.A.; Aungst, T.D.; Patel, D.K. Smart Connected Insulin Pens, Caps, and Attachments: A Review of the Future of Diabetes Technology. Diabetes Spectr. 2019, 32, 378–384. [Google Scholar] [CrossRef]
| P01 | P02 | P03 | P04 | P05 | Sum | |
|---|---|---|---|---|---|---|
| Gender | Female | Female | Male | Female | Male | - |
| Age | 52 | 49 | 33 | 18 | 23 | - |
| Height | 169 | 175 | 160 | 183 | 197 | - |
| Weight | 77 | 133 | 50 | 97 | 82 | - |
| Diary long (days) | 24 | 23 | 15 | 12 | 15 | 89 |
| Number of meals | 29 | 43 | 26 | 34 | 35 | 167 |
| Breakfast | 8 | 16 | 7 | 10 | 7 | 48 |
| Lunch | 9 | 17 | 8 | 9 | 7 | 50 |
| Dinner | 6 | 10 | 5 | 11 | 8 | 40 |
| Other | 6 | 0 | 6 | 4 | 13 | 29 |
| Number of insulin injections | 38 | 62 | 35 | 44 | 45 | 224 |
| Number of CGM records | 3480 | 5160 | 3120 | 4080 | 4200 | 20,040 |
| Version | Parameters | ||||
|---|---|---|---|---|---|
| Pre-study (ABS) | BI | SBGL | MaxCH | TPeak | T50 |
| AUC | BI | SBGL | MaxCH | AuC | TPeak |
| DFB | BI | SBGL | MaxCH | TPeak | DfB |
| AUC-DFB | BI | SBGL | MaxCH | AuC | DfB |
| Patient | Figure of Merit | 60 min | 90 min | 120 min | 180 min |
|---|---|---|---|---|---|
| P01 | MAE | 1.892 | 1.895 | 1.985 | 2.595 |
| RMSE | 2.165 | 2.156 | 2.317 | 3.080 | |
| P02 | MAE | 0.939 | 1.098 | 1.105 | 1.320 |
| RMSE | 1.107 | 1.338 | 1.398 | 1.542 | |
| P03 | MAE | 1.181 | 1.366 | 1.645 | 1.621 |
| RMSE | 1.761 | 1.950 | 2.164 | 2.246 | |
| P04 | MAE | 1.050 | 1.048 | 1.058 | 1.132 |
| RMSE | 1.171 | 1.193 | 1.241 | 1.449 | |
| P05 | MAE | 1.127 | 1.280 | 1.359 | 1.402 |
| RMSE | 1.499 | 1.717 | 1.756 | 1.789 | |
| All datasets | MAE | 1.201 | 1.304 | 1.470 | 1.562 |
| RMSE | 1.486 | 1.624 | 1.718 | 1.946 |
| Patient | Figure of Merit | 60 min | 120 min | 180 min |
|---|---|---|---|---|
| P01 | MAE | 1.844 | 2.074 | 2.681 |
| RMSE | 2.048 | 2.479 | 3.152 | |
| P02 | MAE | 0.825 | 1.233 | 1.325 |
| RMSE | 1.031 | 1.521 | 1.609 | |
| P03 | MAE | 1.128 | 1.914 | 1.548 |
| RMSE | 1.624 | 2.445 | 2.256 | |
| P04 | MAE | 0.888 | 0.990 | 1.217 |
| RMSE | 1.036 | 1.228 | 1.419 | |
| P05 | MAE | 1.094 | 1.534 | 1.433 |
| RMSE | 1.456 | 1.908 | 1.839 | |
| All datasets | MAE | 1.116 | 1.579 | 1.591 |
| RMSE | 1.388 | 1.850 | 1.981 |
| Patient | Figure of Merit | 60 min | 120 min | 180 min |
|---|---|---|---|---|
| P01 | MAE | 1.718 | 2.067 | 2.602 |
| RMSE | 1.954 | 2.432 | 3.415 | |
| P02 | MAE | 0.842 | 1.170 | 1.434 |
| RMSE | 1.038 | 1.413 | 1.805 | |
| P03 | MAE | 1.078 | 1.643 | 2.023 |
| RMSE | 1.604 | 2.243 | 2.594 | |
| P04 | MAE | 0.747 | 1.026 | 1.383 |
| RMSE | 0.891 | 1.286 | 1.655 | |
| P05 | MAE | 1.059 | 1.465 | 1.607 |
| RMSE | 1.363 | 1.806 | 2.103 | |
| All datasets | MAE | 1.055 | 1.505 | 1.750 |
| RMSE | 1.321 | 1.773 | 2.233 |
| AUC-DFB | Pre-Study (ABS) | Diff. Value | % | t-Test | |
|---|---|---|---|---|---|
| 60 min | 1.486 | 1.12 | −0.366 | −32.69% | p = 0.0332 |
| 120 min | 1.718 | 1.76 | 0.037 | 2.14% | p = 0.0524 |
| 180 min | 1.946 | 2.18 | 0.23 | 10.59% | p = 0.0033 |
| AUC-DFB | Pre-Study (ABS) | Diff. Value | % | t-Test | |
|---|---|---|---|---|---|
| 60 to 120 min | 1.655 | 1.947 | 0.292 | 14.99% | p = 0.0272 |
| 120 to 180 min | 1.827 | 2.253 | 0.426 | 18.89% | p = 0.0147 |
| Prediction Horizon | ||||||||
|---|---|---|---|---|---|---|---|---|
| 60 min | 120 min | 180 min | ||||||
| MAE | RMSE | MAE | RMSE | MAE | RMSE | |||
| AUC-DFB Compared to | DFB | Diff. value | −0.147 | −0.164 | 0.035 | 0.055 | 0.187 | 0.288 |
| % | −13.89% | −12.42% | 2.30% | 3.13% | 10.72% | 12.88% | ||
| AUC | Diff. value | −0.086 | −0.097 | 0.108 | 0.133 | 0.029 | 0.036 | |
| % | −7.67% | −7.00% | 6.87% | 7.17% | 1.82% | 1.80% | ||
| DFB Compared to | AUC | Diff. value | 0.061 | 0.067 | 0.074 | 0.077 | −0.158 | −0.252 |
| % | 5.46% | 4.82% | 4.67% | 4.17% | −9.96% | −12.73% | ||
| Prediction Horizon | ||||
|---|---|---|---|---|
| 120 min | 180 min | |||
| MAE | RMSE | MAE | RMSE | |
| AUC-DFB (V1) | 1.47 | 1.718 | 1.562 | 1.946 |
| V2 | 1.519 | 1.731 | 1.506 | 2.092 |
| V3 | 1.408 | 1.702 | 1.603 | 2.014 |
Publisher’s Note: MDPI stays neutral with regard to jurisdictional claims in published maps and institutional affiliations. |
© 2021 by the authors. Licensee MDPI, Basel, Switzerland. This article is an open access article distributed under the terms and conditions of the Creative Commons Attribution (CC BY) license (https://creativecommons.org/licenses/by/4.0/).
Share and Cite
Karim, R.A.H.; Vassányi, I.; Kósa, I. Improved Methods for Mid-Term Blood Glucose Level Prediction Using Dietary and Insulin Logs. Medicina 2021, 57, 676. https://doi.org/10.3390/medicina57070676
Karim RAH, Vassányi I, Kósa I. Improved Methods for Mid-Term Blood Glucose Level Prediction Using Dietary and Insulin Logs. Medicina. 2021; 57(7):676. https://doi.org/10.3390/medicina57070676
Chicago/Turabian StyleKarim, Rebaz A. H., István Vassányi, and István Kósa. 2021. "Improved Methods for Mid-Term Blood Glucose Level Prediction Using Dietary and Insulin Logs" Medicina 57, no. 7: 676. https://doi.org/10.3390/medicina57070676
APA StyleKarim, R. A. H., Vassányi, I., & Kósa, I. (2021). Improved Methods for Mid-Term Blood Glucose Level Prediction Using Dietary and Insulin Logs. Medicina, 57(7), 676. https://doi.org/10.3390/medicina57070676