Article

Effects of Quercetin-Loaded Nanoparticles on MCF-7 Human Breast Cancer Cells

by
Firoozeh Niazvand
1,2,
Mahmoud Orazizadeh
1,2,
Layasadat Khorsandi
1,2,*,
Mohammadreza Abbaspour
3,
Esrafil Mansouri
1,2 and
Ali Khodadadi
4,5
1
Cellular and Molecular Research Center, Ahvaz Jundishapur University of Medical Sciences, Ahvaz, Iran
2
Department of Anatomical Sciences, Faculty of Medicine, Ahvaz Jundishapur University of Medical Sciences, Ahvaz, Iran
3
Targeted Drug Delivery Research Center, School of Pharmacy, Mashhad University of Medical Sciences, Mashhad, Iran
4
Cancer Research Center, Ahvaz Jundishapur University of Medical Sciences, Ahvaz, Iran
5
Department of Immunology, Faculty of Medicine, Ahvaz Jundishapur University of Medical Sciences, Ahvaz, Iran
*
Author to whom correspondence should be addressed.
Medicina 2019, 55(4), 114; https://doi.org/10.3390/medicina55040114
Submission received: 23 January 2019 / Revised: 15 February 2019 / Accepted: 16 April 2019 / Published: 22 April 2019

Abstract

:
Background and objectives: Previous studies have shown anti-tumor activity of quercetin (QT). However, the low bioavailability of QT has restricted its use. This study aimed to assess the toxic effect of QT encapsulated in solid lipid nanoparticles (QT-SLNs) on the growth of MCF-7 human breast cancer cells. Materials and Methods: MCF-7 and MCF-10A (non-tumorigenic cell line) cell lines treated with 25 µmol/mL of QT or QT-SLNs for 48 h. Cell viability, colony formation, oxidative stress, and apoptosis were evaluated to determine the toxic effects of the QT-SLNs. Results: The QT-SLNs with appropriate characteristics (particle size of 85.5 nm, a zeta potential of −22.5 and encapsulation efficiency of 97.6%) were prepared. The QT-SLNs showed sustained QT release until 48 h. Cytotoxicity assessments indicated that QT-SLNs inhibited MCF-7 cells growth with a low IC50 (50% inhibitory concentration) value, compared to the free QT. QT-SLNs induced a significant decrease in the viability and proliferation of MCF-7 cells, compared to the free QT. QT-SLN significantly increased reactive oxygen species (ROS) level and MDA contents and significantly decreased antioxidant enzyme activity in the MCF-7 cells. Following QT-SLNs treatment, the expression of the Bcl-2 protein significantly decreased, whereas Bx expression showed a significant increase in comparison with free QT-treated cells. Furthermore, The QT-SLNs significantly increased apoptotic and necrotic indexes in MCF-7 cells. Viability, proliferation, oxidative stress and apoptosis of MCF-10A cells were not affected by QT or QT-SLNs. Conclusions: According to the results of this study, SLN significantly enhanced the toxic effect of QT against human breast cancer cells.

1. Introduction

Breast cancer is one of the most diagnosed cancers worldwide. There are several types of therapy for breast cancer, such as radiotherapy and chemotherapy. However, these therapies have several side effects on healthy cells [1,2,3]. Recently, many studies have focused on finding new drugs to treat breast cancer [4,5,6,7]. Some phyto-bioactive compounds act as pro-oxidants that cause reactive oxygen species (ROS) in cancer cells [8,9]. Oxidative stress can alter signaling pathways, damages the DNA, and affect progress various cancers, such as colon, prostate, lung, ovary, and breast [10]. Superoxide dismutase (SOD) and Catalase (CAT) are major enzymatic antioxidants involved neutralize ROS in cancer cells [11].
Quercetin (QT), a powerful flavonoid, is found in onion, red grapes, lettuce, tomato, olive oil, tea, coffee, bracken fern, and citrus fruits [12]. QT has toxic effects on many types of cancer cells [13,14,15]. However, poor solubility and low bioavailability of QT have limited its therapeutic applications [15,16,17]. Several drug delivery systems, such as polymeric nanoparticles, solid lipid nanoparticles (SLNs), liposomes, and micelles, have examined to increase the bioavailability of anticancer agents [18,19,20,21].
Recently, the conjugates of bioflavonoids and nanoparticles have studied for targeted drug delivery systems [22,23]. However, the safety of these nanoparticles is highly controversial [24,25,26].
In recent years, SLNs have extensively used as a carrier for various anticancer drugs and phyto-bioactive compounds [21,27]. For example, Tamoxifen-loaded SLNs suppress breast tumors in rats [25], and pomegranate extract-loaded SLNs effectively prevent the proliferation of various cancer cells such as PC-3, MCF-7 and HepG2 [28]. The SLNs have a high drug-loading capacity, increase the blood circulation time, modulate release kinetic, increase the therapeutic efficacy of anticancer drugs, and protects the encapsulated compound from chemical degradation [29,30,31].
Until now, the anticancer effects of various natural phyto-bioactive compounds loaded with SLNs have been investigated in several studies [32,33,34], but less attention has been paid to their cell death mechanism. The major problem of cancer therapy is the ability of cancer cells to evade apoptosis, resulting in resistance to treatment. Therefore, developing new therapeutic agents to overcome treatment resistance is of paramount importance. This study aimed to investigate the cytotoxic and apoptotic effects of QT-SLNs on MCF-7 cell line.

2. Materials and Methods

2.1. Preparation of QT-SLNs

The SLNs of QT were prepared using Compritol (as lipid, Gattefossé, Saint-Priest, France) and Tween 80 (as a surfactant) through a microemulsification technique [35,36]. Briefly, Compritol was heated to 70–75 °C, and 50 mg of QT (Sigma-Aldrich, St. Louis, MO, USA) was added to the molten lipid. Six mL of water and Tween 80 were mixed separately and heated to 70–75 °C. Then, the two solutions were mixed and stirred to produce a clear homogenous microemulsion. The homogenized microemulsion was added to the 100 mL of cold water and stirred (40 min) to get a fine dispersion of the SLNs. The QT-SLNs suspension was stored at 4 °C. Different formulations of QT-SLNs based on lipid-drug ratios were prepared (Table 1).

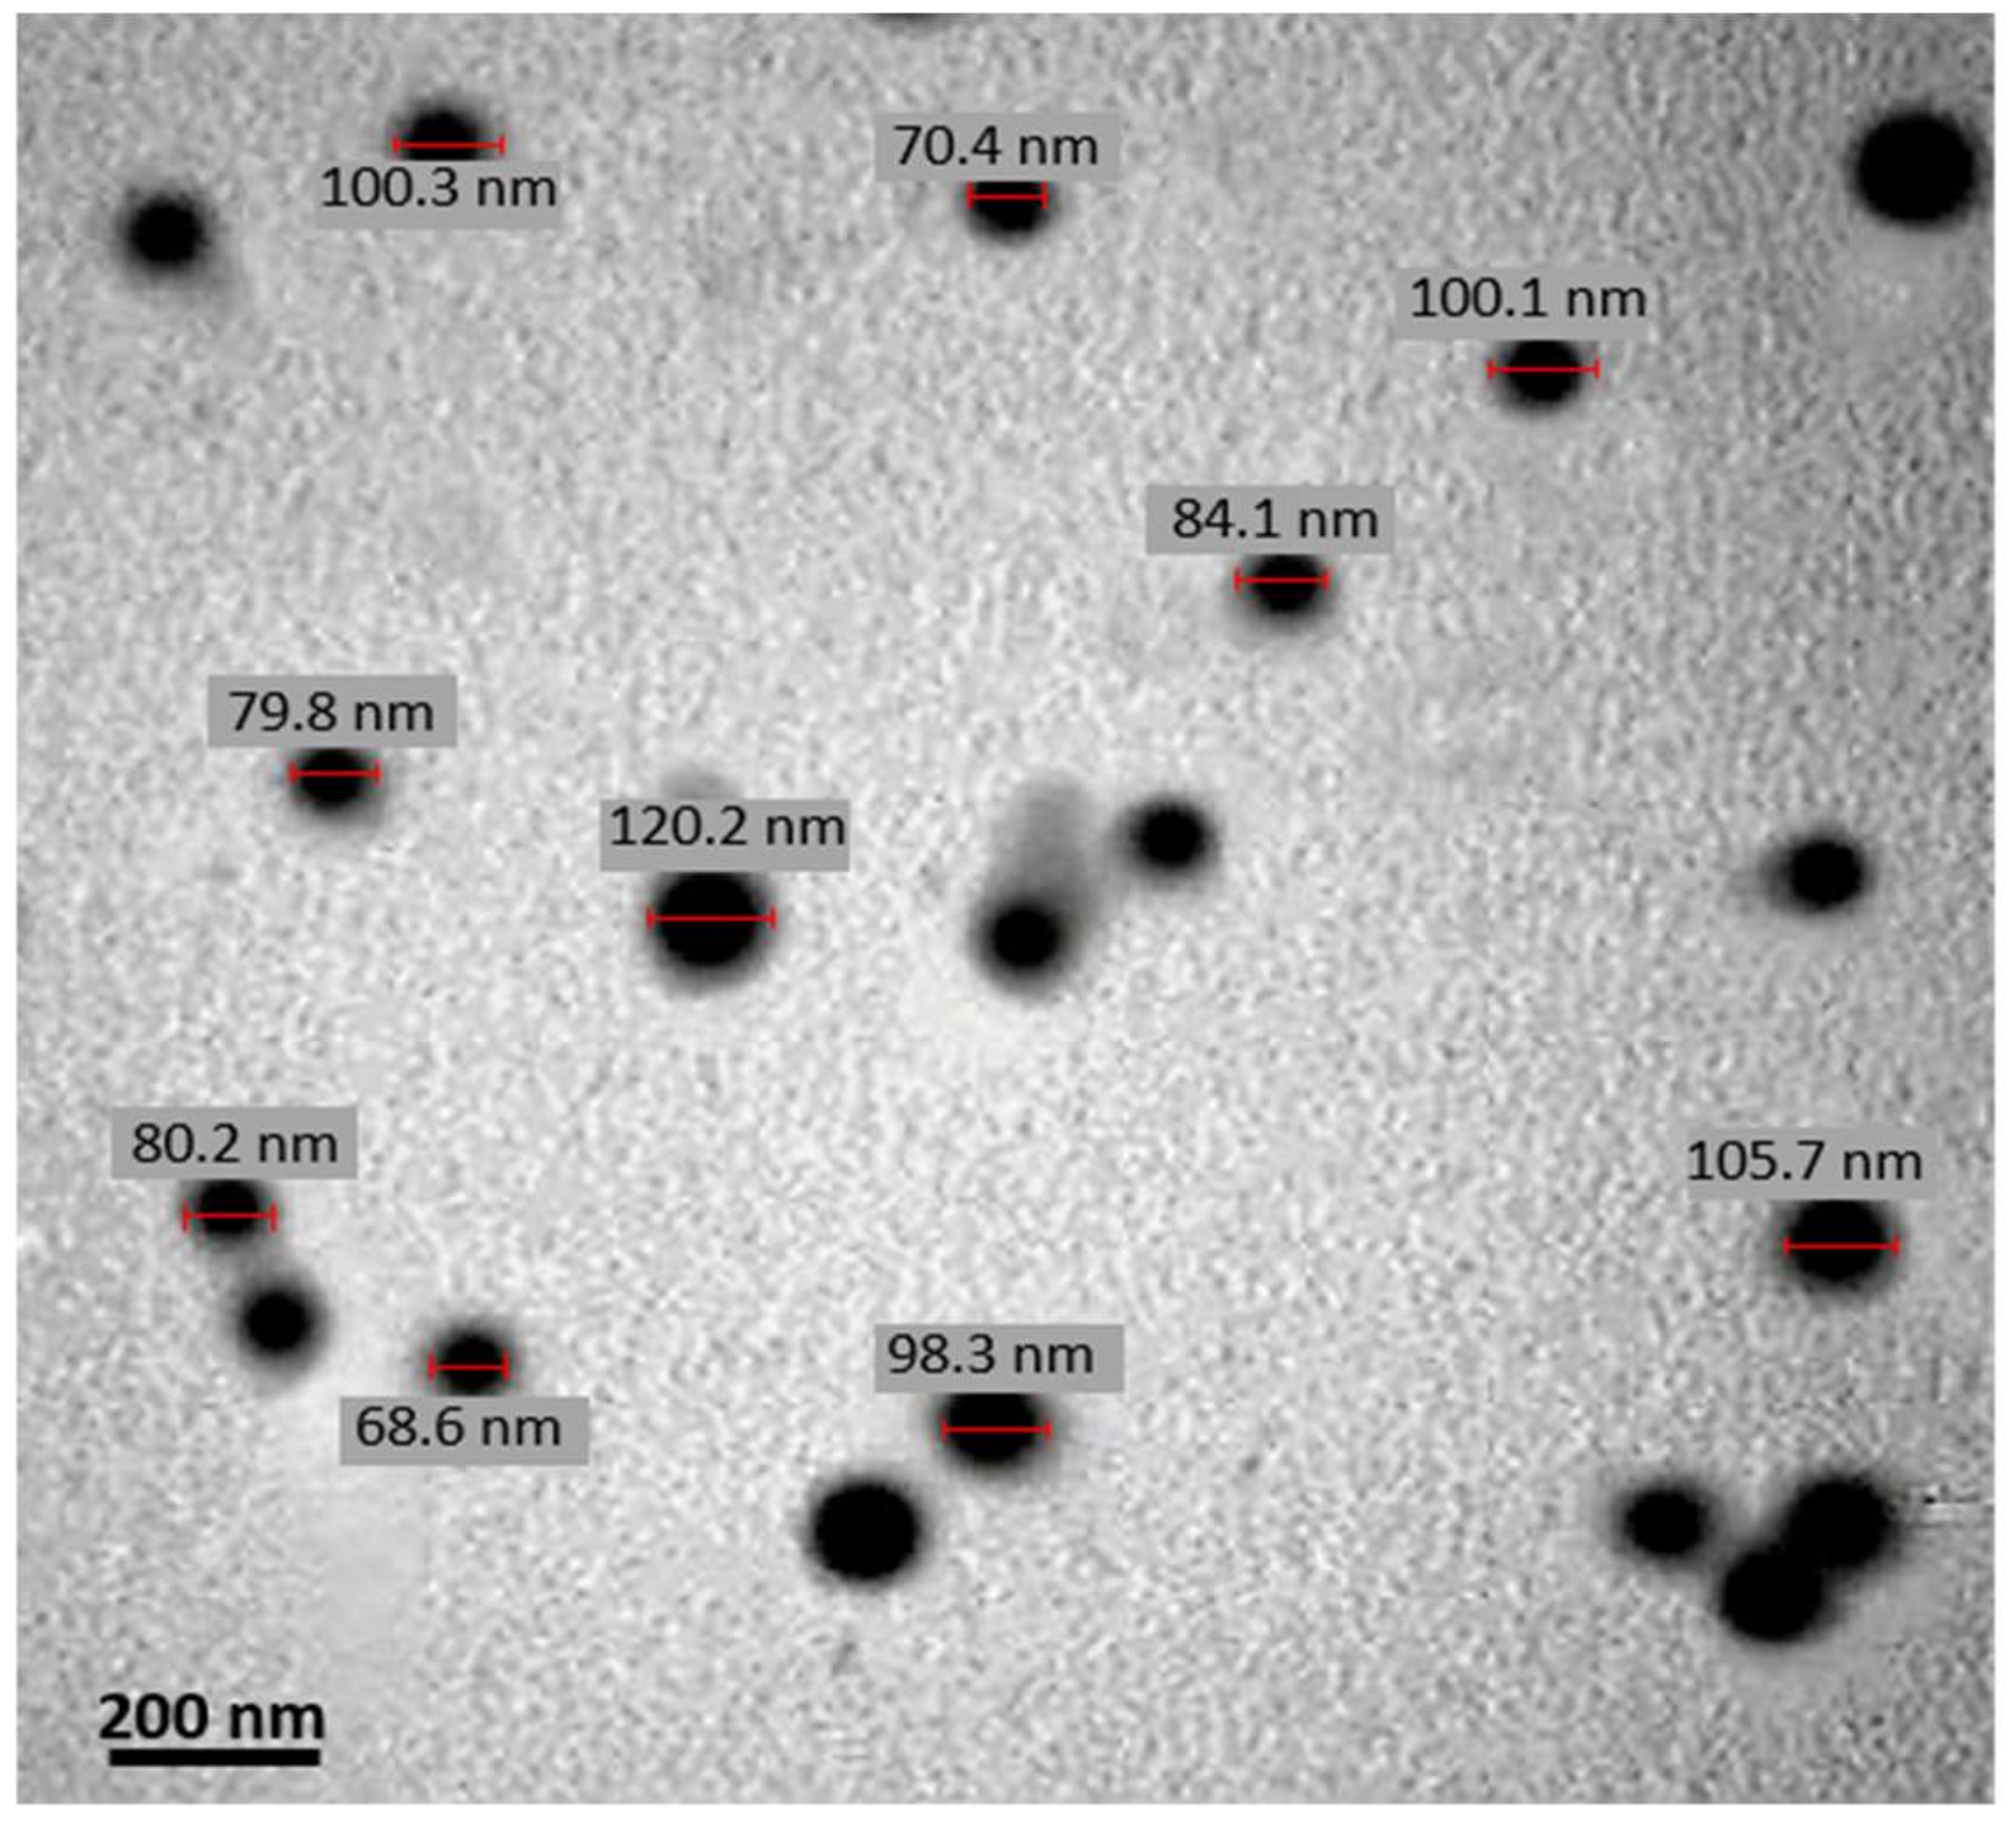
2.2. Particle Size and Zeta Potential of QT-SLNs

The average particle size distribution, polydispersity index (PDI), and zeta potential of the QT-loaded SLNs were assessed using dynamic light scattering (DLS) method by a Zetasizer-Nano-ZSP (Malvern, UK). The particle morphology was also evaluated by a transmission electron microscope (TEM) (JEOL Ltd., Tokyo, Japan).

2.3. Drug Entrapment Efficiency

The prepared QT-loaded SLNs were centrifuged at 14,000 rpm for 7 min to separate non-entrapped QT. The supernatant was analyzed spectrophotometrically at 256 nm (UV 1700, Shimadzu, Kyoto, Japan) for detection of the QT amounts. Encapsulation efficiency (EE) was calculated using the following formula [36,37].
%   EE   = Amount   of   drug   added - Amount   of   drug   in   the   supernatant Amount   of   drug   added ×   100
To determine the drug loading (DL), 50 mg QT powder was extracted by using absolute methanol. The QT extracted was then diluted up to 10 mL, and QT contents of the solution were analyzed spectrophotometrically at 256 nm. The DL percentage was calculated using the following formula [37].
%   DL   =   Weight   of   initial   drug -   Weight   of   free   drug Weight   of   lipid   ×   100

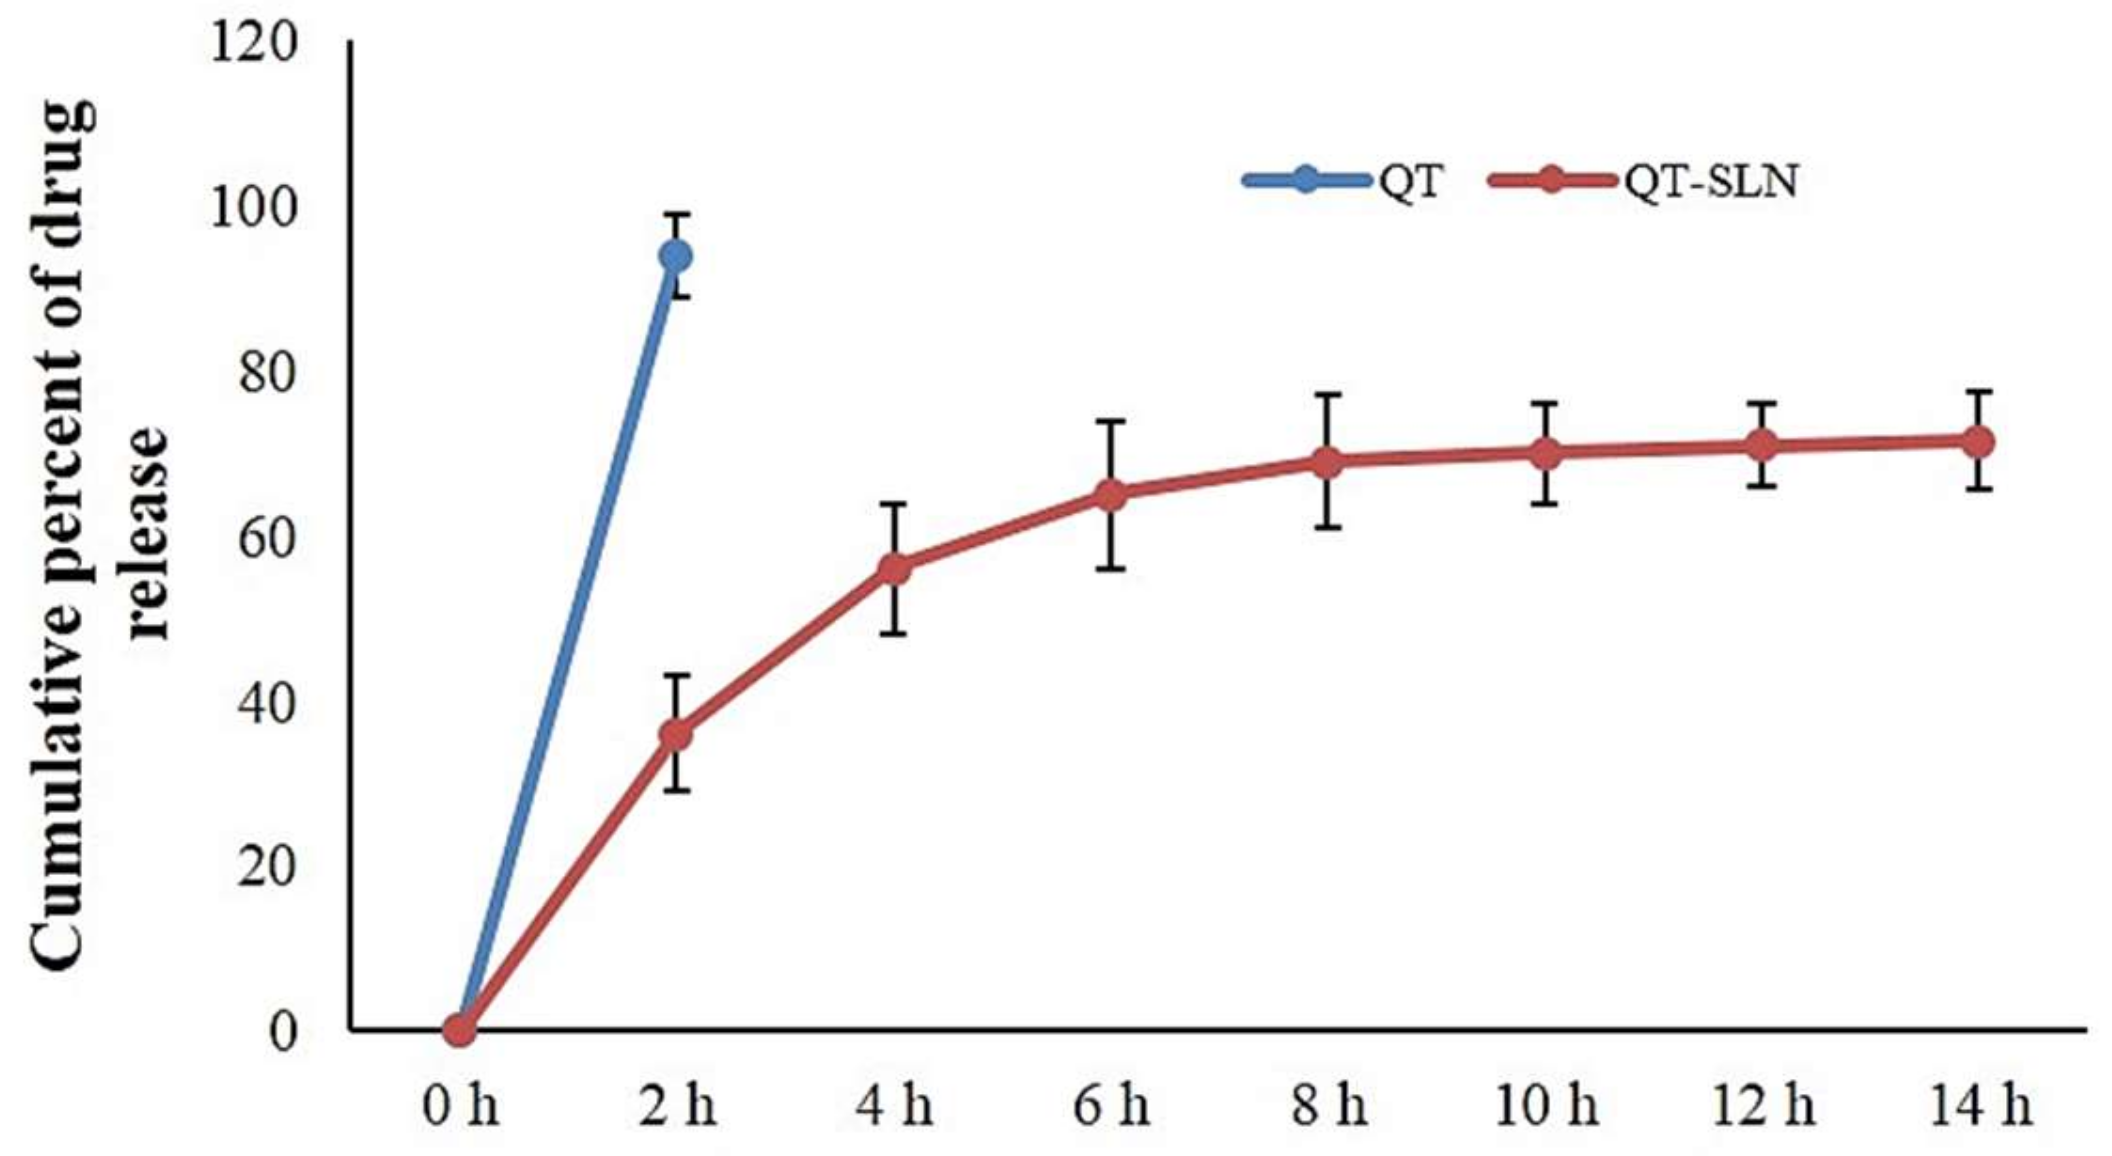
2.4. In Vitro Drug Release

QT release from SLNs was measured using the dialysis bag method, as previously described [36,37]. An accurately weighed amount of QT-loaded SLN dispersions containing the drug equivalent to 3 mg was poured into a dialysis bag (Viskase, Lombard, IL, USA). The dialysis bag retains nanoparticles and allows the diffusion of the free drug into dissolution media (PBS at pH: 7.4). At predetermined time intervals, samples were withdrawn and analyzed spectrophotometrically (UV 1700, Shimadzu, Japan) at 256 nm. The following formula was used to calculate the percentage of drug release [36].
% Drug   released   = Released   QT Total   QT   ×   100

2.5. Experimental Design

The human MCF-7 and MCF-10A cell lines were purchased from the National Center for Genetic and Biological Reserves in Iran and cultured in DMEM/F12 medium supplemented with 10% FBS, streptomycin (100 U/mL) and penicillin (100 mg/mL). The cells were maintained in a humidified atmosphere of 5% CO2 at 37 °C. The cells were categorized into four groups as follows:
  • Control: received only media
  • Blank SLN: exposed to 25 µmol/mL of SLN without QT
  • QT: treated by 25 µmol/mL of QT
  • QT-SLN: treated with 25 µmol/mL of QT-SLNs
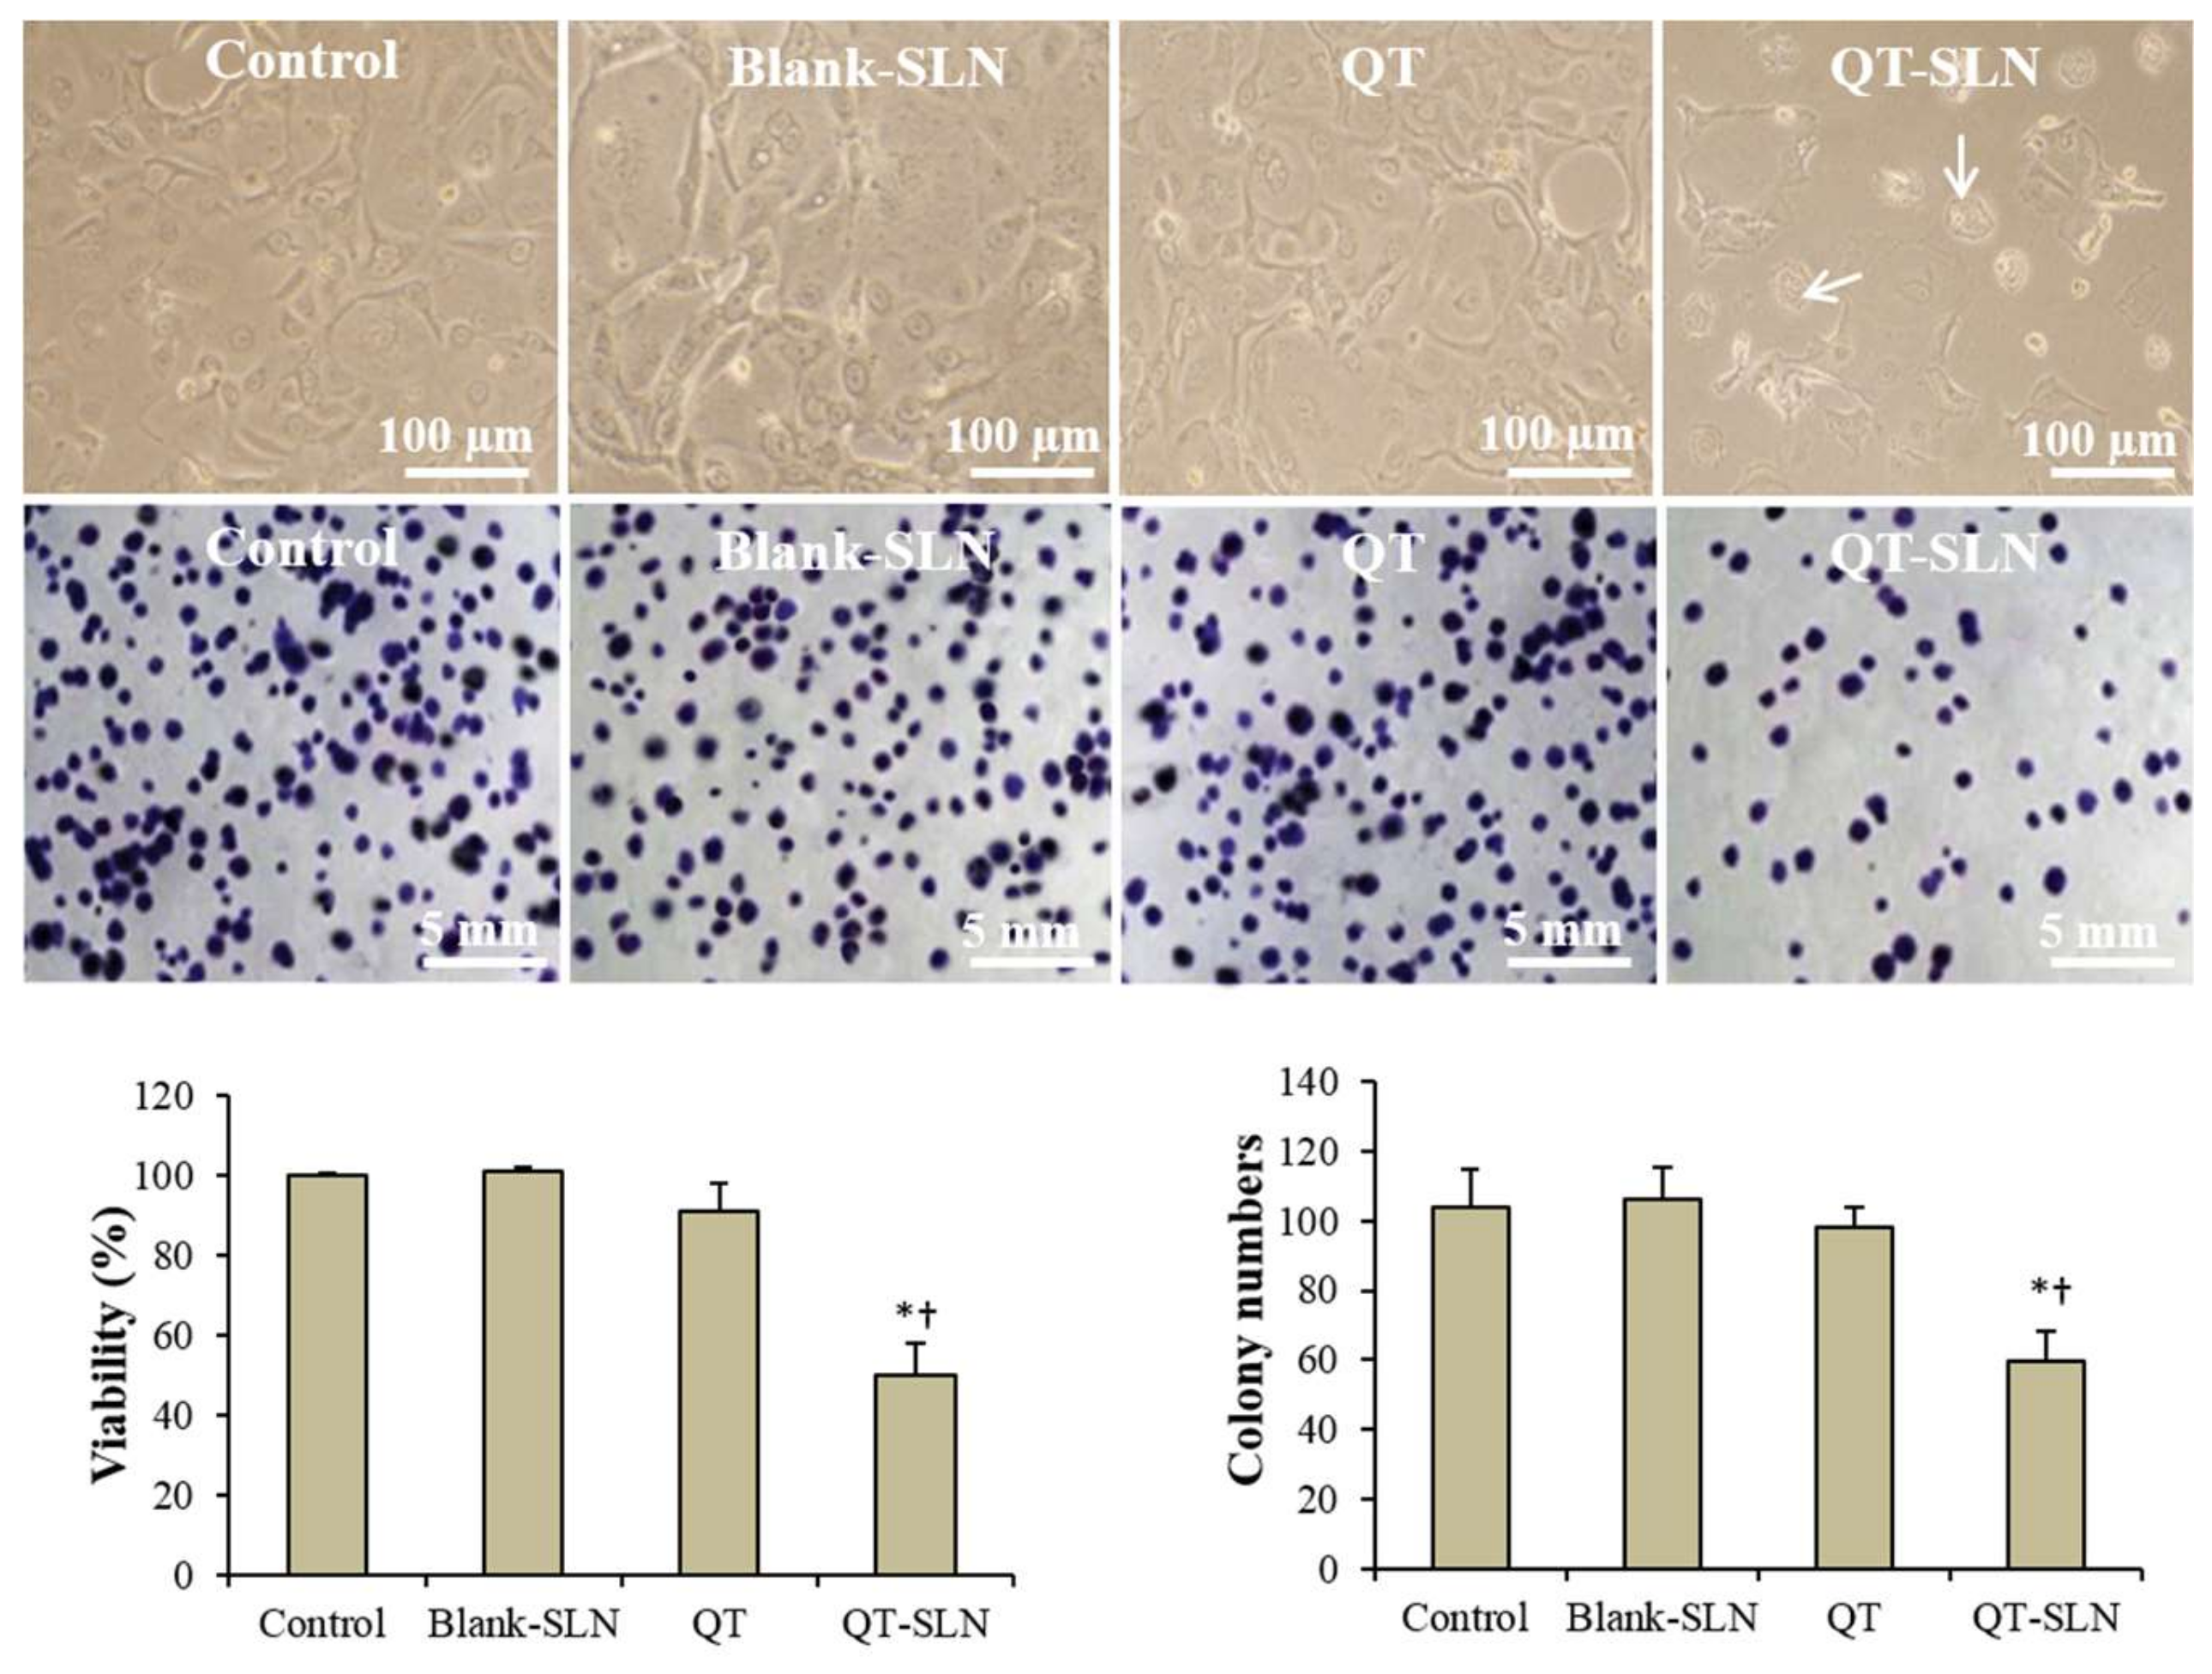
The Ethics committee of the Ahvaz Jundishapur University of Medical Sciences approved this study (approved number: IR.AJUMS.REC.1394.9418). The dose and exposure time of QT and QT-SLNs were selected based on 50% inhibitory concentration (IC50) value (Table 2). The MCF-7 and MCF-10A cells were treated with IC50 concentrations of QT-SLNs. QT was dissolved in 1% Dimethyl sulfoxide (DMSO) and diluted in culture medium. To evaluate the safety of the DMSO, the MCF-7 and MCF-10A cells were treated with QT (40 µM) or 1% DMSO for 48 h, and the MTT assay was performed. DMSO had no significant effect on the viability of the MCF-7 and MCF-10A cells (Supplementary Table S1).

2.6. Cell Viability

MTT assay was used to compare the effect of QT-SLNs with QT on cell viability. Briefly, MCF-7 and MCF-10A cells (1 × 10⁴ cells/well) were cultured in 96-well plates. After treatment, the MTT solution at a concentration of 0.5 mg/mL was added to each well and maintained at 37 °C for 4 h. After removing the supernatants, 100 µL of DMSO was added to each well. Using a microplate reader (BioRad, Hercules, CA, USA), absorbance at 570 nm was measured. To determine the toxic effect of QT-SLNs on the MCF-7 cells, IC50 values were measured by MTT assay, as previously described [38]. The IC50 values were calculated using SigmaPlot software.

2.7. Clonogenicity Assay

The anti-proliferative effect of QT or QT-SLNs on MCF-7 and MCF-10A cells was measured by a colony formation assessment [39]. Briefly, 3000 cells seeded into 6-well plates and treated with QT or QT-SLNs for 48 h. Afterward, the cells were washed and further incubated with complete medium (DMEM + 10% FBS + 1% pen/strep) for 10 days. Following this, the cells were stained with 0.1% crystal violet in PBS, and the colonies counted under a light microscope (Leica, Wetzlar, Germany).

2.8. Annexin V-FITC/Propidium Iodide Apoptosis Assay

MCF-7 and MCF-10A cells (1 × 10⁵) were cultured in a six-well plate and treated with QT or QT-SLN for 48 h. After treatment, normal, apoptotic and necrotic cells were determined using the Annexin V-FITC/propidium iodide assay kit (V13242, Invitrogen, Carlsbad, CA, USA) according to the manufacturer’s protocol. The cells were trypsinized and centrifuged at 1000 rpm, and the cell pellet was washed with PBS and resuspended in 100 mL of binding buffer. The cells were incubated with two mL Annexin V-FITC for 10 min and stained with two mL propidium iodide (PI). Then, the samples were diluted with 400 mL binding buffer and analyzed with a Flow cytometer (Becton Dickinson, San Jose, CA, USA). The different labeling patterns in the Annexin V/PI analysis identified the different cell populations where the FITC negative and PI negative cells were designated as to viable cells; FITC positive and PI negative as to early apoptotic cells; FITC positive and PI positive as to late apoptotic cells and FITC negative and PI positive as to necrotic cells. The data analysis was performed using WinMDI 2.9 software.

2.9. Real-Time Polymerase Chain Reaction

RNeasy Mini kit (Qiagen, Hilden, Germany) was used to isolate RNA from cultured cells according to the manufacturer’s instructions. cDNA was produced from the extracted RNAs using the cDNA synthesis kit based on the manufacturer’s protocol (Fermentas, Burlington, ON, Canada). The sequences for all primers were as follows: GAPDH forward primer, 5′-ACCCAGAAGACTGTGGATGG-3′; GAPDH reverse primer: 5′-TTCTAGACGGCAGGTCAGGT-3′, Bax forward primer, 5′-GCTGGACATTGGACTTCCTC-3′; Bax reverse primer, 5′-ACCACTGTGACCTGCTCCA-3′; Bcl-2 forward primer, 5′-GCTGGACATTGGACTTCCTC-3′; Bcl-2 reverse primer, 5′-GCTGGACATTGGACTTCCTC-3′. PCR amplification was performed in 40 cycles using the following program: 95 °C for 10 min, 95 °C for 15 s, 60 °C for 30 s and 60 °C for 34 s. Expression values corrected for the housekeeping gene GAPDH. Data were analyzed using the 2−ΔΔCt method.

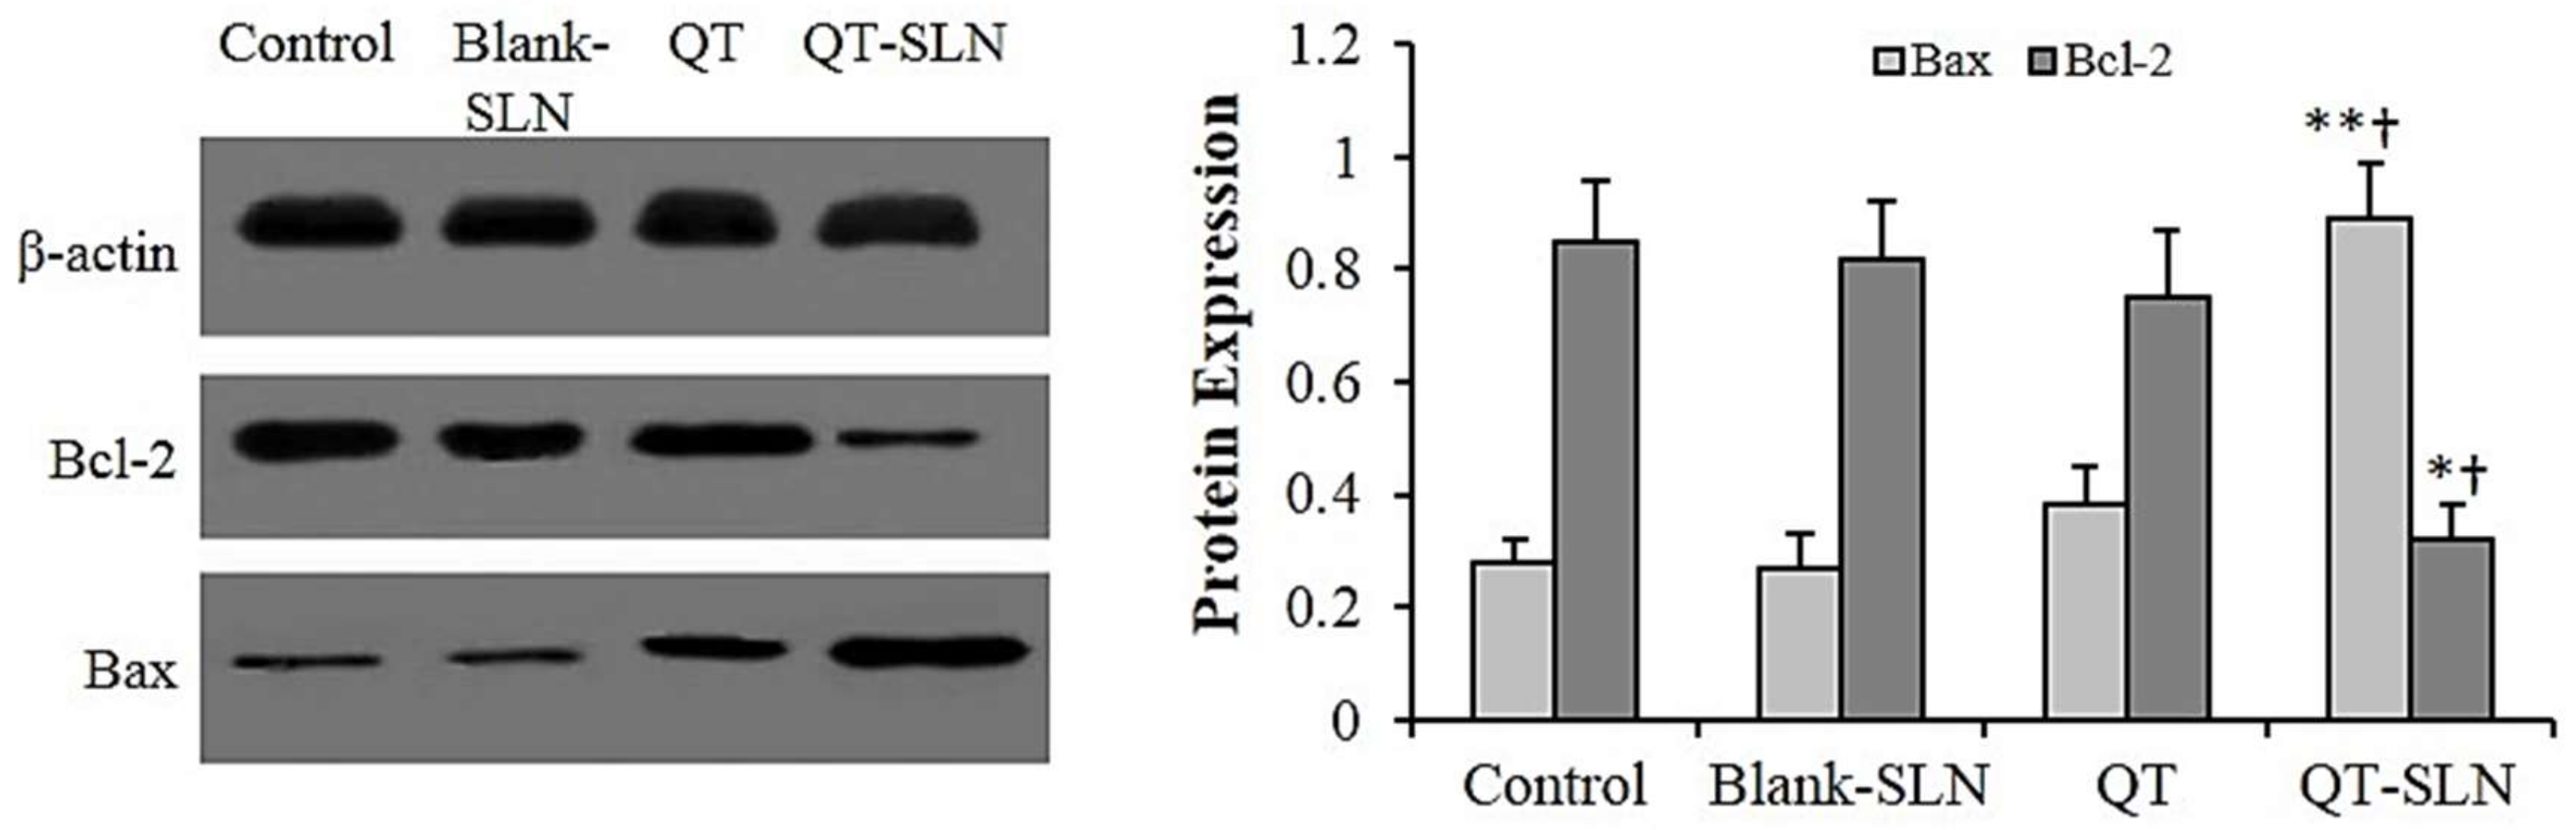
2.10. Western Analysis

Treated cells were washed by PBS (pH 7.4) and harvested within radioimmunoprecipitation assay (RIPA) lysis buffer containing protease inhibitors. Protein concentration was determined using a BCA assay kit (Pierce Biotechnology Inc., Rockford, IL, USA). Lysate protein (30 °μg) was separated on 10% SDS-PAGE (Novex, San Diego, CA, USA) and transferred onto PVDF membrane (Millipore, Bedford, MA, USA). Primary (Anti-Bcl-2, anti-Bax, and anti-β-actin) and secondary antibodies obtained from Santa Cruz Biotechnology (Santa Cruz, CA, USA). The specific proteins were visualized using an ECL detection kit (Millipore, Burlington, MA, USA). Band density was quantitated using Image J software (National Institutes of Health, Bethesda, MD, USA).

2.11. Determination MDA Contents and Antioxidant Enzyme Activities

The MCF-7 and MCF-10A cells treated with Blank-SLN, QT, and QT-SLN for 48 h. Then, the collected samples were lysed, and the protein content of MCF-7 cells and MCF-10A was determined by a BCA protein assay kit (Pierce Biotechnology Inc., Waltham, MA, USA). After centrifugation, the cell lysates, MDA content and CAT and SOD activities were assessed based on the kit’s manufacture (ZellBio, GmbH, Ulm, Germany).

2.12. Determination of Intracellular ROS Levels

Levels of ROS were measured using a dichlorodihydrofluorescein diacetate (DCFH-DA) detection kit (Sigma, St. Louis, MO, USA) according to the manufacturer’s instructions. The MCF-7 and MCF-10A cells were seeded in 96-well plates at a density of 5 × 10³. After treatment, the medium was removed and the cells were incubated with 10 µM of DCFH-DA plus 100 µL of Hank’s buffered salt solution (HBSS) for 30 min at 37 °C. The levels of ROS were measured using a spectrofluorometer (LS50B, Waltham, MA, USA; Ex: 490 nm, Em: 570 nm).

2.13. Statistical Analysis

Data analysis was performed in SPSS (version 21.0, Chicago, IL, USA) using one-way analysis of variance (ANOVA), followed by posthoc pairwise comparison using the Bonferroni procedure. Furthermore, p-value of less than 0.05 was considered statistically significant.

3. Results

3.1. Characterization of QT-SLNs

All formulations showed a negative zeta potential which was in the range of −1.1 to −23.6 mV and the EE% was in the range of 67.6% to 98.9%. The best drug loaded formulation was QT-SLN4, having average particle size 85.5 ± 8.5 nm, zeta potential −22.5 ± 0.6, and PDI 0.152 ± 0.04 (Table 3 and Supplementary Figure S1).
The mean particle size of QT-SLNs slightly increased in comparison to the blank SLNs (Table 3). This might be a result of the encapsulation of free QT into SLNs. In TEM micrographs, the lipid layer of the SLN had a pale ring around the internal aqueous media, and the QT-SLNs were discrete and had a regular spherical shape (Figure 1). The average particle size given by TEM (88.6 ± 7.9) was in line with that found using DLS, and most of the particles had sizes of less than 100 nm. The zeta potential value of QT-SLNs was high enough to make the nanoparticles repel each other, thus avoiding particle aggregation and keeping the long-term stability of nanoparticles.
The release profile in vitro showed an initial burst release within 0.5 to 6 h and then exhibited a slow QT release. This release of QT-SLNs lasted for 48 h. These finding indicated that the QT-SLNs could provide a slow release of QT during treatment. The released profile in various formulations was similar. The in vitro cumulative percentage of QT release of the QT-SLN4 formulation (Table 1) is illustrated in Figure 2. The QT-SLNs were completely dispersed in aqueous media with no aggregates, whereas free QT exhibited poor aqueous solubility (Supplementary Figure S2).

3.2. Cell Viability and Proliferation

To compare the inhibitory effects of QT on the growth of MCF-7 cells, IC50 values were measured. The IC50 results for 12, 24, 48 and 72 h of exposure are reported in Table 2. The IC50 of QT-SLNs was significantly lower than that of free QT at different times. There was no significant difference between the IC50 of free QT and QT-SLNs in 48 h and 72 h. Therefore, the IC50 concentration of QT-SLNs in 48 h (25 µmol/mL) was considered to compare the toxic effects of QT and QT-SLNs on MCF-7 cells. According to the results (Figure 3), QT did not significantly reduce viability percentage and colony numbers compared to control cells. The cell viability percentage and colony numbers significantly decreased in QT-SLNs exposed MCF-7 cells, compared to control or QT-treated cells (p < 0.01). The cell viability and proliferation of MCF-7 cells were not affected by the Blank-SLN. On the other hand, QT-SLN had no significant effect on viability percentage and colony formation of MCF-10A cells (Table 4).

3.3. Morphology Evaluation

In the control group, a few numbers of MCF-7 cells exhibited round morphology. The morphology of QT treated cells was similar to the control group. In the QT-SLNs-treated cells, a large number of cells showed apoptotic morphology, including round shape, cell membrane blebbing and nucleus condensation (Figure 3). Blank-SLN had no significant impact on the morphology of MCF-7 cells. The morphology of the MCF-10A cells was not affected by QT or QT-SLNs (Supplementary Figure S3).

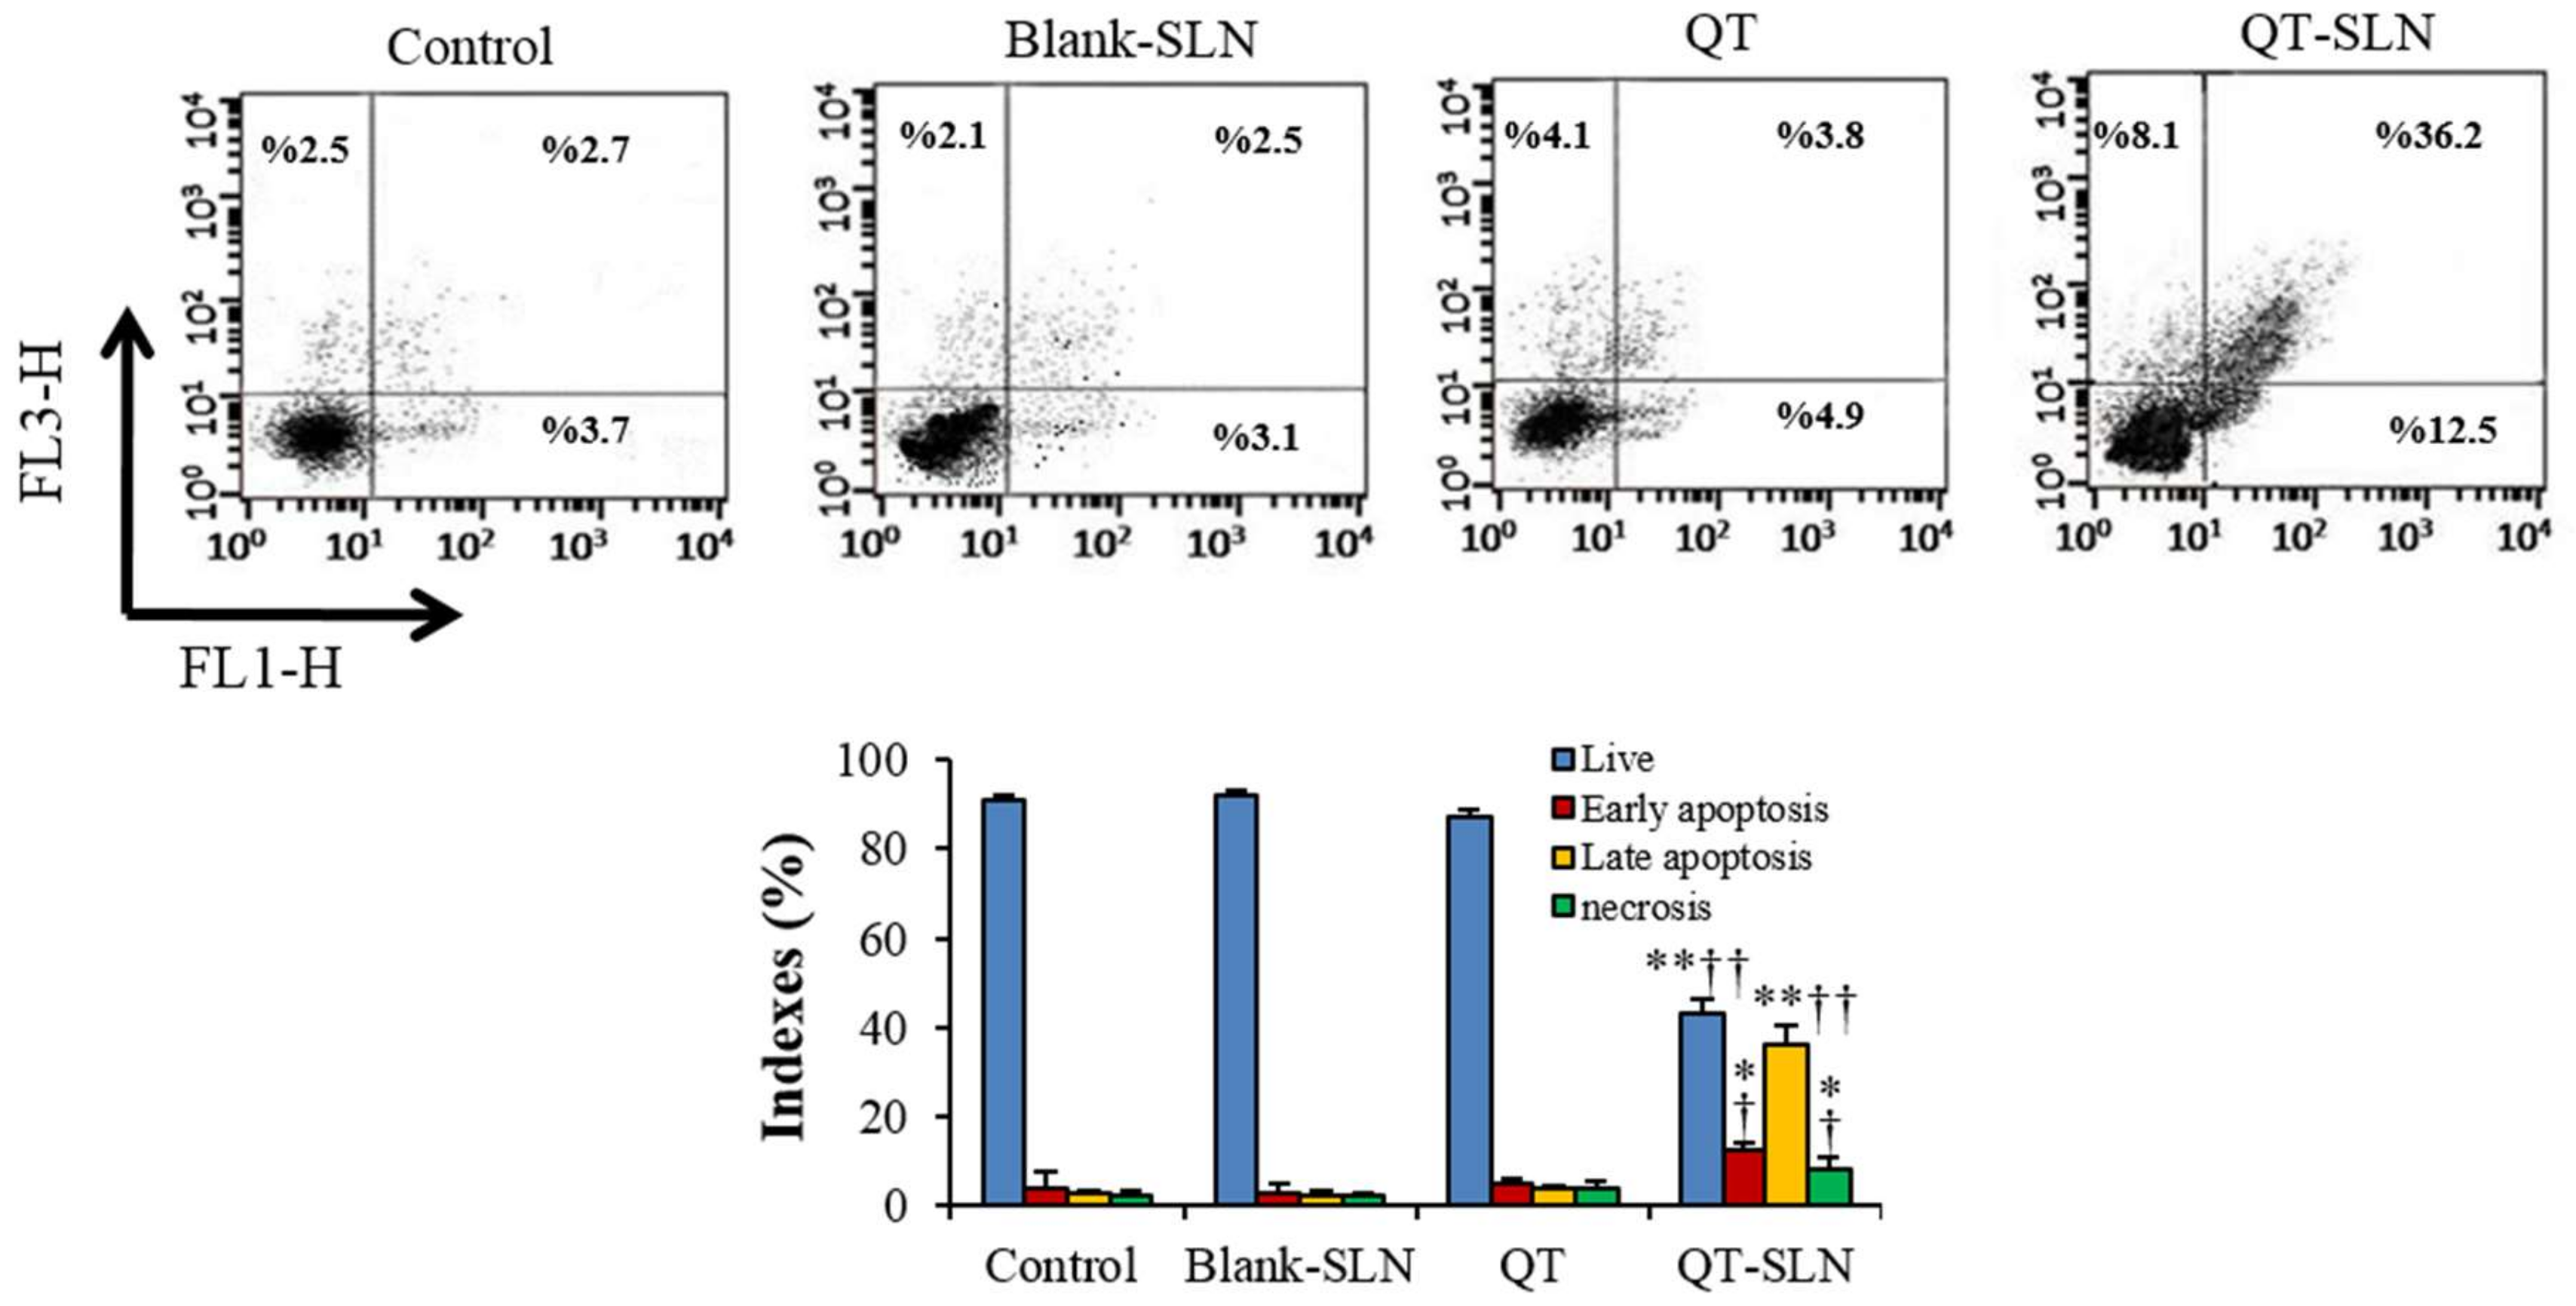
3.4. Annexin V-FITC/Propidium Iodide Apoptosis Assay

In QT exposed MCF-7 cells, apoptotic and necrotic indexes were slightly greater than in control cells. QT-SLNs significantly increased the percentage of late apoptosis, early apoptosis, and necrosis in MCF-7 cells compared to the free QT group (p < 0.05). The apoptotic and necrotic indexes of MCF-7 cells were not affected by the Blank-SLN (Figure 4). Apoptotic and necrotic indexes of MCF-10A cells were not significantly altered in response to the QT or QT-SLNs (Table 4).

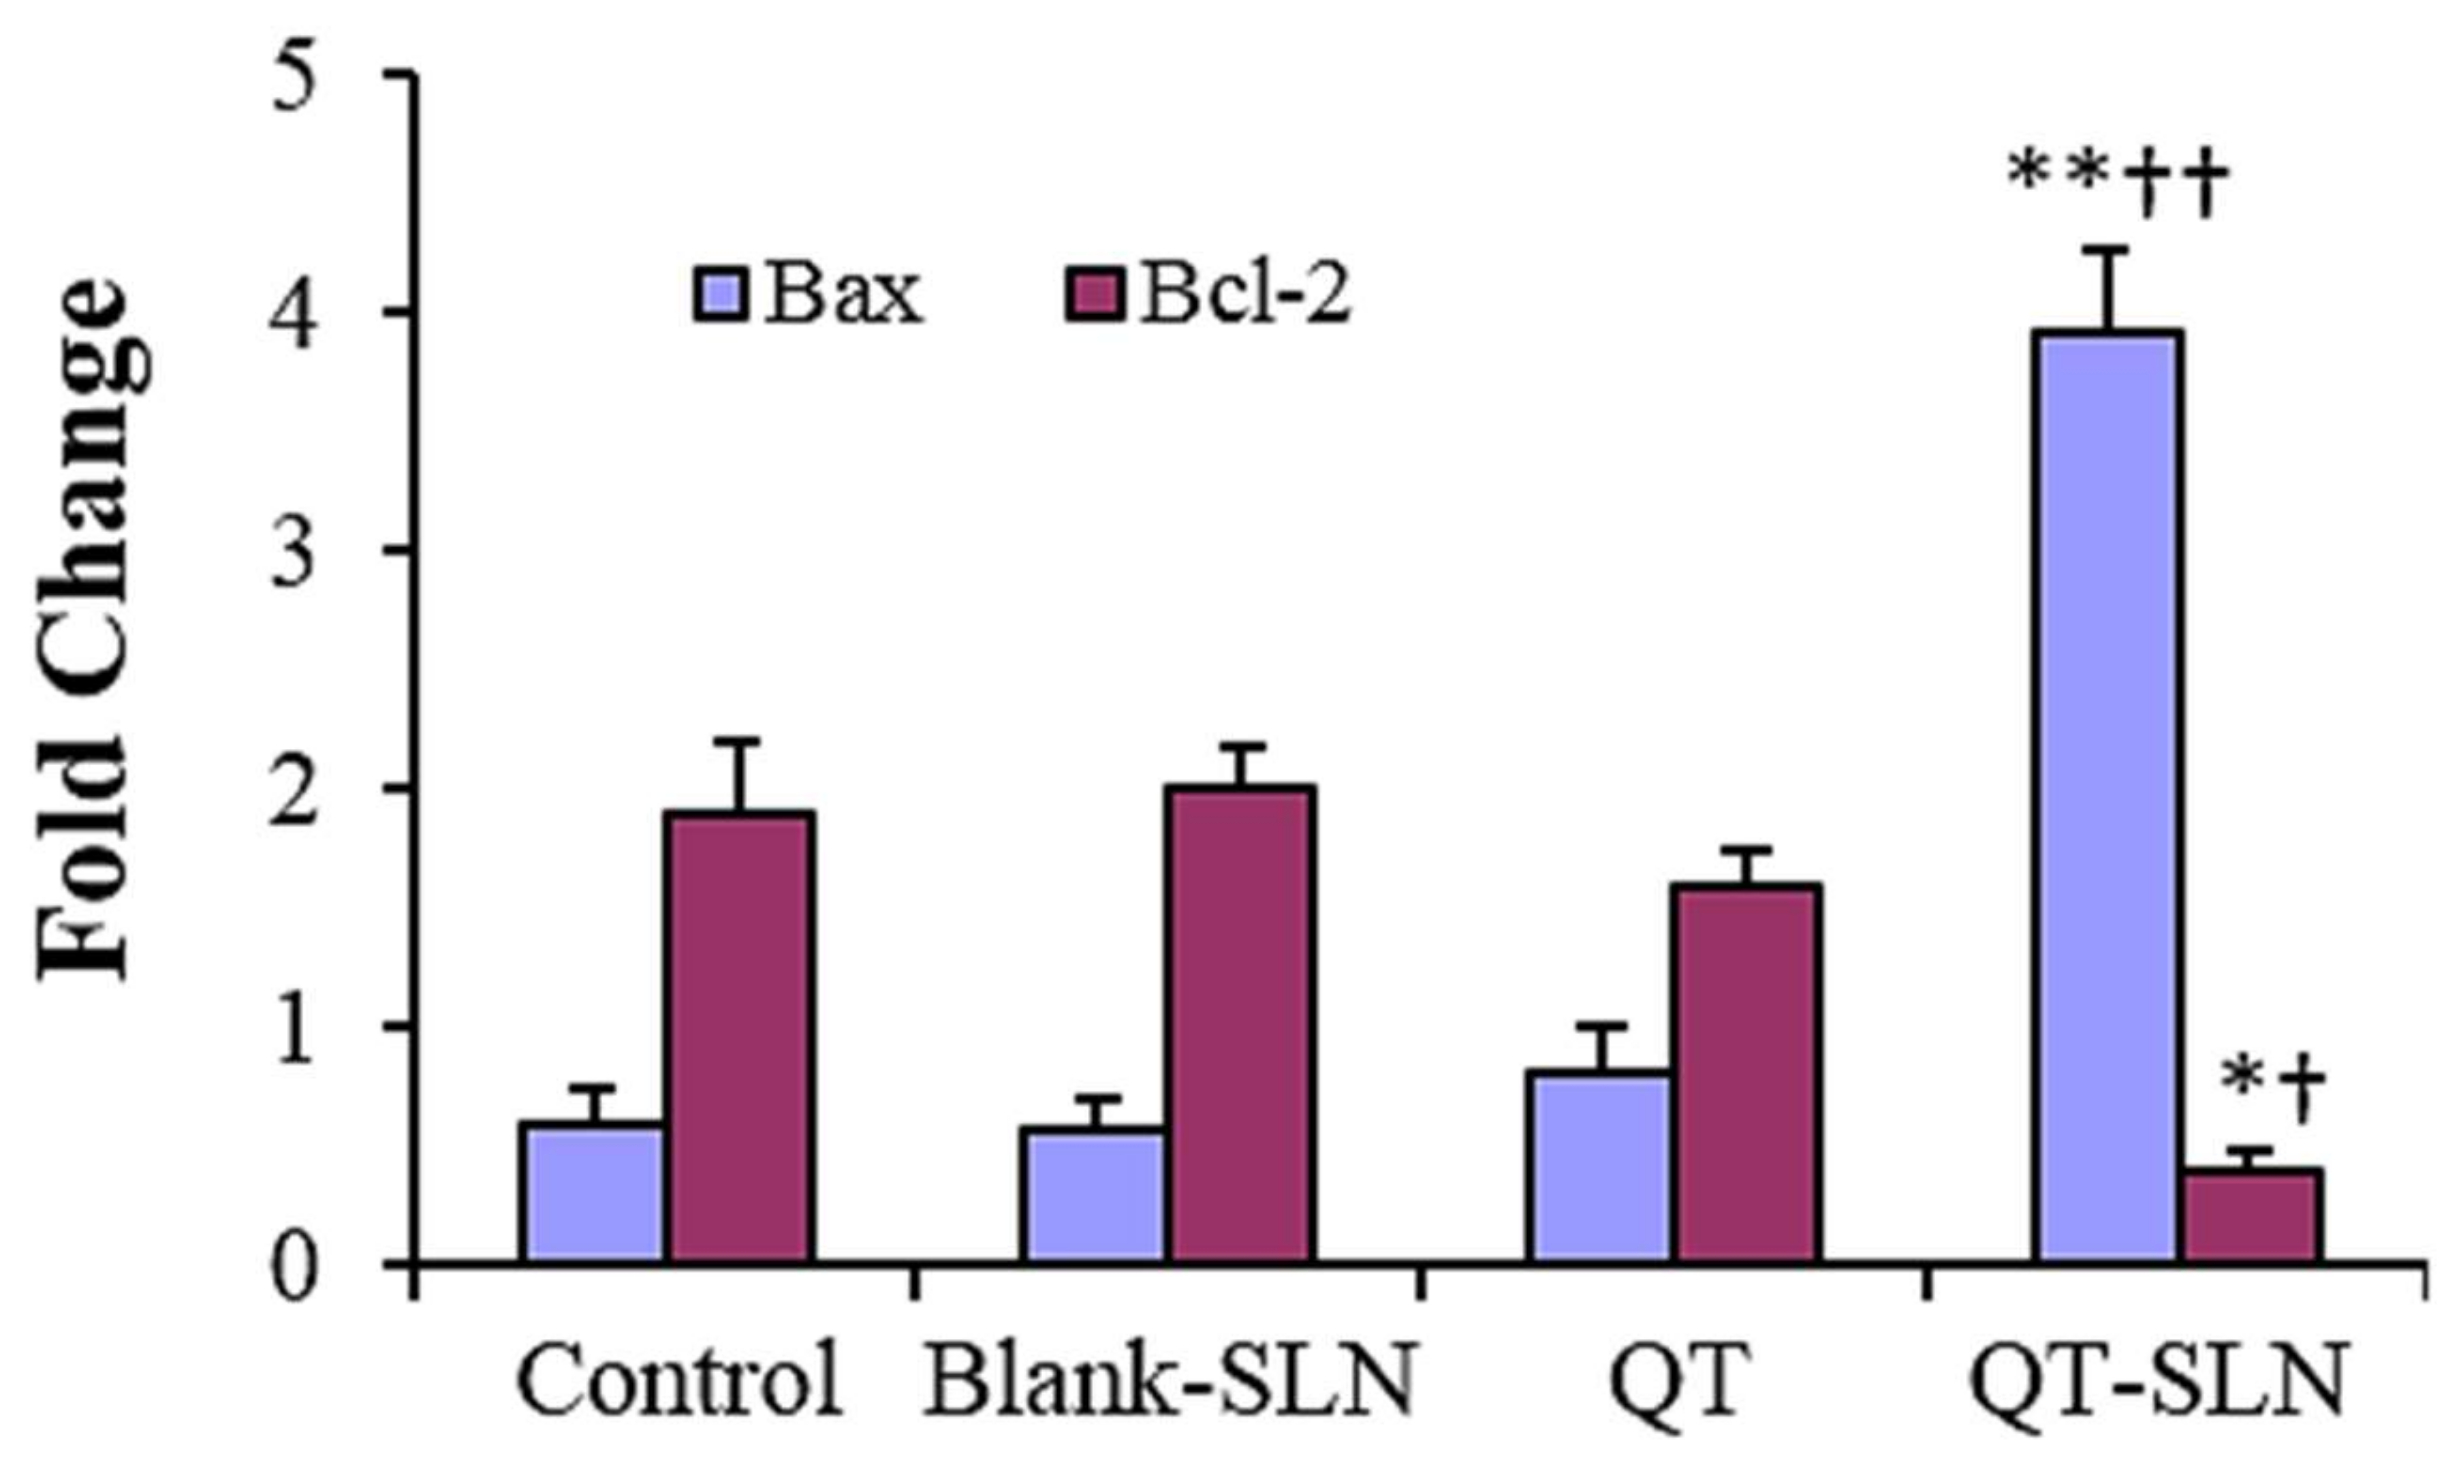
3.5. Quantitative Real-Time RT-PCR

In the QT exposed MCF-7 cells, expression of the Bax slightly increased, while the expression of the Bcl-2 slightly decreased compared to the control. While there was a significant increase in the expression of Bax gene, a significant reduction was observed in the expression of Bcl-2 gene in QT-SLN-treated cells compared to the control and QT-treated cells (p < 0.01). In the Blank-SLNs group, the expression of Bax and Bcl-2 genes was similar to the control (Figure 5). Gene expression in the MCF-10A cells was not significantly affected by the QT or QT-SLNs (Supplementary Figure S4).

3.6. Western Analysis

No differences in the expression of Bax and Bcl-2 proteins were found between untreated cells and Blank-SLN-treated cells. In the free QT exposed MCF-7 cells, expression of the Bax protein slightly increased, while the expression of the Bcl-2 protein slightly decreased compared to the control. There was a significant increase in the expression of Bax protein, and a significant reduction in the expression of Bcl-2 protein in QT-SLN-treated cells, compared with the control and QT-treated cells (Figure 6). The expression of Bax and Bcl-2 proteins were not significantly affected by the QT or QT-SLNs in the MCF-10A cells (results not shown).

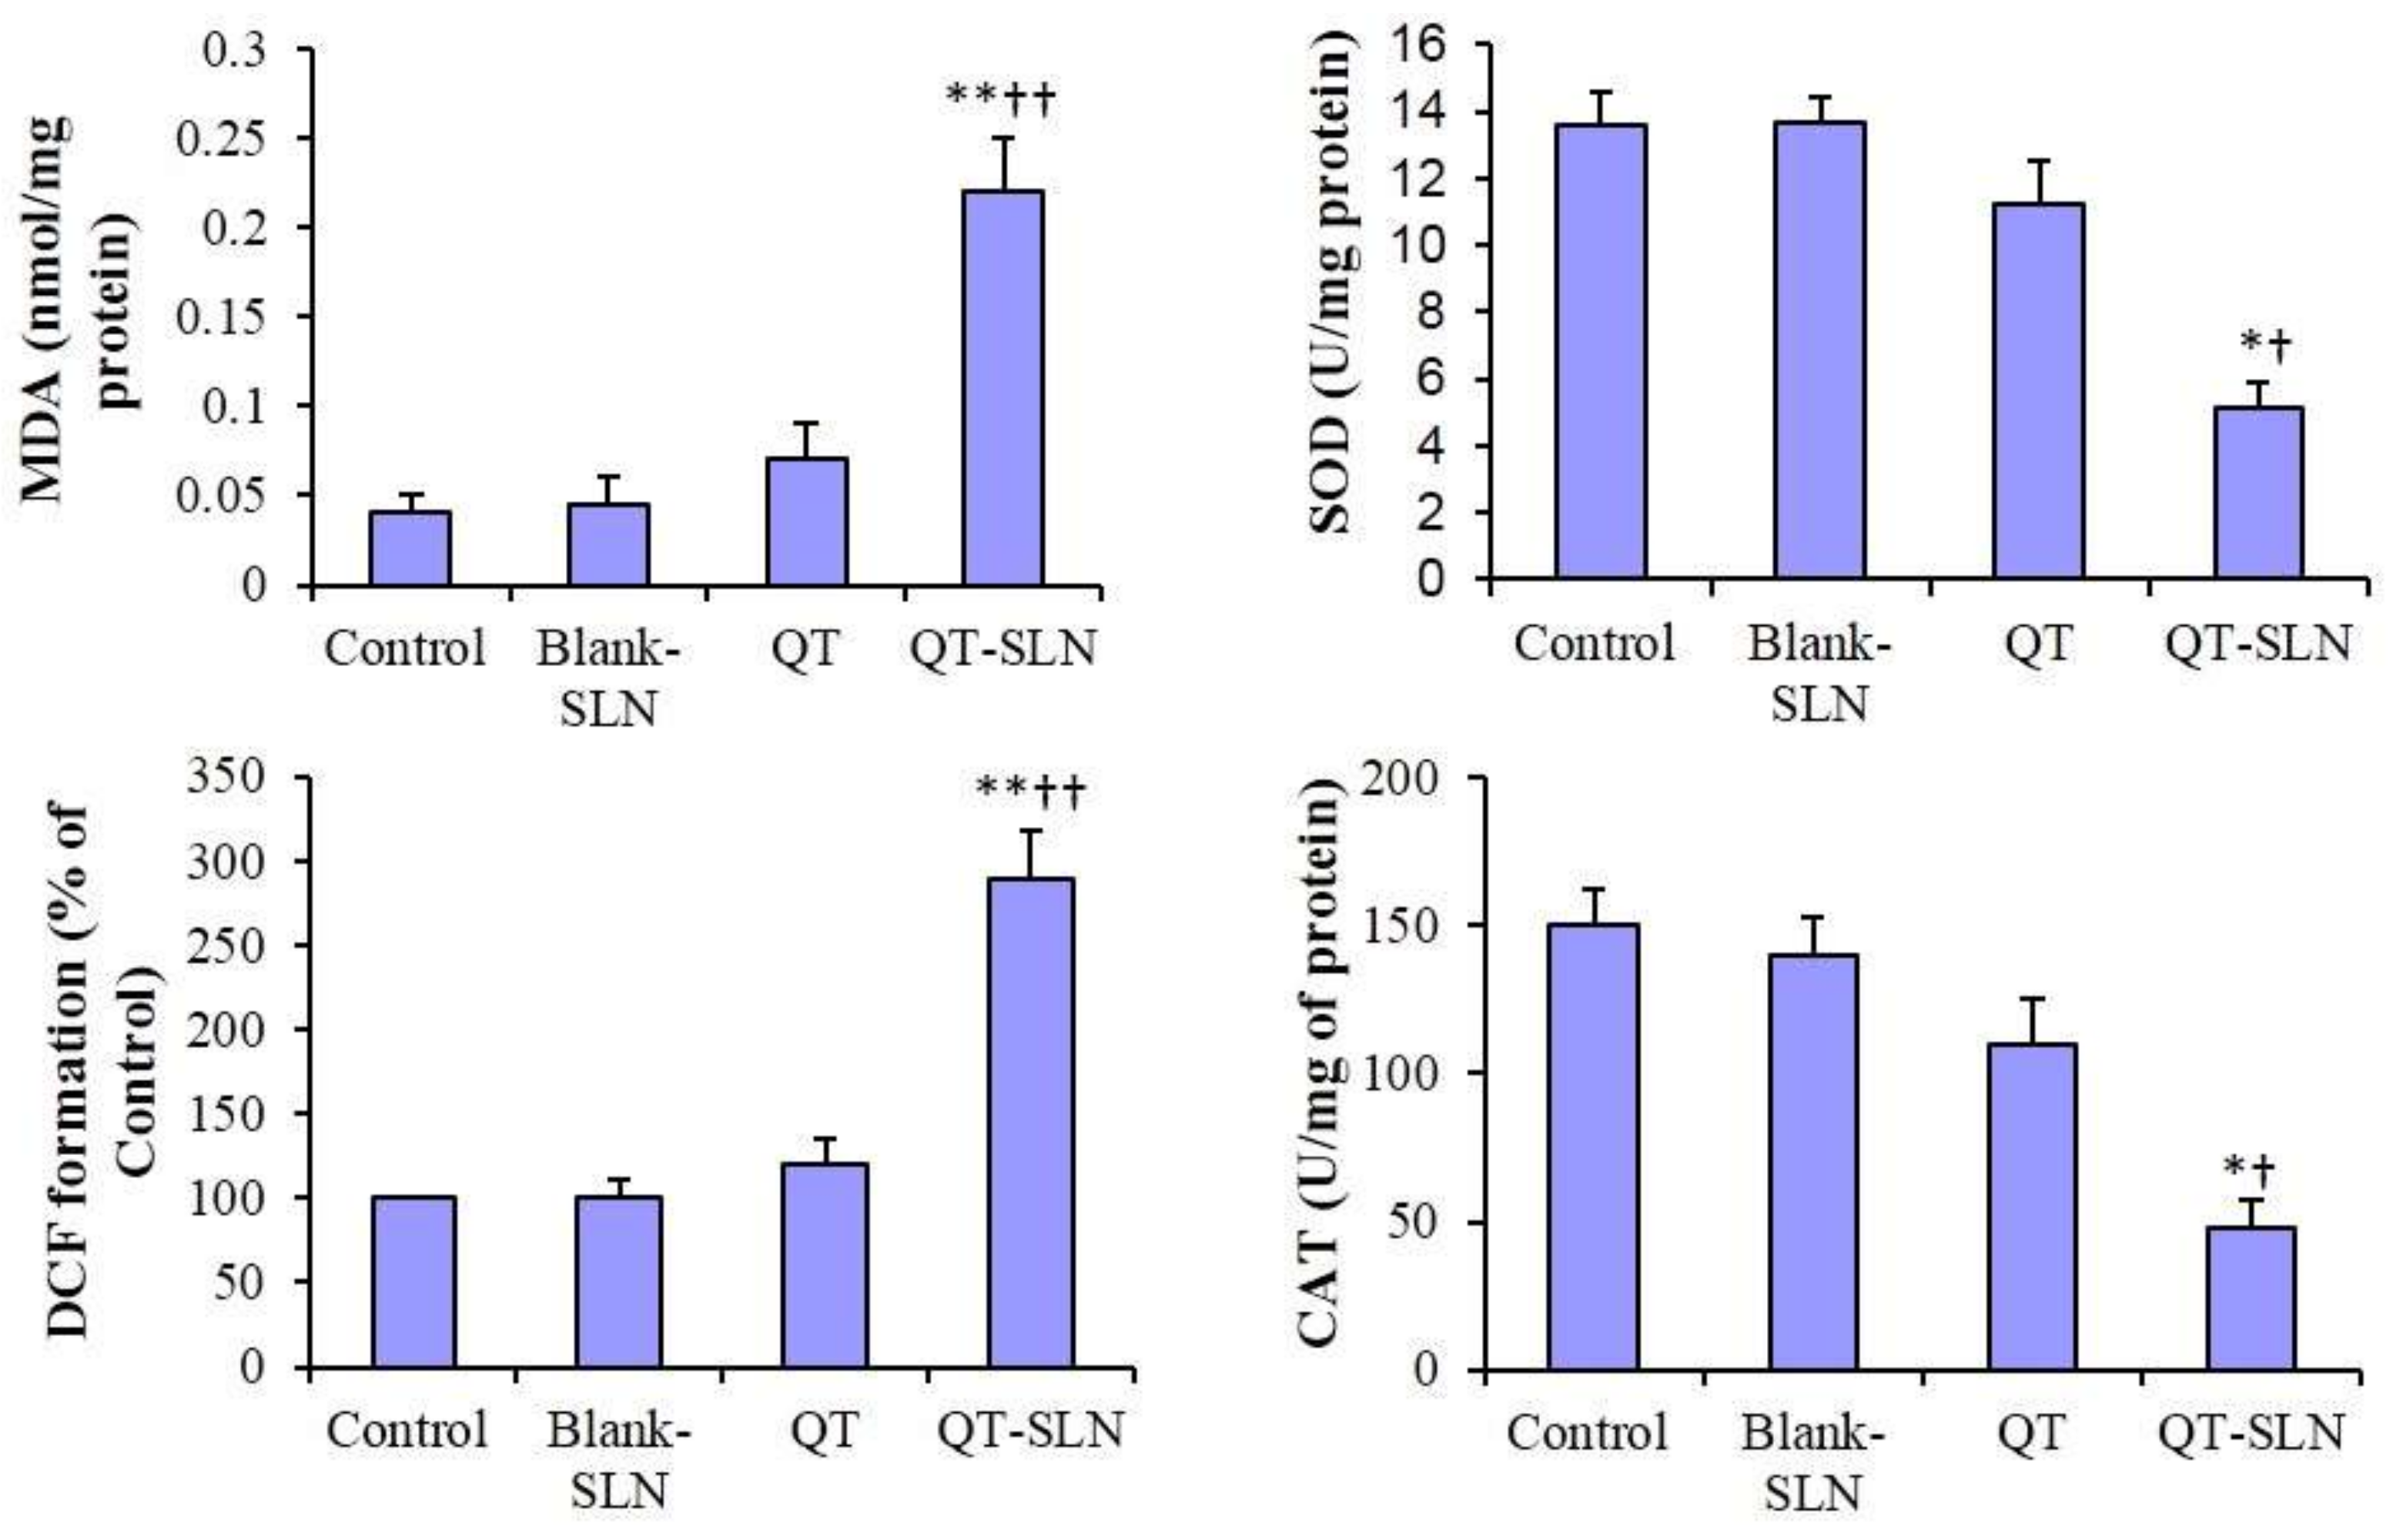
3.7. ROS Levels, MDA Content and Antioxidant Enzyme Activity

In the Blank-SLN group, ROS level, MDA content, and SOD and CAT activity were similar to the control. In the free QT-treated cells, ROS level, MDA content and antioxidant enzyme activity slightly changed in comparison with the control group. In the QT-SLN-treated cells, ROS level and MDA content significantly increased in the MCF-7 cells (p < 0.01). While SOD and CAT enzyme activity significantly reduced in comparison with control and free QT groups (p < 0.05) (Figure 7). The ROS level, MDA content and antioxidant enzyme activity were not significantly affected by QT or QT-SLN in the MCF-10A cells (Table 5).

4. Discussion

In this study, QT was successfully incorporated into SLNs through a microemulsification technique. The QT-SLN exhibited a uniform size distribution with excellent stability. The release profile in vitro showed that the QT-SLNs had a slow release of QT during the treatment. The slow release of QT from SLN is suitable for delayed drug release in chemotherapy of breast cancers.
In the present study, we have demonstrated that QT-SLN is effective in reducing cell numbers of MCF-7 cells through growth suppression and inducing cell death. Previous studies showed that QT reduced MCF-7 cell viability [40,41,42]. In this study, QT with an IC50 of 41.5 µmol for 48 h could prevent the growth of MCF-7 cancer cells. Inconsistent with our results, Lin et al. (2008) have also reported that QT, at a dose of 40 µmol, much reduced the number of MCF-7 cells [40]. Dhumale et al. (2015) and Li et al. (2018) showed that QT with an IC50 of 50 µmol effectively prevents the growth of breast cancer cells [14,41]. The IC50 of QT-SLNs (25 µmol) was markedly lower than the free QT, indicating the greater toxicity of QT-loaded nanoparticles on MCF-7 cells. The viability percentage and colony formation were lower than that of free QT, indicated that the QT-SLN was a good delivery system for the breast cancer cells and more effective than QT alone toward MCF7 cells. Various research studies confirm that SLN is a suitable carrier for anticancer drugs and phytochemical components. The encapsulation of Berberine, Oridonin, and Resveratrol in SLNs have shown an enhanced antitumor effect in MCF-7 cell lines [21,33,34]. Zhuang et al. (2012) reported that anticancer drugs encapsulated in SLN, including paclitaxel, mitoxantrone, and methotrexate, may be more effective than free anticancer drugs for breast cancer treatment [42]. In contrast, Abbasalipourkabir et al. (2016) showed that tamoxifen-loaded SLNs had a similar effect on rat breast tumor to free tamoxifen [43].
The enhanced preventive effect of QT-SLNs on the growth of MCF-7 cells may be related to the lipophilic property of the carrier, which promotes the intracellular uptake. In the study of Vijayakumar et al., QT-loaded SLN worked better than free QT in distilled water, and SLN greatly increased cellular uptake of QT [36]. Sun et al. (2014) demonstrated that QT-nanostructured lipid carriers markedly enhanced the QT solubility and stability and increased the QT content in MCF-7 cells. In their study, the enhanced cytotoxicity was parallel to increased QT uptake by MCF-7 cells [44].
Cell survival and apoptosis are often applied to check the efficacy of anti-cancer agents. Anticancer drugs generally kill dividing cells by activation of the apoptosis process [45,46,47]. We examined the ability of QT-SLN treatment to induce apoptosis in MCF-7 cells by flow cytometry and gene expression. The significantly increased apoptosis suggested that the reduction of MCF-7 cell viability after QT-SLN treatment was due to the stimulation of apoptosis. Consistent with our results, Jain et al. (2014) showed that QT-loaded self-nanoemulsifying induces DNA damage and apoptosis in MCF-7 cells [48].
Morphology assessment confirmed the flow cytometry results and was consistent with the viability percentage and colony formation of the control and experimental groups.
In this study, QT-SLNs markedly enhanced Bax expression, since there was a significant reduction in Bcl-2 expression. Bcl-2 and Bax proteins, the main members of the Bcl-2 family, regulate the intrinsic pathway of apoptosis [49]. Therefore, QT-SLNs can stimulate the intrinsic apoptotic pathway to induce cell death in MCF-7 cancer cells. Imbalance of the Bax/Bcl-2 ratio can change tumor cells sensitivity to cell death induced by chemotherapeutic drugs or radiation [50].
In the study of Lee et al. (2008), Bax involved in the QT-induced apoptosis in prostate cancer cells [51]. QT induced apoptosis and suppressed the growth of MCF-7 cells by regulating the expression of Bax and Bcl-2 [52].
As shown in the results, QT-SLN effectively increased ROS levels and MDA content, and reduced SOD and CAT activity in the MCF-7 cells. Hence, QT-SLN may show pro-oxidant activity in breast cancer cells. Pro-oxidant action of tea polyphenols links to their anticancer actions [8]. Morinda citrifolia (Noni) alters oxidative stress marker, MDA content and antioxidant activity (SOD and CAT) in the cervical cancer cell lines [9].
It has been reported that raised levels of reactive oxygen species (ROS) can regulate the expression of Bcl-2 family proteins and induce apoptosis [53]. In the study of Ren et al. (2018), paclitaxel (a diterpenoid compound) could elevate ROS and MDA levels, whereas SOD activity decreased in mammary gland tumors. In their study, paclitaxel-induced apoptosis by downregulation of Bcl-2 and upregulation of Bax proteins [54]. Farnesiferol C (isolated from Ferula asafoetida) significantly induced apoptosis by increasing the cellular ROS levels in the MCF-7 cells [55]. By contrast, in the study by Yao et al., curcumin-induced apoptosis was accompanied by reducing ROS and MDA levels and increased SOD activity in lung cancer cells (A549 cells) [56].
Flow cytometry results show that the percentage of necrosis was markedly enhanced in QT-SLN exposed MCF-7 cells, which confirms that QT-SLN can stimulate multiple cell death pathways. In a previous study, QT was able to induce apoptosis and necrosis in SCC-9 oral cancer cells [57].
Apoptosis and necrosis were mediated by distinct but overlapping pathways involving mitochondria/endoplasmic reticulum [58]. Melatonin was involved in the necrosis and apoptosis of the pancreatic cancer cell line SW-1990 by modulating of the Bax/Bcl-2 ratio [59]. Whelan et al. (2012) found that deletion of Bax significantly reduces necrotic injury during myocardial infarction [58]. Therefore, QT-SLN is able to stimulate both apoptotic and necrotic pathways by modulating the Bax/Bcl-2 ratio.
In this study, the non-tumorigenic MCF-10A cells were not affected by QT-SLNs. Thus, QT-SLNs have great potential in adjuvant therapy for clinical application in breast cancer. In agreement with our findings, apoptosis and decreasing viability percentage induced in several cancer cell lines [60,61], but not in nontumoral MCF-10A cells [62] after treatment with QT. Cancer cells are more susceptible to being killed by anticancer flavonoids compared to normal cells. It has been reported that the same dose of flavonoids induces apoptosis in cancer cells, but not in their normal counterparts [63,64].

5. Conclusions

This study demonstrated that SLN effectively increased cytotoxic effects of QT by inducing oxidative stress and stimulating the intrinsic pathway of apoptosis in MCF-7 cells. Therefore, QT-loaded SLN may be of use in the treatment breast cancer in the future. More studies are required to increase our knowledge of cell death signaling pathways in QT-SLN-treated cancer cells.

Supplementary Materials

The following are available online at https://www.mdpi.com/1648-9144/55/4/114/s1: Table S1: DMSO effects on viability; Figure S1: Size distribution of QT-SLN; Figure S2: Free QT and QT-SLN in water; Figure S3: Morphology of MCF-10A cells; Figure S4. Gene expression for MCF-10A.

Author Contributions

Conceptualization, F.N. and L.K.; Methodology, M.A. and F.N.; Software, A.K.; Validation, M.O. and L.K.; Formal Analysis, E.M.; Investigation, F.N. and A.K.; Resources, L.K.; Data Curation, M.A.; Writing—Original Draft Preparation, L.K. and F.N.; Writing—Review & Editing, M.O.; Visualization, A.K.; Supervision, L.K.; Project Administration, L.K.; Funding Acquisition, F.N.

Funding

This research was funded by research council of Ahvaz Jundishapur University of Medical sciences (CMRC-9418).

Acknowledgments

This paper is a part of Ph.D. thesis of Firoozeh Niazvand and was supported by a Grant (CMRC-9418) from the research council of Ahvaz Jundishapur University of Medical sciences.

Conflicts of Interest

The authors declare no conflict of interest.

References

  1. Tinoco, G.; Warsch, S.; Glück, S.; Avancha, K.; Montero, A.J. Treating breast cancer in the 21st century: Emerging biological therapies. J. Cancer 2013, 4, 117–132. [Google Scholar] [CrossRef]
  2. Gadhwal, M.K.; Patil, S.; D’Mello, P.; Joshi, U.; Sinha, R.; Govil, G. Characterisation and antitumour activity of some Quercetin analogues. Ind. J. Pharm. Sci. 2013, 75, 233–237. [Google Scholar]
  3. Gibellini, L.; Pinti, M.; Nasi, M.; Montagna, J.P.; De Biasi, S.; Roat, E.; Bertoncelli, L.; Cooper, E.L.; Cossarizza, A. Quercetin and cancer chemoprevention. Evid. Based Complement. Alternat. Med. 2011, 2011, 591356. [Google Scholar] [CrossRef] [PubMed]
  4. Dandawate, P.R.; Subramaniam, D.; Jensen, R.A.; Anant, S. Targeting cancer stem cells and signaling pathways by phytochemicals: Novel approach for breast cancer therapy. Semin. Cancer Biol. 2016, 40, 192–208. [Google Scholar] [CrossRef] [PubMed]
  5. Sinha, D.; Biswas, J.; Nabavi, SM.; Bishayee, A. Tea phytochemicals for breast cancer prevention and intervention: From bench to bedside and beyond. Semin. Cancer Biol. 2017, 46, 33–54. [Google Scholar] [CrossRef]
  6. Lv, W.; Budke, B.; Pawlowski, M.; Connell, P.P.; Kozikowski, A.P. Development of small molecules that specifically inhibit the D-loop activity of RAD51. J. Med. Chem. 2016, 59, 4511–4525. [Google Scholar] [CrossRef] [PubMed]
  7. Aiello, F.; Carullo, G.; Giordano, F.; Spina, E.; Nigro, A.; Garofalo, A.; Tassini, S.; Costantino, G.; Vincetti, P.; Bruno, A.; et al. Identification of Breast Cancer Inhibitors Specific for G Protein-Coupled Estrogen Receptor (GPER)-Expressing Cells. Chem. Med. Chem. 2017, 12, 1279–1285. [Google Scholar] [CrossRef] [PubMed]
  8. Lambert, J.D.; Elias, R.J. The antioxidant and pro-oxidant activities of green tea polyphenols: A role in cancer prevention. Arch. Biochem. Biophys. 2010, 501, 65–72. [Google Scholar] [CrossRef] [PubMed]
  9. Gupta, R.K.; Singh, N. Morinda citrifolia (Noni) alter oxidative stress marker and antioxidant activity in cervical cancer cell Lines. Asian Pac. J. Cancer Prev. 2013, 14, 4603–4606. [Google Scholar] [CrossRef]
  10. Saha, S.K.; Lee, S.B.; Won, J.; Choi, H.Y.; Kim, K.; Yang, G.M.; Dayem, A.A.; Cho, S.G. Correlation between oxidative stress, nutrition, and cancer initiation. Int. J. Mol. Sci. 2017, 18, E1544. [Google Scholar] [CrossRef] [PubMed]
  11. Halliwell, B. Biochemistry of oxidative stress. Biochem. Soc. Trans. 2007, 35, 1147–1150. [Google Scholar] [CrossRef]
  12. Davis, J.M.; Murphy, E.A. Effects of the dietary flavonoid quercetin upon performance and health. Curr. Sports Med. Rep. 2009, 8, 206–213. [Google Scholar] [CrossRef]
  13. Srivastava, S.; Somasagara, R.R.; Hegde, M.; Nishana, M.; Tadi, S.K.; Srivastava, M.; Choudhary, B.; Raghavan, S.C. Quercetin, anatural flavonoid interacts with DNA, arrests cell cycle and causes tumor regression by activating mitochondrial pathway of apoptosis. Sci. Rep. 2016, 6, 24049. [Google Scholar] [CrossRef] [PubMed]
  14. Tummala, T.; Lou, W.; Gao, A.C.; Nadiminty, N. Quercetin targets hnRNPA1 to overcome enzalutamide resistance in prostate cancer cells. Mol. Cancer Ther. 2017, 16, 2770–2779. [Google Scholar] [CrossRef] [PubMed]
  15. Lamson, D.W.; Brignall, M.S. Antioxidants and cancer, Part 3: Quercetin. Altern. Med. Rev. 2000, 5, 196–208. [Google Scholar]
  16. Dhumale, S.S.; Waghela, B.N.; Pathak, C. Quercetin protects necrotic insult and promotes apoptosis by attenuating the expression of RAGE and its ligand HMGB1 in human breast adenocarcinoma cells. IUBMB Life 2015, 67, 361–373. [Google Scholar] [CrossRef] [PubMed]
  17. Rauf, A.; Imran, M.; Khan, I.A.; Ur-Rehman, M.; Gilani, S.A.; Mehmood, Z.; Mubarak, M.S. Anticancer potential of quercetin: A comprehensive review. Phytother. Res. 2018, 32, 2109–2130. [Google Scholar] [CrossRef]
  18. Abd-Rabou, A.A.; Ahmed, H.H. PEG decorated PLGA nano-prototype for delivery of bioactive compounds: A novel approach for induction of apoptosis in HepG2 cellline. Adv. Med. Sci. 2017, 62, 357–367. [Google Scholar] [CrossRef] [PubMed]
  19. Jain, A.; Garg, N.K.; Jain, A.; Kesharwani, P.; Jain, A.K.; Nirbhavane, P.; Tyagi, R.K. A synergistic approach ofadapalene-loaded nanostructured lipid carriers, and vitaminco-administration for treating acne. Drug Dev. Ind. Harm. 2016, 42, 897–905. [Google Scholar] [CrossRef]
  20. Mombeini, M.; Saki, G.; Khorsandi, L.; Bavarsad, N. Effects of silymarin-loaded nanoparticles on HT-29 human colon cancer cells. Medicina 2018, 54, 1. [Google Scholar] [CrossRef] [PubMed]
  21. Wang, W.; Zhang, L.; Chen, T.; Guo, W.; Bao, X.; Wang, D.; Ren, B.; Wang, H.; Li, Y.; Wang, Y. Anticancer effects of resveratrol-loaded solid lipid nanoparticles on human breast cancer cells. Molecules 2017, 22, 1814. [Google Scholar] [CrossRef] [PubMed]
  22. Balakrishnan, S.; Mukherjee, S.; Das, S.; Bhat, F.A.; Raja Singh, P.; Patra, C.R.; Arunakaran, J. Gold nanoparticles-conjugated quercetin induces apoptosis via inhibition of EGFR/PI3K/Akt-mediated pathway in breast cancer cell lines (MCF-7 and MDA-MB-231). Cell Biochem. Funct. 2017, 35, 217–231. [Google Scholar] [CrossRef]
  23. Govindaraju, S.; Rengaraj, A.; Arivazhagan, R.; Huh, Y.S.; Yun, K. Curcumin-conjugated gold clusters for bioimaging and anticancer applications. Bioconjug. Chem. 2018, 29, 363–370. [Google Scholar] [CrossRef]
  24. Nazar, M.; Talebi, A.R.; Hosseini Sharifabad, M.; Abbasi, A.; Khoradmehr, A.; Danafar, A.H. Acute and chronic effects of gold nanoparticles on sperm parameters and chromatin structure in mice. Int. J. Reprod. Biomed. 2016, 14, 637–642. [Google Scholar]
  25. Hwang, J.H.; Kim, S.J.; Kim, Y.H.; Noh, J.R.; Gang, G.T.; Chung, B.H.; Song, N.W.; Lee, C.H. Susceptibility to gold nanoparticle-induced hepatotoxicity is enhanced in a mouse model of nonalcoholic steatohepatitis. Toxicology 2012, 294, 27–35. [Google Scholar] [CrossRef]
  26. Isoda, K.; Daibo, T.; Yushina, K.; Yoshioka, Y.; Tsutsumi, Y.; Akimoto, Y.; Kawakami, H.; Taira, Y.; Taira, I.; Yanoshita, R.; et al. Hepatotoxicity, nephrotoxicity, and drug/chemical interaction toxicity of platinum nanoparticles in mice. Pharmazie 2017, 72, 10–16. [Google Scholar] [CrossRef] [PubMed]
  27. Abbasalipourkabir, R.; Salehzadeh, A.; Abdullah, R. Antitumor activity of tamoxifen loaded solid lipid nanoparticles on induced mammary tumor gland in sprague-dawley rats. Afr. J. Biotechnol. 2010, 9, 7337–7345. [Google Scholar]
  28. Badawi, N.M.; Teaima, M.H.; El-Say, K.M.; Attia, D.A.; El-Nabarawi, M.A.; Elmazar, MM. Pomegranate extract-loaded solid lipid nanoparticles: Design, optimization, and in vitro cytotoxicity study. Int. J. Nanomed. 2018, 13, 1313–1326. [Google Scholar] [CrossRef] [PubMed]
  29. Stella, B.; Peira, E.; Dianzani, C.; Gallarate, M.; Battaglia, L.; Gigliotti, C.L.; Boggio, E.; Dianzani, U.; Dosio, F. Development and characterization of solid lipid nanoparticles loaded with a highly active doxorubicin derivative. Nanomaterials 2018, 8, 2. [Google Scholar] [CrossRef]
  30. Baek, J.S.; Na, Y.G.; Cho, CW. Sustained cytotoxicity of Wogonin on breast cancer cells by encapsulation in Solid Lipid Nanoparticles. Nanomaterials 2018, 8, 159. [Google Scholar] [CrossRef]
  31. Wang, W.; Chen, T.; Xu, H.; Ren, B.; Cheng, X.; Qi, R.; Liu, H.; Wang, Y.; Yan, L.; Chen, S.; et al. Curcumin-loaded solid lipid nanoparticles enhanced anticancer efficiency in breast cancer. Molecules 2018, 23, E1578. [Google Scholar] [CrossRef]
  32. Sun, J.; Bi, C.; Chan, H.M.; Sun, S.; Zhang, Q.; Zheng, Y. Curcumin-loaded solid lipid nanoparticles have prolonged in vitro antitumour activity, cellular uptake and improved in vivo bioavailability. Colloids Surf. B Biointerfaces 2013, 111, 367–375. [Google Scholar] [CrossRef]
  33. Wang, L.; Li, H.; Wang, S.; Liu, R.; Wu, Z.; Wang, C.; Wang, Y.; Chen, M. Enhancing the antitumor activity of berberine hydrochloride by solid lipid nanoparticle encapsulation. AAPS PharmSciTech 2014, 15, 834–844. [Google Scholar] [CrossRef] [PubMed]
  34. Wang, L.; Wang, S.; Chen, R.; Wang, Y.; Li, H.; Wang, Y.; Chen, M. Oridonin loaded solid lipid nanoparticles enhanced antitumor activity in MCF-7 cells. J. Nanomater. 2014, 2014, 903646. [Google Scholar] [CrossRef]
  35. Masiiwa, W.L.; Gadaga, L.L. Intestinal permeability of artesunate-loaded solid lipid nanoparticles using the everted gut method. J. Drug Deliv. 2018, 2018, 3021738. [Google Scholar] [CrossRef]
  36. Vijayakumar, A.; Baskaran, R.; Jang, Y.S.; Oh, S.H.; Yoo, B.K. Quercetin-loaded solid lipid nanoparticle dispersion with improved physicochemical properties and cellular uptake. AAPS PharmSciTech 2017, 18, 875–883. [Google Scholar] [CrossRef]
  37. Abbasalipourkabir, R.; Salehzadeh, A.; Abdullah, R. Delivering tamoxifen within solid lipid nanoparticles. Pharm. Technol. 2011, 35, 74–79. [Google Scholar]
  38. Park, U.H.; Jeong, J.C.; Jang, J.S.; Sung, M.R.; Youn, H.; Lee, S.J.; Kim, E.J.; Um, S.J. Negative regulation of adipogenesis by kaempferol, a component of Rhizoma Polygonati falcatum in 3T3-L1 cells. Biol. Pharm. Bull. 2012, 35, 1525–1533. [Google Scholar] [CrossRef]
  39. Franken, N.A.; Rodermond, H.M.; Stap, J.; Haveman, J.; van Bree, C. Clonogenic assay of cells in vitro. Nat. Prot. 2016, 1, 2315–2319. [Google Scholar] [CrossRef]
  40. Lin, C.W.; Hou, W.C.; Shen, S.C.; Juan, S.H.; Ko, C.H.; Wang, L.M.; Chen, Y.C. Quercetin inhibition of tumor invasion via suppressing PKCd/ERK/AP-1-dependent matrix metalloproteinase-9 activation in breast carcinoma cells. Carcinogenesis 2008, 29, 1807–1815. [Google Scholar] [CrossRef]
  41. Wu, Q.; Kroon, P.A.; Shao, H.; Needs, P.W.; Yang, X. Differential Effects of Quercetin and Two of Its Derivatives, Isorhamnetin and Isorhamnetin-3-glucuronide, in Inhibiting the Proliferation of Human Breast-Cancer MCF-7 Cells. J. Agric. Food. Chem. 2018, 66, 7181–7189. [Google Scholar] [CrossRef] [PubMed]
  42. Li, X.; Zhou, N.; Wang, J.; Liu, Z.; Wang, X.; Zhang, Q.; Liu, Q.; Gao, L.; Wang, R. Quercetin suppresses breast cancer stem cells (CD44+/CD24-) by inhibiting the PI3K/Akt/mTOR-signaling pathway. Life Sci. 2018, 196, 56–62. [Google Scholar] [CrossRef]
  43. Zhuang, Y.G.; Xu, B.; Huang, F.; Wu, J.J.; Chen, S. Solid lipid nanoparticles of anticancer drugs against MCF-7 cell line and a murine breast cancer model. Pharmazie 2012, 67, 925–929. [Google Scholar] [CrossRef]
  44. Abbasalipourkabir, R.; Salehzadeh, A.; Abdullah, R. Tamoxifen-loaded solid lipid nanoparticles-induced apoptosis in breast cancer cell lines. J. Exp. Nanosci. 2016, 11, 161–174. [Google Scholar] [CrossRef]
  45. Sun, M.; Nie, S.; Pan, X.; Zhang, R.; Fan, Z.; Wang, S. Quercetin-nanostructured lipid carriers: Characteristics and anti-breast cancer activities in vitro. Colloids Surf. B Biointerfaces 2014, 113, 15–24. [Google Scholar] [CrossRef]
  46. Fulda, S. Tumor resistance to apoptosis. Int. J. Cancer 2009, 124, 511–515. [Google Scholar] [CrossRef]
  47. Naumov, G.N.; Akslen, L.A.; Folkman, J. Role of angiogenesis in human tumor dormancy: Animal models of the angiogenic switch. Cell Cycle 2006, 5, 1779–1787. [Google Scholar] [CrossRef] [PubMed]
  48. Ravichandran, K.; Velmurugan, B.; Gu, M.; Singh, R.P.; Agarwal, R. Inhibitory effect of silibinin against azoxymethane-induced colon tumorigenesis in A/J mice. Clin. Cancer Res. 2010, 16, 4595–4606. [Google Scholar] [CrossRef] [PubMed]
  49. Jain, A.K.; Thanki, K.; Jain, S. Novel self-nanoemulsifying formulation of quercetin: Implications of pro-oxidant activity on the anticancer efficacy. Nanomedicine 2014, 10, 959–969. [Google Scholar] [CrossRef]
  50. Eisenberg-Lerner, A.; Bialik, S.; Simon, H.U.; Kimchi, A. Life and death partners: Apoptosis, autophagy and the cross-talk between them. Cell Death Diff. 2009, 16, 966–975. [Google Scholar] [CrossRef]
  51. Lee, D.H.; Szczepanski, M.; Lee, Y.J. Role of Bax in quercetin-induced apoptosis in human prostate cancer cells. Biochem. Pharmacol. 2008, 75, 2345–2355. [Google Scholar] [CrossRef]
  52. Duo, J.; Ying, G.G.; Wang, G.W.; Zhang, L. Quercetin inhibits human breast cancer cell proliferation and induces apoptosis via Bcl-2 and Bax regulation. Mol. Med. Rep. 2012, 5, 1453–1456. [Google Scholar] [CrossRef]
  53. Tserga, A.; Chatziandreou, I.; Michalopoulos, N.V.; Patsouris, E.; Saetta, A.A. Mutation of genes of the PI3K/AKT pathway in breast cancer supports their potential importance as biomarker for breast cancer aggressiveness. Virchows Arch. 2016, 469, 35–43. [Google Scholar] [CrossRef]
  54. Ren, X.; Zhao, B.; Chang, H.; Xiao, M.; Wu, Y.; Liu, Y. Paclitaxel suppresses proliferation and induces apoptosis through regulation of ROS and the AKT/MAPK signaling pathway in canine mammary gland tumor cells. Mol. Med. Rep. 2018, 17, 8289–8299. [Google Scholar] [CrossRef]
  55. Hasanzadeh, D.; Mahdavi, M.; Dehghan, G.; Nozad Charoudeh, H. Farnesiferol C induces cell cycle arrest and apoptosis mediated by oxidative stress in MCF-7 cell line. Toxicol. Rep. 2017, 4, 420–426. [Google Scholar] [CrossRef]
  56. Yao, Q.; Lin, M.; Wang, Y.; Lai, Y.; Hu, J.; Fu, T.; Wang, L.; Lin, S.; Chen, L.; Guo, Y. Curcumin induces the apoptosis of A549 cells via oxidative stress and MAPK signaling pathways. Int. J. Mol. Med. 2015, 36, 1118–1126. [Google Scholar] [CrossRef] [PubMed]
  57. Haghiac, M.; Walle, T. Quercetin induces necrosis and apoptosis in SCC-9 oral cancer cells. Nutr. Cancer 2005, 53, 220–231. [Google Scholar] [CrossRef]
  58. Whelan, R.S.; Konstantinidis, K.; Wei, A.C.; Chen, Y.; Reyna, D.E.; Jha, S.; Yang, Y.; Calvert, J.W.; Lindsten, T.; Thompson, C.B.; et al. Bax regulates primary necrosis through mitochondrial dynamics. Proc. Natl. Acad. Sci. USA 2012, 109, 6566–6571. [Google Scholar] [CrossRef] [PubMed]
  59. Xu, C.; Wu, A.; Zhu, H.; Fang, H.; Xu, L.; Ye, J.; Shen, J. Melatonin is involved in the apoptosis and necrosis of pancreatic cancer cell line SW-1990 via modulating of Bcl-2/Bax balance. Biomed. Pharmacother. 2013, 67, 133–139. [Google Scholar] [CrossRef]
  60. Hashemzaei, M.; Delarami Far, A.; Yari, A.; Heravi, R.E.; Tabrizian, K.; Taghdisi, S.M.; Sadegh, S.E.; Tsarouhas, K.; Kouretas, D.; Tzanakakis, G.; et al. Anticancer and apoptosis-inducing effects of quercetin in vitro and in vivo. Oncol. Rep. 2017, 38, 819–828. [Google Scholar] [CrossRef]
  61. Khoei, S.; Azarian, M.; Rafipour, M. The effect of quercetin and hyperthermia on spheroid model of DU145 prostate carcinoma cell line. J. Paramed. Sci. 2013, 4, 82–89. [Google Scholar]
  62. Hakimuddin, F.; Paliyath, G.; Meckling, K. Treatment of Mcf-7 breast cancer cells with a red grape wine polyphenol fraction results in disruption of calcium homeostasis and cell cycle arrest causing selective cytotoxicity. J. Agric. Food Chem. 2006, 54, 7912–7923. [Google Scholar] [CrossRef]
  63. Brusselmans, K.; De Schrijver, E.; Heyns, W.; Verhoeven, G.; Swinnen, J.V. Epigallocatechin-3-gallate is a potent natural inhibitor of fatty acid synthase in intact cells and selectively induces apoptosis in prostate cancer cells. Int. J. Cancer 2003, 106, 856–862. [Google Scholar] [CrossRef]
  64. Chen, Z.P.; Schell, J.B.; Ho, C.T.; Chen, K.Y. Green tea epigallocatechin gallate shows a pronounced growth inhibitory effect on cancerous cells but not on their normal counterparts. Cancer Lett. 1998, 129, 173–179. [Google Scholar] [CrossRef]
Figure 1. A TEM micrograph of QT-SLNs. The lipid layer of the SLN can be observed as pale rings around the internal aqueous media. Scale bar: 200 nm.
Medicina 55 00114 g001
Figure 2. In vitro cumulative percentage of drug release vs. time. Data expressed as mean ± SD (n = 6).
Medicina 55 00114 g002
Figure 3. Morphology (upper pictures) and colony formation (lower pictures) of MCF-7 cells in the control and experimental groups. Arrows indicate apoptotic morphology. Viability and colony numbers of control and experimental groups are also observed. Values are expressed as mean ± SD. * p < 0.01, p < 0.01; * and symbols respectively indicate comparison to control and QT-treated cells.
Medicina 55 00114 g003
Figure 4. Flow cytometry of Annexin/PI staining in control and experimental groups. Lower left quadrant: live cells; lower right quadrant: early apoptosis; upper right quadrant: late apoptosis; upper left quadrant: necrotic cells. All assays were performed in triplicate, and the mean ± standard deviations are shown. * p < 0.05, ** p < 0.001, p < 0.01, †† p < 0.001; * and symbols respectively indicate the comparison to control and QT groups.
Medicina 55 00114 g004
Figure 5. Gene expression for MCF-7 cells in different groups. Expression is normalized to average of housekeeping gene (GAPDH). Values are expressed as mean ± SD. * p < 0.01, ** p < 0.001, p < 0.01, †† p < 0.001; * and symbols respectively indicate the comparison to control and QT-treated cells.
Medicina 55 00114 g005
Figure 6. The level of protein expression in the MCF-7 cells. The β-actin was used as the loading control. The protein levels of Bax and Bcl-2 in the control and treated cells were quantified by ImageJ software and normalized to β-actin band intensity. Values are expressed as mean ± SD. * p < 0.05, ** p < 0.01, p < 0.05; * and symbols respectively indicate the comparison to control and QT-treated cells.
Medicina 55 00114 g006
Figure 7. MDA content, ROS levels (DCF formation) and antioxidant enzyme activity in the MCF-7 cells. Values are expressed as mean ± SD. * p < 0.05, ** p < 0.00, p < 0.05, †† p < 0.01; * and symbols respectively indicate the comparison to control and QT-treated cells.
Medicina 55 00114 g007
Table 1. Formulations of QT-SLN.
FormulationDrug-Lipid RatioQT (mg)Compritol (mg)Tween 80 (mL)EE (%)LD (%)
QT-SLN11:15050667.6 ± 4.319.7 ± 2.6
Blank-SLN1--506--
QT-SLN21:350150678.4 ± 4.821.5 ± 2.9
Blank-SLN2--1506--
QT-SLN31:550250689.3 ± 5.827.3 ± 3.9
Blank-SLN3--2506--
QT-SLN41:1050500697.6 ± 2.328.3 ± 3.8
Blank-SLN4--5006--
QT-SLN51:1550750698.9 ± 1.128.6 ± 4.1
Blank-SLN5--7506--
Results are given as mean ± SD (n = 3). SD: standard deviation, LD: loading drug, EE: encapsulation efficiency.
Table 2. The IC50 (µmol/ mL) of QT, QT-SLN, and SLN on MCF-7 and MCF-10A cells after different exposure times.
TreatmentsCells12 h24 h48 h72 h
QTMCF-7
MCF-10A
86.7 ± 7.5
218.3 ± 16.9
73.8 ± 7.1
201.2 ± 16.3
41.5 ± 6.1 **
178.4 ± 14.6 *
40.2 ± 5.8 **
174.4 ± 15.1 *
QT-SLNMCF-7
MCF-10A
48.8 ± 4.3
198.5 ± 13.2
36.7 ± 3.5 *
182 ± 11.1
25.01 ± 2.4 **
176.8 ± 12.5
24.7 ± 2.7 **
171.3 ± 10.8
Blank-SLNMCF-7
MCF-10A
293.2 ± 18.4
288.3 ± 17.8
289.7 ± 18.1
283.4 ± 19.1
284.5 ± 16.4
282.7 ± 16.9
281.4 ± 16.8
278.6 ± 18.2
Values are expressed as mean ± SD (n = 5). * p < 0.05, ** p < 0.01, p < 0.05; * and symbols respectively indicate comparison to 12 and 24 h.
Table 3. Characteristics of the formulation of QT/Blank-SLNs.
FormulationDrug-Lipid RatioParticle SizePDIZeta Potential (mV)
QT-SLN11:145.5 ± 3.50.112 ± 0.01−1.8 ± 0.26
Blank-SLN1-45.1 ± 3.20.114 ± 0.02−1.1 ± 0.35
QT-SLN21:348.4 ± 3.90.118 ± 0.07−5.5 ± 1.12
Blank-SLN2-47.9 ± 4.10.123 ± 0.06−8.9 ± 1.33
QT-SLN31:558.3 ± 4.80.135 ± 0.07−12.6 ± 2.32
Blank-SLN3-56.1 ± 4.60.127 ± 0.06−13.9 ± 1.87
QT-SLN41:1085.5 ± 8.50.152 ± 0.04−22.5 ± 0.6
Blank-SLN4-84.7 ± 8.10.161 ± 0.05−23.6 ± 0.5
QT-SLN51:1599.6 ± 9.10.342 ± 0.04−18.9 ± 3.13
Blank-SLN5-98.8 ± 8.70.316 ± 0.11−20.3 ± 2.58
Results are given as mean ± SD (n = 3). SD: standard deviation, PDI: polydispersity index.
Table 4. The results obtained from MTT assay, colony formation and Annexin V/PI method in MCF-10A cells.
GroupsControlBlank SLNQTQT-SLNs
Viability (%)100.0 ± 0.02100.1 ± 0.09101.2 ± 1.8104.3 ± 2.1
Colony numbers (%)1.42 ± 0.141.29 ± 0.221.38 ± 0.181.43 ± 0.12
Early apoptosis (%)3.12 ± 0.562.96 ± 0.32 3.14 ± 0.622.87 ± 0.35
Late apoptosis (%)2.57 ± 0.252.61 ± 0.252.26 ± 0.232.09 ± 0.15
Necrosis (%)1.27 ± 0.081.01 ± 0.131.23 ± 0.051.26 ± 0.04
Values are expressed as mean ± SD (n = 6).
Table 5. The oxidative stress results in the MCF-10A cells.
GroupsControlBlank SLNQTQT-SLNs
MDA (nmol/mg protein)0.042 ± 0.000.043 ± 0.000.041 ± 0.000.036 ± 0.00
CAT (U/mg protein)130.3 ± 0.00129.4 ± 6.51131.7 ± 8.34135.5 ± 9.13
SOD (U/mg protein)13.71 ± 3.2113.63 ± 3.0813.86 ± 3.6813.95 ± 4.05
ROS (% of control)100 ± 0.0099.72 ± 0.2199.84 ± 0.3199.47 ± 0.29
Values are expressed as mean ± SD (n = 6).

