Abstract
Triglycine sulfate (TGS) single crystals doped with croconic acid (CA) were grown by evaporation from aqueous solutions. X-ray diffraction analysis shows a slight reduction in unit cell volume in TGS:CA compared to pure TGS crystals. The polarized Raman and near-infrared absorption spectra show that the positions of most lines resulting from inter- and intramolecular vibrations are in good agreement with those in spectra of undoped TGS crystals. The inclusion of CA in TGS is confirmed by the presence of bands characteristic of CA in the infrared-Fourier transform spectra. The ultraviolet-visible absorption spectra of TGS:CA are characterized by the presence of additional absorption bands (compared to the spectra of pure TGS) located in the transparent region of pure TGS. In the photon energy region 1.6–3.6 eV, a strong “green” luminescence band is present in TGS:CA upon excitation at λ = 325 nm. The position of the emission band depends on the wavelength of the exciting light. Doping of TGS with CA causes pinning of domain walls, which is accompanied by a decrease in amplitude and frequency dispersion of the dielectric anomaly at the phase transition, a decrease in the switchable polarization and an increase in the coercive field of hysteresis loops.
1. Introduction
Triglycine sulfate (TGS), (NH2CH2COOH)3⋅H2SO4, is a well-known above-room temperature (Tc~49 °C) ferroelectric, discovered in 1956 by B.T. Matthias et al. [1]. Its chemical composition includes the protein amino acid glycine, NH2CH2COOH which refers TGS to a large class of semiorganic crystals containing amino acids [2]. Second-order ferroelectric phase transition P21/m (11)→P21 (4) in TGS is accompanied by a strong anomaly of the dielectric constant (εb~103–105) [3], and nonlinear dielectric susceptibilities of the second (~4 × 10⁻³ m/V) and third (~4 × 10⁻⁶ m2/V2) order [4,5]. In the vicinity of phase transition temperature Tc, the TGS crystals exhibit high values of pyroelectric coefficient 5.5 × 10⁻⁴ C·m−2·K−1 (T = 35 °C) [6]. They are widely used in the production of pyroelectric detectors, thermal imaging devices, room temperature (RT) infrared (IR) detectors, transducers and sensors, etc.
TGS single crystals were synthesized by evaporation from an aqueous solution or slow cooling method. An addition to the solution of a small amount of different aqua-soluble substances makes it possible to get doped TGS single crystals and films. Incorporation of doping atoms or molecules in TGS crystal lattice can be successfully used for achieving a “unipolar” ferroelectric state [7,8,9] in TGS, improving their nonlinear optical [10], pyro- and piezoelectric properties [11,12,13], etc. At present in the literature, there is information about TGS crystals doped with metal ions and nanoparticles [14,15,16], amino acids [9,17,18,19,20,21,22], organic acids [23,24,25,26,27], inorganic acids and salts [13,28,29,30,31,32,33,34]. Doping of TGS with various organic molecules with a dipole moment from 4 to 6 Debye shows that the greater the dipole moment of the impurity molecule, the higher the spontaneous polarization Ps and the pyroelectric coefficient p of the doped crystals. At RT, the Ps and p of the doped crystals were found to be 5–15% higher than in pure TGS [3,35].
Among other organic acids, croconic acid (CA), C5O5H2, attracts special attention for several reasons. A pentagonal mono-cyclic molecule of CA consists of the oxocarbonic anion C5O52− connected with two hydrogen ions. The anion exhibits aromaticity, stabilized by electron delocalization of π electrons around the ring. The CA molecule is characterized by a flat topology and a large value of the electric dipole moment (~9 Debye [36]). Due to its relatively small size (~0.5 nm), it can be incorporated into various crystal structures and affect the structural, optical and dielectric properties of the host substance.
Croconnic acid crystallizes in a non-centrosymmetric structure (sp.gr. Pca21 (29)). CA crystals are above-RT ferroelectrics with the highest spontaneous polarization (Ps ≈ 30 μC/cm2) among other organic ferroelectrics [37,38]. Due to the non-centrosymmetric crystal structure, CA crystals and films exhibit a strong second-order optical nonlinearity [39]. CA derivatives such as croconines can be used as acidochromic dyes for the near-IR region [40] or considered as visible absorbing croconium dyes [41]. Thin films of croconium dye recently synthesized can be presumedly used in organics solar cells [42]. The incorporation of CA into the polymer [Ag4(C5O5)2(H2O)2]n results in the appearance of green luminescence, which is absent in both CA crystals and the polymer [43]. Thin films of CA and above-RT ferroelectrics benzimidazole (BM) may be combined into a two-dimensional (2D) structure described by the centrosymmetric symmetry group indicating that BM and CA dipole moments compensate for each other [44].
Thus, CA looks interesting as a doping agent, which can significantly change the properties of a host ferroelectric crystal. The purpose of this work was to grow single crystals of TGS doped with CA (TGS:CA) and study their structural, optical and dielectric properties.
2. Materials and Methods
Doped TGS crystals (TGS:CA) were grown from aqueous solutions of nominally pure TGS and CA single crystals. Pure TGS crystals were obtained by evaporation from an aqueous solution of sulfuric acid H2SO4 and amino acid glycine NH2CH2COOH in a ratio of 1:3. CA crystals were prepared from the CA reagent (Alfa Aesar, Heysham, UK, B21809, 98% purity) according to the procedure described in [45].
TGS:CA crystals have been grown from aqueous solutions with three different mass ratios of TGS to CA components: 98:2, 90:10 and 80:20. In the following, such samples will be referred to as TGS:CA (98:2), TGS:CA(90:10) and TGS:CA (80:20).
Images of TGS, CA, TGS:CA crystals and TGS:CA film with different nominal CA content are shown in Figure 1. It is evident that the higher the concentration of CA in the TGS:CA crystals, the more intense their color. Unlike colorless TGS (Figure 1a), TGS:CA crystals (Figure 1c,d,e) have a yellow color characteristic of CA crystals (Figure 1b), powders, and solutions. The most intensive colors have TGS:CA (80:20) crystals (Figure 1e), slightly yellow TGS:CA (98:2) (Figure 1c), and intermediate TGS:CA (90:10) (Figure 1d). TGS:CA (80:20) films with a thickness of d ≈ 5 μm were prepared by evaporation of an aqueous solution of TGS and CA onto α-Al2O3 sapphire substrate with an interdigital system of gold electrodes (Figure 1f). The analysis of film images observed in a polarizing microscope in reflection mode shows that the films consist of single-crystal blocks with dimensions of ~40 μm.
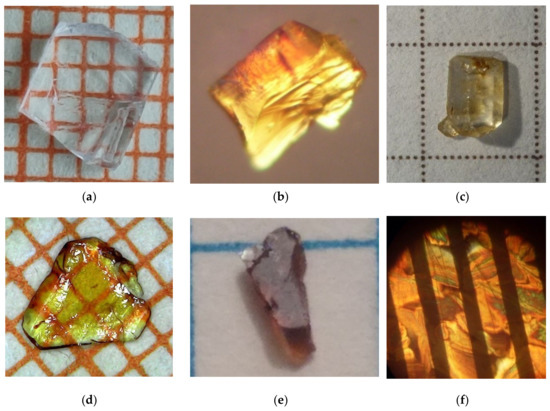
Figure 1.
Images of (a) TGS and (b) CA crystals used for the growth of TGS:CA crystals and films. (c) TGS:CA crystals grown from aqueous solution of TGS and CA (TGS:CA (98:2), (d) TGS:CA (90:10), (e) TGS:CA (80:20)). (f) TGS:CA (80:20) film grown by evaporation on α-Al2O3 substrate with an interdigital system of electrodes. Black bands in (f) are the regions between gold electrodes. The distance between electrodes ≈ 40 μm.
2.1. Single Crystal XRD
XRD studies of TGS:CA (80:20) single crystals were carried by a Bruker D8 Venture setup at RT using Mo-Kα radiation (Kα1 + Kα2, 50 kV, 30 mA) in the Harbin Institute of Technology, China. TGS:CA (90:10) crystals were examined at the Resource Center "X-ray Diffraction Methods" of St. Petersburg State University using Bruker Kappa APEX II DUO diffractometer operated at 45 kV and 0.6 mA (microfocus tube) and equipped with a CCD area detector. For a single crystal XRD experiment, suitable crystals were fixed on a micro mount and were measured at RT using monochromatic Mo-Kα radiation. The structures have been solved by the direct methods by means of the SHELX program [46] incorporated in the OLEX2 program package [47]. The carbon and nitrogen-bound H atoms were placed in calculated positions and were included in the refinement in the ‘riding’ model approximation. Empirical absorption correction was applied in the CrysAlisPro program complex (CrysAlisPro, Agilent Technologies, Yarnton, UK, Version 1.171.36.32) using spherical harmonics, implemented in the SCALE3 ABSPACK scaling algorithm. Supplementary crystallographic data have been deposited in the Cambridge Crystallographic Data Centre (CCDC) (2164627–2164628) and can be obtained free of charge via www.ccdc.cam.ac.uk/data_request/cif (accessed on 8 April 2022).
2.2. Powder XRD
Powder samples of TGS and TGS:CA (90:10) were prepared by grinding the grown crystals in a corundum mortar. Powder XRD measurements were carried out utilizing a D2 Phaser X-ray powder diffractometer (Bruker AXS, Karlsruhe, Germany). Radiation of an X-ray tube with a copper anode filtered by a Ni Kβ filter (Cu-Kα radiation) was used. XRD patterns were recorded using a semiconductor linear X-ray detector LYNXEYE (Bruker AXS, Karlsruhe, Germany).
In the measurements, low-background sample holders prepared from a single-crystal substrate with the Si(119) orientation were applied for TGS powder. Due to the small amount of powder, TGS:CA (90:10) powder samples were prepared on a glass substrate mounted on a plasticine pillow, which made it possible to adjust the height of the sample setting in the focal plane of the diffractometer.
The measurements were carried out in a symmetric scanning mode θ-2θ in the vertical Bragg-Brentano θ-θ geometry. To reduce the influence of the possible effect of the preferred orientation of crystallites, during measurements the sample was rotated around the axis of the holder, which coincided with the axis of the diffractometer goniometer. The temperature during the measurements in the sample chamber was 313 ± 1 K.
X-ray phase analysis of diffraction patterns was carried out in the EVA program (Bruker AXS, Karlsruhe, Germany) [48] using a powder PDF-2 (Powder Diffraction File-2) database [49]. Theoretical XRD patterns were calculated using the PowderCell program [50]. The parameters of XRD reflections with Miller indices hkl (their angular positions 2θhklobs, full widths at half-maximum FWHM, integral Iint and maximum Imax reflection intensities) were determined using the EVA program. After introducing angular corrections obtained from additional measurements of the powder sample mixed with the Si640f XRD powder standard (NIST, Gaithersburg, MD, USA) the unit cell parameters of the crystalline phase recorded in the samples were calculated from corrected 2θhkl of the indexed reflections by the least-squares method using the Celsiz program [51]. The obtained unit cell parameter values were used as starting points in the Rietveld analysis of the samples.
To estimate microstrains εs and crystallite sizes D, the methods of profile analysis of XRD lines were used, namely, Williamson-Hall plots (WHP) were constructed according to the procedure modified for reflections of the pseudo-Voigt (pV) type [52] observed in the XRD experiment. In the absence of microstrains (εs = 0), the crystallite sizes D were estimated by the Scherrer formula using the Scherrer coefficient KScherrer = 0.94 for each observed reflection and averaged over the entire set of observed reflections by the least-squares method. Classification of the type of XRD reflections, constructing WHP graphs, and calculation of the averaged sizes of crystallites averaged by the least-squares method over the entire set of observed reflections were carried out using the SizeCr program [53].
To confirm the single-phase composition and obtain refined values of the unit cell parameters of crystalline phases and sizes of nanocrystallites, powder XRD patterns were analyzed by Rietveld fitting of calculated XRD patterns to experimental ones using the Rietveld program TOPAS [54]. The starting coordinates of the atoms of the structures for the Rietveld analysis were taken from the CCDC and from the literature.
The XRD patterns fitting was carried out using instrumentally using widened XRD reflection profiles calculated from the geometry and the diffractometer slits used (FP (first principles) profiles in the TOPAS program), and supposing that the broadening of the reflections occurs only due to the size of the crystallites D, which made it possible to refine the average value of D. To compare the obtained values of D with those estimated by the SizeCr program, the same Scherrer coefficient KScherrer = 0.94 was used for calculations in the Scherrer equation during Rietveld refinement, as for SizeCr. Assuming no broadening of reflections due to microstrains, based on the results obtained when constructing WHP graphs, microstrains were not included in the refinement.
Refinement of the parameters of the preferred orientation of crystallites along the crystallographic directions in the March-Dollase model [55] was performed (directions [010] and [10-1] of the monoclinic TGS:CA structure led to a decrease in the weighted profile factor of agreement Rwp by ~4% for the TSG:CA sample and ~10% for TGS, where the effect of preferential orientation was greater). The influence of other directions of preferential orientation was corrected using the 8th-order spherical harmonics model [56], which led to a further decrease in Rwp by ~1 and ~2% in TGS:CA and TGS samples, respectively.
The atomic coordinates in the Rietveld fitting were not refined. In addition to the unit cell parameters, from the structure parameters, only the isotropic temperature factors of atoms were refined. The values of the overall temperature factors Bisoov were refined for each atom sort. The estimated standard deviations (e.s.d.s) calculated in Rietveld programs are usually underestimated due to serial correlations between adjacent data points. Verification of the presence of serial correlations and calculation of the coefficient me.s.d., correcting by multiplication the standard deviations obtained in TOPAS, were performed using the program RietEsd [57], written on the basis of the procedure from Ref. [58]. The drawings of the structure were made using the Vesta program [59]. Further details of the XRD experiment, WHP XRD line analysis and Rietveld refinement are the same as published elsewhere [60,61].
Raman spectra of the TGS:CA single crystals were studied using a T64000 spectrometer (Horiba Jobin–Yvon, Paris, France) equipped with a confocal microscope and a silicon charge-coupled device (CCD) cooled by liquid nitrogen. Polarized micro-Raman measurements were performed at RT, in the spectral range 5–4000 cm−1 in different backscattering geometries: −Z(XX)Z, −Z(YY)Z, and −Z(XY)Z. Here, the Z-axis is oriented normally to the crystal surface (100), and X and Y are along ñ*- and b-crystal axes, respectively. A 532 nm (2.33 eV) Nd:YAG laser (Torus, Laser Quantum, Inc., Stockport, UK) was used as the excitation source. The laser power on the samples was as low as 25–80 µW (with a light spot size of ~1 µm in diameter) to avoid sample heating. We used 1800 lines/mm grating and a 100× (NA = 0.90) objective lens to measure Raman spectra. In the low-frequency spectral region, the Rayleigh line was suppressed using three BragGrate notch filters (OptiGrate Corp., Oviedo, FL, USA) with an OD = 4 and a spectral bandwidth < 0.3 nm.
The micro-photoluminescence (µ-PL) measurements were carried out in a temperature-controlled microscope stage Linkam THMS600 (Linkam Sci. Inst. LTd., Redhill, UK). The line (λ = 325 nm, E = 2.81 eV) of a HeCd laser (Plasma, Ryazan, Russia) was used for PL excitation. We used 600 lines/mm grating and a large working distance lens (Mitutoyo 50× UV (NA = 0.40)) with a light spot size of ~2 µm and power density of 6 kWt/cm−2 on a sample to measure µ-PL. In addition to the ultraviolet (UV) light excitation, lasers operating at 405 nm and 532 nm were used to excite PL. In this case, the spectra were recorded using a double monochromator with diffraction gratings of 1200 lines/mm, equipped with a photon-counting system.
Measurements of the IR absorption spectra (Fourier-transform infrared (FTIR) spectra) were carried out using an IR-Fourier spectrophotometer IRPrestige-21 with an IR microscope AIM-8000, both in the specular reflection mode and in the transmission mode, followed by the Kramers–Kronig transformation. The results were then converted to absorbance. The measured spectral range was from 650 to 5000 cm−1.
Absorption spectra in the UV-visible (UV-Vis) range were obtained using a UV-3600i Plus UV-Vis-NIR spectrophotometer (Shimadzu Corp., Kyoto, Japan) at RT in the wavelength range of 200–2000 nm. The test was conducted in reflection mode using an integrating sphere. BaSO4 was used as a reference sample.
Measurements of capacity and dielectric losses in TGS:CA (98:2) crystals were performed in the frequency range of 120–105 Hz and temperature interval 297–340 K with LCR-meters MIT 9216A (Protek, Seattle, WA, USA) and E7-20 (MNIPI, Minsk, Belarus), using the LabView software package (Version 2011, NIST, Gaithersburg, MD, USA). Silver glue was used for preparing the electrodes on the (010) faces of the crystals. Dielectric hysteresis loops were measured in the Sawyer–Tower circuit. A sinusoidal electric field from a G3-123 oscillator and a TREK 2200 (Trek Inc., Denver, CO, USA) amplifier was applied to the crystals. The measurements were carried out at a frequency range of f = 50 Hz at RT. The signal was taken from a 0.1 μF reference capacitor and recorded with a GDS-71062A digital oscilloscope. Measurements of capacity and dielectric loops in TGS:CA (80:20) films, grown on α-Al2O3 sapphire substrates, were carried out using an interdigital system of gold electrodes deposited on the substrate by photolithography.
3. Results and Discussion
3.1. Single Crystal XRD Analysis
Crystal data and structure refinement details of TGS:CA crystals obtained by single-crystal XRD are summarized in Table 1. Crystal structure of TGS:CA is presented in Figure 2. Coordinates of atoms and their equivalent isotropic/isotropic temperature factors Ueq/Uiso, bond lengths, and bond angles according to the results of the single-crystal refinements are presented in Supplementary Materials (Tables S1.1–1.6). Monoclinic crystal system and space group of TGS:CA are the same as nominally pure TGS crystals. With an increase in CA nominal content in TGS:CA crystals from 10% to 20% (Table 1), the unit cell volume of TGS:CA crystals exhibits an observable decrease from V = 642.9 Å3 to 638.5 Å3.

Table 1.
Details of crystal data and structure refinement of single crystals.
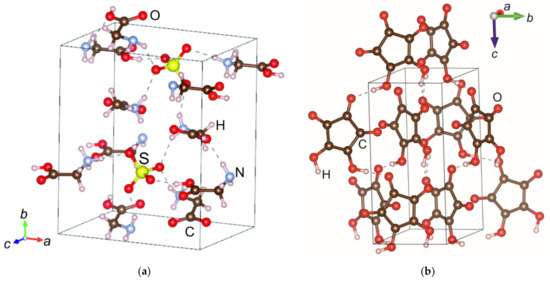
Figure 2.
(a) TSG:CA (90:10) and (b) CA crystal structures. For TSG:CA structure (a) see space group and unit cell parameters in Table 1. The sizes of the voids in the TSG-like structure are ~0.6 × 1.1 nm. CA crystal structure (b) is characterized by the space group Pca21 (29) and unit cell parameters a = 8.7108 Å, b = 5.1683 Å, c = 10.9562 Å [37]. The maximum size of CA molecules is ~0.5 nm.
It is interesting to compare bond lengths and bond angles in TGS:CA (80:20) and TGS:CA (90:10) structures (Supplementary Materials Tables S1.5 and S1.6). TGS unit cell contains two formula units (Z = 2), each consisting of an SO4 tetrahedron and three glycine molecules. Two of them, GlyI and GlyIII, are glycinium ions N+H3CH2COOH, and the third is a zwitterion N+H3CH2COO−. Bond angles α, β, γ, and φ of the glycine molecule are schematically shown in Supplementary Materials (Figure S1.1). Table 2 presents bond angles for GlyI, GlyIII and GlyII ions in TGS:CA (80:20) and TGS:CA (90:10) structures obtained using single-crystal XRD data.
Table 2.
Bond angles of Gly ions GlyI, GlyIII and GlyII in TGS:CA (90:10) and TGS:CA (80:20) structures obtained using single-crystal XRD data.
It is clearly seen that the bond angles α, β, γ, and φ are practically the same for the glycinium ions GlyI and GlyIII and change very little with increasing CA concentration. The bond angles of the GlyII zwitterion in TGS:CA (90:10) differ significantly from those of GlyI and GlyIII. Note that in TGS:CA (80:20) this difference is noticeably smaller. Thus, it can be concluded that with increasing CA concentration, the bond angles α, β, γ, and φ of the zwitterion approach the angles of glucinium ions.
It should be noted that the GlyI and GlyIII ions include a COOH hydroxyl group, in contrast to the zwitterion, which includes a charged COO- group. One can propose that CA molecules introduced into TGS by doping can be linked to the zwitterion by hydrogen bonds, and the appearance of a hydrogen ion near the zwitterion brings its structure closer to GlyI and GlyIII ions. It can be assumed that CA molecules introduced into TGS by doping can bind to the zwitterion by hydrogen bonds and bring the structure of the zwitterion closer to the glycinium ions GlyI and GlyIII. This phenomenon is accompanied by a change in the bond angles in this ion to the values in glycinium ions.
A decrease in the unit cell volume of TGS due to CA doping, mentioned above, is accompanied also by a decrease in bond lengths in glycinium ions and the zwitterion. The maximal decrease is observed in GlyII zwittyrion for NI–CNI, CI–CNI and OI–CNI bonds ~1.4%, 0.84% and 0.8% correspondingly, which confirms the conclusion about the preferable connection of CA molecules with zwitterion.
3.2. Powder XRD Analysis
3.2.1. X-ray Phase Analysis
X-ray phase analysis showed that samples TGS and TGS:CA (90:10) contain only one crystalline phase of the TGS structure type. Comparison of the measured and theoretical XRD patterns of the TSG crystalline phase showed some influence of the effects of the preferred orientation of powder crystallites, leading to an increase in the intensity of some XRD reflections, somewhat stronger in the case of the TSG sample (Figure 3). The XRD pattern of TGS:CA powder shows the XRD reflections and amorphous halo due to the contribution of the glass substrate used.
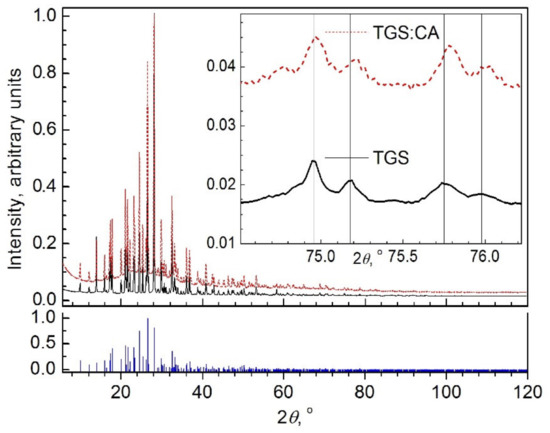
Figure 3.
Normalized XRD patterns of TGS and TGS:CA (90:10) powders. The inset illustrates the shift in the positions of the TGS:CA reflections in comparison with the TGS. Below is a theoretical diagram of independent reflections shown by vertical bars. The angular position and the relative intensity of the reflections are calculated theoretically from the structural model [62]. The height of each line is proportional to the theoretical relative intensity of the corresponding reflection.
3.2.2. Microstructure Parameters from the Analysis of the Profiles of XRD Reflections
The crystal-chemical examination of the TGS and Croconic acid structures shows that planar CA molecules with a maximum size of ~0.5 nm (Figure 2b) can be located in the pores of the TGS structure which are up to ~0.6 nm × 1.1 nm in size (Figure 2a). If the inserted CA molecules are disordered, the TGS structure and, correspondingly, the XRD pattern does not change, which is exactly what is observed (Figure 3). Only a slight change in the parameters of the unit cell is expected, resulting in the displacement of the angular positions of the TGS:CA reflections in comparison with the TGS reflections (see inset in Figure 3 as an example). Since the Bragg angles of the TGS:CA reflections shift towards larger values in comparison to the TGS reflections, a decrease in the TGS:CA unit cell parameters are expected.
Another consequence of introducing the CA molecules into the TGS pores may be the appearance of microstrains in the TGS:CA nanocrystallites, leading to an additional broadening of reflections. It was found that the XRD reflections observed in the XRD patterns of all samples are characterized by the ratio of full width at half maximum to integral width, lying in the range 0.637 ≈ 2/π < FWHM/Bint < (4·ln(2)/π)1/2 ≈ 0.939, i.e., they are reflections of pV type. WHP graphs constructed for pV reflections (Supplementary Materials Figure S2.1) showed that there are no microstrains (εs = 0) in the TGS and TGS:CA (90:10) samples. The sizes DSizeCr of crystallites averaged over the values calculated by the Scherrer formula independently for each observed reflection are close in TGS and TGS:CA (90:10) crystallites (see Table 3).
Table 3.
Final agreement factors were obtained as a result of the Rietveld fitting of the calculated diffraction patterns to the experimental ones (cRwp and cRp factors are given according to RietESD program calculations). Coefficients me.s.d. for corrections of e.s.d.s of refined parameters obtained by the Rietveld method, crystallite sizes obtained using the SizeCr program (DSizeCr) and the Rietveld method (DTOPAS).
3.2.3. Rietveld Analysis
As starting structure models, the atomic coordinates of TGS from Ref. [62] and coordinates of atoms from the single-crystal refinement of TGS:CA (90:10) in the current work were used in the Rietveld refinement.
The satisfactory quality of the Rietveld fit is illustrated graphically in Figure 4. Despite the fact that the atomic coordinates of the starting structural models were not refined, the achieved agreement factors (weight profile Rwp and profile Rp factors as well as the profile weight profile cRwp and cRp factors after subtracting the background contribution, and the agreement Bragg factors RB, reflecting the consistency of the structure and model) [63] (Table 3) have rather low values, indicating a satisfactory fit.
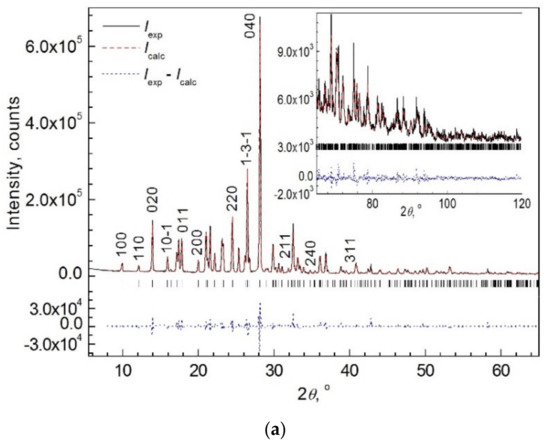
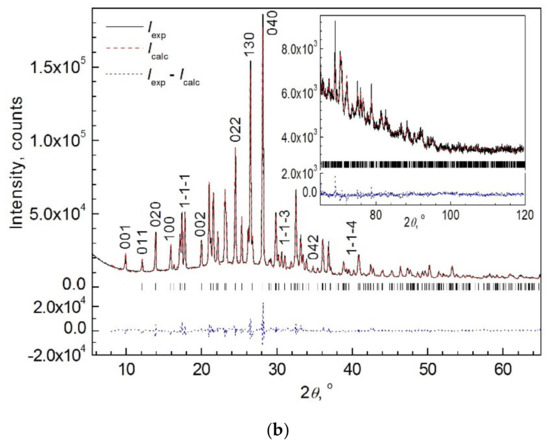
Figure 4.
Rietveld fit results for (a) TGS and (b) TGS:CA (90:10). The Miller indices hkl of some selected non-overlapping reflections are indicated. Insets in (a,b) show the high angle regions of the XRD patterns.
The sizes of crystallites DTOPAS, obtained by refinement in the Rietveld TOPAS program, are given in Table 3. They agree well with the DSizeCr values obtained by the SizeCr program.
Comparison of TGS unit cell parameters obtained in Rietveld fitting of TGS and TGS:CA (90:10) crystals studied in this work are presented in Table 4. The values of the unit cell parameters obtained by means of the program Celsiz differ from the values presented in Table 4 in limits of one-two e.s.d.s only.
Table 4.
TGS (space group P21 (4)) and TSG:CA(90:10) unit cell parameters obtained in this work by Rietveld fitting of calculated diffraction patterns to experimental ones a.
The unit cell parameters of the TGS and TGS:CA (90:10) samples are somewhat different, which reflects the incorporation of CA molecules into the pores of TGS:CA. Apparently, small CA molecules constrict the pores of the TGS structure and induce a slight decrease in the unit cell parameters of TGS:CA (90:10) in comparison to TGS resulting in a decrease in the unit cell volume from 643.8(1) Å3 in TGS to 642.6(1) Å3 in TGS:CA (90:10) (comparison is given for the data obtained in this work at the same measurement temperature and the same synthesis procedure of the crystals). Thus, the data obtained by powder XRD demonstrate the same trend of the volume decrease with the incorporation of CA molecules as in the study of single crystals. In particular, the values obtained for TGS:CA (90:10) in single crystal and powder investigations are close (cf. Table 1 and Table 4).
The refined values of the isotropic temperature factors Uisoov, common for each type of atom, obtained in the refinement, are given in Table 5.
Table 5.
Isotropic temperature factors Uisoov (Å2) common for each type of atom (e.s.d.s given in parentheses are not corrected for the coefficient me.s.d.).
Table 6 summarizes unit cell parameters (a, b, c and monoclinicity angle β) in TGS, TGS:CA (90:10), and TGS:CA(80:20) crystals and relative changes of the parameters caused by CA doping according to single crystal and powder XRD experiments. It is seen that the incorporation of CA molecules results in a relatively small decrease in unit cell volume (~0.2% in TGS:CA (90:10) and ~ 0.8% in TGS:CA (80:20)). Unit cell parameters a, b, and c in TGS:CA (80:20) are decreased as compared with TGS by ~ 0.3% and monoclinicity angle β by ~ 0.2%. Note that a decrease in the unit cell parameters was also observed in TGS crystals doped with organic molecules of crystal violet having the molecular formula C25H30N3Cl [33].
Table 6.
Unit cell parameters of TGS, TGS:CA (90:10) and TGS:CA (80:20) crystals and relative changes of parameters caused by CA doping according to single crystal and powder XRD experiments.
3.3. Raman Spectroscopy
The Raman spectra of nominally pure TGS and CA crystals used to prepare TGS:CA crystals consist of a series of lines ≾ 10 cm−1 wide, located in the range of 50–3200 cm−1. The spectra obtained are in good agreement with those known from the literature [10,25,26,27,28,64,65]. Figure 5 shows a comparison of Raman spectra of nominally pure TGS used for the growth of TGS:CA single crystals from aqueous solution, and TGS crystal doped with croconic acid, TGS:CA (90:10).
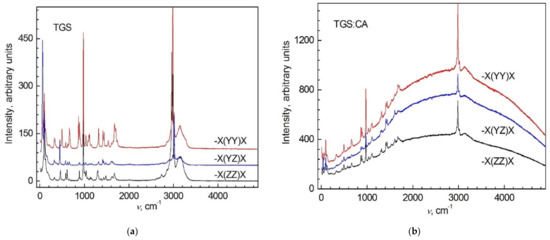
Figure 5.
Polarized Raman spectra of (a) pure TGS and (b) TGS:CA (90:10) single crystals for excitation at λ = 532 nm. For convenience, the spectra for different polarizations are shifted along the vertical axis.
The polarized Raman spectra of TGS:CA crystals consist of a large number of lines almost identical to those observed in nominally pure TGS. The manifestation of these lines is associated with molecular vibrations in the molecules of glycine and sulfuric acid (see Table 7). Doping of TGS crystals with CA leads to the loss of translational symmetry in TGS:CA solid solutions. For this reason, one would expect a noticeable broadening of the lines in TGS:CA Raman spectrum [66]. However, no significant difference in line widths in Figure 5a,b is observed. Thus, a spatial disorder intrinsic to solid solutions does not significantly affect the Raman spectrum of TGS:CA crystals. It should be noted that the Raman scattering lines in TGS:CA are observed against the background of luminescence, which manifests itself in a wide spectral region and is absent in pure TGS.
Table 7.
Positions of lines (ν, cm−1) observed in Raman and FTIR spectra of TGS and TGS:CA (90:10) crystals and their assignments.
3.4. FTIR
Comparison of FTIR absorption spectra of TGS:CA (90:10) and pure TGS in the spectral range of 800–3500 cm−1 are presented in Figure 6a. Most of lines observed in the TGS:CA crystal correspond well to those in pure TGS [13,15,19,25,32,33]. Figure 6b shows absorption spectrum of TGS:CA for ν = 4000–4800 cm−1. Table 7 lists the lines observed in the Raman and FTIR spectra of TGS and TGS:CA crystals and their interpretation.
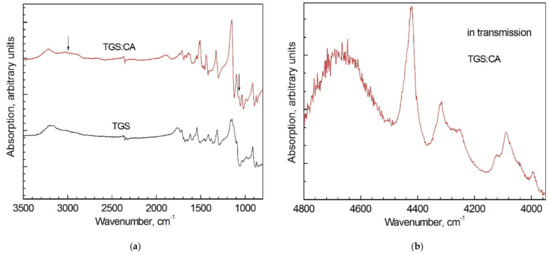
Figure 6.
FTIR absorption spectra in (a) TGS:CA (90:10) and TGS crystals in spectral range ν = 800–3500 cm−1 and (b) TGS:CA (90:10) for ν = 4000–4800 cm−1. Arrows in (a) indicate the absorption regions caused by CA molecules. For better visualization, the spectra in (a) are shifted along vertical axis.
The nature of the observed bands in the Raman and FTIR spectra is related to the motion of atoms in various groups that make up the crystal. In particular, the following can be noted:
NH3+ group. A broad band at 3182 cm–1 in the IR spectra of samples in pure and doped TGS crystals appears due to symmetric stretching vibrations in the NH3+ group. The bending vibration of the δNH3+ group manifests itself at 512 cm−1, the rocking vibrations of γNH2 at 914 cm−1 [28].
COO− group. The bands at 1620 and 1415 cm–1 in the TGS sample are associated with antisymmetric and symmetric COO− vibrations, respectively, and indicate the presence of a zwitterion.
Carboxyl group. The band at 1715 cm−1 of medium intensity, due to the symmetrical stretching of the C=O bond, indicates the presence of a glycine molecule in the form of NH3+CH2COOH (glycine ion) [28].
SO42− group. The free SO42−-ion, having Td symmetry, has four main vibrations: a non-degenerate symmetric valence mode ν1(A1), a doubly degenerate bending (deformation) mode ν2(E), a three-fold degenerate asymmetric stretching mode ν3(F2) and a three-fold degenerate asymmetric bending mode ν4(F2). In the crystal, the SO42− ion occupies a site of lower positional symmetry C1. As a result of the absence of an inversion center in the TGS lattice (at RT, the symmetry of the crystal is P21 (4)) and low positional symmetry, the IR inactive modes ν1 and ν2 can become active, and the degeneracy of the ν2, ν3, and ν4 modes can be lifted [64]. The nondegenerate valence mode ν1 appears as a single band at 978 cm–1, the ν2 mode appears at 449 and 462 cm–1, the ν3 mode appears at 1043, 1096, and 1150 cm–1 and the ν4 mode appears at 613, 629, 634 cm–1 one.
It should be noted that the introduction of the CA molecules into TGS leads to the appearance of new absorption lines in the region of 4000–5000 cm−1 (photon energy Eph = 0.5–0.6 eV) (Figure 6b), which are absent in the absorption spectra of pure TGS and CA. The bands in the region of 0.5–0.6 eV are apparently associated with electronic transitions in impurity centers formed upon doping TGS with CA. The frequencies of fundamental vibrations of TGS and CA molecules do not exceed 4000 cm−1 (0.5 eV). The higher-frequency bands in the near-IR region with ν > 4000 cm−1, observed in the absorption of TGS:CA, may correspond to overtones or combination vibrations, the intensities of which in absorption spectra are determined by the degree of anharmonicity of the vibrations.
The IR Fourier spectra of CA crystals known in the literature show that strong absorption bands are observed in the intervals ν = 3300–2000 cm−1 and 1650–1050 cm−1 [67]. A wide absorption band within 3000–2800 cm−1 is related to the νOH stretching vibration of the strong hydrogen-bonded OH group. In TGS:CA, the broad band at 3020–2900 cm−1 can be attributed to the hydrogen-bonded OH group in CA (Figure 6a). The appearance of this band indicates that the CA molecules form hydrogen bonds with other molecules in the TGS. The band at 1065(8) cm−1 observed in TGS:CA crystals can be attributed to the bending vibrations of the C–O–H group of CA molecules. Thus, the analysis of Raman and IR spectra shows the presence of CA molecules in the TGS matrix.
3.5. UV-Vis Absorption
UV-Vis absorption spectra of nominally pure TGS crystal were presented in a number of works [10,21,22,33]. Colorless TGS crystals are transparent in a wide spectral range and significant optical absorption is observed only for photons with energies Eph ≥ 5.2 eV, which is manifested by a sharp increase in absorbance below λ = 230–246 nm. The spectral position of this sharp absorption edge determines the value of the optical bandgap of the crystal. The value of the optical bandgap Eg calculated from Tauc plots for direct allowed band-to-band transitions in different TGS samples lies in the region = 5.2–5.7 eV [21,22,33], but a much higher value of Eg = 6.7 eV has also been mentioned [10]. Presumably, the spread of the optical bandgap values is related to the quality of TGS crystals.
Figure 7a presents the UV-near IR absorption spectrum for TGS:CA (80:20) crystal. The doping of TGS with croconic acid is accompanied by the appearance of absorption in the transparent region of pure TGS. This absorption manifests itself in the form of a structured long-wavelength tail adjacent to the edge of the fundamental absorption of TGS, as well as an absorption in the IR region at λ = 1550–2000 nm. The traits of the absorption are clearly seen when considering the absorption in Tauc coordinates (αEph)2, Eph (Figure 7b) (where α is the absorption coefficient of the crystal). The shortest wavelength part of the absorption spectrum in region Eph = (6.0–6.2) eV in Figure 7b is well approximated by the linear dependence (solid black line), which can be regarded as the Tauc plot related to direct allowed interband transitions in crystals. The Tauc plot yields an estimation of the value of the optical bandgap as 5.2 eV, which is close to the Eg value in pure TGS (~5.2–5.6 eV [21,33]).
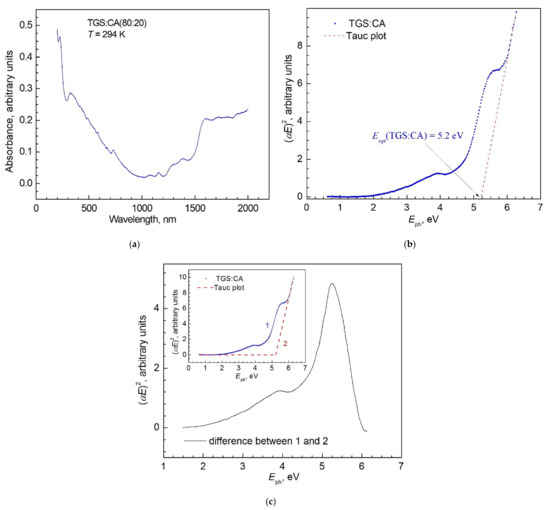
Figure 7.
(a) UV-Vis absorption spectrum of TGS:CA (80:20) crystal. (b) Fragment of the TGS:CA UV-Vis absorption spectrum (blue dots) in Tauc coordinates and direct allowed band gap Tauc plot (dashed red) related to the fundamental absorption edge of TGS:CA (80:20). (c) Structure of the TGS absorption is caused by the incorporation of CA molecules into the TGS crystal. Inset in (c) is presented for the explanation of calculations.
The presence of the additional absorption in the TGS:CA spectrum can be associated with electronic transitions involving defects in the TGS lattice induced by the introduction of CA molecules into TGS. The contribution of these transitions to the absorption spectrum can be estimated as the difference between the absorption spectrum of TGS:CA (line 1 in the inset in Figure 7c) and the fragment of its fundamental absorption spectrum modeled by the Tauc plot (line 2 in the inset in Figure 7c). The absorption spectrum thus obtained is shown in Figure 7c. It includes at least two absorption bands with maxima at ~5.2 and ~3.9 eV. The absorption band at ~5.2 eV can presumably be associated with the creation of excitons localized at the lattice defects, including impurity CA molecules or neighboring TGS ones.
Thus, the introduction of croconic acid (CA) impurity into TGS is not accompanied by a considerable optical-gap shift toward low energies, as has been observed when TGS was doped with various amino acids [21]. At the same time, the doping is accompanied by the appearance of new absorption bands in the transparent region of pure TGS, which are due to the transitions to localized electronic states with energies < Eg.
3.6. Photoluminescence
PL spectra of nominally pure TGS crystals have been described in a number of works [11,27,33]. Under UV excitation the emission spectrum consists of a broad asymmetrical band occupying the entire visible region, with a maximum at λ ≈ 440 nm (Eph ≈ 2.82 eV). The luminescence excitation spectrum exhibits a maximum around hνexc ≈ 4 eV (λexc ≈ 310 nm), which is significantly less than the TGS forbidden energy gap estimated as 5.6 eV [33]. These peculiarities of the luminescence of TGS indicate that it originates from optical electronic transitions involving TGS lattice defects with electron energy levels within the TGS forbidden gap. It is believed that in this situation the broad emission band is a result of the interaction between the electronic system of the luminescence centres and the vibrations of the atoms composing the centres and/or surrounding them [68].
Under 405 nm laser excitation the emission spectrum of pure TGS represents factually a fragment of the long-wavelength wing of the aforesaid emission band (Figure 8). The narrow line in Figure 8 is attributed to Raman scattering of light in the TGS crystal with the participation of the CH2 valence mode [64] (see also Table 7). So, the PL intensity is small and comparable to that of Raman lines.
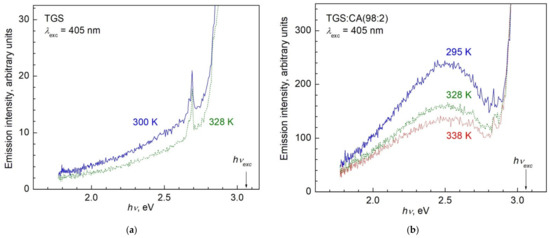
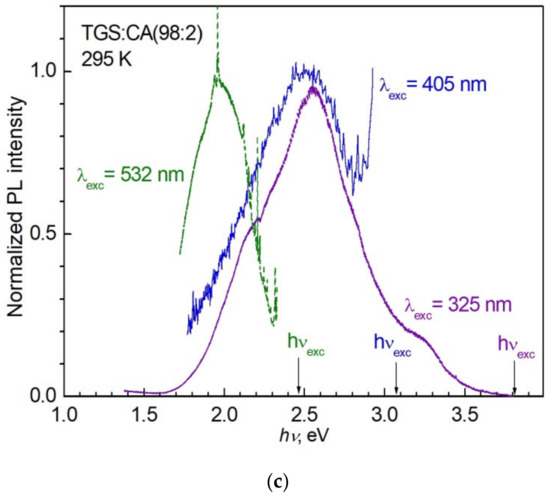
Figure 8.
PL spectra of (a) TGS and (b) TGS:CA (98:2) crystal under 405 nm (Eph = 3.06 eV) laser excitation at different temperatures (specified in the figure). (c) Normalized PL intensity of TGS:CA (98:2) crystal at a temperature of 295 K for excitation at λexc ≈ 532 nm, 405 nm and 325 nm.
CA crystals were found not to luminesce under 405 nm excitation in agreement with literature data [43]. Incorporating CA molecules in a TGS crystal imparts a yellow color to it, and the emission spectrum of the doped crystal changes markedly. The PL spectra in TGS:CA (98:2) under 405 nm excitation for different temperatures are presented in Figure 8b. In contrast to the TGS emission spectrum (Figure 8a), the TGS:CA (98:2) spectrum contains a well-defined broad emission band with a maximum at λ ≈ 500 nm (Eph ≈ 2.48 eV). It is natural to relate the change in the emission spectrum of TGS after its doping with CA to a change in the energy spectrum of the luminescence centers in TGS induced by the doping. As mentioned above, incorporating CA into a TGS crystal is expected to form new defects in the TGS lattice, which can be effective centers of radiative electron-hole recombination in the solid solution. The optical absorption of CA crystals is characterized by a strong maximum at ~3 eV [39]. For all that though, the luminescence of CA crystals is negligibly weak, as CA molecules embedded in TGS can be an effective absorbent of optical radiation with hν ~ 3 eV (~400 nm), whose energy can be transferred to neighboring luminescence centres. The large width of the emission band is likely to indicate that the emissive states of the luminescence centers in TGS:CA (98:2) form a set of closely spaced energy levels located within the band gap of the solid solution. An increase in the excitation wavelength reduces the number of the luminescence centers excited. This reduction is accompanied by a shift of the maximum of the luminescence band to the long-wavelength side (Figure 8c). Decrease in Eexcph from 3.81 eV (λ = 325 nm) to 2.33 eV (λ = 532 nm) results in a decrease in the PL maximum energy from 2.7 eV to 1.9 eV correspondingly.
When the temperature of TGS:CA (98:2) crystals increases above RT, the emission intensity decreases. Temperature dependence of emission intensity I(T) at the maximum of the emission band (λmax ≈ 507 nm) is presented in Figure 9a. Emission intensity approximately linearly decreases with temperature increase and does not reveal any noticeable anomaly at the ferroelectric phase transition which takes place according to dielectric measurements at Tc = 322 K (see Section 3.7 “Dielectric properties”). The increase in temperature also leads to a change in the shape of the emission spectrum. A relationship between luminescence intensities ratio at 295 and 338 K, I(T = 295 K)/I(T = 338 K), and emission photon energy illustrates this change (Figure 9b). As seen from Figure 9b an effect of the temperature quenching is maximal for the emissive states near the maximum of the emission band Eph ≈ 2.48 eV (λmax ≈ 507 nm) and decreases with a distance from the maximum, i.e., for emitters with λ < λmax and λ > λmax.
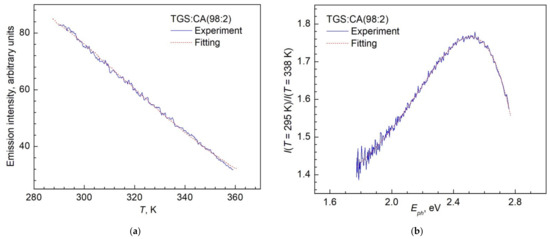
Figure 9.
(a) The PL emission intensity dependence on the temperature, I(T), at the maximum of the emission band (λmax = 507 nm (Eph ≈ 2.48 eV)). (b) Experimental relationship between fluorescence intensities ratio at T = 295 K and 338 K, I(T = 295 K)/I(T = 338 K) and photon energy (related to emission wavelength) for the excitation wavelength λexc = 405 nm (Eexcph ≈ 3.06 eV). Solid blue lines in panels (a,b) are experimental dependences and dotted red lines show the fits of the experimental data by Equation (3).
At low excitation intensity the PL emission intensity I is determined by the pump intensity Iexc and the ratio of the radiative τr and nonradiative τ0 lifetimes of the emissive state [69]:
Here, is the total lifetime of the emissive state. According to Equation (1), with increasing temperature, the emission is quenched due to a decrease in the nonradiative lifetime of the emissive state. A decrease in a nonradiative lifetime with an increase in temperature is probably due to the intensification of thermal molecular motion in TGS:CA crystals, which leads to the deactivation of the excited electronic states of luminescence centres via nonradiative vibrational relaxation of the electronic excitations. Within this approach [31], a relationship between the nonradiative lifetime of the excited state and temperature is given by the expression:
where EA is the activation energy of the nonradiative decay process of the excited state and B is a constant assigned to the probability of the nonradiative decay as T → ∞. Taking into account Equation (2) the Equation (1) may be written in the following form:
where C ≡ τr∙B. Figure 9b shows the results of approximation of I(T) experimental dependence for the emission wavelength of 507 nm by Equation (3). As can be seen from Figure 9b, good agreement between the experimental and theoretical dependences is observed. The fit gives the value of the activation energy EA = 293 ± 5 meV. This value characterizes the nonradiative decay processes of the states responsible for the emission at the maximum of the emission band.
Strong luminescence with its intensity approximately two orders of magnitude higher than that of both the Raman lines and luminescence of pure TGS crystal is observed when TGS:CA (90:10) crystals are excited with 325 nm light (E = 3.81 eV) (Figure 10). PL is observed in a wide photon energy range Eph = 1.6–3.5 eV with a maximum at Eph = 2.55 eV. Three bands can be distinguished in the PL spectrum at Eph = 2.13 eV, 2.55 eV and 3.03 eV (Figure 10), allowing at least three luminescence centers to be identified in TGS:CA. The relatively high PL intensity can be explained by the high concentration of CA-induced luminescence centers as well as the significant increase in light absorption at 325 nm in the TGS:CA (90:10) crystal compared to pure TGS. In addition, it is known that the appearance of hydrogen bonds in a crystal usually leads to a significant increase in its PL intensity. This mechanism may also work in TGS:CA crystals since FTIR spectra indicate the presence of hydrogen bonds of CA molecules.
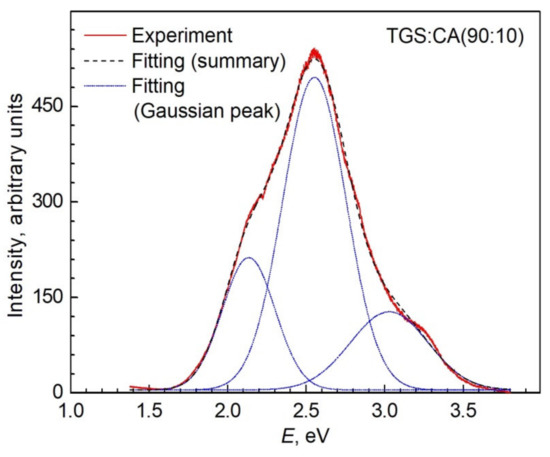
Figure 10.
PL spectrum of the TGS:CA (90:10) crystal upon excitation with λexc = 325 nm (Eexcph = 3.81 eV). The decomposition of the PL contour into three Gaussians with maxima at Eph = 2.13 eV, 2.55 eV, and 3.03 eV is shown.
3.7. Dielectric Properties
In TGS crystals, in the vicinity of the P21/m (11) → P21 (4) ferroelectric phase transition at the Curie temperature Tc ≈ 49 °C, the permittivity εb obeys the Curie–Weiss law (at T > Tc εb = C/(T–Tc), C ~ l03 K, εbmax ~ l03–l05) [3,13]. The temperature dependences of permittivity and dissipation tangent tg(δ) at various frequencies in the TGS crystals used in our work are shown in Figure 11a. The value of εbmax reaches ~ 6000. The value of spontaneous polarization at RT in these crystals is Ps ~ 2.8 C/cm2. As shown by numerous studies of the effect of various inorganic and organic impurities on the ferroelectric and pyroelectric properties of TGS crystals, the introduction of impurities usually leads to a decrease in switchable spontaneous polarization, an increase in the coercive field, and a decrease in the permittivity and losses, but can lead to an increase in the pyroelectric coefficient [3,13].
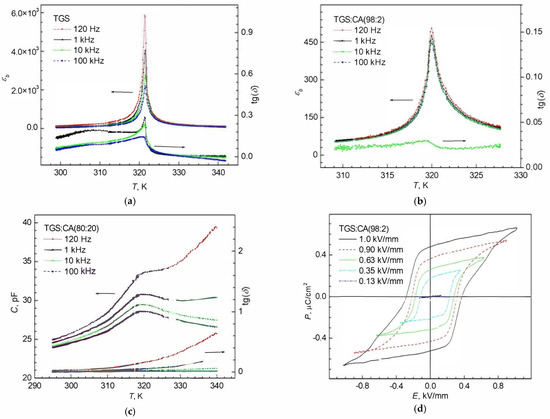
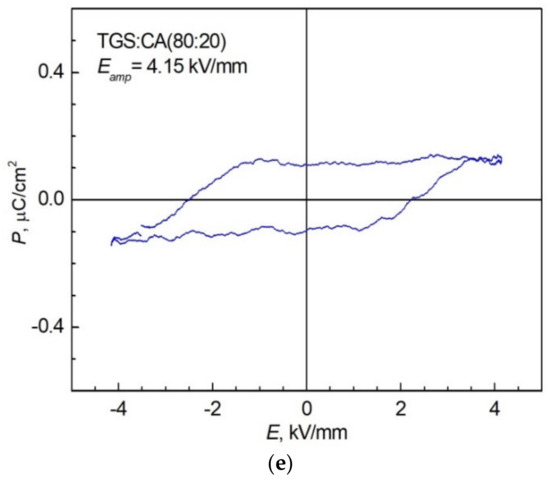
Figure 11.
Temperature dependences of permittivity εb and tg(δ) in (a) TGS and (b) TGS:CA (98:2) crystal. (c) Dependence of capacitance C and tg(δ) in TGS:CA (80:20) film. (d) Dielectric hysteresis loops for different values of electric field amplitude Eamp (indicated in (d)) at RT in a TGS:CA (98:2) crystal. (e) Dielectric hysteresis loop in TGS:CA (80:20) film for electric field amplitude Eamp = 4.15 kV/mm at RT.
In the present work, TGS crystals doped with CA molecules, which have a large dipole moment d ~ (9–10) Debye [36], were grown. The temperature dependences of the permittivity of a TGS:CA crystal grown from a solution with a weight content of 98:2 components are shown in Figure 11b. Compared to TGS, the dielectric anomaly in the phase transition region decreases (εbmax ~ 500) and has a weaker dispersion. The dielectric hysteresis loops in the TGS:CA (98:2) crystal (Figure 11d) make it possible to estimate the switchable polarization Psw ~ 0.5 μC/cm2, which is about five times less than in pure TGS. The coercive field in TGS:CA (98:2) is about four times larger than in TGS (~0.1 kV/mm). With an increase in the amplitude of the alternating field, the loop is distorted, which is associated with the removal of domain walls from defects and some increase in the switchable polarization.
These changes indicate that the introduction of CA molecules into TGS prevents the formation of nanoscale ferroelectric domains and very mobile domain walls separating them, which contribute to the permittivity near Tc, and also lead to domain wall pinning. As a result, the magnitude of the maximum and the frequency dispersion of the dielectric permittivity decrease during the phase transition, and the switching of polarization by the motion of domain walls does not occur in the entire volume of the crystal.
Figure 11c,e show the temperature dependence of the capacitance C, and the dielectric hysteresis loop in the TGS:CA (80:20) film, measured using an interdigital electrode system. An increase in the CA concentration leads to a strong broadening of the dielectric anomaly, a decrease in their amplitude, a decrease in switchable polarization, and a strong increase in the coercive field. Note that in polycrystalline films of pure TGS, prepared in the same way [70,71] such broadening has not been observed. The most likely reason for such a strong change in the dielectric properties is the appearance in TGC:CA film of internal random electric fields caused by the presence of CA molecules. Another reason may be concerned with film nonuniformity. In Figure 1f we clearly see the presence in the TGS:CA (80:20) film of blocks of a different color. This indicates the presence of non-uniformity caused by a spread of CA molecules concentration in blocks. Nevertheless, it can be argued that an increase in the concentration of CA molecules leads to an increase in the smearing of the transition, a decrease in the switchable polarization, and an increase in the coercive field.
4. Conclusions
The presented study of CA doped TGS single crystals and films shows that incorporation of CA molecules in TGS crystal lattice is followed by an appreciable change of crystals color that proves the presence of CA molecules in the TGS structure. Nevertheless, as shown by single-crystal and powder X-ray analysis, as well as Raman and FTIR spectroscopy, CA doping does not lead to new phases or microstrains. The TGS crystal structure remains practically unchanged except for a small decrease in unit cell volume. This is possible if CA molecules are incorporated in pores of TGS crystal structure whose sizes are comparable with CA molecules (~0.5 nm). At the same time, the absorption spectra of TGS:CA crystals differ significantly from the spectra of pure TGS, which manifests itself in the presence of additional absorption bands with Eph < Eg in the TGS:CA spectra. The most striking manifestation of CA doping is the appearance of strong luminescence in a wide spectral range, which is absent both in nominally pure TGS crystals and in crystalline croconic acid. The appearance of such luminescence may apparently be associated with the existence of hydrogen bonds between the CA molecules located in the pores of the TGS lattice and the surrounding molecules forming the TGS lattice. The presence of such hydrogen bonds is confirmed in particular by the FTIR spectra of the TGS:CA crystals.
Similar to other impurities, the inclusion of CA molecules in the TGS structure leads to a significant decrease in the dielectric anomaly during the ferroelectric phase transition, as well as to a switchable polarization and an increase in the coercive field. At the same time, doping does not change considerably the paraelectric–ferroelectric phase transition temperature Tc both in TGS:CA crystals and in films. These features can be explained by the prevention of the formation of nanoscale ferroelectric domains and very mobile domain walls in the TGS:CA due to the appearance of CA molecules with a very high electric polarization in the crystal structure.
Supplementary Materials
The following supporting information can be downloaded at: https://www.mdpi.com/article/10.3390/cryst12050679/s1, Table S1.1. Results of refinement of the TGS:CA (80:20) structure (space group P1) using single crystal XRD data. Table S1.2. Atomic displacement parameters for the TGS:CA (80:20). Table S1.3. Results of refinement of the TGS:CA (90:10) structure (space group P21) using single crystal XRD data. Atomic numbers Z, relative coordinates of atoms (x/a, y/b, z/c) and their isotropic temperature factors U are shown. Table S1.4. Atomic displacement parameters for the TGS:CA (90:10). Table S1.5. Bond lengths (Å) in TGS:CA (80:20) and TGS:CA (90:10) structure according to results of structure refinement using single crystal XRD data (Tables S1.1 and S1.3). Table S1.6. Bond angles (°) in TGS:CA (80:20) and TGS:CA (90:10) structure according to results of structure refinement using single crystal XRD data (Tables S1.1 and S1.3). Figure S1.1 Schematic representation of a glycine molecule. Figure S2.1. WHP graphs for (a) TGS, (b) TGS:CA (90:10).
Author Contributions
Formal analysis, E.B., A.Z., A.A.L., B.K., V.D., A.S. (Alexander Smirnov), A.S. (Anatoly Starukhin), S.P., H.Z., F.L., H.K.; Investigation, E.B., A.Z., A.A.L., V.D., A.S. (Alexander Smirnov), A.S. (Anatoly Starukhin), S.P., H.Z., F.L., H.K.; Writing—original draft, E.B., A.Z., A.A.L., A.S. (Anatoly Starukhin), B.K., H.Z., F.L., H.K.; Writing—review and editing, E.B., B.K., H.K.; Funding acquisition, E.B., H.K.; Conceptualization, E.B. All authors have read and agreed to the published version of the manuscript.
Funding
This research was funded by RFBR (project number 21-52-53015) and NSFC (project number 52111530040).
Institutional Review Board Statement
Not applicable.
Informed Consent Statement
Not applicable.
Data Availability Statement
The data presented in this study are available on request from the corresponding author.
Acknowledgments
The authors are grateful to F.B. Svinarev for help in measuring the dielectric properties. The X-ray experiment for TGS:CA (90:10) was carried out using the facilities of the X-ray diffraction Resource Centers of St. Petersburg University. The XRD powder characterizations were performed using equipment and software of the Joint Research Center “Material science and characterization in advanced technology” (Ioffe Institute, St.-Petersburg, Russia).
Conflicts of Interest
The authors declare no conflict of interest.
References
- Matthias, B.T.; Miller, C.E.; Remeika, J.P. Ferroelectricity of glycine sulfate. Phys. Rev. 1956, 104, 849–850. [Google Scholar] [CrossRef]
- Fleck, M.; Petrosyan, A.M. Salts of amino acids. Crystallization, Structure and Properties; Springer International Publishing: Cham, Switzerland, 2014. [Google Scholar]
- Lal, R.B.; Batra, A.K. Growthl and properties of triglycine sulfate (TGS) crystals: Review. Ferroelectrics 1993, 142, 51–82. [Google Scholar] [CrossRef]
- Miga, S.; Dec, J.; Ćwikiel, K. Temperature dependences of nonlinear dielectric susceptibilities of triglycine sulphate near ferroelectric phase transition. Phase Transit. 2007, 80, 95–99. [Google Scholar] [CrossRef]
- Miga, S.; Dec, J. Non-linear dielectric response of ferroelectric and relaxor materials. Ferroelectrics 2008, 367, 223–228. [Google Scholar] [CrossRef]
- Whatmore, R.W. Pyroelectric devices and materials. Rep. Prog. Phys. 1986, 49, 1335–1386. [Google Scholar] [CrossRef]
- Shut, V.N.; Kashevich, I.F. Formation of the unipolar state in hydrogenous ferroelectric crystals. Ferroelectrics 2007, 350, 57–64. [Google Scholar] [CrossRef]
- Sidorkin, A.S.; Milovidova, S.D.; Rogazinskaya, O.V.; Sidorkin, A.A. Internal bias field in TGS crystals doped with different impurities. Crystallogr. Rep. 2004, 49, 130–133. [Google Scholar] [CrossRef]
- Choudhury, R.R.; Chitra, R.; Ramanadham, M.; Jayavel, R. Prevention of depoling in TGS by alanine substitution: An interpretation based on a neutron-diffraction study. Appl. Phys. A Mater. Sci. Process. 2002, 74, 1667–1669. [Google Scholar] [CrossRef]
- Krishnakumar, V.; Sivakumar, S.; Nagalakshmi, R.; Bhuvaneswari, S.; Rajaboopathi, M. Effect of doping an organic molecule ligand on TGS single crystals. Spectrochim. Acta A 2008, 71, 480–485. [Google Scholar] [CrossRef]
- Sinha, N.; Goel, N.; Singh, B.K.; Gupta, M.K.; Kumar, B. Enhancement in ferroelectric, pyroelectric and photoluminescence properties in dye doped TGS crystals. J. Solid State Chem. 2012, 190, 180–185. [Google Scholar] [CrossRef]
- Alexandru, H.V.; Berbecaru, C.; Ion, L.; Dutu, A.; Ion, F.; Pintilie, L.; Radulescu, R.C. Pyroelectric coefficient manipulation in doped TGS crystals. Appl. Surf. Sci. 2006, 253, 358–362. [Google Scholar] [CrossRef]
- Saxena, A.; Gupta, V.; Sreenivas, K. Characterization of phosphoric acid doped TGS single crystals. J. Cryst. Growth. 2004, 263, 192–202. [Google Scholar] [CrossRef]
- Belugina, N.V.; Gainutdinov, R.V.; Tolstikhina, A.L.; Ivanova, E.S.; Kashevich, I.F.; Shut, V.N.; Mozzharov, S.E. Formation of a regular domain structure in TGS–TGS + Cr crystals with a profile impurity distribution. Crystallogr. Rep. 2015, 60, 555–560. [Google Scholar] [CrossRef]
- Sivanesan, G.; Kolandaivel, P.; Pandian, S.S. Laser Raman and FT-IR studies of pure and Zn-doped TGS. Mater. Chem. Phys. 1993, 34, 73–77. [Google Scholar] [CrossRef]
- Mahendra, K.; Kumar, H.K.T.; Udayashankar, N.K. Enhanced structural, optical, thermal, mechanical and electrical properties by a noval approach (nanoparticle doping) on ferroelectric triglycine sulphate single crystal. Appl. Phys. A. 2019, 125, 228. [Google Scholar] [CrossRef]
- Raghavan, C.M.; Sankar, R.; Mohan Kumar, R.; Jayavel, R. Effect of amino acid doping on the growth and ferroelectric properties of triglycine sulphate single crystals. Mater. Res. Bull. 2008, 43, 305–311. [Google Scholar] [CrossRef]
- Stadnyk, V.Y.; Romanyuk, N.A.; Kiryk, Y.I. Optical properties of TGS crystal with L- valine admixture. Crystallogr. Rep. 2010, 55, 995–999. [Google Scholar] [CrossRef]
- Meera, K.; Muralidharan, R.; Santhanaraghavan, P.; Gopalakrishnan, R.; Ramasamy, P. Growth and characterization of L-cystine doped TGS crystals. J. Cryst. Growth. 2001, 226, 303–312. [Google Scholar] [CrossRef]
- Singh, P.; Abdullah, M.M.; Sagadevan, S.; Ikram, S. Enhancement of electro-optic and structural properties of TGS single crystals on doping with l-glutamic acid. J. Mater. Sci. Mater. Electron. 2018, 29, 7904–7916. [Google Scholar] [CrossRef]
- Deepthi, P.R.; Shanthi, J. Optical, dielectric & ferroelectric studies on amino acids doped TGS single crystals. RSC Adv. 2016, 6, 33686–33694. [Google Scholar] [CrossRef]
- Batra, A.K.; Alomari, A.; Guggilla, P.; Brown, D.; Kamara, O.; Lal, R.B. Growth and Optical Characterization of Doped Triglycine Sulfate (TGS) Crystals. Adv. Sci. Eng. Med. 2016, 8, 689–694. [Google Scholar] [CrossRef]
- Hussain, A.; Sinha, N.; Joseph, A.J.; Goel, S.; Singh, B.; Bdikin, I.; Kumar, B. Mechanical investigations on piezo-/ferrolectric maleic acid-doped triglycine sulphate single crystal using nanoindentation technique. Arab. J. Chem. 2020, 13, 1874–1889. [Google Scholar] [CrossRef]
- Begum, S.N.; Sankar, U. Studies on Optical and Mechanical Properties of Salicylic acid Admixtured TGS Single Crystals. Available online: http://www.ijtrd.com/papers/IJTRD15969.pdf (accessed on 8 April 2022).
- Rai, C.; Narayana Moolya, B.; Dharmaprakash, S.M. Iminodiacetic acid doped ferroelectric triglycine sulphate crystal: Crystal growth and characterization. Phys. B Condens. Matter. 2011, 406, 1–7. [Google Scholar] [CrossRef]
- Rai, C.; Sreenivas, K.; Dharmaprakash, S.M. Growth of 4-(dimethylamino) benzaldehyde doped triglycine sulphate single crystals and its characterization. Phys. B Condens. Matter 2009, 404, 3886–3889. [Google Scholar] [CrossRef]
- Rajesh, P.; Rao, G.B.; Ramasamy, P. Effect of Rochelle salt on growth, optical, photoluminescence, photoconductive and piezoelectric properties of the triglycine sulphate single crystal. J. Cryst. Growth. 2017, 468, 340–344. [Google Scholar] [CrossRef]
- Parimaladevi, R.; Sekar, C.; Krishnakumar, V. The effect of nitric acid (HNO3) on growth, spectral, thermal and dielectric properties of triglycine sulphate (TGS) crystal. Spectrochim. Acta A 2010, 75, 617–623. [Google Scholar] [CrossRef]
- Deepti, P.R.; Shanti, J. Structural and Optical Studies of Potential Ferroelectric Crystal: KDP Doped TGS. J. Sci. Res. 2013, 6, 1–9. [Google Scholar] [CrossRef]
- Das, H.N.; Podder, J. Growth, structural, optical and microhardness study of KCl doped triglycine sulphate (TGS) crystals for photonic applications. J. Optoelectron. Adv. Mater. 2013, 15, 1142–1146. [Google Scholar]
- Malekfar, R.; Daraei, A. Raman Scattering and Electrical Properties of TGS: PCo (9 %) Crystal as Ambient Temperature IR Detector. Acta Phys. Pol. A. 2008, 114, 859–867. [Google Scholar] [CrossRef]
- Khanum, F.; Podder, J. Crystallization and Characterization of Triglycine Sulfate (TGS) Crystal Doped with NiSO4. J. Cryst. Process Technol. 2011, 1, 49–54. [Google Scholar] [CrossRef]
- Sinha, N.; Bhandari, S.; Yadav, H.; Ray, G.; Godara, S.; Tyagi, N.; Dalal, J.; Kumara, S.; Kumar, B. Performance of crystal violet doped triglycine sulfate single crystals for optical and communication applications. CrystEngComm. 2015, 17, 5757–5767. [Google Scholar] [CrossRef]
- Khanum, F.; Podder, J. Synthesis, growth, and electrical transport properties of pure and LiSO4-doped triglycine sulphate crystal. Int. J. Opt. 2012, 2012, 1–7. [Google Scholar] [CrossRef][Green Version]
- Krajewski, T.; Breczewski, T. Dielectric and pyroelectric properties of tgs crystals doped with nitroaniline molecules. Ferroelectrics 1980, 25, 547–550. [Google Scholar] [CrossRef]
- Washino, M.; Yamada, K.; Kurita, Y. The Dipole Moments and Molecular Structures of Croconic Acid and Dimethyl Croconate. Bull. Chem. Soc. Jpn. 1958, 31, 552–555. [Google Scholar] [CrossRef]
- Horiuchi, S.; Kagawa, F.; Hatahara, K.; Kobayashi, K.; Kumai, R.; Murakami, Y.; Tokura, Y. Above-room-temperature ferroelectricity in a single-component molecular crystal. Nature 2010, 463, 789–792. [Google Scholar] [CrossRef] [PubMed]
- Horiuchi, S.; Kobayashi, K.; Kumai, R.; Ishibashi, S. Proton tautomerism for strong polarization switching. Nat. Commun. 2017, 8, 14426. [Google Scholar] [CrossRef] [PubMed]
- Sawada, R.; Uemura, H.; Sotome, M.; Yada, H.; Kida, N.; Iwano, K.; Shimoi, Y.; Horiuchi, S.; Okamoto, H. Large second-order optical nonlinearity in a ferroelectric molecular crystal of croconic acid with strong intermolecular hydrogen bonds. Appl. Phys. Lett. 2013, 102, 162901. [Google Scholar] [CrossRef]
- Encinas, C.; Otazo, E.; Rivera, L.; Miltsov, S.; Alonso, J. Croconines: New acidochromic dyes for the near infrared region. Tetrahedron Lett. 2002, 43, 8391–8393. [Google Scholar] [CrossRef]
- Prabhakar, C.; Tripathi, A.; Bhanuprakash, K.; Jayathirtharao, V. Visible absorbing croconium dyes with intramolecular hydrogen bonding: A combined experimental and computational study. J. Mol. Struct. 2017, 1146, 684–691. [Google Scholar] [CrossRef]
- Kitova, S.; Stoyanova, D.; Dikova, J.; Vassilev, A.; Kandinska, M.; Angelova, S. Optical Properties of Thin Films of New Croconium Dye for Application in Organic Solar Cells. Nanosci. Nanotech. 2014, 14, 70–73. [Google Scholar]
- Feng, S.; Yang, H.; Jiang, X.; Wang, Y.; Zhu, M. A new 3D silver(I) coordination polymer with croconate ligand displaying green luminescent. J. Mol. Struct. 2015, 1081, 1–5. [Google Scholar] [CrossRef]
- Miller, D.P.; Costa, P.S.; Teeter, J.D.; Sinitskii, A.; Enders, A.; Hooper, J.G.M. Seeking out Heterogeneous Hydrogen Bonding in a Self-Assembled 2D Cocrystal of Croconic Acid and Benzimidazole on Au(111). J. Phys. Chem. C. 2021, 125, 2403–2410. [Google Scholar] [CrossRef]
- Braga, D.; Maini, L.; Grepioni, F. Crystallization from hydrochloric acid affords the solid-state structure of croconic acid (175 years after its discovery) and a novel hydrogen-bonded network. CrystEngComm 2001, 3, 27. [Google Scholar] [CrossRef]
- Sheldrick, G.M. A short history of SHELX. Acta Crystallogr. A 2008, 64, 112–122. [Google Scholar] [CrossRef]
- Dolomanov, O.V.; Bourhis, L.J.; Gildea, R.J.; Howard, J.A.K.; Puschmann, H. OLEX2: A complete structure solution, refinement and analysis program. J. Appl. Crystallogr. 2009, 42, 339–341. [Google Scholar] [CrossRef]
- Diffrac Suite Eva Version 5.1.0.5; Bruker: Karlsruhe, Germany, 2019.
- Powder Diffraction File-2; International Centre for Diffraction Data (ICDD): Newatown Square, PA, USA, 2014.
- Kraus, W.; Nolze, G. POWDER CELL-A program for the representation and manipulation of crystal structures and calculation of the resulting X-ray powder patterns. J. Appl. Crystallogr. 1996, 29, 301–303. [Google Scholar] [CrossRef]
- Maunders, C.; Etheridge, J.; Wright, N.; Whitfield, H.J. Structure and microstructure of hexagonal Ba3Ti2RuO9 by electron diffraction and microscopy. Acta Crystallogr. B 2005, 61, 154–159. [Google Scholar] [CrossRef]
- Terlan, B.; Levin, A.A.; Börrnert, F.; Simon, F.; Oschatz, M.; Schmidt, M.; Cardoso-Gil, R.; Lorenz, T.; Baburin, I.A.; Joswig, J.-O.; et al. Effect of Surface Properties on the Microstructure, Thermal, and Colloidal Stability of VB2 Nanoparticles. Chem. Mater. 2015, 27, 5106–5115. [Google Scholar] [CrossRef]
- Levin, A.A. Program SizeCr for Calculation of the Microstructure Parameters from X-ray Diffraction Data. Preprint. Available online: https://www.researchgate.net/profile/Alexander-Levin-6/research (accessed on 29 March 2022). [CrossRef]
- Diffrac Suite TOPAS Version 5; Technical reference; Bruker: Karlsruhe, Germany, 2014.
- Dollase, W.A. Correction of Intensities of Preferred Orientation in Powder Diffractometry: Application of the March Model. J. Appl. Crystallogr. 1986, 19, 267–272. [Google Scholar] [CrossRef]
- Jarvinen, M. Application of symmetrized harmonics expansion to correction of the preferred orientation effect. J. Appl. Crystallogr. 1993, 26, 525–531. [Google Scholar] [CrossRef]
- Levin, A.A. Program RietESD for Correction of Estimated Standard Deviations Obtained in Rietveld-Refinement Program. Preprint. Available online: https://www.researchgate.net/profile/Alexander-Levin-6/research (accessed on 29 March 2022). [CrossRef]
- Bérar, J.-F.; Lelann, P. ESD’s and Estimated Probable Error Obtained in Rietveld Refinements with Local Correlations. J. Appl. Crystallogr. 1991, 24, 1–5. [Google Scholar] [CrossRef]
- Momma, K.; Izumi, F. VESTA 3 for three-dimensional visualization of crystal, volumetric and morphology data. J. Appl. Crystallogr. 2011, 44, 1272–1276. [Google Scholar] [CrossRef]
- Balashova, E.V.; Svinarev, F.B.; Zolotarev, A.A.; Levin, A.A.; Brunkov, P.N.; Davydov, V.Y.; Smirnov, A.N.; Redkov, A.V.; Pankova, G.A.; Krichevtsov, B.B. Crystal structure, raman spectroscopy and dielectric properties of new semiorganic crystals based on 2-methylbenzimidazole. Crystals 2019, 9, 573. [Google Scholar] [CrossRef]
- Balashova, E.; Levin, A.A.; Fokin, A.; Redkov, A.; Krichevtsov, B. Structural Properties and Dielectric Hysteresis of Molecular Organic Ferroelectric Grown from Different Solvents. Crystals 2021, 11, 1278. [Google Scholar] [CrossRef]
- Choudhury, R.R.; Chitra, R. Single crystal neutron diffraction study of triglycine sulphate revisited. PRAMANA 2008, 71, 911–915. [Google Scholar] [CrossRef]
- Hill, R.J.; Fischer, R.X. Profile agreement indices in rietveld and pattern-fitting analysis. J. Appl. Crystallogr. 1990, 23, 462–468. [Google Scholar] [CrossRef]
- Krishnan, R.S.; Balasubramanian, K. Raman Spectrum of Crystalline Tri-Glycine Sulphate. Proc. Ind. Acad. Sci. 1958, 48, 138–144. [Google Scholar] [CrossRef]
- Jimin, Z.; Gouxiang, L.; Bing, L.; Shifen, H.; Huafu, W. Raman studies of the tgs-tgfb system and its ferroelectric phase transition. Ferroelectrics 1990, 101, 251–259. [Google Scholar] [CrossRef]
- Erdle, E.; Möhwald, H. Mini-Excitons and Lattice Dynamics in Mixed CT-Crystals: An ESR, Optical and Raman Spectroscopical Study. Z. Naturforsch. A 1980, 35, 236–243. [Google Scholar] [CrossRef][Green Version]
- Kolev, T.; Koleva, B.B.; Spiteller, M. Solid-state linear polarized IR-spectroscopy of croconic and rhodizonic acids. Cent. Eur. J. Chem. 2008, 6, 393–399. [Google Scholar] [CrossRef]
- Kasap, S.; Capper, P. (Eds.) Springer Handbook of Electronic and Photonic Materials, 2nd ed.; Springer International Publishing AG: Cham, Switzerland, 2017. [Google Scholar]
- Pankove, J.I. Optical Processes in Semiconductors; Dover Publications: New York, NY, USA, 2012. [Google Scholar]
- Balashova, E.V.; Krichevtsov, B.B.; Lemanov, V.V. Permittivity and conductivity of triglycine sulfate films on Al/SiO2 and α-Al2O3 substrates. Phys. Solid State. 2010, 52, 126–131. [Google Scholar] [CrossRef]
- Balashova, E.V.; Krichevtsov, B.B.; Lemanov, V.V. Growth, Optical Imaging and Dielectric Properties of Ferroelectric Betaine Phosphite and Triglycine Sulphate Films. Integr. Ferroelectr. 2009, 106, 29–39. [Google Scholar] [CrossRef]


Publisher’s Note: MDPI stays neutral with regard to jurisdictional claims in published maps and institutional affiliations. |
© 2022 by the authors. Licensee MDPI, Basel, Switzerland. This article is an open access article distributed under the terms and conditions of the Creative Commons Attribution (CC BY) license (https://creativecommons.org/licenses/by/4.0/).