
Study on the Grain Rotation of High-Purity Tantalum during Compression Deformation


 and
and 
Abstract
:1. Introduction
2. Materials and Methods
3. Results
4. Discussion
5. Conclusions
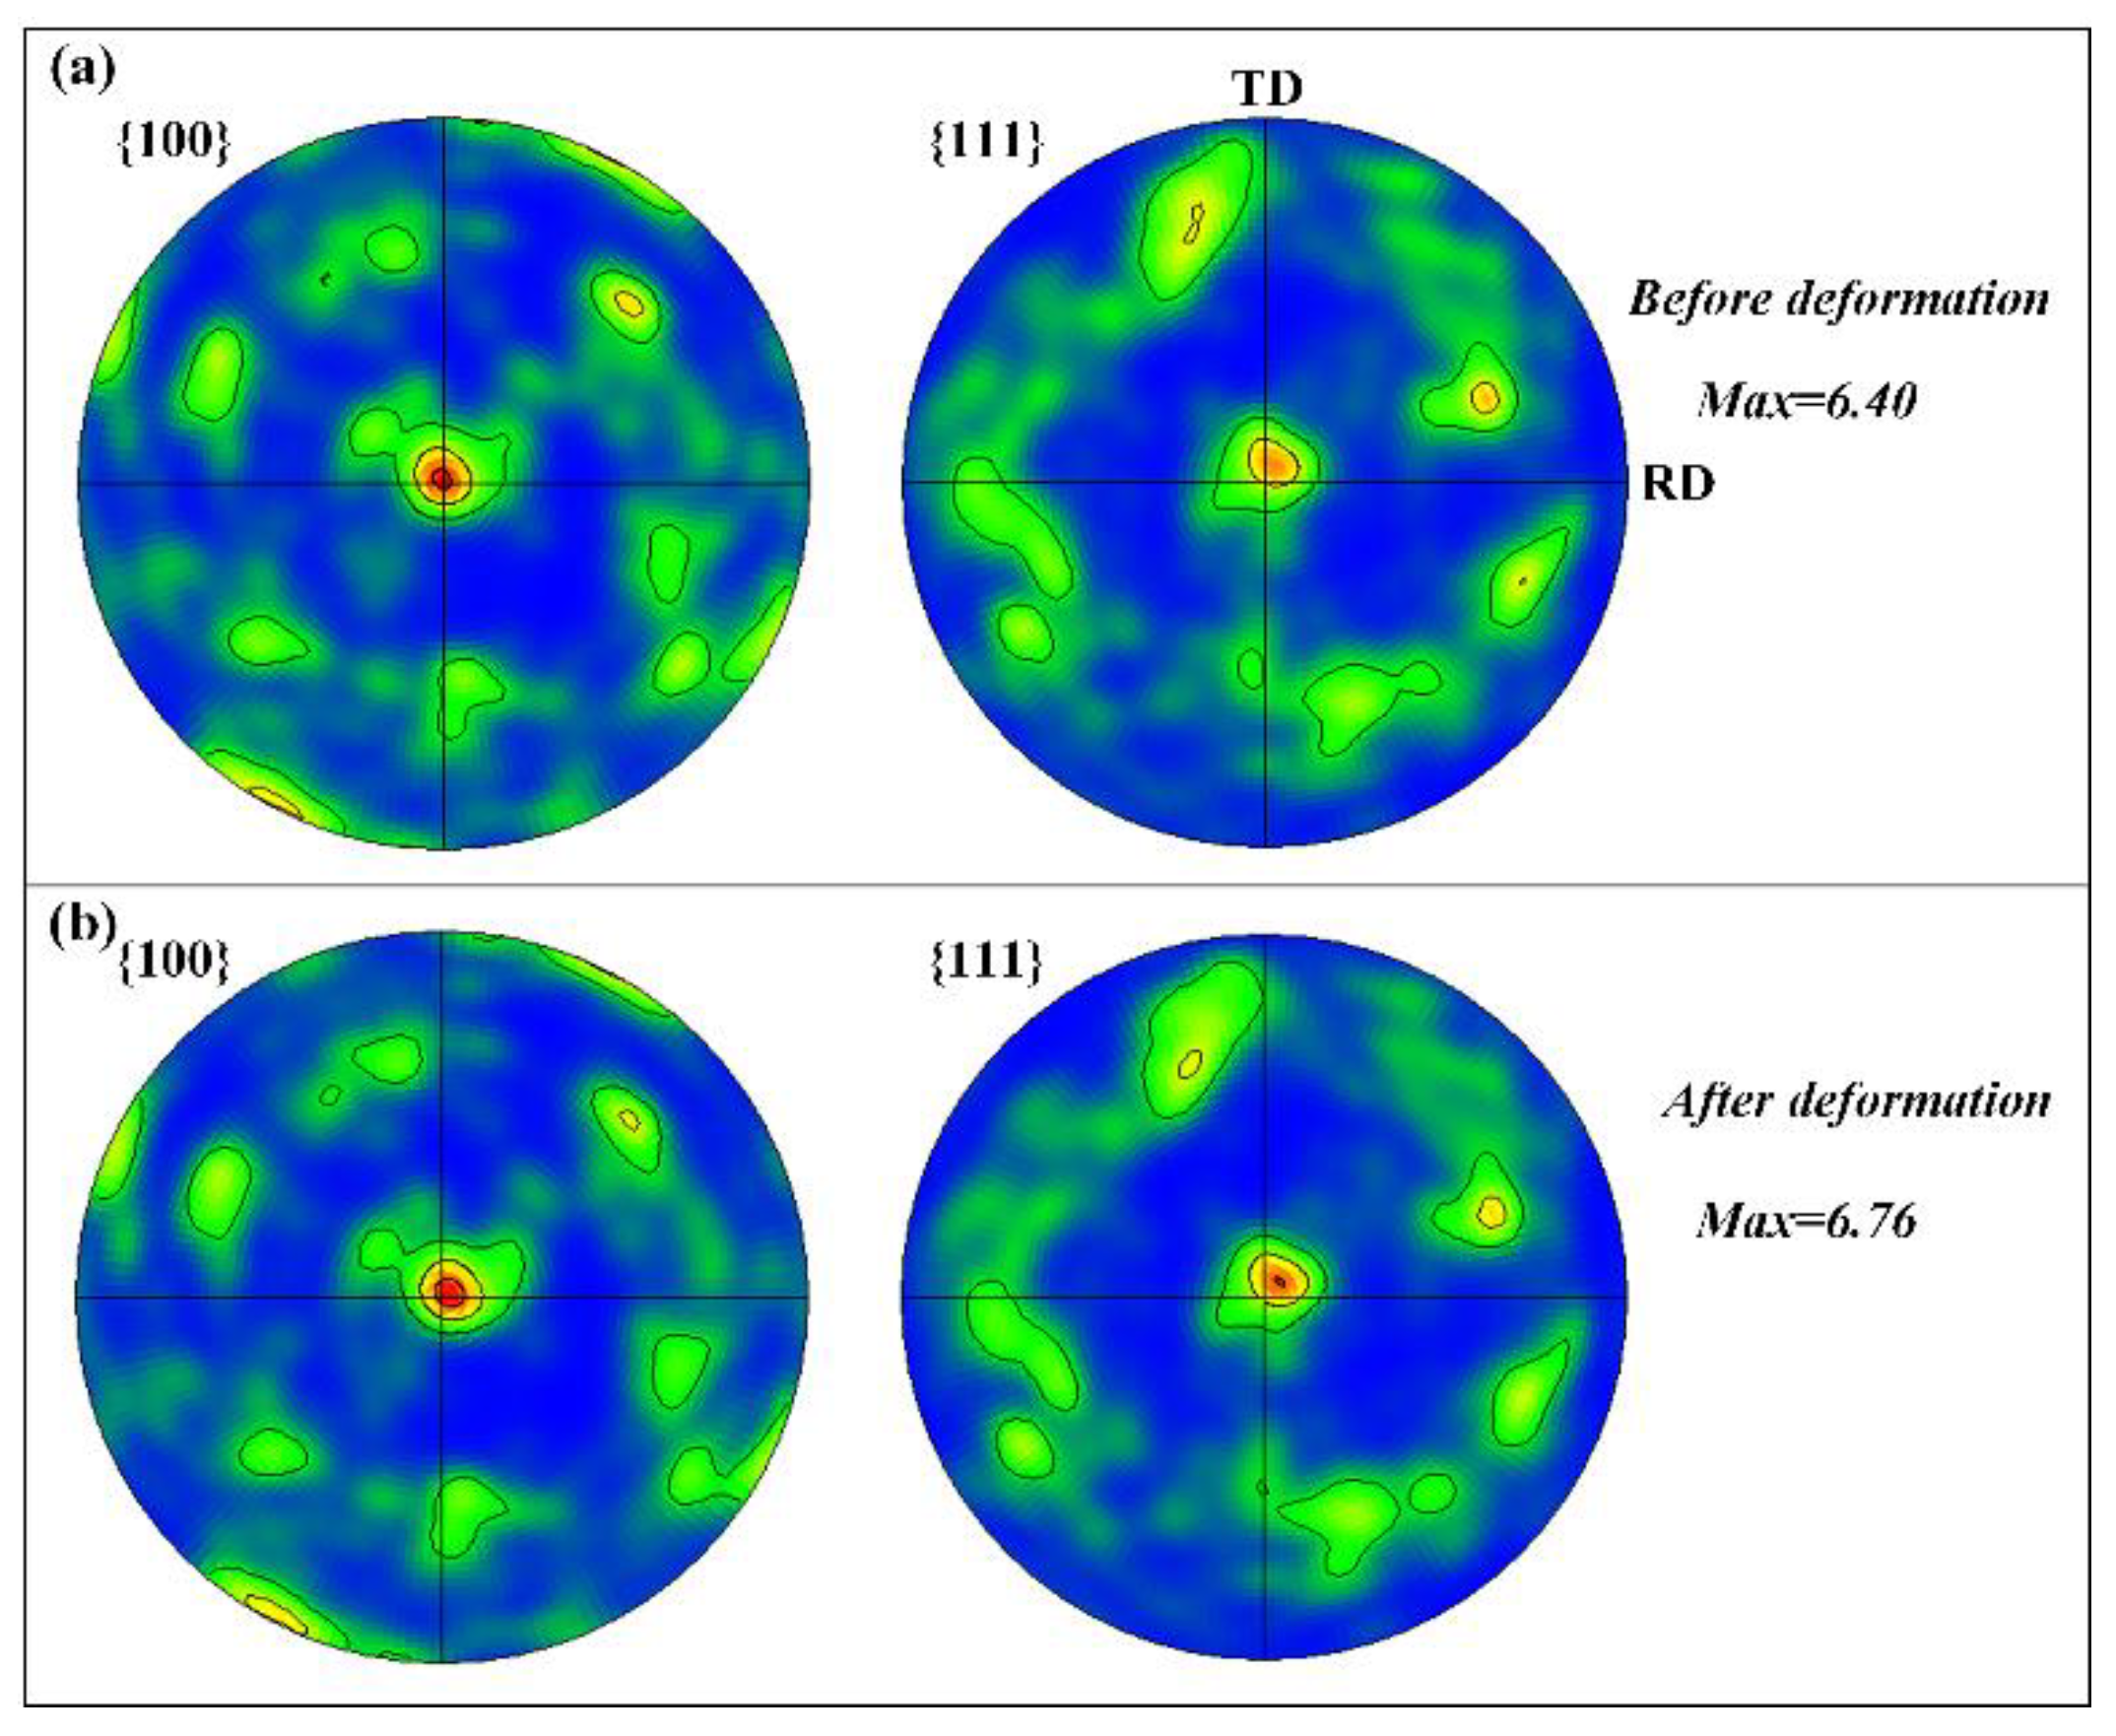
- (1)
- The initial texture is strong before compression, and then the volume fraction of {111}<uvw> orientations increases from 34.7% to 36.5%, while the volume fraction of {100}<uvw> orientations increases from 25.5% to 26.7% after compression;
- (2)
- The rotation degrees are different for grains with different crystallographic orientations because of the activation of slip systems. But at the same time, experimental results show that some grains with similar orientations possesed highly differentiated rotation degrees;
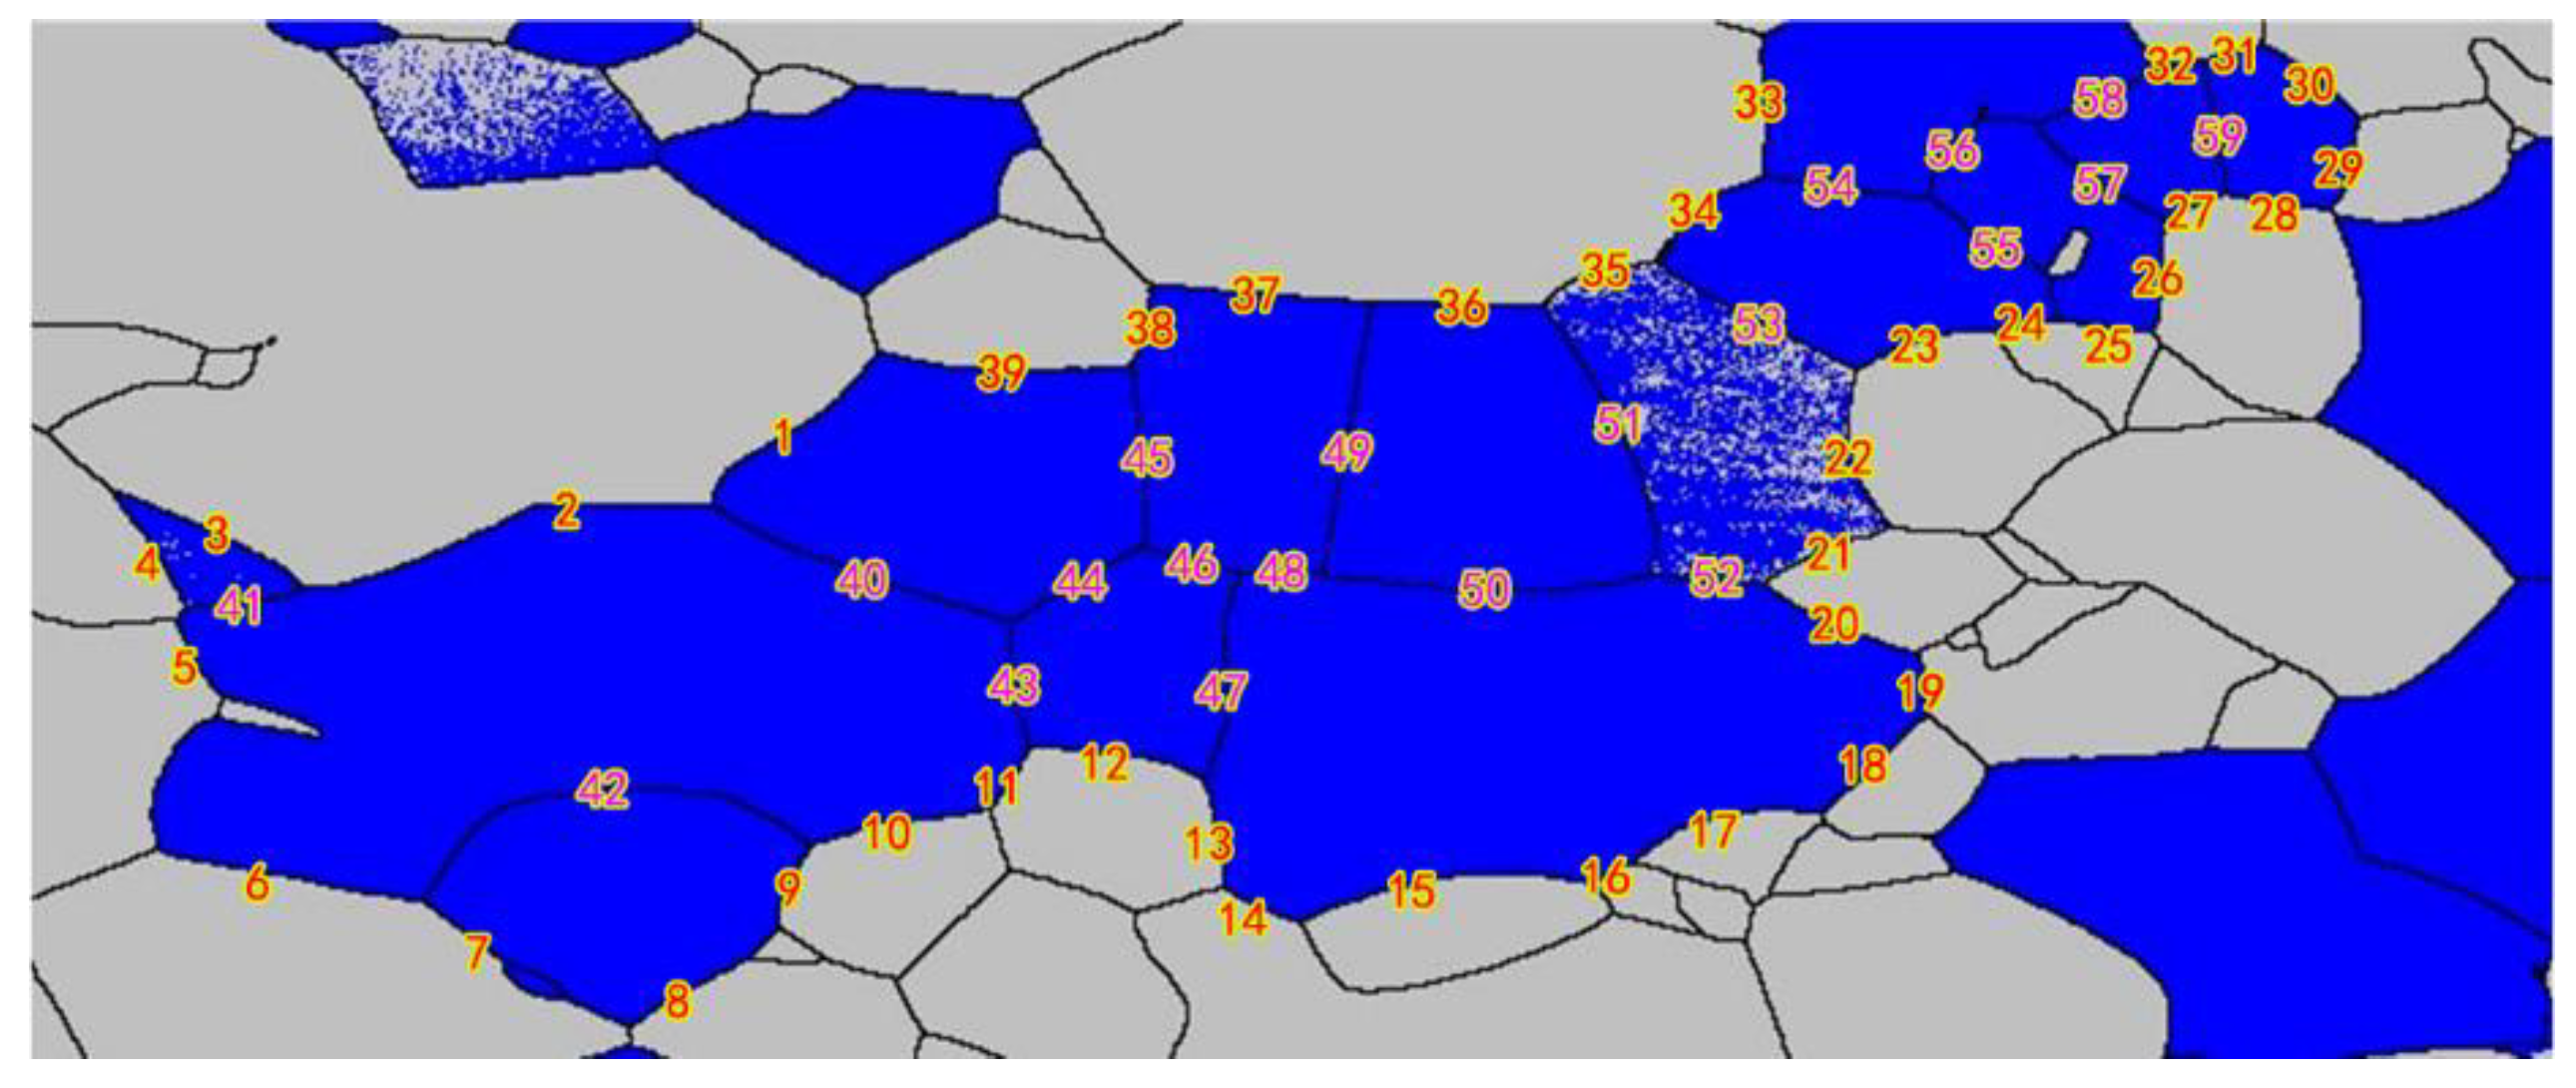
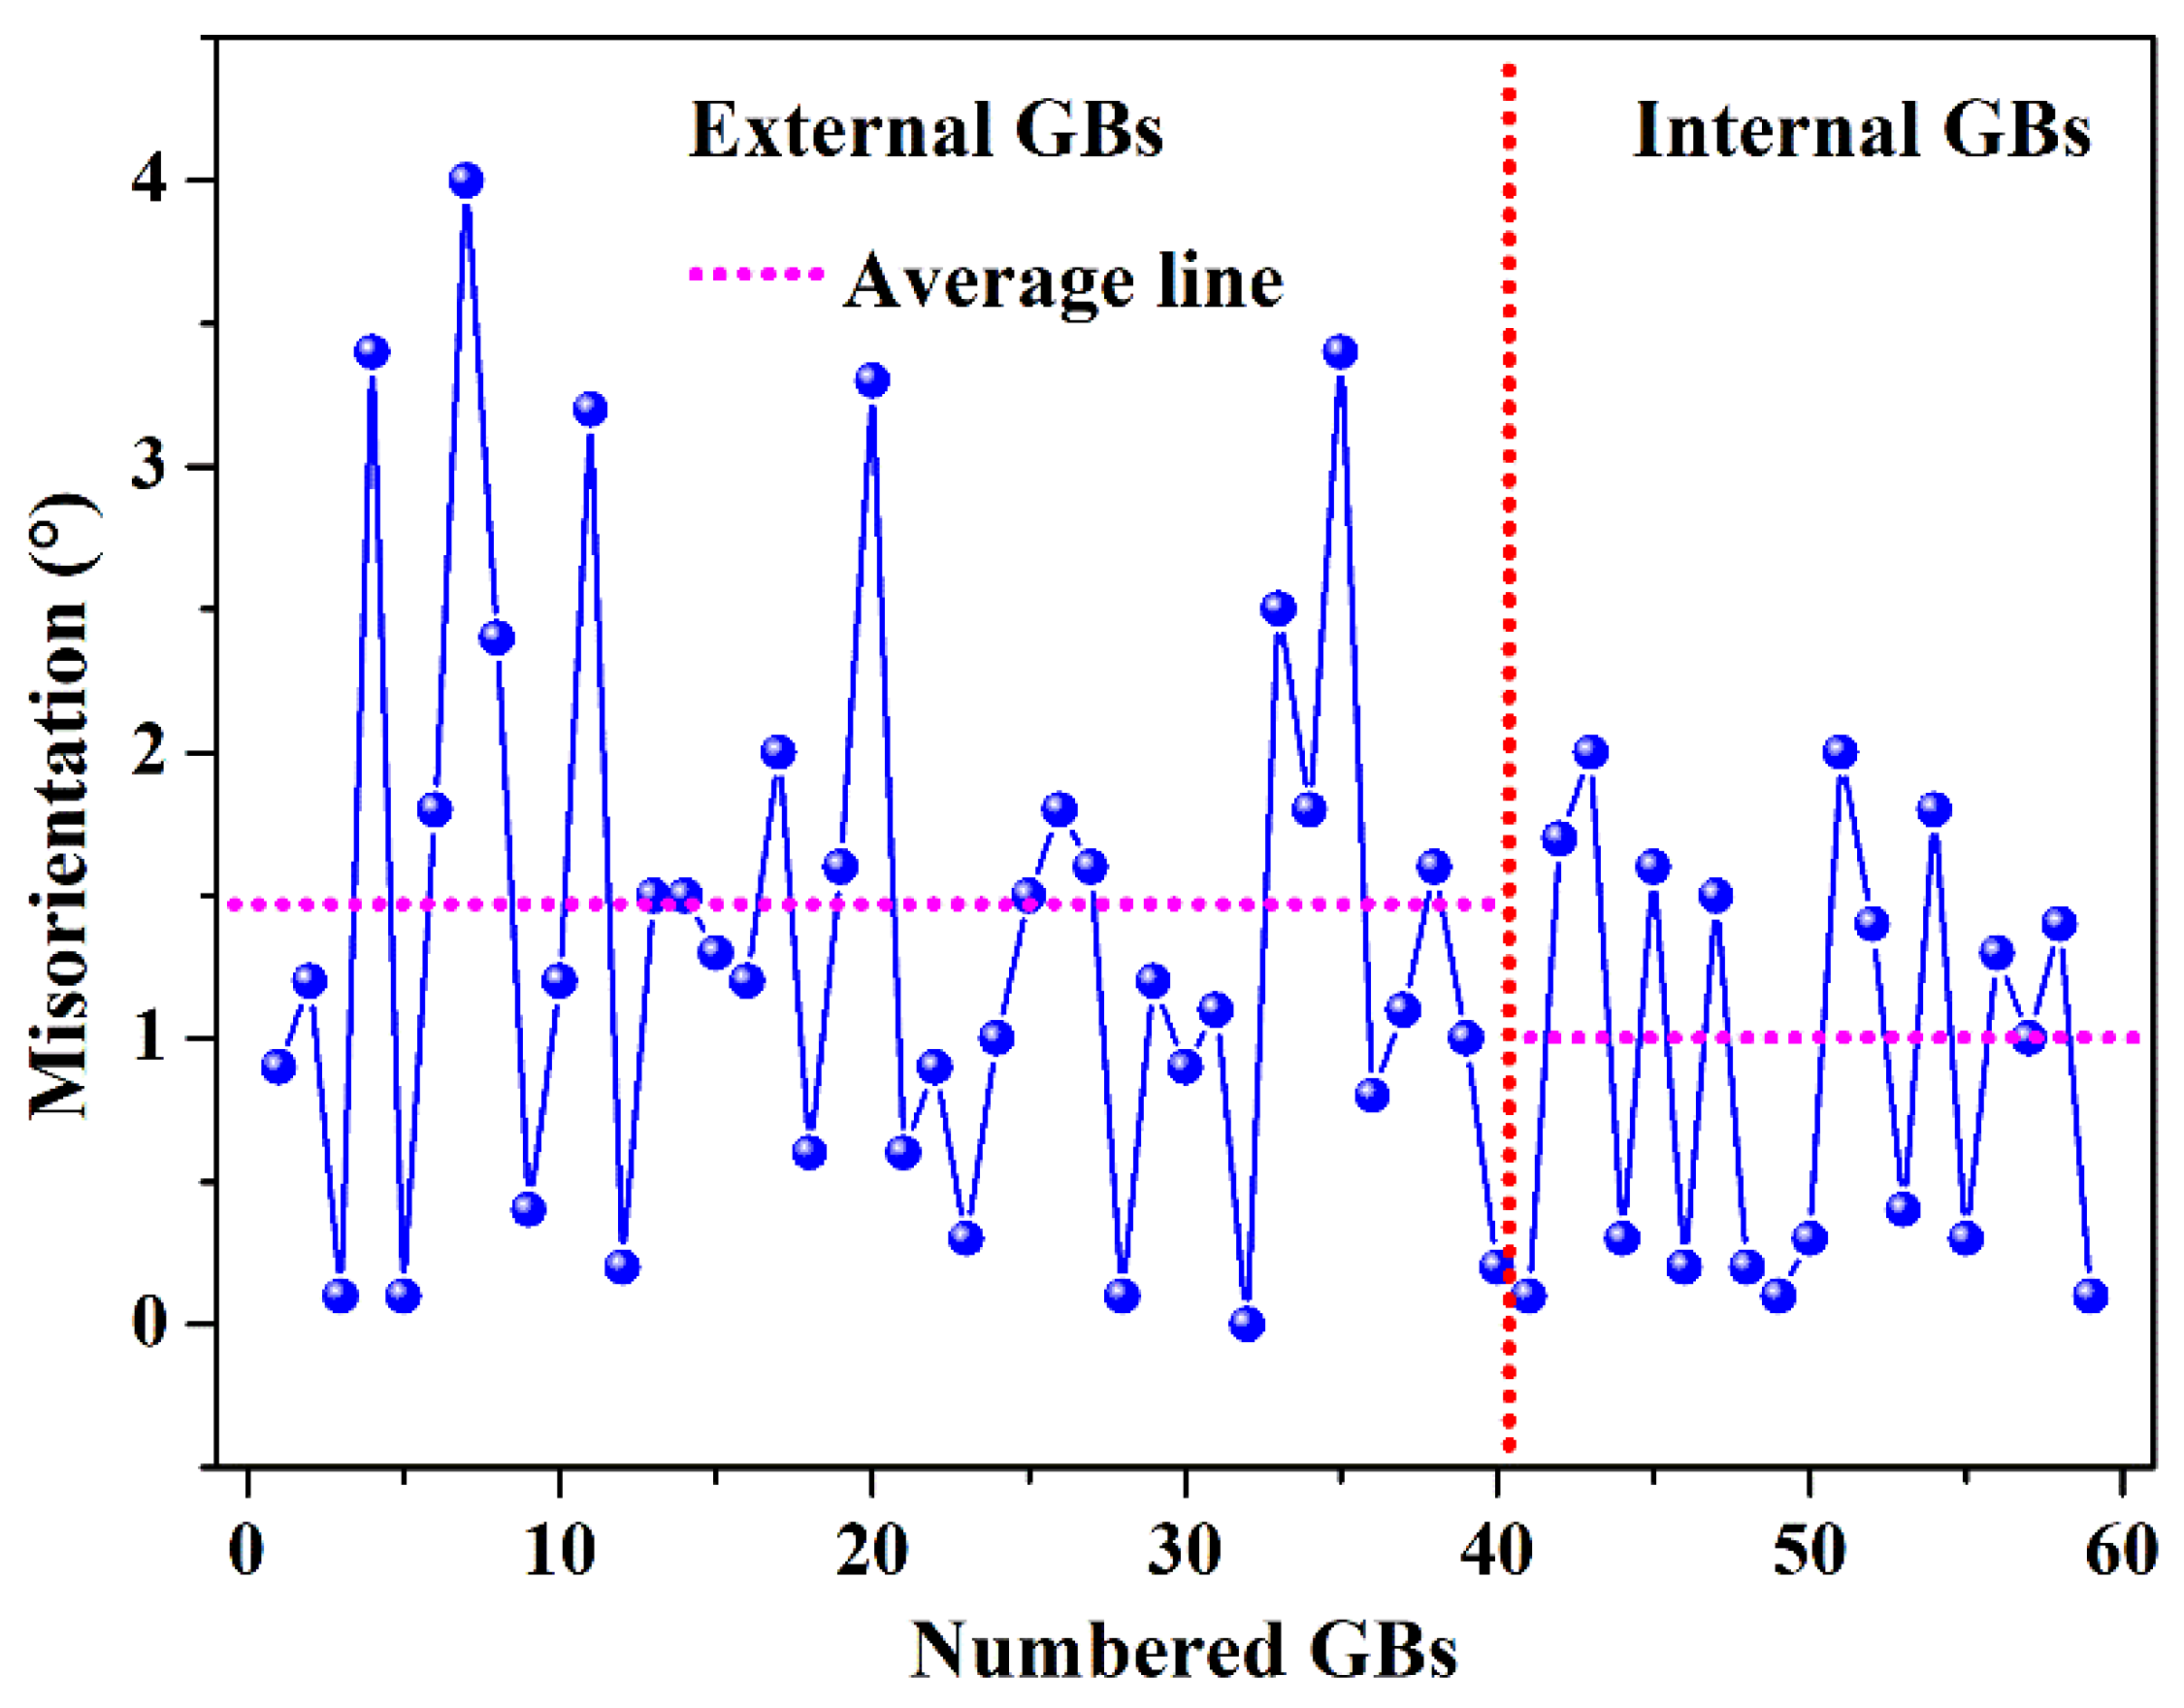
- (3)
- The deviation degrees of misorientations for the adjacent grains before and after deformation was further analyzed, and the results show that the average deviation degree is more significant in outside boundaries than that of inside boundaries of the microtexture region, which means the deformation degree is more serious for outside boundaries;
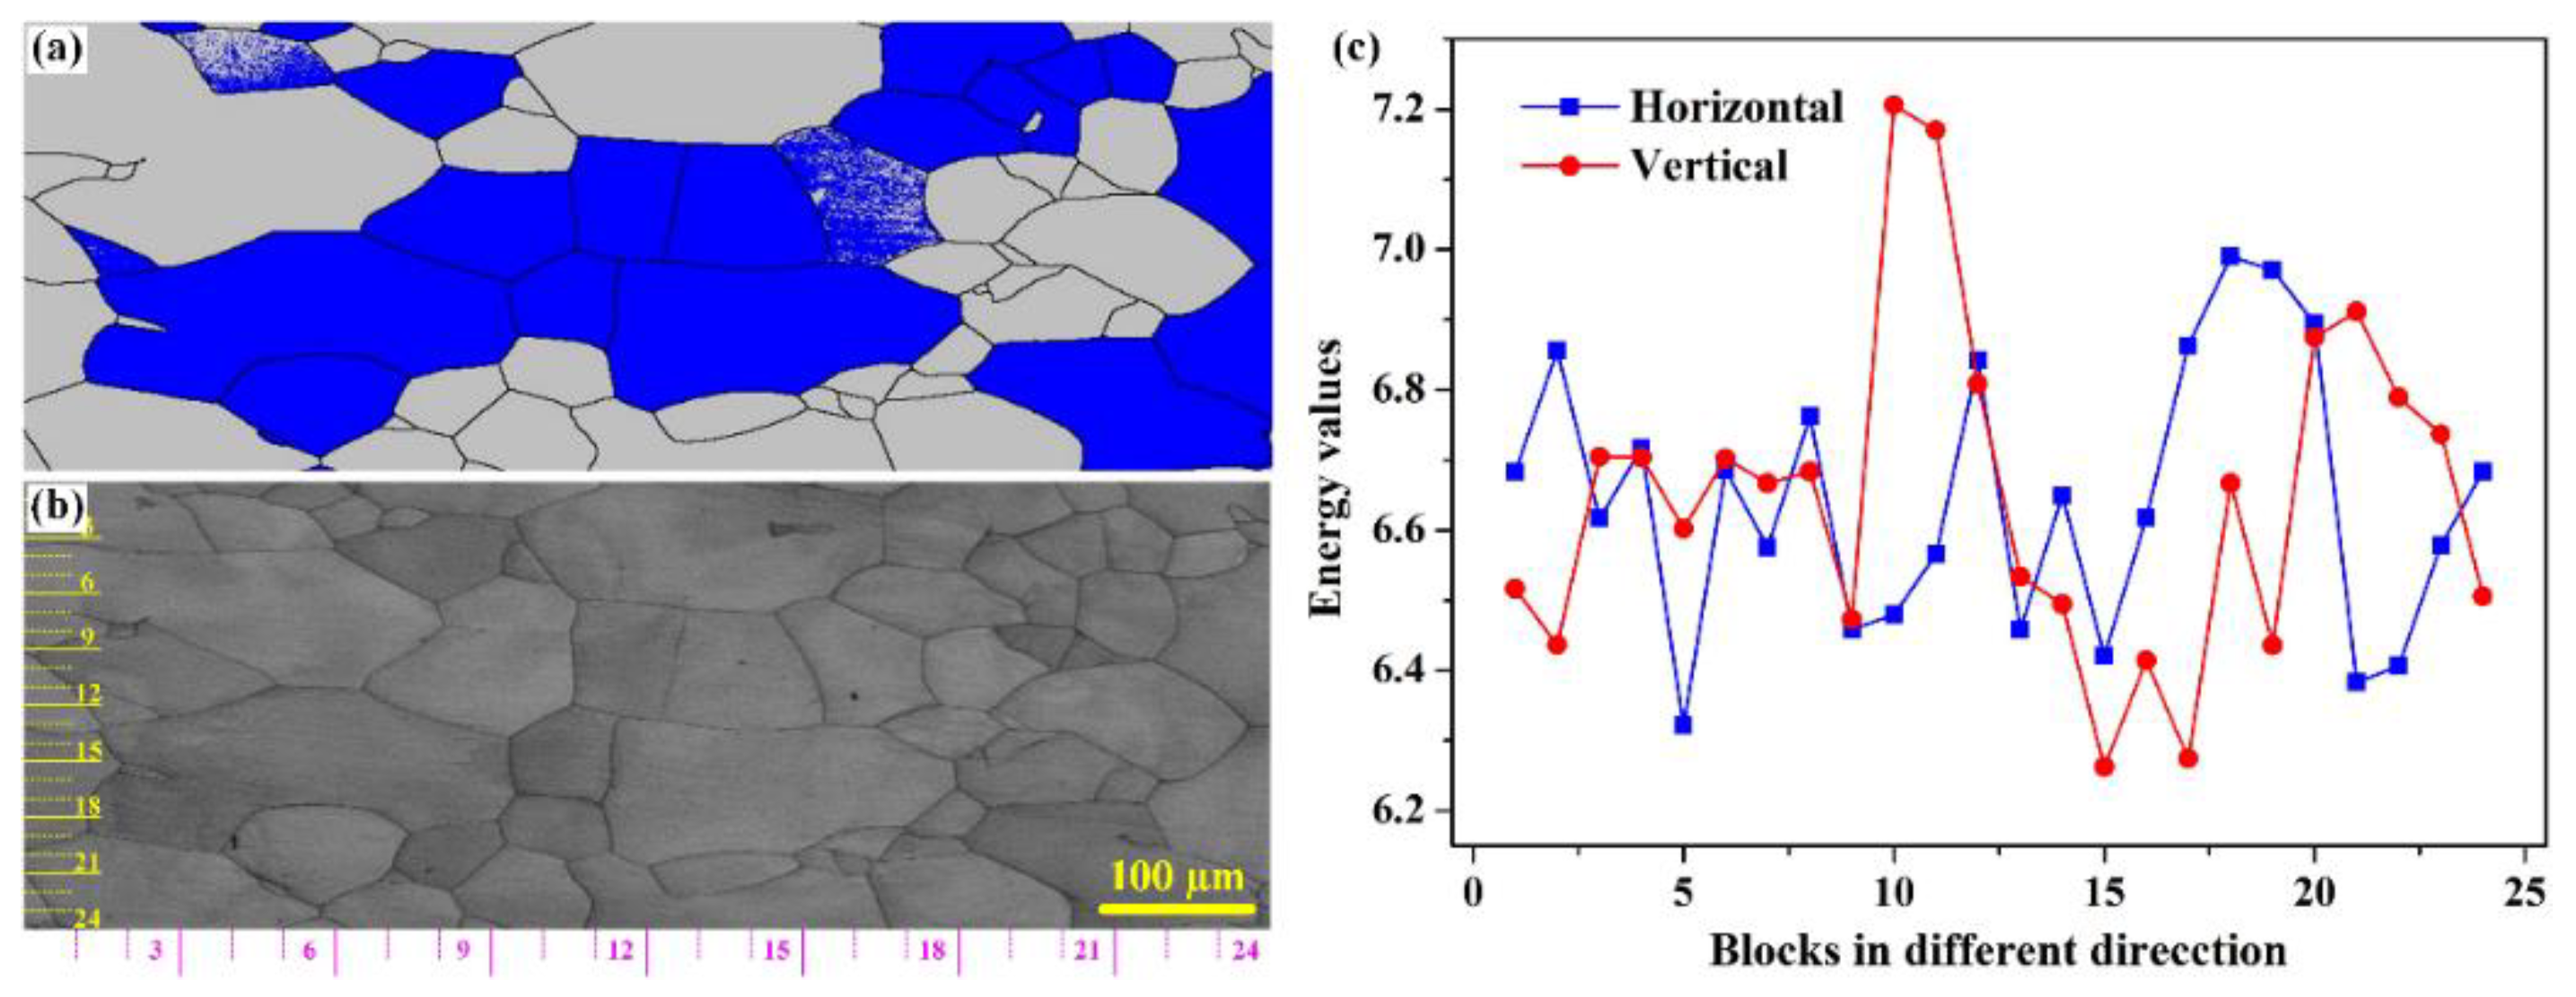
- (4)
- The density of pile-up dislocations is larger in grain boundaries outside the micro-texture region than the inside ones due to the fact that the transmission is easy for dislocations in the micro-texture region since the adjacent grains have similar crystallographic orientations.
Author Contributions
Funding
Data Availability Statement
Acknowledgments
Conflicts of Interest
References
- Jason, M.D.; Mojib, S.; Debapriya, P.M.; Anirudh, U.; Tatsuya, S.; Srinivasan, C. Cutting of tantalum: Why it is so difficult and what can be done about it. Int. J. Mach. Tool. Manu. 2020, 157, 103607. [Google Scholar]
- Alexander, T. Effect of Moisture on AC Characteristics of Chip Polymer Tantalum Capacitors. IEEE T. Comp. Pack. Man. 2019, 9, 2282–2289. [Google Scholar]
- Michaluk, C.A. Correlating Discrete Orientation and Grain Size to the sputter deposition properties of tantalum. J. Electron. Mater. 2002, 31, 2–9. [Google Scholar] [CrossRef]
- Zhang, Z.; Kho, L.; Wickersham, C.E. Effect of grain orientation on tantalum magnetron sputtering yield. J. Vac. Sci. Technol. 2006, 24, 1107–1111. [Google Scholar] [CrossRef]
- Roberto, B.F.; Terence, G.L. Processing Magnesium and Its Alloys by High-Pressure Torsion: An Overview. Adv. Eng. Mater. 2018, 21, 1801039. [Google Scholar]
- Hagihara, K.; Okamoto, T.; Yamasaki, M.; Kawamura, Y.; Nakano, T. Electron backscatter diffraction pattern analysis of the deformation band formed in the Mg-based long-period stacking ordered phase. Scr. Mater. 2016, 117, 32–36. [Google Scholar] [CrossRef]
- Bridier, F.; Villechaise, P.; Mendez, J. Analysis of the different slip systems activated by tension in a α/β titanium alloy in relation with local crystallographic orientation. Acta Mater. 2005, 53, 555–567. [Google Scholar] [CrossRef]
- Chen, L.; Chen, G.J.; Tang, J.W.; Zhao, G.Q.; Zhang, C.S. Evolution of grain structure, micro-texture and second phase during porthole die extrusion of Al–Zn–Mg alloy. Mater. Charact. 2019, 158, 109953. [Google Scholar] [CrossRef]
- Dini, G.; Ueji, R.; Najafizadeh, A.; Monir-Vaghefi, S.M. Flow stress analysis of TWIP steel via the XRD measurement of dislocation density. Mat. Sci. Eng. A 2010, 527, 2759–2763. [Google Scholar] [CrossRef]
- Poulsen, H.F.; Margulies, L.; Schmidt, S.; Winther, G. Lattice rotations of individual bulk grains. Acta Mater. 2003, 51, 3821–3830. [Google Scholar] [CrossRef]
- Winther, G.; Margulies, L.; Schmidt, S.; Poulsen, H.F. Lattice rotations of individual bulk grains Part II: Correlation with initial orientation and model comparison. Acta Mater. 2004, 52, 2863–2872. [Google Scholar] [CrossRef]
- Wilkinson, A.J.; Britton, T.B. Strains, planes, and EBSD in materials science. Mater. Today 2012, 15, 366–376. [Google Scholar] [CrossRef]
- Íris, C.; Sónia, S. Recent Advances in EBSD Characterization of Metals. Metal 2020, 10, 1097. [Google Scholar]
- Liu, Y.H.; Liu, S.F.; Lin, N.; Zhu, J.L.; Deng, C.; Liu, Q. Effect of strain path change on the through-thickness microstructure during tantalum rolling. Int. J. Refract. Met. Hard Mater. 2020, 87, 105168. [Google Scholar] [CrossRef]
- Lin, X.; Chen, Z.Y.; Shao, J.B.; Xiong, J.Y.; Hu, Z.; Liu, C.M. Deformation mechanism, orientation evolution and mechanical properties of annealed cross-rolled Mg-Zn-Zr-Y-Gd sheet during tension. J. Magnes. Alloy 2021. [Google Scholar] [CrossRef]
- Margulies, L.; Winther, G.; Poulsen, H.F. In Situ Measurement of Grain Rotation During Deformation of Polycrystals. Science 2001, 291, 2392–2394. [Google Scholar] [CrossRef]
- Gallé, C.; Robertson, I.M.; He, B.C.M.-R. Dislocation Grain Boundary Interactions in Irradiated Metals. EPJ Web Conf. 2016, 115, 04001. [Google Scholar]
- Sun, J.; Jin, L.; Dong, J.; Wang, F.; Dong, S.; Ding, W.; Luo, A.A. Towards high ductility in magnesium alloys—The role of intergranular deformation. Int. J. Plast. 2019, 123, 121–132. [Google Scholar] [CrossRef]
- Zhu, L.; Marc, S.; Bert, V. Deformation banding in a Nb polycrystal deformed by successive compression tests. Acta Mater. 2012, 60, 4349–4358. [Google Scholar] [CrossRef]
- Liu, Y.H.; Liu, S.F.; Deng, C.; Fan, H.Y.; Yuan, X.L.; Liu, Q. Inhomogeneous deformation of {111}<uvw> grain in cold rolled tantalum. J. Mater. Sci. Technol. 2018, 34, 2178–2182. [Google Scholar] [CrossRef]
- Zhang, Z.Q.; Chen, D.D.; Zhao, H.; Liu, S.F. A comparative study of clock rolling and unidirectional rolling on deformation/recrystallization microstructure and texture of high purity tantalum plates. Int. J. Refract. Met. Hard Mater. 2013, 41, 453–460. [Google Scholar] [CrossRef]
- Liu, Y.H.; Liu, S.F.; Zhu, J.L.; Deng, C.; Fan, H.Y.; Cao, L.F.; Liu, Q. Strain path dependence of microstructure and annealing behavior in high purity tantalum. Mater. Sci. Eng. A 2017, 707, 518–530. [Google Scholar] [CrossRef]
- Kondo, S.; Mitsuma, T.; Shibata, N.; Ikuhara, Y. Direct observation of individual dislocation interaction processes with grain boundaries. Sci. Adv. 2016, 2, e1501926. [Google Scholar] [CrossRef] [PubMed] [Green Version]
- Lu, X.; Fionn, P.E.D.; Xu, Y.L. A crystal plasticity investigation of slip system interaction, GND density and stored energy in non-proportional fatigue in Nickel-based superalloy. Int. J. Fatigue 2020, 139, 105782. [Google Scholar] [CrossRef]
- Deng, C.; Liu, S.F.; Fan, H.Y.; Hao, X.B.; Ji, J.L.; Zhang, Z.Q.; Liu, Q. Elimination of Elongated Bands by Clock Rolling in High-Purity Tantalum. Metall. Mater. Trans. A 2015, 46, 5477–5481. [Google Scholar] [CrossRef]
- Wilkinson, A.J.; Dingley, D.J. Quantitative deformation studies using electron back scatter patterns. Acta Metall. Mater. 1991, 39, 3047–3055. [Google Scholar] [CrossRef]
- Oyarzábal, M.; Martínez-de-Guerenu, A.; Gutiérrez, I. Effect of stored energy and recovery on the overall recrystallization kinetics of a cold rolled low carbon steel. Mat. Sci. Eng. A 2008, 485, 200–209. [Google Scholar] [CrossRef]
- Choi, S.-H.; Jin, Y.-S. Evaluation of stored energy in cold-rolled steels from EBSD data. Mat. Sci. Eng. A 2004, 371, 149–159. [Google Scholar] [CrossRef]
- Bieler, T.R.; Eisenlohr, P.; Zhang, C.; Phukan, H.J.; Crimp, M.A. Grain boundaries and interfaces in slip transfer. Curr. Opin. Solid State Mater. Sci. 2014, 18, 212–226. [Google Scholar] [CrossRef] [Green Version]
- Liu, Y.H.; Liu, S.F.; Fan, H.Y.; Deng, C.; Cao, L.F.; Ni, H.T.; Liu, Q. Orientation-dependent grain boundary characteristics in tantalum upon the change of strain path. Mater. Charact. 2019, 154, 277–284. [Google Scholar] [CrossRef]


| C | N | H | O | Nb | Mo | W | Ti | Si | Fe | Ni | Ta |
|---|---|---|---|---|---|---|---|---|---|---|---|
| 9 | 20 | 2 | 30 | 6.4 | 0.14 | 0.61 | <0.001 | <0.005 | <0.005 | <0.005 | Balance |
Publisher’s Note: MDPI stays neutral with regard to jurisdictional claims in published maps and institutional affiliations. |
© 2022 by the authors. Licensee MDPI, Basel, Switzerland. This article is an open access article distributed under the terms and conditions of the Creative Commons Attribution (CC BY) license (https://creativecommons.org/licenses/by/4.0/).
Share and Cite
Zhu, Q.; Liu, Y.; Song, K.; Zhou, Y.; Yang, X.; Liu, S.; Cao, L. Study on the Grain Rotation of High-Purity Tantalum during Compression Deformation. Crystals 2022, 12, 676. https://doi.org/10.3390/cryst12050676
Zhu Q, Liu Y, Song K, Zhou Y, Yang X, Liu S, Cao L. Study on the Grain Rotation of High-Purity Tantalum during Compression Deformation. Crystals. 2022; 12(5):676. https://doi.org/10.3390/cryst12050676
Chicago/Turabian StyleZhu, Qianqian, Yahui Liu, Kexing Song, Yanjun Zhou, Xiaokang Yang, Shifeng Liu, and Lingfei Cao. 2022. "Study on the Grain Rotation of High-Purity Tantalum during Compression Deformation" Crystals 12, no. 5: 676. https://doi.org/10.3390/cryst12050676
APA StyleZhu, Q., Liu, Y., Song, K., Zhou, Y., Yang, X., Liu, S., & Cao, L. (2022). Study on the Grain Rotation of High-Purity Tantalum during Compression Deformation. Crystals, 12(5), 676. https://doi.org/10.3390/cryst12050676