Abstract
Solid Oxide Cells (SOCs) are under intensive development due to their great potential to meet the 2030 targets for decarbonization. One of their advantages is that they can work in reversible mode. However, in respect to durability, there are still some technical challenges. Although the quick development of experimental and modeling approaches gives insight into degradation mechanisms, an obligatory step that cannot be avoided is the performance of long-term tests. Taking into account the target for a commercial lifetime is 80,000 h, experiments lasting years are not acceptable for market needs. This work aims to develop accelerated stress tests (ASTs) for SOCs by the artificial aging of the fuel electrode via redox cycling, which follows the degradation processes of calendar aging (Ni coarsening and migration). However, it can cause irreversible damage by the formation of cracks at the interface anode/electrolyte. The advantages of the developed procedure are that it offers a mild level of oxidation, which can be governed and regulated by the direct impedance monitoring of the Ni network resistance changes during oxidation/reduction on a bare anode sample. Once the redox cycling conditions are fixed and the anode/electrolyte sample is checked for cracks, the procedure is introduced for the AST in full-cell configuration. The developed methodology is evaluated by a comparative analysis of current voltage and impedance measurements of pristine, artificially aged, and calendar-aged button cells, combined with microstructural characterization of their anodes. It can be applied in both fuel cell and electrolyzer mode. The results obtained in this study from the electrochemical tests show that the artificially aged experimental cell corresponds to at least 3500 h of nominal operation. The number of hours is much bigger in respect to the microstructural aging of the anode. Taking into consideration that the duration of the performed 20 redox cycles is about 50 to 60 working hours, the acceleration factor in respect to experimental timing is estimated to be higher than 60, without any damaging of the sample. This result shows that the selected approach is very promising for a large decrease in testing times for SOCs.
1. Introduction
Solid Oxide Cells (SOCs) are under intensive development due to their great potential to reduce net greenhouse gas emissions by at least 55% by 2030. They can ensure the integration of renewable sources into the energy mix, combining hydrogen production by electrolysis, and alternatively, electricity regeneration, including the option for the operation of one and the same device in reversible mode. There are still some technical challenges for large-scale deployment, namely, durability and costs [1], which still need intensive research, innovation actions, and technological progress. The target for a commercial lifetime of 80,000 to 90,000 h for stationary applications [2] requires a decrease in the degradation rates to acceptable values—less than 0.5%.kh−1, since at the moment they are still in the range of 1–3%.kh−1 in fuel cell mode, and between 2 and 10%.kh−1 in electrolyzer mode of operation [3,4,5,6].
For the improvement and optimization of SOCs’ long-term performance, it is important to identify and quantify the degradation sources and to use them as a base for the development of successful mitigation strategies [7,8]. On the cell and stack levels, there are numerous studies on the degradation of cell components with emphasis on electrodes, electrolytes, and interconnects [9,10,11,12,13,14,15,16,17,18,19,20,21,22,23,24]. However, the picture is more complicated, since the degradation processes are related to the cell/stack design, operating conditions, geometrical and technological factors, quality of the raw materials, precision of the instrumentation, preconditioning, testing protocols, and predictable and unpredictable failures [25,26,27,28,29]. The “domino effect,” in which one degradation factor activates other degradation mechanisms, cannot be avoided [30]. Thus, the work on lifetime improvement needs long-term electrochemical tests, followed by postmortem analyses for the identification and assessment of the degradation mechanisms in different cell/stack components, combined with the development of degradation models for the acceleration of the optimization steps. Many works are focusing on the phenomena at the microscale level, since microstructure is regarded as an important optimization parameter in relation to the triple phase boundaries (TPBs), which govern the number of electrocatalytic sites available for reaction and their accessibility by the transport of reactants and products. Significant improvements in the TPB characterization of pristine and aged samples are realized, based on non-destructive 3D reconstructions of the microstructure applying synchrotron X-ray holotomography [9,11,14,18,31,32,33]. The data are then introduced in multiscale models for the determination of the degradation of the cell or its components, due to aging [9,10,11,12,13,18,30,31,32,33].
Although the quick development of experimental and modeling approaches gives much insight into the degradation mechanisms that are the basis for the development of effective mitigation strategies, an obligatory step that cannot be avoided is the performance of long-term tests for the accumulation of reliable data, which can continue for several years. In addition, the validation of stack components over several years before their integration in a real system is not compatible with the times requested by fuel cell manufacturers for the market deployment of their product. There are only few experiments exceeding 40,000 h [34], with the longest one reaching 100,000 h, i.e., more than 10 years [35]. However, at the end of testing, the stack no longer corresponded to the SoA technology and the conclusions, although correct, could not answer the present day technological challenges. This problem can be overcome by the introduction of accelerated stress tests, which can be of great benefit, since they will ensure the investigation of long-term phenomena in a shorter time. AST will allow faster evaluation of new materials and provide standardized sets of fast tests to benchmark materials and/or stack components, and will accelerate the developments to meet cost and durability targets. The challenge is that the testing conditions have to activate the same degradation mechanisms as in non-accelerated testing, thus preventing the system from eventual irreversible changes, which may bring to false results. Since there are no definite criteria for the level of acceleration of a specific degradation phenomenon, the selection of aggravating conditions is a critical moment which has to be overcome.
Nickel-yttria stabilized zirconia (Ni-YSZ) cermet is the most commonly employed material for SOC fuel electrodes (anode in SOFC mode and cathode in SOEC mode), due to its good electrochemical performance and lower price. The main degradation source of the electrode during operation in both SOFC and SOEC modes concerns microstructural changes in the Ni network due to Ni agglomeration, resulting in the phase coarsening, migration, and volatization changing the Ni distribution in the electrode. The Ni mean particle diameter increases due to the sintering of the smallest particles. The global effect is decrease in the TPB and in the Ni/gas specific surface area [7,10,11,12,13,14,15,16,17,33,36,37,38,39]. The migration over long distances can bring to Ni depletion near the electrolyte interface [11]. The processes are more active in electrolyzer mode.
During long-term operation, the fuel electrode can show significant electrochemical and mechanical degradation due to Ni reoxidation, which brings to volume expansion that causes microstructural changes [40,41]. This phenomenon can be caused by changes in local conditions, such as leakage, fuel starvation, increased oxygen partial pressure, accidental switch off, etc. The repetitive changes of Ni volume damage the cermet network in two ways: (i) the reduction in the TPB density due to accelerated Ni aglomeration and (ii) the production of cracks at the electrode/electrolyte interface; i.e., the degradation influences both the cell performance and its mechanical stability [42]. The high levels of degradation are examined in intensive studies of Ni oxidation/reduction for deeper insight into the occurring processes, as well as for the development of mitigation strategies for increased oxidation tolerance [43,44,45,46,47,48,49,50,51,52,53]. The degradation caused by the reduction-oxidation cycles is evaluated by electrochemical testing and microstructural post-mortem characterization, based on the comparative analysis of pristine and cycled samples, often supported by 3D tomography [42,53,54,55,56]. Results of dynamic in situ analyses that record the changes in the microstructure exposed to different redox conditions are also reported, however, they are carried out in conditions that strongly differ from those of the operating environment [50,51,53,57,58]. Most often the experiments for the chemical oxidation of the YSZ/Ni cermet are performed in a furnace at a high temperature and a long enough time to cause oxidation of the entire Ni network. There are some studies with partial oxidation, i.e., the outside of the sample is oxidized while the core is in a metallic state. Oxidation of about 25% at 800 °C prevents the interface electrode/electrolyte from developing cracks. At a lower temperature, the depth of oxidation without crack formation could be even higher [59].
In respect to the kinetics of the oxidation process, in [60] a detailed analysis of Ni oxidation is performed, including a comparison between pure Ni oxidation and the oxidation of Ni/YSZ cermet [61]. In comparison to pure Ni (reduced in similar conditions), Ni/YSZ cermet starts to oxidize at a lower temperature with a faster rate [62]. TGA studies register changes in the oxidation kinetics with temperature [63]. At lower temperatures (550–650 °C) under dry air, theso-called “homogeneous” oxidation is observed, in which the full anode layer starts to oxidize with a rate-limiting process of solid-state diffusion. At higher temperatures (between 700 and 800 °C), the transition towards “inhomogeneous” oxidation occurs when the limiting process changes to gas phase diffusion, due to pore closing when Ni oxidizes to NiO at the composite surface [64].
Direct measurements of the Ni surface oxidation of cermet anode are performed in operando by a near-ambient pressure X-ray photoelectron and near edge X-ray absorption fine structure spectroscopies in electrolyzer mode. They show that the Ni 2p peak can be deconvoluted into two components: one sharp Ni 2p3/2 peak around 853 eV, which corresponds to metallic Ni, and a broader Ni 2p3/2 feature at 856 eV, associated with oxidized Ni. The spectrum recorded in the H2O/H2 is exclusively due to the metallic Ni, while upon the co-feeding of O2, the characteristic peak of oxidized Ni appears [65].
The analysis of the degradation mechanisms and conditions shows that redox cycling can cause accelerated degradation, leading to Ni aglomeration and migration. However, there is also possibility of severe degradation due to mechanical cracks, which can damage irreversibly the anode/electrolyte interface. Thus, redox cycling can be used as a tool for the accelerated degradation of the fuel electrode, however, the process has to be strictly governed with fine tuning of the oxidation depth, so that the redox cycles would mimic normal aging, avoiding the formation of cracks at the interface.
This paper aims at developing an advanced accelerated stress test procedure based on the artificial aging of the Ni cermet anode via chemical redox cycling, which is performed in full-cell configuration in the experimental set up before operation, i.e., ex situ in respect to the testing conditions.
2. Experimental
The experiments were performed on button cell sized samples in several configurations, prepared by SOLIDpower, according to a technological procedure that is subject to proprietary information: NiO-YSZ anode pellets (bare anode) with a diameter of 20 mm and a thickness of 250 µm; anode/electrolyte with the same anode and 10 µm thick electrolyte (8 mol% Y2O3 stabilized zirconia) with GDC barrier layer; anode-supported button cell with the same anode/electrolyte and oxygen electrode (La,Sr)(Co,Fe)O3-δ (LSCF) perovskite with active surface area of 0.28 cm2 and a (La,Sr)CoO3-δ (LSC) layer on top for efficient current collection.
The initial reduction was performed at 800 °C in a two-stage process with 30 min stepwise change (6 steps) of the gas mixture from N2/H2 = 7.4/0 Nml min−1 cm−2 to N2/H2 = 0/9.5 Nml min−1 cm−2, followed by an additional 90 min reduction in pure hydrogen [66].
The redox cycling conditions include both oxidation and reduction and follow a preliminary three-step procedure:
- Step 1. Determination of the oxidation level by in situ impedance monitoring of the changes in the Ni network resistance [66,67,68] during oxidation of bare anode. The oxidation depth is selected based on the preliminary chosen increase of the Ni network resistance. Since the impedance in reduced state has an inductive behavior, the oxidation should not change this state, thus ensuring preservation of the electronic conductivity network. More information about this step is given in the next section;
- Step 2. Once the appropriate experimental oxidation conditions are determined, they serve as internal standard for redox cycling and are applied on anode/electrolyte sample to check the effect of the selected procedure on the state of the interface anode/electrolyte;
- Step 3. Finally, the procedure is applied for redox cycling in full-cell configuration. In this stage, the experiments are performed on button cells. In principle, they could be carried out also on big cells and stacks.
The level of degradation is governed by the number of redox cycles and the oxidation depth. Its evaluation is based on comparison with results (own, or available in the literature) from: (i) electrochemical tests (i-V curves, impedance measurements) of calendar-aged samples; (ii) post-mortem analysis of microstructural changes obtained from long-term tests (calendar aging).
The redox cycling of the anodes was performed at 750 °C. The initially reduced anode was exposed to an oxidation blend of N2 (4 Nml min−1 cm−2) and air (4 Nml min−1 cm−2) with an adjusted duration to achieve a given level of oxidation, in respect to the chosen increase in Ni network resistance. Before and after the oxidation step, the test rig chamber is purged with nitrogen. It should be noted that the exact experimental conditions depend on the test rig architecture. Since the Ni network resistance continues to increase in N2 flow after oxidation, due to the residual oxygen in the pipeline and in the rig chamber, the duration of the post oxidation in nitrogen should be also included in the oxidation step and measures for its deoxidation should be taken [67]. More details about the redox cycling conditions and processes are given in the next section.
The button cell testing setup consists of a completely ceramic housing. The cell is sealed on the oxygen electrode side by ceramic paste (Ceramabond) following the procedure of the producer (Aremco products Inc). The testing was performed at 750 °C and gas flows: air 437.5 Nml min−1 cm−2 and humidified (3%) hydrogen 79.4 Nml min−1 cm−2. In this study the experiments are designed for fuel cell mode. However, they can be also valid for electrolyzer mode. In the latter mode, the oxidation of the fuel electrode should be performed in the presence of water vapor.
The impedance measurements were carried out on IVIUM CompactStat with a frequency range from 1 MHz down to 1 Hz, with density 5 points/decade, in the temperature range from 22 to 800 °C, and with the amplitude of the AC signal depending on the impedance of the sample. A furnace with DC power supply and temperature drift during measurements less than 0.5 °C ensures reproducible data with high quality. For the redox cycling experiments Pt meshes were used for contacts, which makes the system stable in both oxidizing and reducing atmospheres.
Post-mortem microstructure and porosity analyses were performed on a scanning electron microscope (SEM) Zeiss EVO 40 with an acceleration voltage of 20 kV, equipped with an energy dispersive X-ray spectroscope (EDXS Pentafet). The samples were mounted in epoxy resin and polished with up to 250 nm grain size diamond paste on specific tissue (MD-NAP, Struers, Denmark). A calibration procedure using a standard sample of pure Cobalt was used before each analysis. SEM-BSE pictures with magnification 5000× were collected for quantitative image analysis and treated with Zeiss Axiovision software to estimate the porosity and Ni crystals volume fraction. The anode cross section was divided into 6 zones (45.22 μm height and 59.88 µm width).
3. Experimental Results and Discussion
3.1. Initial Reduction
The initial reduction of the anode is the first prerequisite test, which gives preliminary information about the redox cycling behavior of the sample in the selected test rig. The half-cell configuration with the bare anode positioned between two Pt meshes ensures the direct monitoring only of the Ni network changes both qualitatively (based on the changes of the impedance shape) and quantitatively (determining the resistance of the Ni network for different stages of the reduction process) [66,67,68]. It should be noted that the absolute value of the Ni network resistance in the anode matrix is much lower than the measured one. In this paper, we use the term “Ni network resistance;” however, this also includes the ohmic resistance of the test rig. As seen in the experimental results below, this parameter is very sensitive to the changes of the Ni network in respect to oxidation and is successfully used as an internal standard for governing and monitoring the process.
A good illustration of the method and its sensitivity is given in Figure 1, which represents the impedance changes during the initial reduction of NiO to Ni. The primary configuration (green anode between two Pt meshes) resembles capacitor. Its impedance has typical capacitive behavior with a resistance of about 8 kΩ (Figure 1a). Between the ninth and the twelfth minutes of the reduction (Figure 1b,c), the impedance drastically changes with the transition from capacitive to inductive behavior that is typical for electronic conductivity [68]. A sharp decrease in the resistance from few kΩ to about 150 mΩ is observed. In the next few minutes, it drops under 100 mΩ, and in the last 100 min of the reduction procedure, there are no changes in the measured resistance. During cooling, the resistance decreases, which is characteristic for metals (Figure 2) [69].
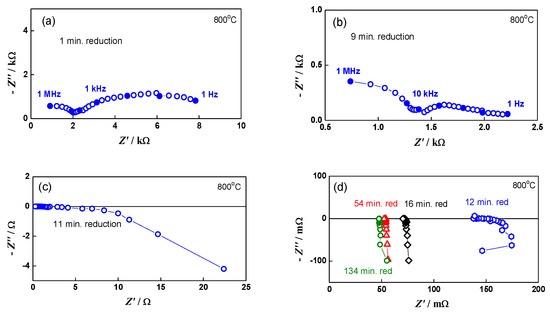
Figure 1.
Impedance diagrams in different steps of the initial bare anode reduction: (a) impedance diagram during the first minute of the reduction; (b) impedance diagram during the ninth minute of the reduction; (c) impedance diagram during the eleventh minute of the reduction; (d) comparison of impedance diagrams at different stages of the reduction-from the twelfth minute to the end of the reduction process.
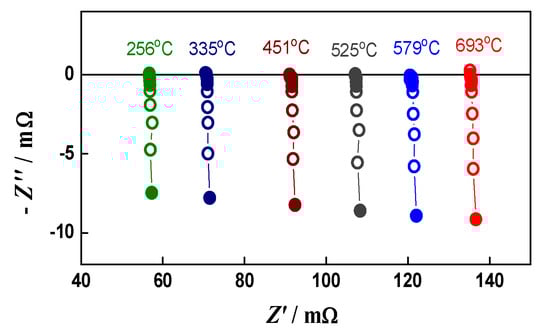
Figure 2.
Impedance diagrams during cooling of the reduced bare anode.
The obtained results show that the selected approach is very sensitive and can be used for governing and monitoring Ni network changes in the YSZ matrix during redox cycling. However, since the transition from capacitive to inductive behavior, i.e., from a dominant oxidized state to a dominant reduced state is very fast, a precise tuning of the redox cycling regime is needed. A general criterion was selected: the increase in the Ni network resistance should keep the inductive impedance shape, i.e., the electronic conductivity of the network should not be totally destroyed.
3.1.1. Artificial Aging of Bare Anode by Redox Cycling for Fine Tuning of the Experimental Conditions
The preliminary registration of Ni network resistance that increases after the replacement of air with nitrogen has prompted the question about the development of a precise procedure for eliminating the “parasitic” continuous oxidation by quick removal of the residual oxygen, thus ensuring partial oxidation. The following steps are included in the oxidation procedure: (i) isolation of the rig chamber (for about 30 s after stopping the oxidation and purging the air pipeline with N2, (ii) introduction of hydrogen shortly before the Ni network resistance reaches the selected limiting value. Hydrogen quickly reacts with the residual oxygen and prevents the sample from further oxidation. This may be accompanied with a small increase (1–2 °C) in the temperature of the reaction zone close to the sample.
For approbation of the methodology in regards to reproducibility, a “soft” oxidation level was selected with Ni network resistance enhancement only used once or twice (Figure 3a) [67]. The bare anode sample was subjected to 20 redox cycles. Excellent reproducibility of the oxidized state was obtained (Figure 3b). The selected conditions were repeated on the anode/electrolyte sample, where no cracks at the interface were observed, and then on button cell. More information about this experiment can be found in [67].
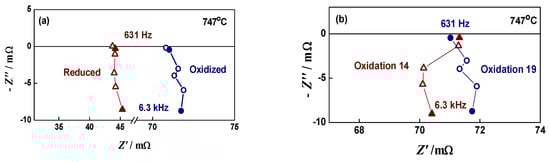
Figure 3.
Impedance diagrams of bare anode during “soft” redox cycling (2 times increase in RNi network): (a) reduced and oxidized state of bare anode; (b) two oxidized states of bare anode.
For a deeper oxidation level (in the upper limit of the affordable oxidation depth), redox cycling conditions were selected with about a 5-fold increase in Ni network resistance with respect to the initial measurement of the reduced bare anode, keeping the inductive behavior of the measured impedance (Figure 4). The timing for the introduction of hydrogen for the reduction stage was selected empirically after monitoring and analysis of the impedance increase. This step is of crucial importance for the fine tuning of the oxidation cycle and for ensuring reproducible redox cycles.
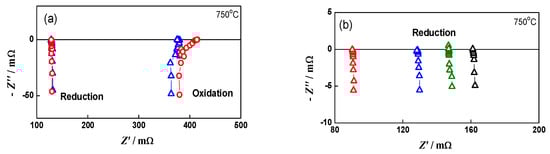
Figure 4.
Impedance diagrams of bare anode during redox cycling: (a) two consecutive redox cycles—Cycle 7 (∆) and Cycle 8 (○); (b) reduced state after four different redox cycles—Cycle 2 (∆), Cycle 7 (∆), Cycle 11 (∆), Cycle 18 (∆).
The bare anode was subjected to 20 redox cycles. The good reproducibility is demonstrated in Figure 4a, where the impedance diagrams in two consecutive oxidation/reduction states are presented. After the sixth cycle, the sample resistance in reduced state started to increase, which indicates accelerated aging (Figure 4b). It should be noted that this phenomenon was not observed in the “soft” oxidation experiment (Figure 3b) [67].
The electrochemically registered aging is also confirmed by the SEM/EDX microstructural analysis. For the presentation of the Ni distribution in the volume of the anode, a normalized plot was used, which is less affected by porosity (Figure 5). Since the cermet anode is produced by tape casting, the slurry has a homogeneous distribution of NiO. In addition, Y and Zr are not diffusing or forming volatile compounds. Thus, the variation in the ratio of Ni:YSZ should correspond to a change in the Ni content. As it can be seen in Figure 5, before redox cycling Ni is distributed quite homogeneously in the volume of the anode, but after 20 redox cycles, there is a visible, uneven redistribution caused by Ni migration and aglomeration. On the side opposite to the gas flow, a distinct Ni depletion is observed, which is an evidence for Ni migration.
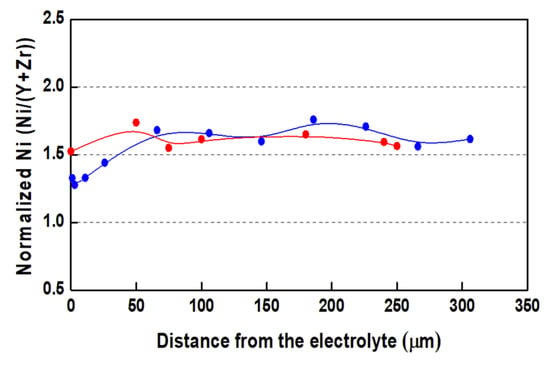
Figure 5.
Normalized Ni content from edge to edge of bare anode after initial reduction (●) and after 15 redox cycles (●).
The comparison of the anode SEM-BSE images after initial reduction (Figure 6a) and after 10 redox cycles (Figure 6b) illustrates the microstructural changes of the Ni grains (presented in red) which agglomerate and modify their shape, combined with an increase in the porosity (Figure 6c,d). The quantitative image analysis shows that the different fractions of agglomerated particles do not exceed 5%. Their distribution is presented in Figure 6e,f. Since the Ni grains have irregular shape, their size is presented as surface area (µm2). While for the initially reduced sample, the biggest size of the Ni grains does not exceed 2.0–2.4 µm2, after 10 redox cycles there is even fraction with a size above 20 µm2.
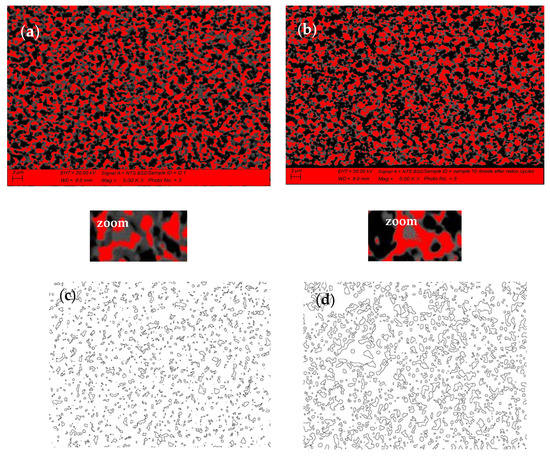
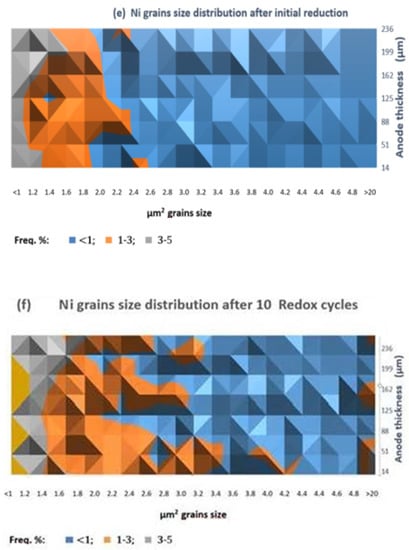
Figure 6.
SEM-BSE image analysis of bare anode: (a) Ni grains distribution after initial reduction; (b) Ni grains distribution after 10 redox cycles (red—Ni; black—pores; grey—YSZ); (c) Porosity after initial reduction; (d) Porosity after 10 redox cycles; (c,d) Ni grain size distribution; (e) Ni grains size distribution after initial reduction; (f) Ni grain size distribution after 10 Redox cycles.
For confirmation of the partial oxidation, after 13 redox cycles on bare anode the sample was cooled in an oxidized state. Logically, a higher resistance was measured due to the presence of NiO phase (Figure 7a).
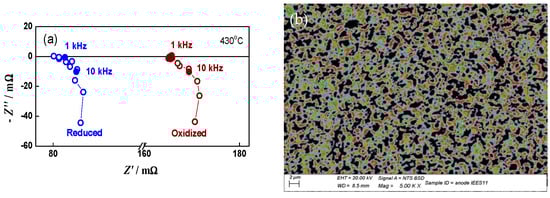
Figure 7.
Bare anode cooled in oxidized state (in nitrogen) after 13 redox cycles: (a) impedance diagrams after the initial reduction (●) and after 13 redox cycles (●); (b) SEM-BSE cross section image: red—Ni; green—NiO; black—pores; grey—YSZ.
The SEM-BSE cross section image (Figure 7b) registers metallic nickel in the whole volume of the anode (red parts), which ensures conductivity, in parallel with the presence of NiO (green parts).
3.1.2. Artificial Aging of Anode/Electrolyte by Redox Cycling
A series of experiments was also performed on the system anode/electrolyte, following the oxidation conditions determined for the bare anode. In this configuration, the Ni network oxidation cannot be monitored directly by impedance, but it is defined with the experimental conditions for the bare anode redox cycling. Figure 8a, which gives the impedance of the configuration anode/electrolyte for different oxidation cycles, demonstrates the reproducibility of the procedure, which ensures a constant level of oxidation. In this stage, the impedance diagrams are analyzed qualitatively. The SEM images show that there are no cracks at the anode/electrolyte interface (Figure 8b). This test in half cell configuration confirms the appropriateness of the conditions for full-cell aging via redox cycling.
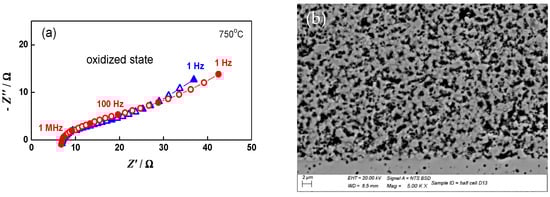
Figure 8.
Redox cycling of anode/electrolyte sample: (a) impedance diagrams in oxidized state after the 4th (∆) and 8th (○) oxidation; (b) SEM image of the interface anode/electrolyte after 15 redox cycles.
3.1.3. Artificial Aging of Button Cell by Redox Cycling
The final goal of the developed methodology is the performance of redox cycling on a button cell. Two approaches were applied for monitoring and controlling the redox cycling: electrochemical testing and microstructural characterization. For evaluation of degradation level, a comparative electrochemical and microstructural analysis with calendar aged cells was performed.
Electrochemical testing. The electrochemical control was ensured by current-voltage (i-V) measurements which give an integral picture of the cell’s ability to produce power, combined with impedance measurements which ensure local electrochemical characterization in definite working points.
The degree of aging by anode redox cycling with respect to the initial state of the sample can be extracted from the periodically measured i-V curves via calculations of the potential U change at a constant current I (or the opposite) as a function of the number of cycles (Figure 9). It is convenient to present the results in percentages. They are compared with data from calendar aged cells with the same composition and load for evaluation of the acceleration with respect to the total cell performance. The degradation with respect to the anode is much higher because it compensates for the degradation of the electrolyte and oxygen electrode, which occurs during calendar aging.
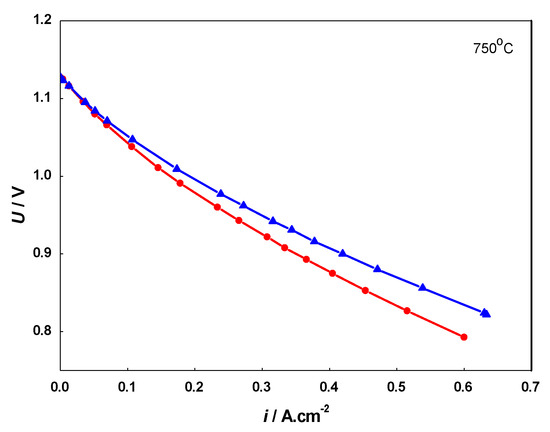
Figure 9.
Current-voltage (i-V) curves of: artificially aged cell before redox cycling (▲) and after 20 redox cycles (•).
The i-V curves obtained during redox cycling demonstrate a well-distinguished deterioration of the cell performance in comparison to the initial state. The results from the evaluation of the degradation extracted from the i-V measurements are presented in Table 1.

Table 1.
Voltage decrease at constant current density extracted from the i-V curves measured during redox cycling.
A comparative analysis was also performed with i-V curves (Figure 10) from a cell with the same composition, subjected to 9000 h field testing in similar operating conditions [70]. The data presented in Table 2 show similarity in respect to the depth of degradation between the artificial aging with 20 redox cycles and the calendar aging of 4000 h. However, it should be taken into consideration that the degradation by calendar aging also involves other cell components (cathode and electrolyte), while the artificial aging via redox cycling affects mainly the anode. Thus, in respect to the anode degradation, the accelerated testing should correspond to higher level of degradation, which is discussed below in the analysis of the microstructural characterization.
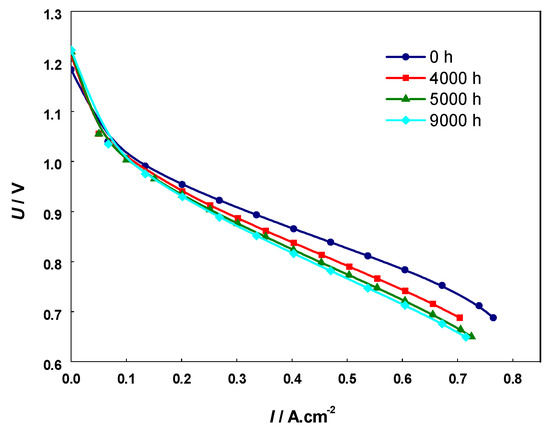
Figure 10.
Current-voltage (i-V) curves of calendar aged cell operated for 9000 h.
Table 2.
Voltage decrease at constant current density extracted from i-V curves measured during 9000 h field testing [70].
The impedance measurements for the monitoring and analysis of the cell behavior during redox cycling were performed in both the oxidized and reduced states. As presented in Figure 11, during oxidation mainly the lower frequency part of the impedance (100 Hz–1 Hz) increases. The potential varies between 915 mV in the oxidized state and 1015 mV in the reduced state, since the cell does not reach the normal operating conditions between two cycles.
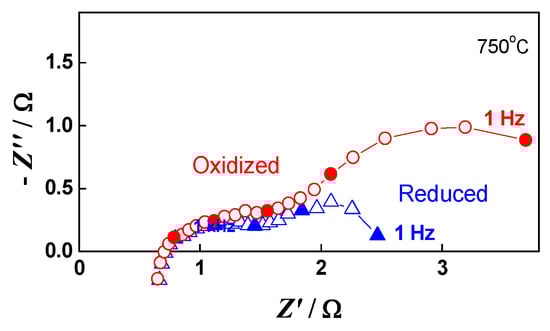
Figure 11.
Impedance diagrams of button cell measured during the 20th redox cycle: Oxidized state (○); Reduced state (∆).
The impedance measurements can be also used for evaluation of the depth of degradation based on the increase in the cell ASR with redox cycling. For quantitative degradation evaluation, impedance testing was performed after i-V measurements at OCV and under loads of 0.10 Acm−2, 0.28 A.cm−2, and 0.5 A.cm−2 (Figure 12).
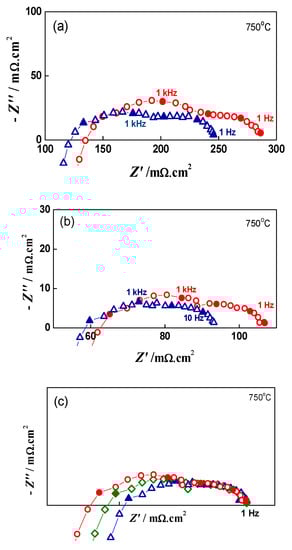
Figure 12.
Impedance diagrams of button cell before Redox cycling (∆), after 7 Redox cycles (□) and after 20 Redox cycles (○) under load of: (a) 0.28 A.cm−2; (b) 0.50 A.cm−2; (c) Normalized impedance data (0.50 A.cm−2 ) towards 1 Hz.
Impedance can also distinguish contributions from different parts of the cell. In up to the sixth redox cycle, a small decrease in the ohmic resistance was registered (Figure 13). This phenomenon is often observed during the first 1000 h of calendar aging, which is explained most often by the improvement of the contacts [71].
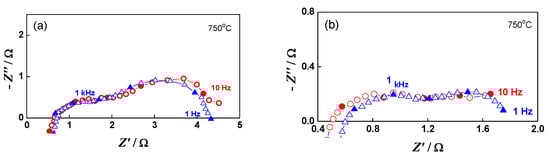
Figure 13.
Impedance diagrams of button cell after the initial reduction (∆) and after the 6th redox cycle (○): (a) at OCV; (b) under load 0.10 A.cm−2.
The evaluation of the depth of degradation at load i = 0.5 A.cm−2, based on the calculation of the ASR increase (ohmic RΩ, polarization Rp and total RT) as a function of the redox cycling, is presented in Table 3. The data show that both ohmic (after the sixth cycle) and polarization resistance increase, the former by 8.2% and the latter by 24.5% for 20 cycles. The normalization of the impedance data towards the lowest frequency point of 1 Hz (Figure 12c) illustrates that the low frequency depressed semicircle has a constant shape and size, while an increase in the polarization resistance is observed in the higher frequency range.
Table 3.
ASR (ohmic RΩ, polarization Rp and total RT) of button cell after the initial reduction, after the 7th and 20th redox cycles.
Microstructural characterization. Since long-term calendar aging includes all components of the cell, it should be expected that cell aging by redox cycling corresponds to a longer calendar aging test in respect to anode degradation. For comparison of the degradation in redox cycled (20 cycles) and calendar aged anodes in cell configuration, an SEM/EDX microstructural analysis is performed in a series of samples subjected to different testing conditions and timing (Table 4).
Table 4.
Samples Description.
In respect to the Ni distribution in the volume of the anode, the same tendency as in that of the bare anode is observed: in contrast to the Pristine Sample A, where Ni is distributed quite homogeneously, all the tested samples (Table 4, samples B–E) exhibit uneven redistribution, as well as Ni depletion, in the vicinity of the interface anode/electrolyte (Figure 14).
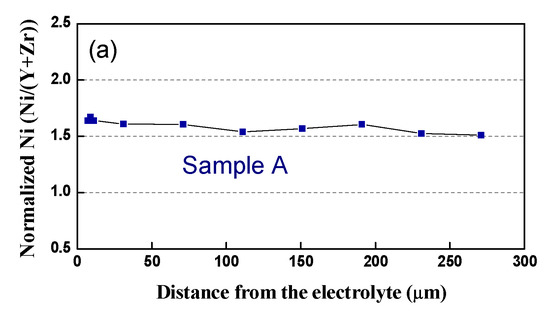
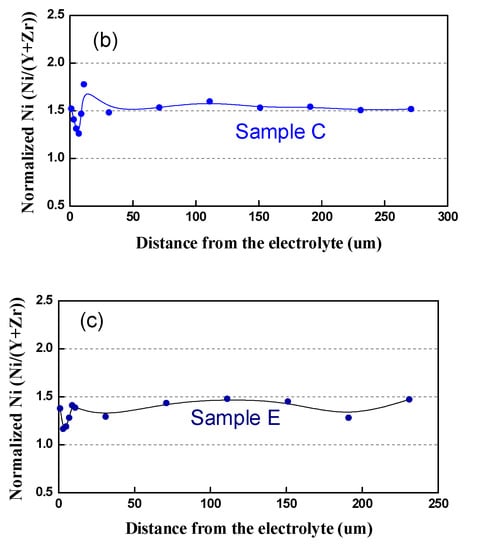
Figure 14.
Normalized Ni content from the interface anode/electrolyte to the outer side: (a) Sample A (after initial reduction); (b) Sample C (3500 h); (c) Sample D (3000 h).
The Ni grain size distribution is presented in Figure 15 and illustrated with SEM-BSE images (Figure 16), which distinguish the three phases of the cermet—Ni, YSZ, and pores. More than 85% of the Ni grains in the pristine cell A measured by calibrated image analysis have a maximum surface below 1 μm2 (Figure 15a and Figure 16a). In the redox cycled as well as in the calendar aged cells, this number decreases, while the quantity of the larger grains increases (Figure 15b,c and Figure 16b–e). The comparative analysis of the histograms with Ni grains distribution shows that big changes in the microstructure are registered for the sample after 20 redox cycles, when a fraction of about 8% with grain sizes about and above 20 μm2 is observed (Figure 15b and Figure 16b). Bigger grains are also formed in sample D (Figure 16d), which is tested in regimes with different operating parameters (temperature, gas flow, current density, etc.) [72] and sample E (Figure 15e and Figure 16e), which is tested in electrolyzer mode, while the calendar aging of sample C causes a smooth increase in grain size (Figure 15c and Figure 16c). Cracks at the anode/electrolyte interface are observed in samples D and E, while the artificially aged sample B has an unaffected interface.
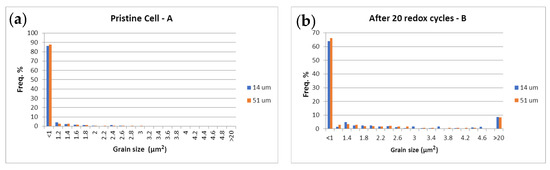
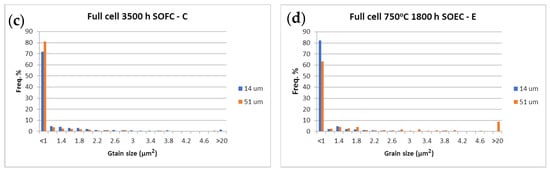
Figure 15.
Ni grain size surface distribution (µm2) at 14 µm (■) and 51 µm (■) from the anode/electrolyte interface.
Figure 16.
SEM-BSE images of: (a) sample A (pristine); (b) sample B (20 redox cycles); (c) sample C (3500 h); (d) sample D (3000 h); (e) sample E (1800 h in electrolyzer mode) (red—Ni; black—pores; grey—YSZ).
The SEM-BSE images in Figure 16 illustrate the enhancement of the Ni grain size and the decrease in their connectivity, due to morphological changes and an increase in porosity. This process causes the reduction of the triple phase boundary points and thus a performance deterioration. The microstructural comparative analysis of anode aging presented in Figure 15 and Figure 16 shows the smooth agglomeration of the Ni grains up to a certain level of degradation (Sample C). At a higher level of degradation, additional exaggerated grain growth appears. A fraction of 5–10% with grains about and above 20 µm2 (Samples B,E) is registered. Similar observations are reported in [54], but they are not discussed and the oxidation conditions are different. The obtained results require a deeper microstructural analysis of samples with a different aging time (above the investigated), which can potentially lead to a quantitative correlation between calendar and accelerated degradation via redox cycling in respect to the anode degradation.
4. Conclusions
The obtained results confirm that an ex-situ artificial aging of SOCs by redox cycling can be applied through accelerated stress tests. The developed procedure has the unique advantage of ensuring the fine tuning of the depth of oxidation and of guaranteeing a high reproducibility, obtained by the in situ impedance monitoring of the changes in the Ni network resistance during oxidation/reduction, which is applied for the first time as a tool for governing the degradation process. The experimental conditions are determined by a separate experiment on a bare anode with precise impedance monitoring of the Ni network formation, connected with the transformation of the impedance diagram from capacitive to inductive and its partial oxidation/reduction. The mild oxidation retains the inductive behavior, which on the one hand guarantees that the Ni network is not destroyed, and on the other hand prevents the anode from cracking at the interface anode/electrolyte. The selected conditions on the bare anode are validated on anode/electrolyte sample before the testing on a button cell. The procedure can be applied on big cell and stack, which is the next step of this study. It should be stressed that the exact redox cycling conditions (especially duration) depend on the test rig architecture and should be adjusted for every experimental setup, following the proposed algorithm of the procedure. The level of aging can be regulated by the oxidation depth (keeping the inductive shape of the impedance during oxidation) and by the number of redox cycles. In this study the upper limit of the depth of oxidation is determined: about a five-fold increase in the Ni network resistance during oxidation in bare anode configuration.
The electrochemical testing of the artificially aged cell defines the depth of cell degradation caused by the anode redox cycling which is compared with calendar aging. More precise quantitative evaluation based on the changes of the anode microstructure can give correlation with long term testing also in respect to the anode degradation.
For the development of a safe, harmonized AST procedure, it is appropriate to decrease the oxidation depth, which in this study was selected to be at its upper limit, and to increase the number of cycles in order to improve the governing of the process. Another direction is the introduction of a quantitative microstructural correlation between redox cycled and calendar aged cell with respect to the anode degradation. Up until now, the experiments on button cell were performed in fuel cell mode, but they can be also carried out in electrolyzer mode, which is under development.
The selected accelerated stress testing correlates with standard cell performance degradation, corresponding to about 3500 to 4000 h of calendar aging. However, the anode degradation which causes the registered electrochemical behavior in practice compensates for the aging of the other cell components. Thus, it should be much stronger, i.e., going beyond 4000 h.
The AST approach based on accelerated aging of the anode can also be used for further testing of the preliminary aged cell in nominal conditions. This will give new information about the system behavior in conditions of degraded fuel electrode. Thus the “domino effect”, when one degradation factor activates other degradation mechanisms, can be avoided.
When developing a procedure for acceleration of the tests, it is important to evaluate the acceleration factor (AF) with respect to the experimental timing:
AF = tlong term test/tAST bringing to the same degradation
According to the obtained results from this study and taking into consideration that the duration of 20 redox cycles is about 50 to 60 working hours, the AF could be estimated to be more than 60. This strong acceleration does not cause damages on the stressed component or on the cell. The developed accelerated stress test approach is robust and gives opportunities for correlation with “real-world” behavior. This will be elaborated on AST Protocol and further recommended for standardization.
Author Contributions
Conceptualization, D.V., B.B. and P.P.; Formal analysis, P.P., D.M. and R.S.; Investigation, D.V., B.B., A.S., M.K., D.M. and R.S.; Visualization, P.P.; Writing—original draft, D.V. All authors have read and agreed to the published version of the manuscript.
Funding
This research was funded by Fuel Cells and Hydrogen 2 Joint Undertaking: grant number 825027 and Bulgarian Ministry of Education and Science under the National Roadmap for Research Infrastructure 2017-2023 “Energy storage and hydrogen energetics” (ESHER): grant number 354/29.08.2017.
Institutional Review Board Statement
Not applicable.
Informed Consent Statement
Not applicable.
Data Availability Statement
Not applicable.
Acknowledgments
The research leading to these results received funding from the Fuel Cells and Hydrogen 2 Joint Undertaking under grant agreement № 825027. This Joint Undertaking receives support from the European Union’s Horizon 2020 research and innovation program and Hydrogen Europe. The experiments were performed with equipment supported by the Bulgarian Ministry of Education and Science under the National Roadmap for Research Infrastructure 2017–2023 “Energy storage and hydrogen energetics (ESHER)”, approved by DCM № 354/29.08.2017. The authors would like to thank Jerome Laurencin and his group for providing calendar aged cells.
Conflicts of Interest
The authors declare no conflict of interest.
References
- Polverino, P.; Pianese, C.; Sorrentino, M.; Marra, D. Model-based development of a fault signature matrix to improve solid oxide fuel cell systems on-site diagnosis. J. Power Sources 2015, 280, 320–338. [Google Scholar] [CrossRef]
- Hagen, A. SOFC: Cell, stack and system level. In Fuel Cells: Data, Facts and Figures; Stolten, D., Samsun, R.C., Garland, N., Eds.; WILEY-VCH: Weinheim, Germany, 2016; ISBN 978-3-527-33240-3. [Google Scholar]
- Irvine, J.T.S.; Neagu, D.; Verbraeken, M.C.; Chatzichristodoulou, C.; Graves, C.; Mogensen, M.B. Evolution of the electrochemical interface in high-temperature fuel cells and electrolysers. Nat. Energy 2016, 1, 15014. [Google Scholar] [CrossRef]
- Sohal, M.S.; O’Brien, J.E.; Stoots, C.M.; Sharma, V.I.; Yildiz, B.; Virkar, A. Degradation Issues in Solid Oxide Cells During High Temperature Electrolysis. J. Fuel Cell Sci. Technol. 2012, 9, 011017. [Google Scholar] [CrossRef]
- Skafte, T.L.; Hjelm, J.; Blennow, P.; Graves, C. Quantitative review of degradation and lifetime of solid oxide cells and stacks. In Proceedings of the 12th SOFC and SOE forum, Lucerne, Switzerland, 5–8 July 2016; p. B0501. [Google Scholar]
- Blum, L.; Batfalsky, P.; Fang, Q.; de Haart, L.G.J.; Malzbender, J.; Margaritis, N.; Menzler, N.; Peters, R. Solid Oxide Fuel Cell, Stack and System Development Status at Forschungszentrum Jülich. ECS Trans. 2015, 68, 157. [Google Scholar] [CrossRef]
- Kim, S.J.; Choi, M.; Park, M.; Kim, H.; Son, J.; Lee, J.; Kim, B.; Lee, H.; Kim, S.; Yoon, K.J. Acceleration tests: Degradation of anode-supported planar solid oxide fuel cells at elevated operating temperatures. J. Power Sources 2017, 360, 284–293. [Google Scholar] [CrossRef]
- Mougin, J.; Morel, B.; Ploner, A.; Caliandro, P.; Van Herle, J.; Boškoski, P.; Dolenc, B.; Gallo, M.; Polverino, P.; Pohjoranta, A.; et al. Monitoring and diagnostics of SOFC stacks and systems. ECS Trans. 2019, 91, 731. [Google Scholar] [CrossRef]
- Jørgensen, P.; Ebbehøj, S.; Hauch, A. Triple phase boundary specific pathway analysis for quantitative characterization of solid oxide cell electrode microstructure. J. Power Sources 2015, 279, 686–693. [Google Scholar] [CrossRef]
- Vaßen, R.; Simwonis, D.; Stöver, D. Modelling of the agglomeration of Ni-particles in anodes of solid oxide fuel cells. J. Mater. Sci. 2001, 36, 147–151. [Google Scholar] [CrossRef]
- Ananyev, M.; Bronin, D.; Osinkin, D.; Eremin, V.; Steinberger-Wilckens, R.; de Haart, L.G.J.; Mertens, J. Characterization of Ni-cermet degradation phenomena I. Long term resistivity monitoring, image processing and X-ray fluorescence analysis. J. Power Sources 2015, 286, 414–426. [Google Scholar] [CrossRef]
- Tanasini, P.; Cannarozzo, M.; Costamagna, P.; Faes, A.; Van Herle, J.; Hessler-Wyser, A.; Comninellis, C. Experimental and Theoretical Investigation of Degradation Mechanisms by Particle Coarsening in SOFC Electrodes. Fuel Cells 2009, 9, 740–752. [Google Scholar] [CrossRef]
- Hubert, M.; Laurencin, J.; Cloetens, P.; Mougin, J.; Ferreira Sanchez, D.; Pylypko, S.; Morales, M.; Morata, A.; Morel, B.; Montinaro, D.; et al. Solid Oxide Cell Degradation Operated in Fuel Cell and Electrolysis Modes: A Comparative Study on Ni Agglomeration and LSCF Destabilization. ECS Trans. 2017, 78, 3167. [Google Scholar] [CrossRef]
- Villanova, J.; Laurencin, J.; Cloetens, P.; Bleuet, P.; Delette, J.; Suhonen, H.; Usseglio-Viretta, F. 3D phase mapping of solid oxide fuel cell YSZ/Ni cermet at the nanoscale by holographic X-ray nanotomography. J. Power Sources 2013, 243, 841–849. [Google Scholar] [CrossRef]
- Hubert, M.; Laurencin, J.; Cloetens, P.; Morel, B. Impact of Nickel agglomeration on Solid Oxide Cell operated in fuel cell and electrolysis modes. J. Power Sources 2018, 397, 240–251. [Google Scholar] [CrossRef]
- Spotorno, R.; Ferrari, T.; Nicolella, C.; Piccardo, P. Influence of Working Parameters and Degradation on Anode-Supported Cells studied by Electrochemical Impedance Spectroscopy. In Proceedings of the 12th European SOFC & SOE Forum, Lucerne, Switzerland, 5–8 July 2016; p. B1216. [Google Scholar]
- Hauch, A.; Mogensen, M.; Hagen, A. Ni/YSZ electrode degradation studied by impedance spectroscopy-Effect of p(H2O). Solid State Ion. 2011, 192, 547–551. [Google Scholar] [CrossRef]
- Hubert, M.; Laurencin, J.; Cloetens, P.; Da Silva, J.C.; Lefebvre-Joud, F.; Bleuet, P.; Nakajo, A.; Siebert, E. Role of microstructure on electrode operating mechanisms for mixed ionic electronic conductors: From synchrotron-based 3D recon struction to electrochemical modelling. Solid State Ion. 2016, 294, 90–107. [Google Scholar] [CrossRef]
- Miguel-Pérez, V.; Ouweltjes, J.P.; Tarancón, A.; Montinaro, D.; Morata, A. Degradation Studies and Sr Diffusion Behaviour in Anode Supported Cell after 3,000 h SOFC Short Stack Testing. ECS Trans. 2015, 68, 1803. [Google Scholar] [CrossRef]
- Kenney, B.; Karan, K. Engineering of microstructure and design of a planar porous composite SOFC cathode: A numerical analysis. Solid State Ion. 2007, 178, 297–306. [Google Scholar] [CrossRef]
- Jiang, S.P.; Chen, X. Chromium deposition and poisoning of cathodes of solid oxide fuel cells-A review. Int. J. Hydrogen Energy 2014, 39, 505–531. [Google Scholar] [CrossRef]
- Tallgren, J.; Himanen, O.; Bianco, M.; Mikkola, J.; Thomann, O.; Rautanen, M.; Kiviaho, J.; Van Herle, J. Method to Measure Area Specific Resistance and Chromium Migration Simultaneously from Solid Oxide Fuel Cell Interconnect Materials. Fuel Cells 2019, 19, 570–577. [Google Scholar] [CrossRef]
- Oum, M.; Andrews, J.; Steinberger-Wilckens, R. Modelling Microstructural and Chemical Degradation of Ferritic Stainless Steels for SOFC Interconnects. ECS Trans. 2017, 78, 1565. [Google Scholar] [CrossRef]
- Masi, A.; Bellusci, M.; McPhail, S.; Padella, F.; Reale, P.; Hong, J.-E.; Steinberger-Wilckens, R.; Carlini, M. The effect of chemical composition on high temperature behaviour of Fe and Cu doped Mn-Co spinels. Ceram. Int. 2017, 43, 2829–2835. [Google Scholar] [CrossRef]
- Yokokawa, H. Current Status of Rapid Evaluation of Durability of Six SOFC Stacks within NEDO Project. ECS Trans. 2015, 68, 1827. [Google Scholar] [CrossRef]
- Yoshikawa, M.; Yamamoto, T.; Asano, K.; Yasumoto, K.; Mugikura, Y. Performance Degradation Analysis of Different Type SOFCs. ECS Trans. 2015, 68, 2199. [Google Scholar] [CrossRef]
- Yokokawa, H.; Hori, Y.; Shigehisa, T.; Suzuki, M.; Inoue, M.; Suto, T.; Tomida, K.; Shimazu, M.; Kawakami, A.; Sumi, H.; et al. Recent Achievements of NEDO Durability Project with an Emphasis on Correlation between Cathode Overpotential and Ohmic Loss. Fuel Cells 2015, 15, 473. [Google Scholar] [CrossRef]
- Horita, T.; Choa, D.; Wanga, F.; Nishia, M.; Shimonosonoa, T.; Kishimotoa, H.; Yamajia, K.; Britoa, M.E.; Yokokawa, H. Degradation Mechanism with Impurities and Life Time Estimation for SOFCs. ECS Trans. 2012, 42, 297. [Google Scholar] [CrossRef]
- Pellegrinwlli, C.; Huang, Y.L.; Taillon, J.A.; Salamanca-Riba, L.G.; Wachsman, E.D. Investigating the Relationship between Operating Conditions and SOFC Cathode Degradation. ECS Trans. 2015, 68, 773. [Google Scholar] [CrossRef]
- Nakajo, A.; Wuillemin, Z.; Metzger, P.; Diethelm, S.; Schiller, G.; Van Herle, J.; Favrat, D. Electrochemical model of SOFC for simulation at the stack scale I. Calibration procedure on experimental data. J. Electrochem. Soc. 2011, 158, B1083. [Google Scholar] [CrossRef]
- Usseglio-Viretta, F.; Laurencin, J.; Delette, G.; Villanova, J.; Cloetens, P.; Leguillon, D. Quantitative microstructure characterization of a Ni-YSZ bi-layer coupled with simulated electrode polarisation. J. Power Sources 2014, 256, 394–403. [Google Scholar] [CrossRef]
- Nakajo, A.; Cocco, A.; De Gostin, M.; Peracchio, A.; Cassenti, B.; Cantoni, M.; Van Herle, J.; Chiu, W.K.S. Accessible triple-phase boundary length: A performance metric to account for transport pathways in heterogeneous electrochemical materials. J. Power Sources 2016, 325, 786–800. [Google Scholar] [CrossRef]
- Monaco, F.; Hubert, M.; Vulliet, J.; Ouweltjes, J.; Montinaro, D.; Cloetens, P.; Piccardo, P.; Lefebvre-Joud, F.; Laurencin, J. Degradation of Ni-YSZ Electrodes in Solid Oxide Cells: Impact of Polarization and Initial Microstructure on the Ni Evolution. J. Electrochem. Soc. 2019, 166, F1229. [Google Scholar] [CrossRef]
- Polverino, P.; Gallo, M.; Pianese, C. Development of mathematical transfer functions correlating Solid Oxide Fuel Cell degradation to operating conditions for Accelerated Stress Test protocols design. J. Power Sources 2021, 491, 229521. [Google Scholar] [CrossRef]
- Menzler, N.; Sebold, D.; Sohn, Y.; Zischke, S. Post-test characterization of a solid oxide fuel cell after more than 10 years of stack testing. J. Power Sources 2020, 478, 22888770. [Google Scholar] [CrossRef]
- Trini, M.; Hauch, A.; De Angelis, S.; Tong, X.; Vang Hendriksen, P.; Chen, M. Comparison of microstructural evolution of fuel electrodes in solid oxide fuel cells and electrolysis cells. J. Power Sources 2020, 450, 227599. [Google Scholar] [CrossRef]
- Rinaldi, G.; Nakajo, A.; Caliandro, P.; Navratilova, L. Effects of Polarization on the Microstructural Changes at the YSZ/Ni-YSZ Interface. ECS Trans. 2019, 91, 641. [Google Scholar] [CrossRef]
- Laguna-Bercero, M. Recent advances in high temperature electrolysis using solid oxide fuel cells: A review. J. Power Sources 2012, 203, 4–16. [Google Scholar] [CrossRef]
- Faes, A.; Hessler-Wyser, A.; Presvytes, D.; Vayenas, C.; Van Herle, J. Ni-zirconia anode degradation and triple phase boundary quantification from microstructural analysis. Fuel Cells 2009, 9, 841. [Google Scholar] [CrossRef]
- Nakajo, A.; Wuillemin, Z.; Van Herle, J.; Favrat, D. Simulation of thermal stresses in anode-supported SOFC stacks. Part I: Probability of failure of the cells. J. Power Sources 2009, 193, 203–215. [Google Scholar] [CrossRef]
- Nakajo, A.; Wuillemin, Z.; Van Herle, J.; Favrat, D. Simulation of thermal stresses in anode-supported SOFC stacks. Part II: Loss of gas-tightness, electrical contact and thermal buckling. J. Power Sources 2009, 193, 216–226. [Google Scholar] [CrossRef]
- Nakajo, A.; Kiss, A.; Cocco, A.; Harris, W.; DeGostin, M.; Greco, F.; Nelson, G.; Peracchio, A.; Cassenti, B.; Deriy, A.; et al. Characterization of cracks and their effects on the effective transport pathways in Ni-YSZ anodes after reoxidation using X-ray nanotomography. ECS Trans. 2015, 68, 1069. [Google Scholar] [CrossRef]
- Cho, H.; Choi, G. Effect of milling methods on performance of Ni-Y2O3-stabilized ZrO2 anode for solid oxide fuel cell. J. Power Sources 2008, 176, 96–101. [Google Scholar] [CrossRef]
- Pihlatie, M.; Kaiser, A.; Mogensen, M.; Chen, M. Electrical conductivity of Ni-YSZ composites: Degradation due to Ni particle growth. Solid State Ion. 2011, 189, 82–90. [Google Scholar] [CrossRef]
- Sato, K.; Okamoto, G.; Naito, M.; Abe, H. NiO/YSZ nanocomposite particles synthesized via co-precipitation method for electrochemically active Ni/YSZ anode. J. Power Sources 2009, 193, 185–188. [Google Scholar] [CrossRef]
- Baek, S.; Bae, J. Anodic behavior of 8Y2O3-ZrO2/NiO cermet using an anode-supported electrode. Int. J. Hydrogen Energy 2011, 36, 689–705. [Google Scholar] [CrossRef]
- Haslam, J.; Pham, A.; Chung, B.; DiCarlo, J.; Glass, R. Effects of the use of pore former on performance of an anode supported solid oxide fuel cell. J. Am. Seram. Soc. 2005, 88, 513–518. [Google Scholar] [CrossRef]
- Satikaya, A.; Petrovsky, V.; Dogan, F. Effect of the anode microstructure on the enhanced performance of solid oxide fuel cells. Int. J. Hydrogen Econ. 2012, 37, 11370–11377. [Google Scholar]
- Liu, B.; Zhang, Y.; Tu, B.; Dong, Y.; Cheng, M. Electrochemical impedance investigation of the redox behaviour of a Ni-YSZ anode. J. Power Sources 2007, 165, 114–119. [Google Scholar] [CrossRef]
- Waldbillig, D.; Wood, A.; Ivey, D. Electrochemical and microstructural characterization of the redox tolerance of solid oxide fuel cell anodes. J. Power Sources 2005, 145, 206–215. [Google Scholar] [CrossRef]
- Nakagawa, Y.; Yashiro, K.; Sato, K.; Kawada, T.; Mizusaki, J. Microstructural changes of Ni/YSZ cermet under repeated redox reaction in environmental scanning electron microscope (ESEM). ECS Trans. 2007, 7, 1373. [Google Scholar] [CrossRef]
- Sarandaridis, D.; Rubkin, R.; Atkinson, A. On the redox cycling of anode-supported SOFCs: Mechanical properties and damage mechanisms. ECS Trans. 2007, 7, 1491. [Google Scholar] [CrossRef]
- Laurancin, J.; Roche, V.; Jaboutian, C.; Kieffer, I.; Mougin, J.; Steil, M. Ni-8YSZ cermet re-oxidation of anode supported solid oxide fuel cell: From kinetics measurements to mechanical damage prediction. Int. J. Hydrogen Energy 2012, 37, 12557–12573. [Google Scholar] [CrossRef]
- Song, B.; Trejo, E.; Bertei, A.; Brandon, N. Quantification of the degradation of Ni-YSZ anodes upon redox cycling. J. Power Sources 2018, 374, 61–68. [Google Scholar] [CrossRef]
- Kirtley, J.; McIntyre, M.; Halat, D.; Walker, R. (Invited) Insights into SOFC Ni/YSZ Anode Degradation Using In-Situ Spectrochronopotentiometrys. ECS Trans. 2013, 50, 3. [Google Scholar] [CrossRef]
- Tikekar, N.; Armstrong, T.; Virkar, A. Reduction and Reoxidation Kinetics of Nickel-Based SOFC Anodes. J. Electrochem. Soc. 2006, 153, A654. [Google Scholar] [CrossRef]
- Greco, F.; Nakajo, A.; Wuillemin, Z.; Van Herle, J. Thermo-mechanical reliability of SOFC stacks during combined long-term operation and thermal cycling. ECS Trans. 2015, 68, 1921. [Google Scholar] [CrossRef]
- Jeangros, Q.; Faes, A.; Hansen, J.; Aschauer, U.; Van Herle, J.; Hessler-Wyser, A.; Dunin-Borlowski, R. In situ redox cycle of a nickel-YSZ fuel cell anode in an environmental transmission electron microscope. Acta Mater. 2010, 58, 4578–4589. [Google Scholar] [CrossRef]
- Ettler, M.; Timmermann, H.; Weber, A.; Menzler, N.H. Durability of Ni anodes during reoxidation cycles. J. Power Sources 2010, 195, 5452–5467. [Google Scholar] [CrossRef]
- Khana, M.; Leea, S.; Song, R.; Lee, J.; Lim, T.; Park, S. Fundamental mechanisms involved in the degradation of nickel–yttria stabilized zirconia (Ni-YSZ) anode during solid oxide fuel cells operation: A review. Ceram. Int. 2016, 42, 35–48. [Google Scholar] [CrossRef]
- Sarantaridis, D.; Chater, R.J.; Atkinson, A. Changes in physical and mechanical properties of SOFC Ni-YSZ composites caused by redox cycling. J. Electrochem. Soc. 2008, 155, B467–B472. [Google Scholar] [CrossRef]
- Jiao, Z.; Takagi, N.; Shikazono, N.; Kasagi, N. Study on local morphological changes of nickel in solid oxide fuel cell anode using porous Ni pellet electrode. J. Power Sources 2011, 196, 1019–1029. [Google Scholar] [CrossRef]
- Mukhopadhyay, M.; Mukhopadhyay, J.; Das Sharma, A.; Basu, R.N. High performance planar solid oxide fuel cell fabricated with Ni-Yttria stabilized zirconia anode prepared by electroless technique. Int. J. Appl. Ceram. Technol. 2012, 9, 999–1010. [Google Scholar] [CrossRef]
- Grgicak, C.M.; Green, R.G.; Du, W.-F.; Giorgi, J.B. Synthesis and characterization of NiO-YSZ anode materials: Precipitation, calcination, and the effects on sintering. J. Am. Ceram. Soc. 2005, 88, 3081–3087. [Google Scholar] [CrossRef]
- Mewafy, B.; Paloukis, F.; Papazisi, K.; Balomenou, S.; Luo, W. Influence of surface state on the electrochemical performance of nickel-based cermet electrodes during steam electrolysis. ACS Appl. Energy Mater. 2019, 2, 7045–7055. [Google Scholar] [CrossRef]
- Vladikova, D.; Stoynov, Z.; Wuillemin, Z.; Montinaro, D.; Piccardo, P.; Genov, I.; Rolland, M. Impedance Studies of the Reduction Process in NiO-YSZ SOFC Anodes. ECS Trans. 2015, 68, 1161. [Google Scholar] [CrossRef]
- Burdin, B.; Sheikh, A.; Krapchanska, M.; Montinaro, D.; Spotorno, R.; Piccardo, P.; Vladikova, D. Redox-cycling—A Tool for Artificial Electrochemical Aging of Solid Oxide Cells. ECS Trans. 2021, 103, 1137–1149. [Google Scholar] [CrossRef]
- Stoynov, Z.; Vladikova, D. Impedance Spectroscopy of Electrochemical Power Sources. In Encyclopedia of Electrochemical Power Sources; Garche, U., Ed.; Elsevier: Amsterdam, The Netherlands, 2009; pp. 632–642. [Google Scholar]
- Lide, D. (Ed.) Handbook of Chemistry and Physics, 85th ed.; CRS Press: Boca Raton, FL, USA, 2005; pp. 12–46. [Google Scholar]
- Stoynov, Z.; Vladikova, D.; Burdin, B. Differential Resistance Analysis—Current Achievements and Applications. Bulg. Chem. Commun. 2018, 50, 21–30. [Google Scholar]
- Stoynov, Z.; Vladikova, D.; Burdin, B.; Laurencin, J.; Montinaro, D.; Raikova, G.; Schiller, G.; Szabo, P. Differential analysis of SOFC current-voltage characteristics. Appl. Energy 2018, 228, 1584–1590. [Google Scholar] [CrossRef]
- Caliandro, P.; Nakajo, A.; Diethelm, S.; Van Herle, J. Model-assisted identification of solid oxide cell elementary processes by electrochemical impedance spectroscopy measurements. J. Power Sources 2019, 436, 226838. [Google Scholar] [CrossRef]


Publisher’s Note: MDPI stays neutral with regard to jurisdictional claims in published maps and institutional affiliations. |
© 2022 by the authors. Licensee MDPI, Basel, Switzerland. This article is an open access article distributed under the terms and conditions of the Creative Commons Attribution (CC BY) license (https://creativecommons.org/licenses/by/4.0/).