
Investigation of a Metallic Interconnect Extracted from an SOFC Stack after 40,000 h of Operation


Abstract
:1. Introduction
2. Materials and Methods
3. Results and Discussions
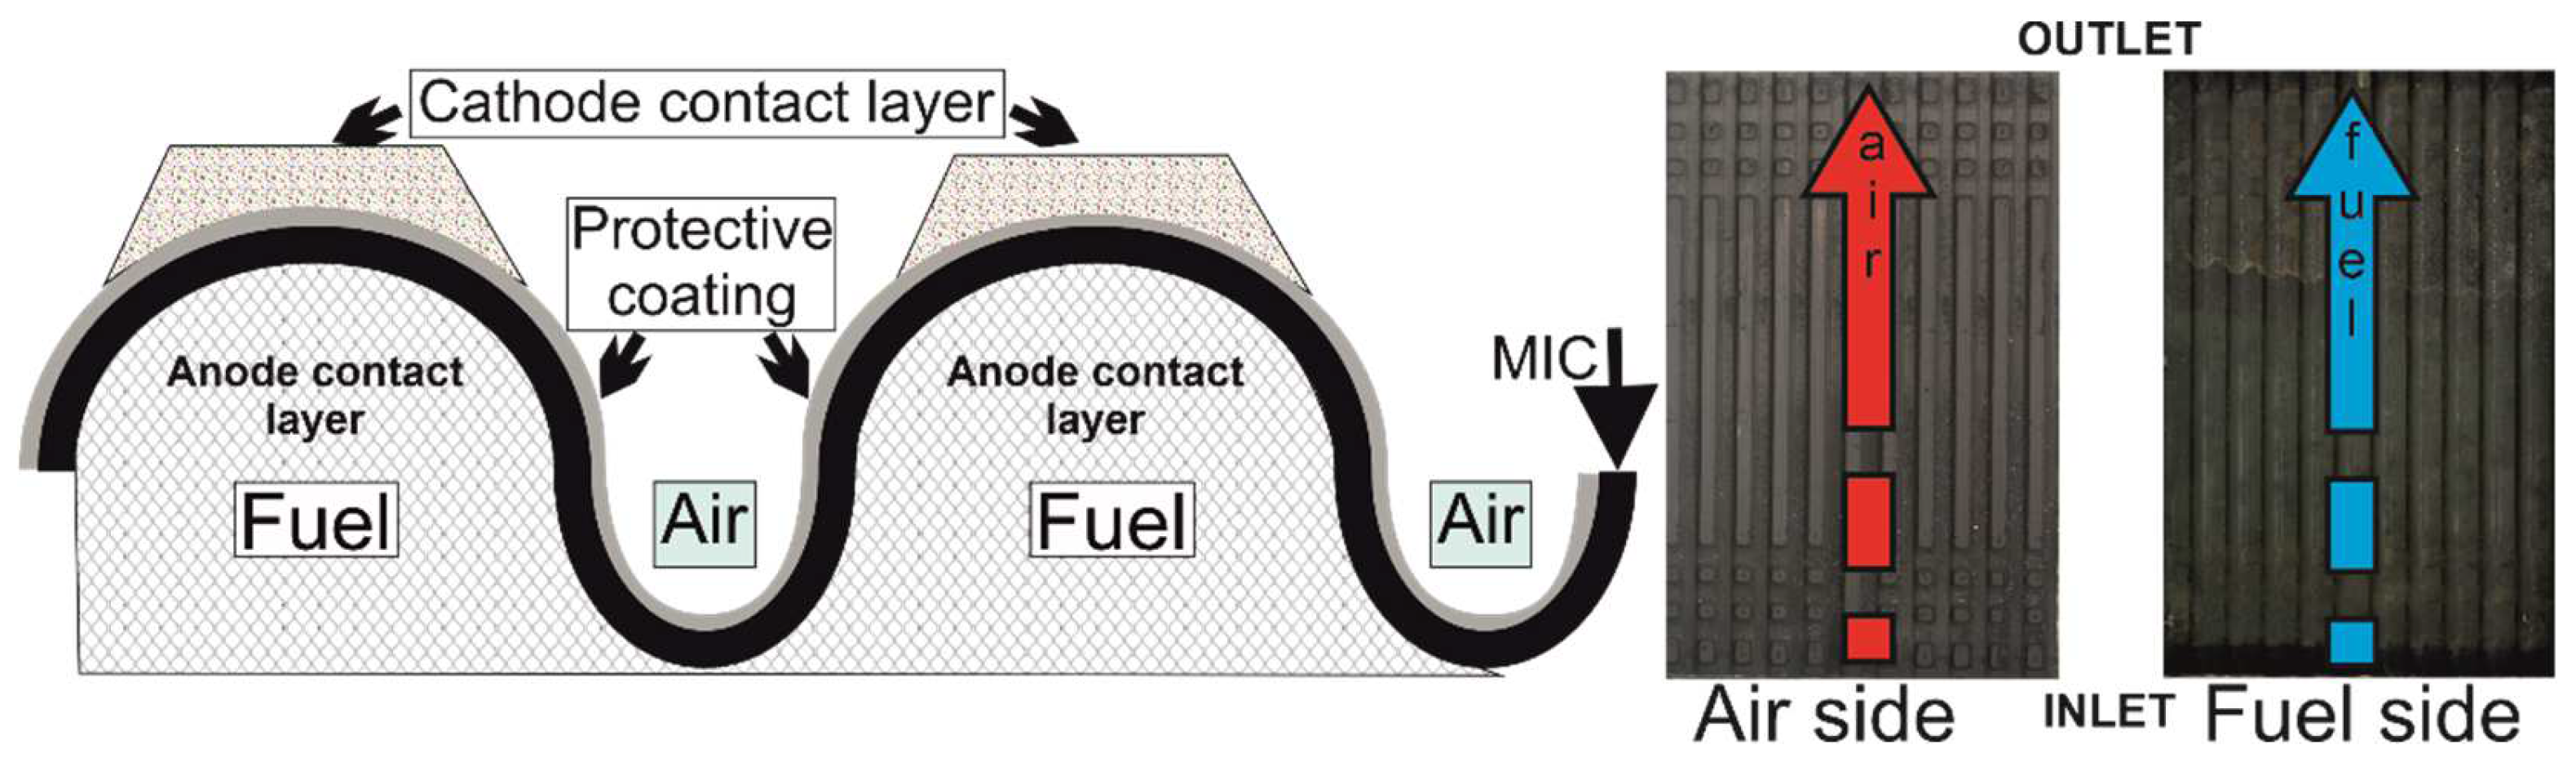
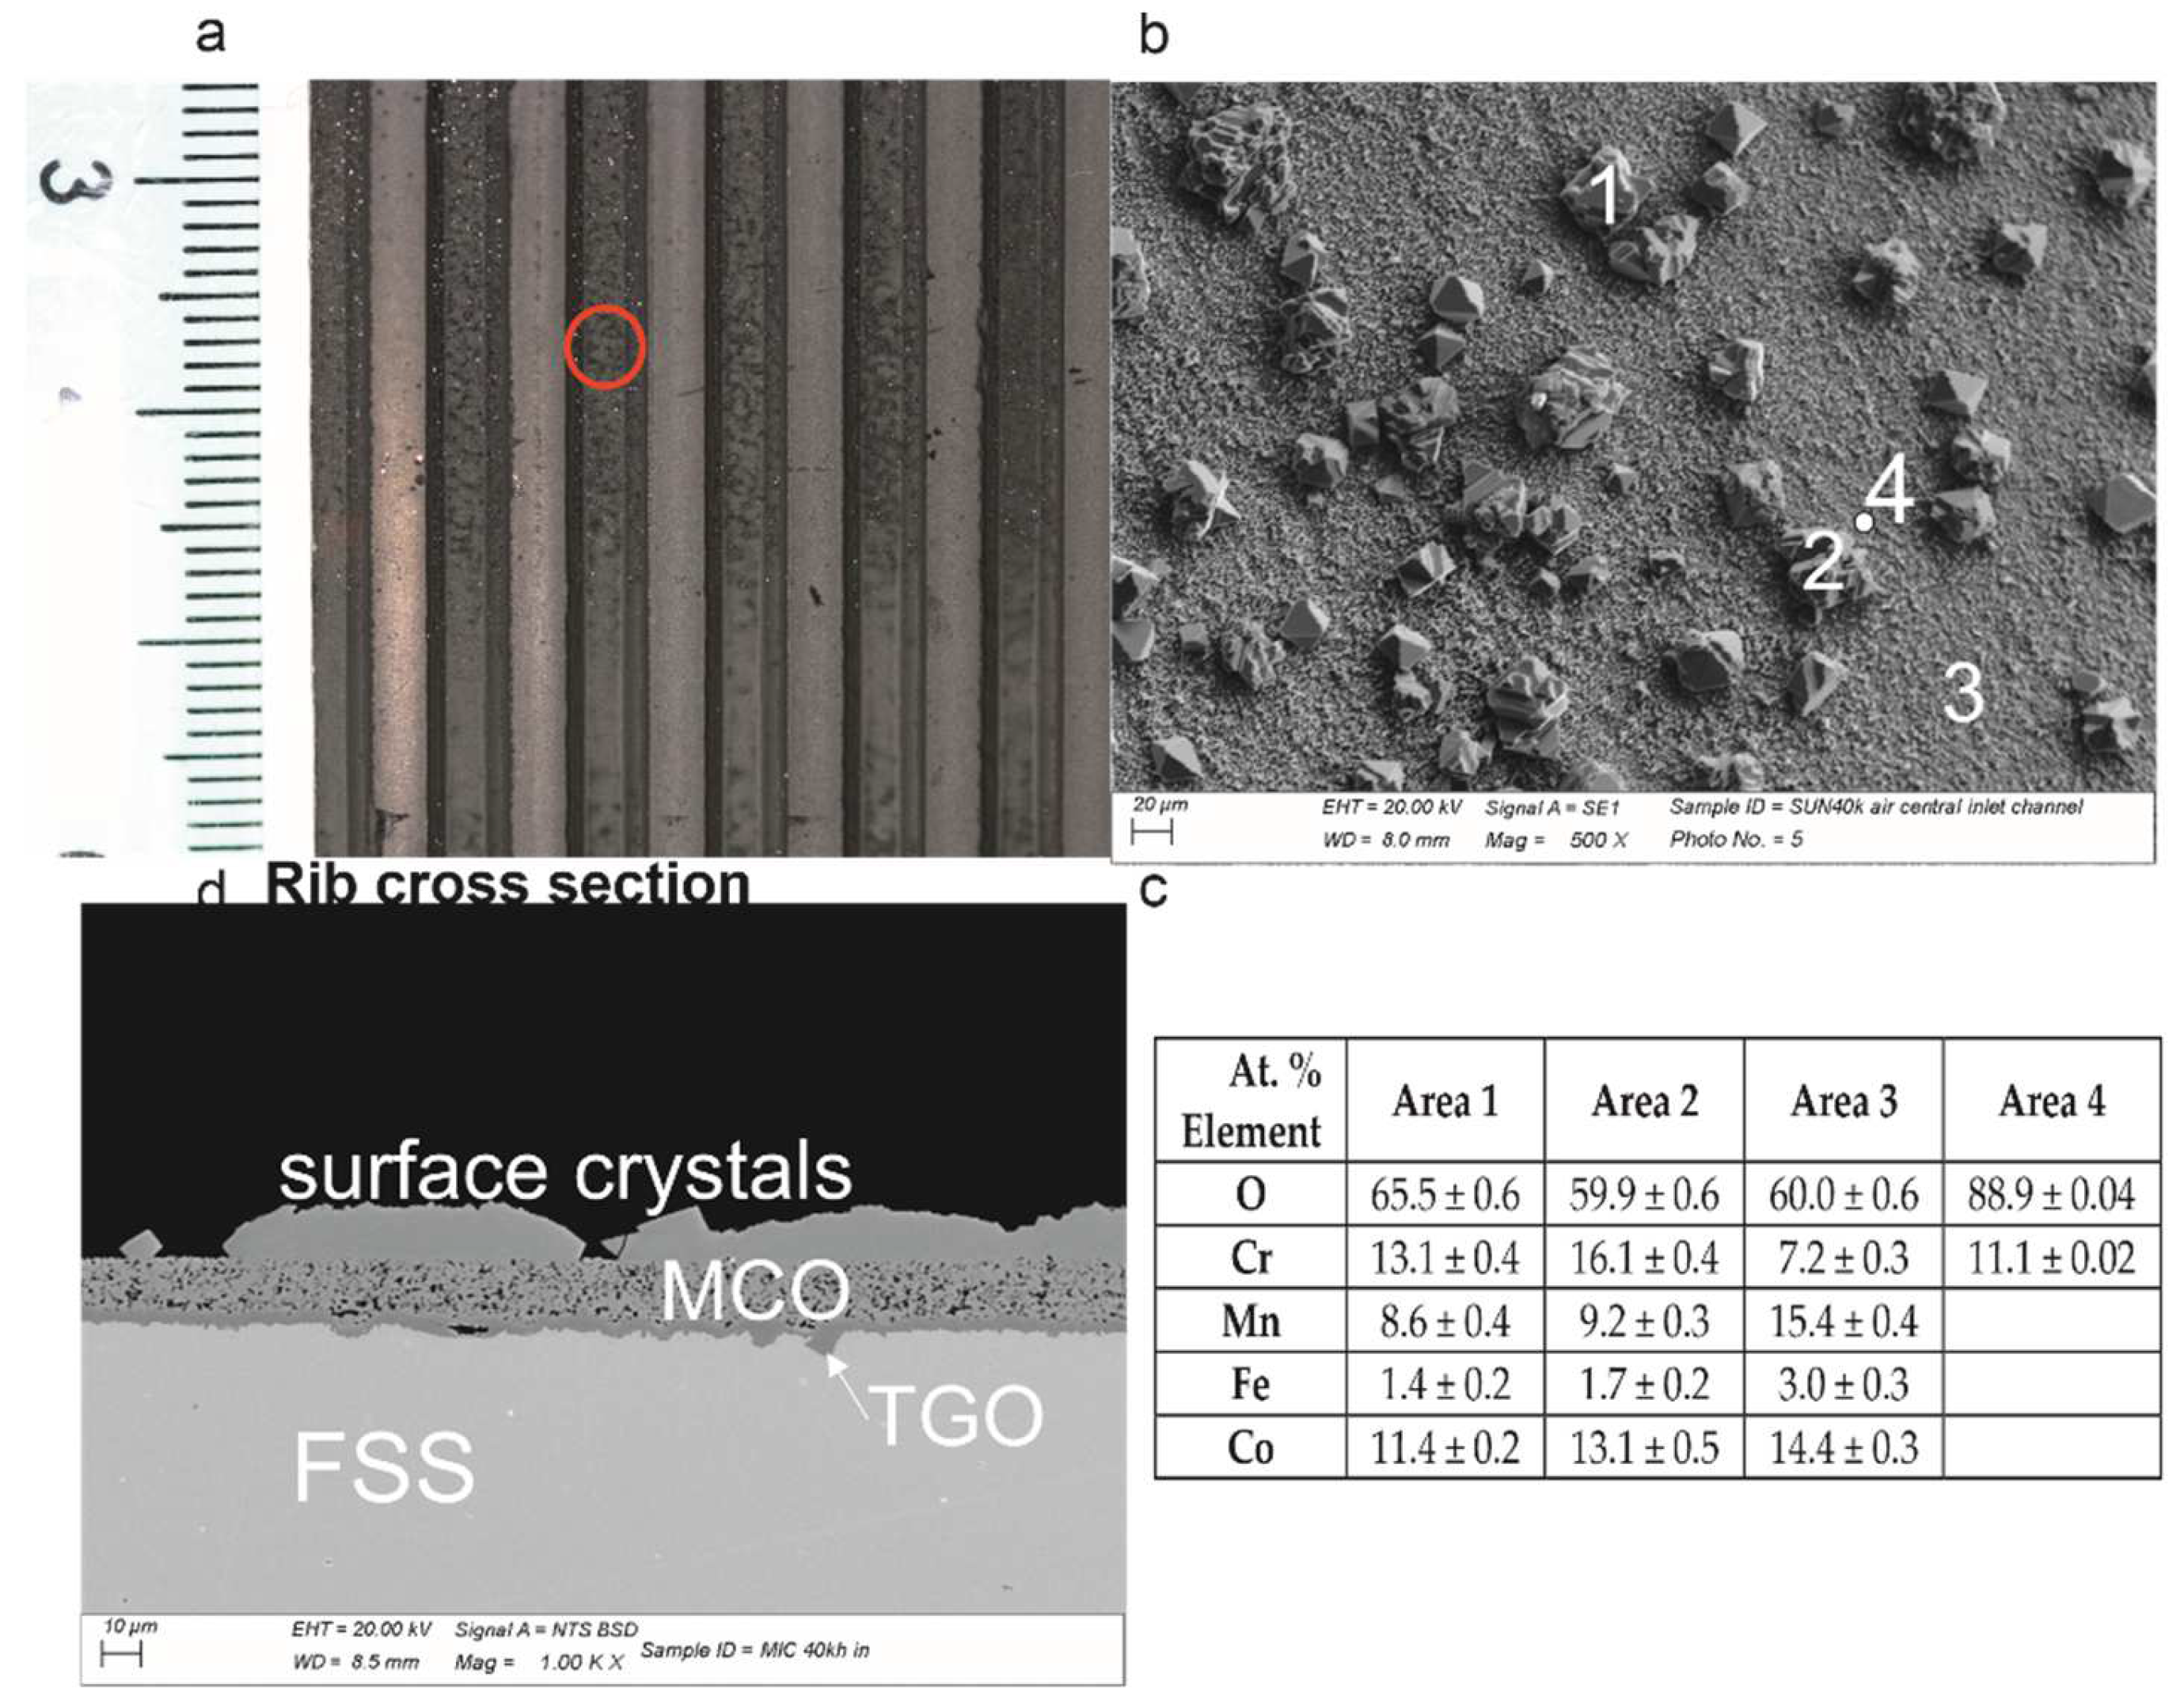
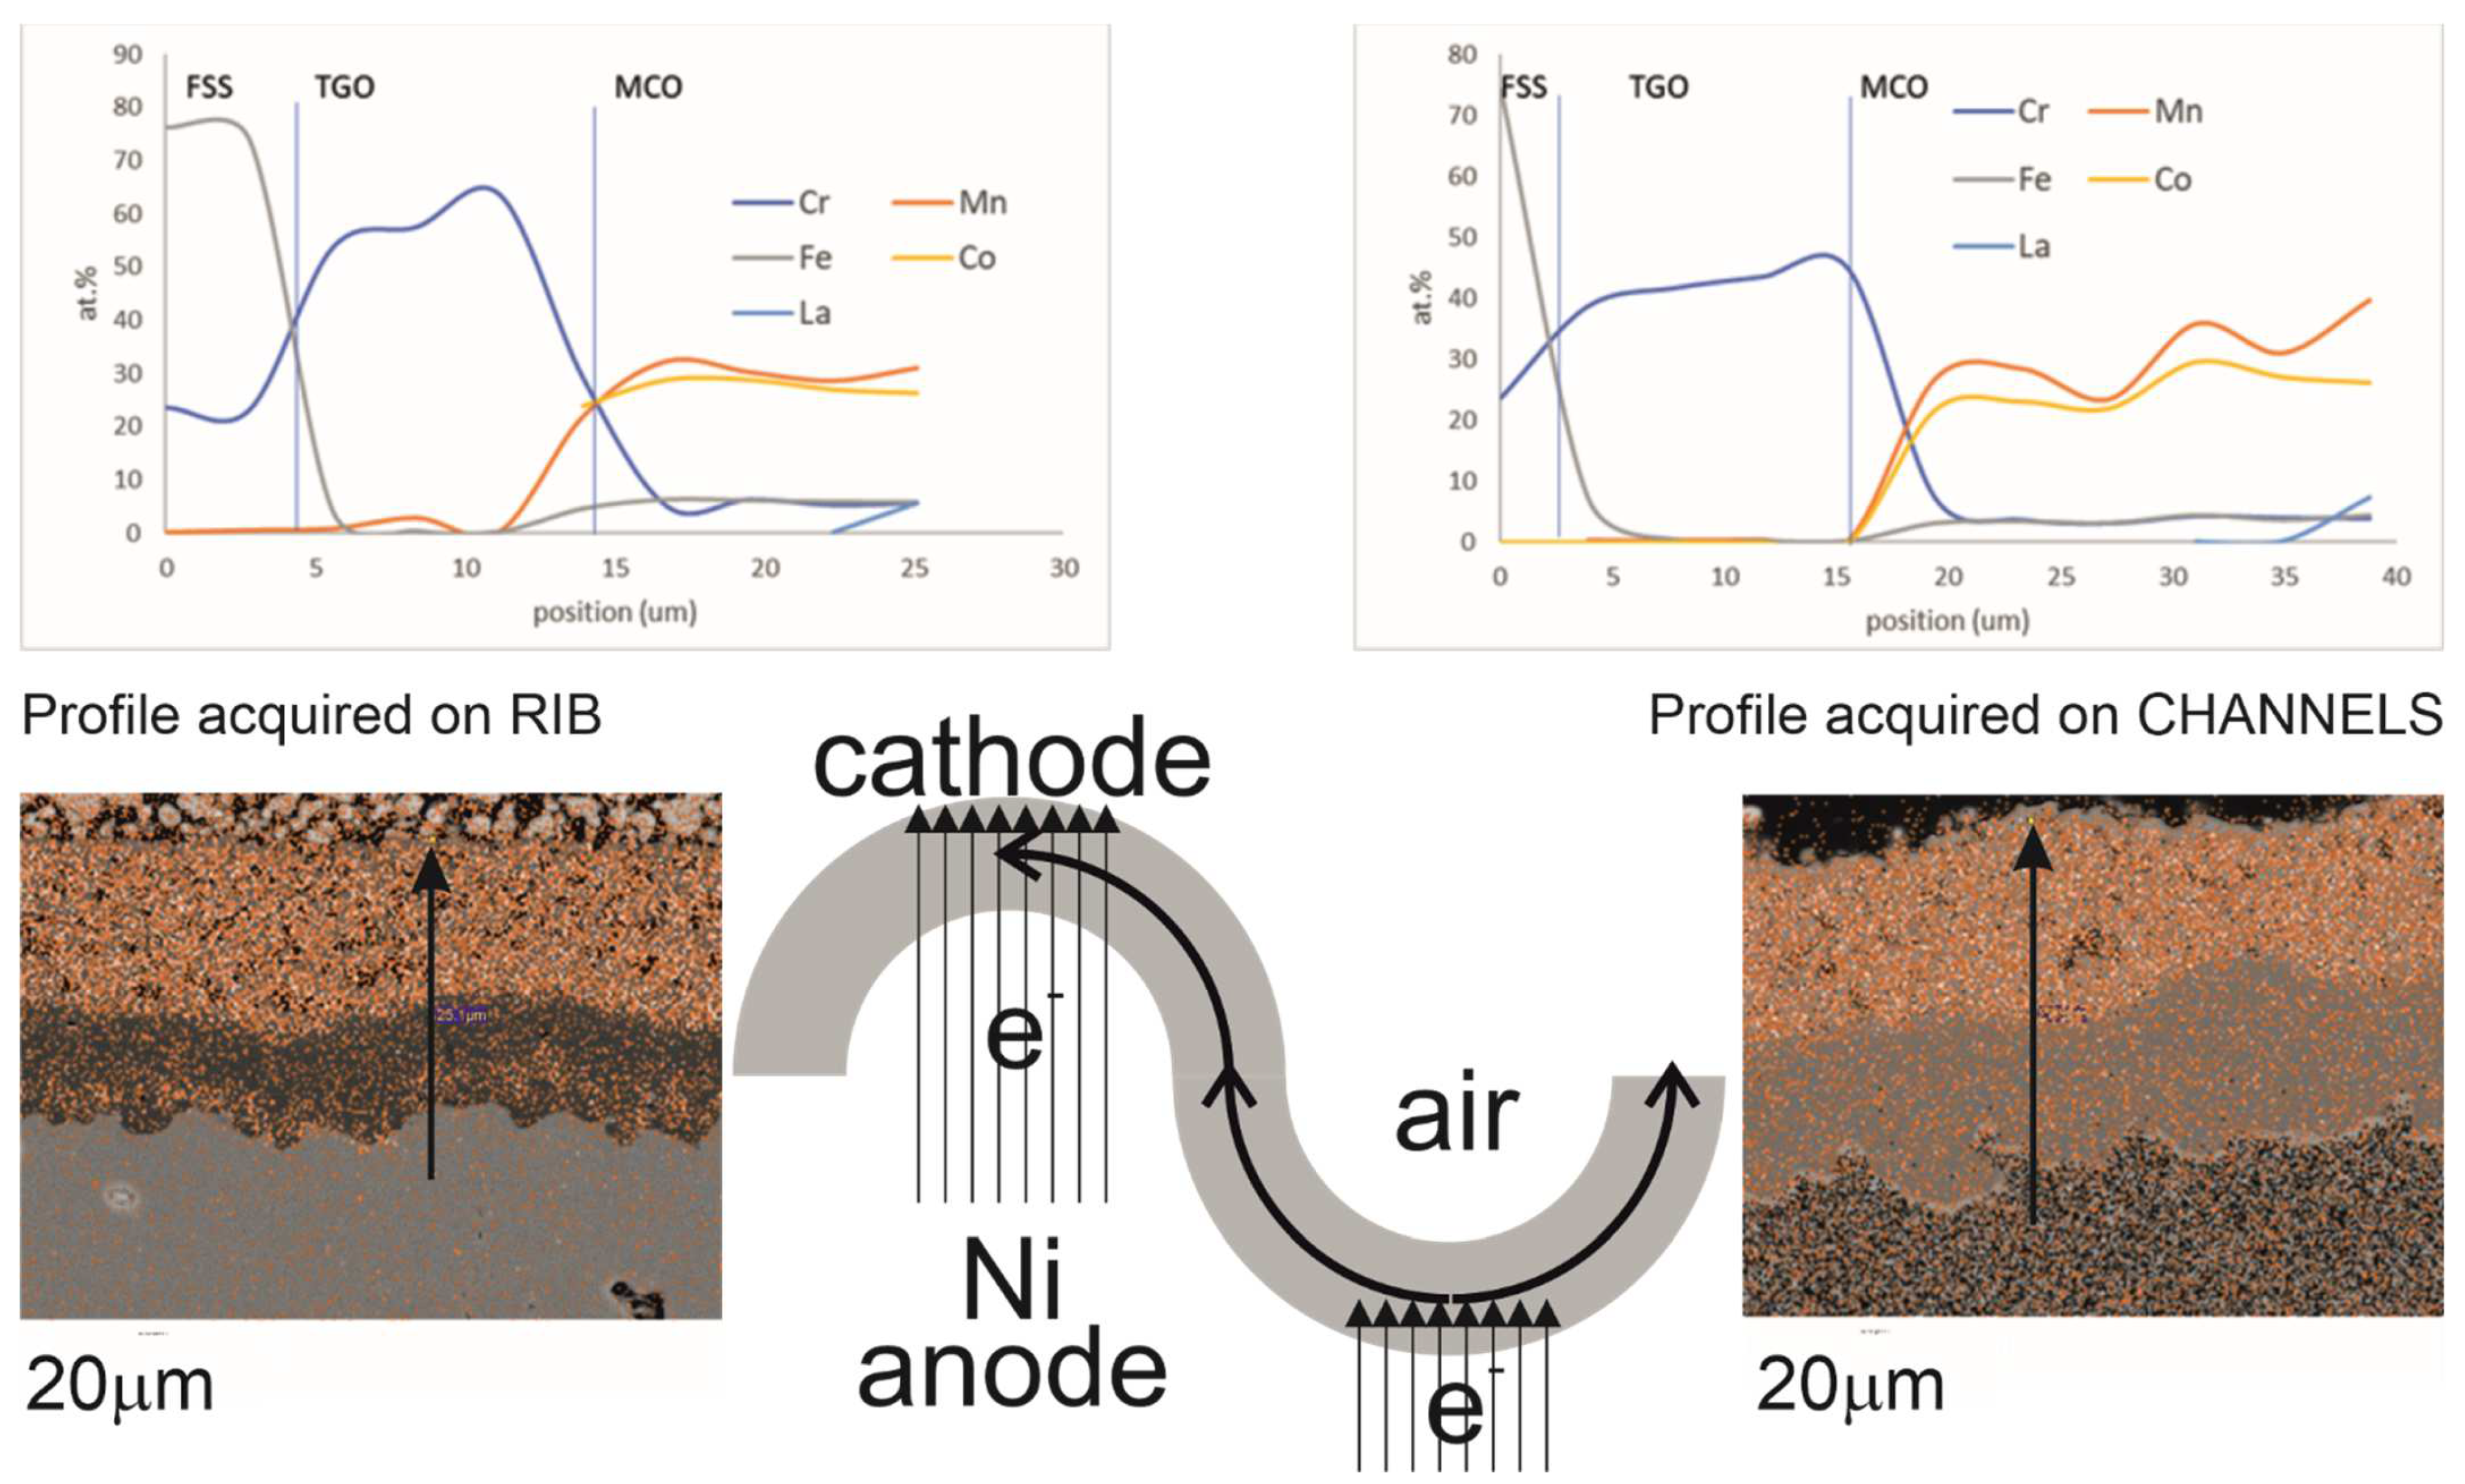
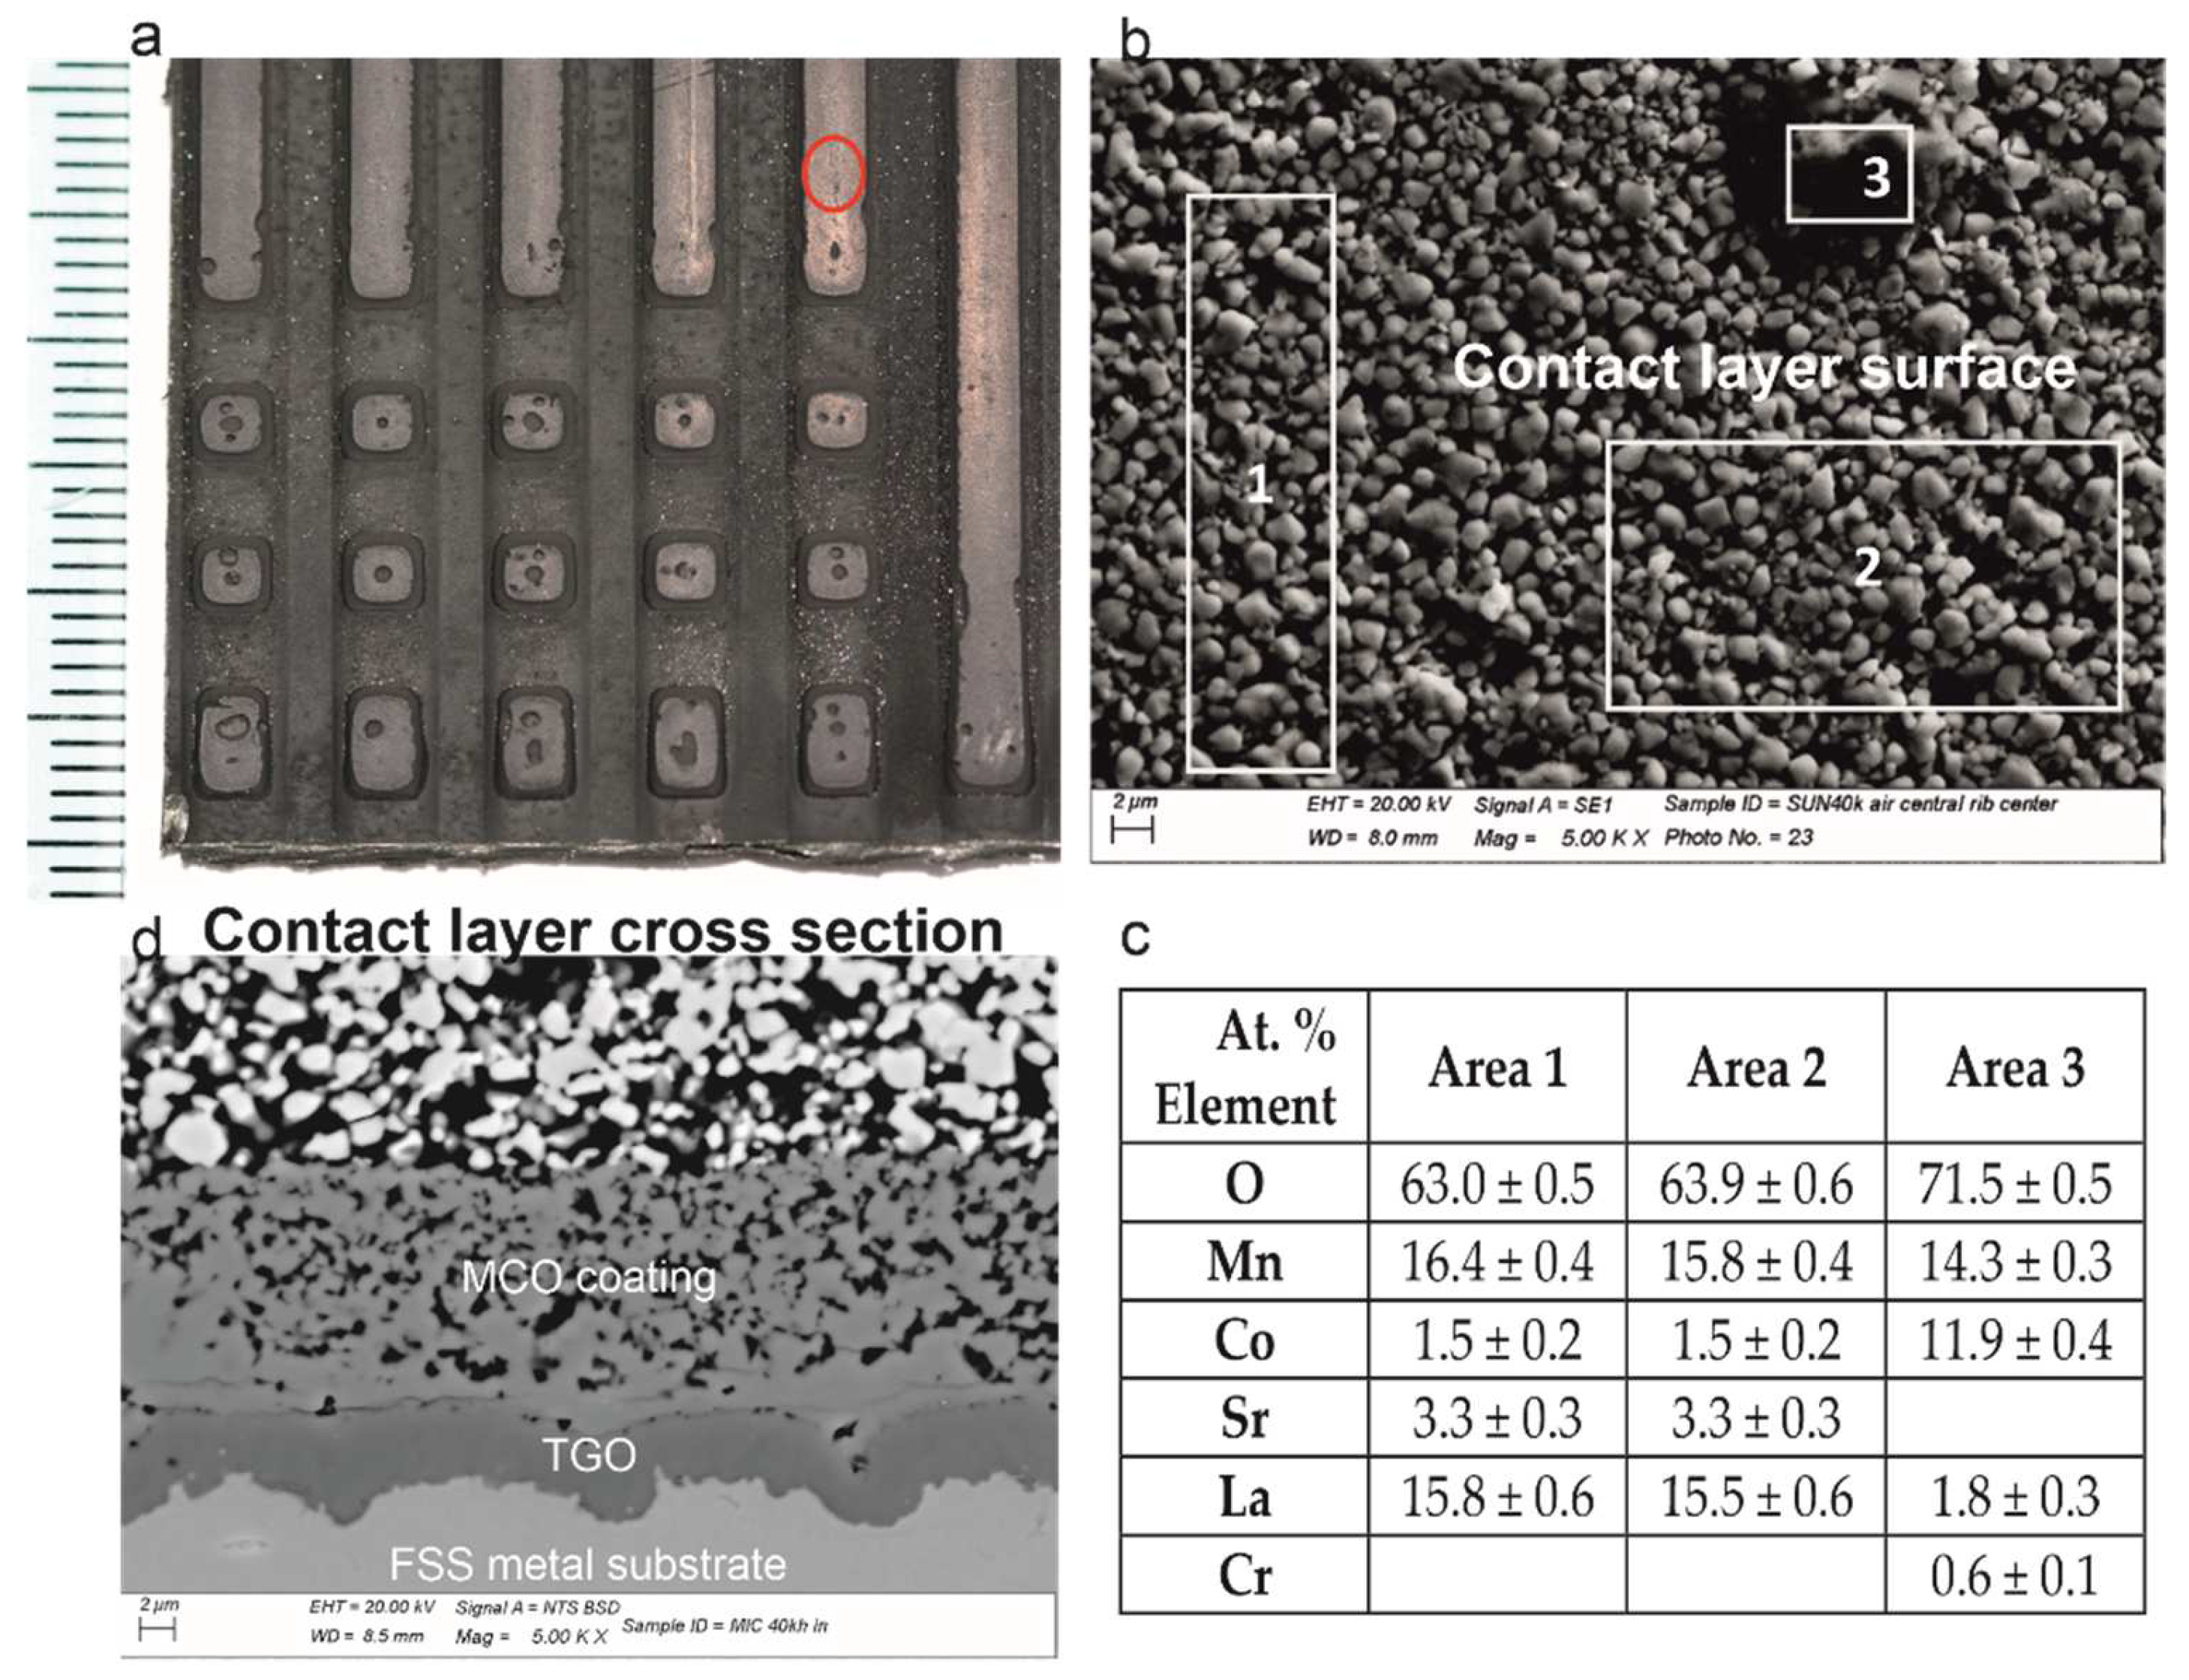
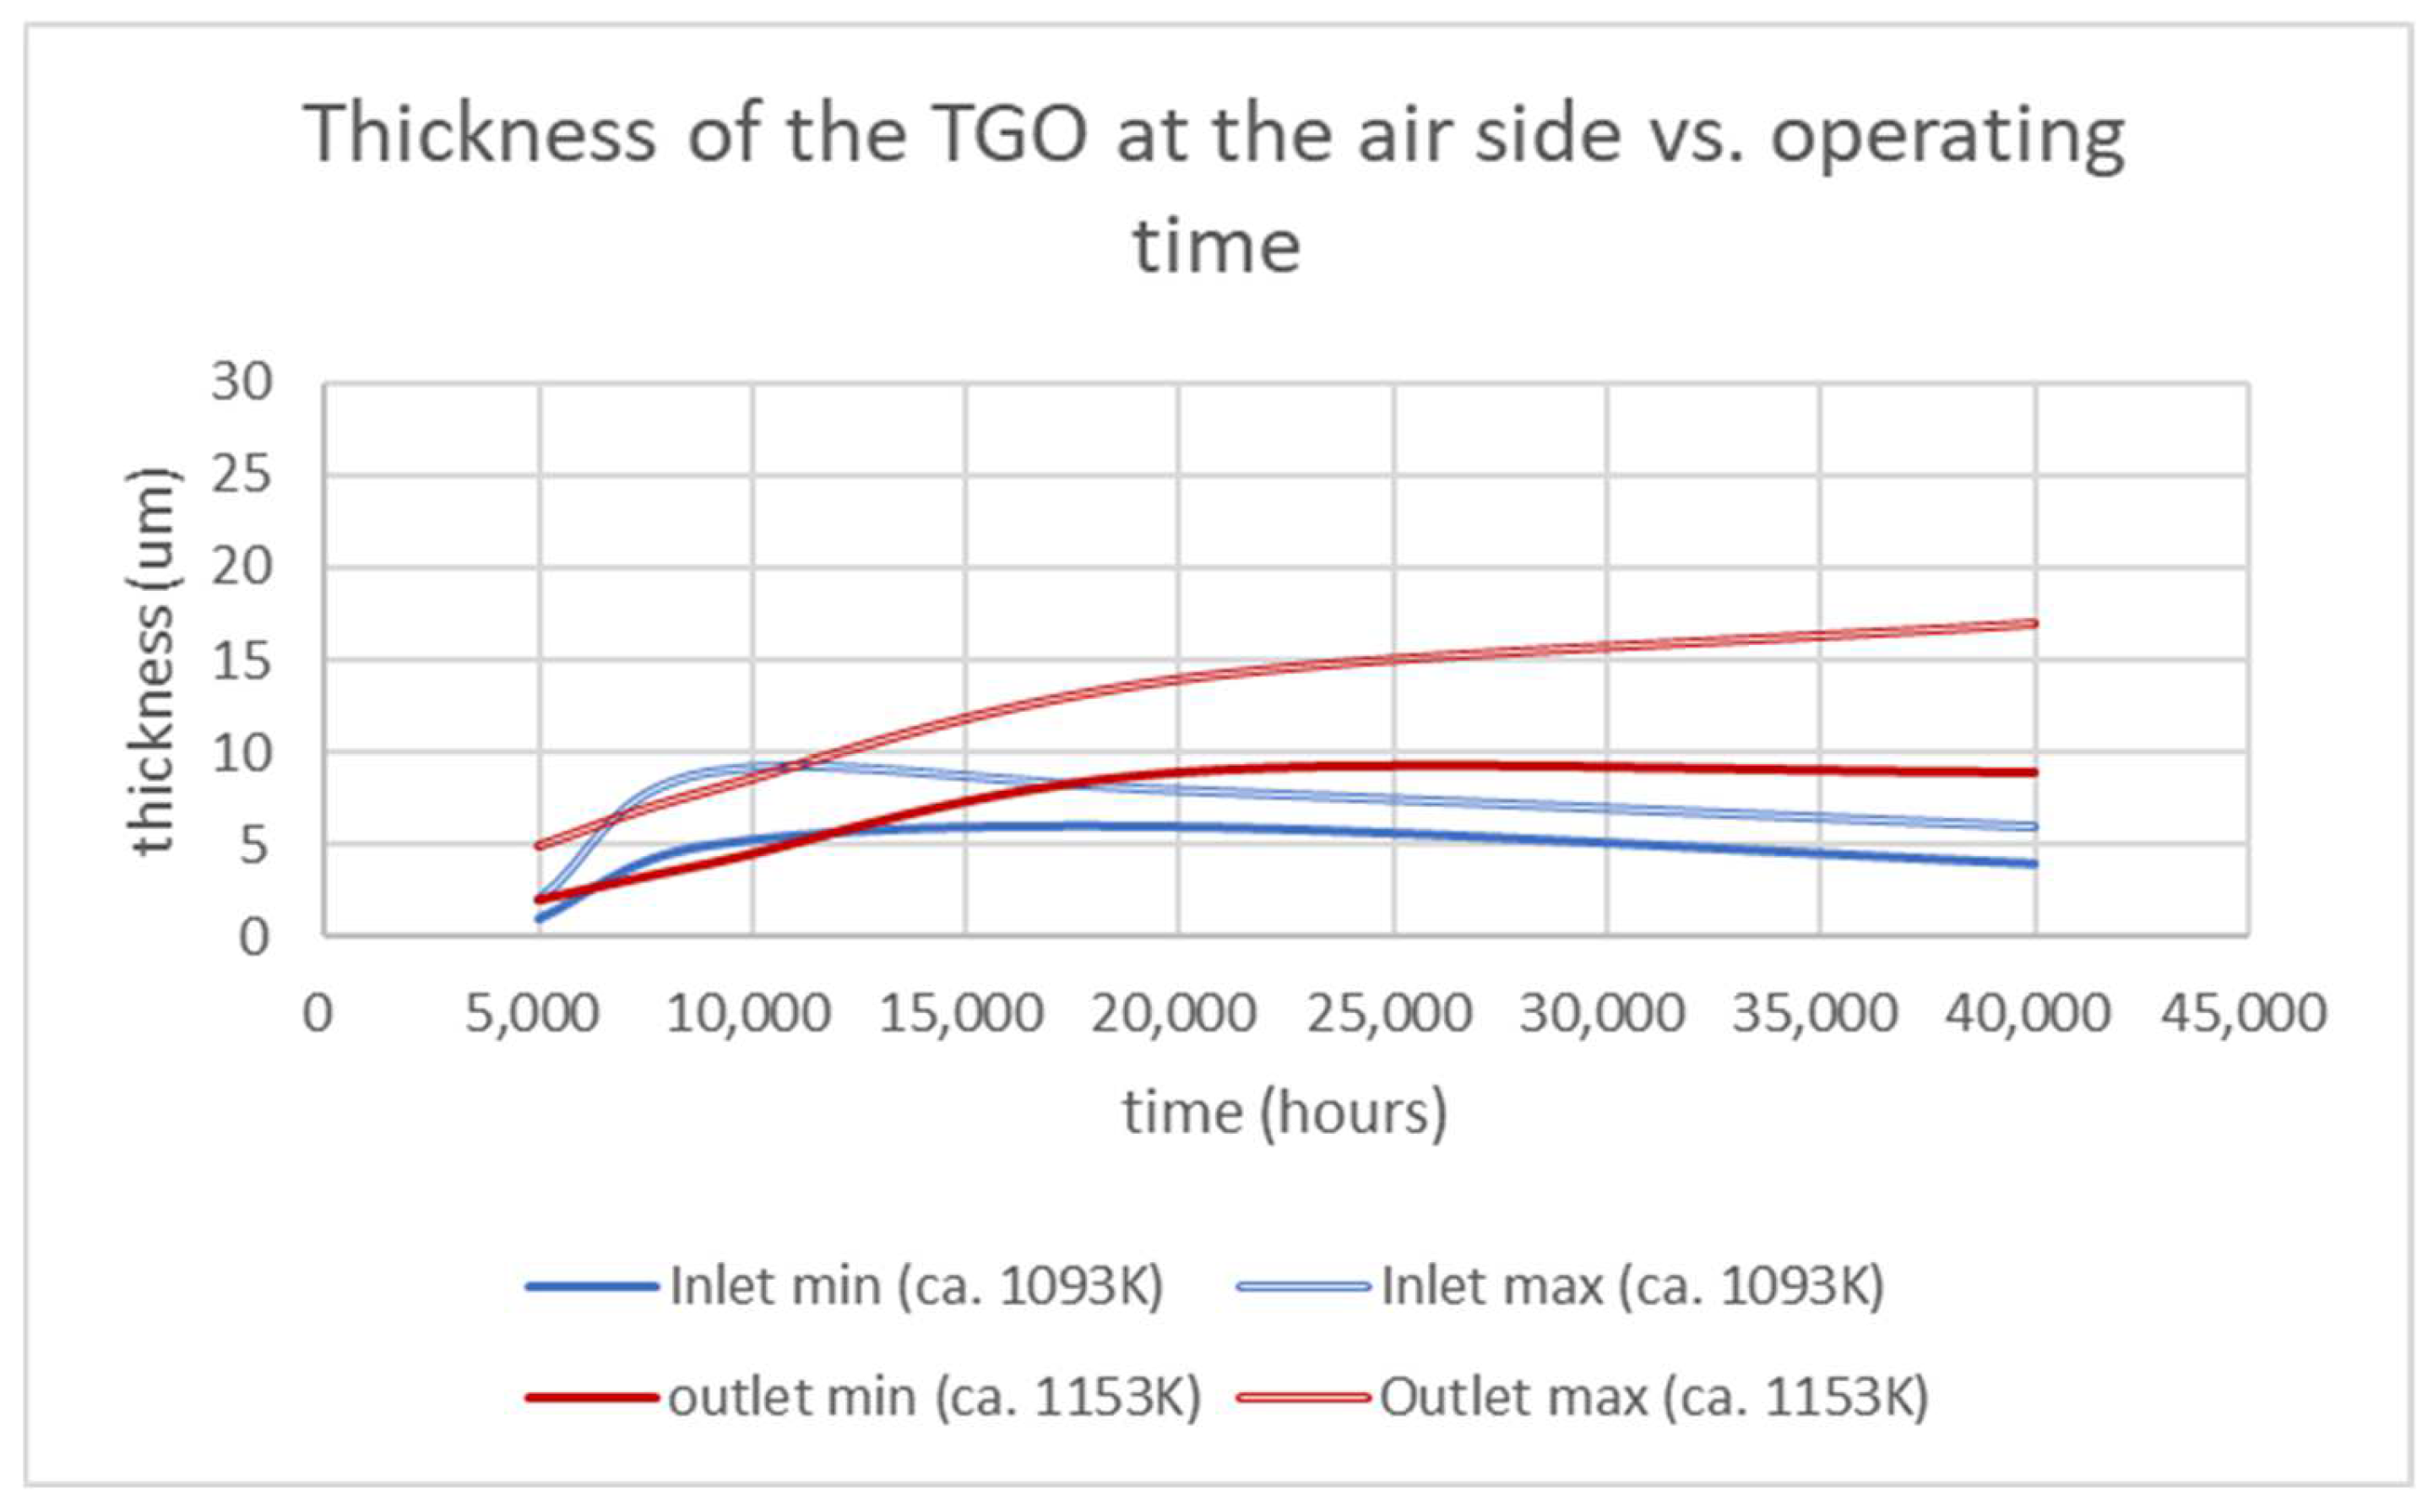
3.1. The Air Side
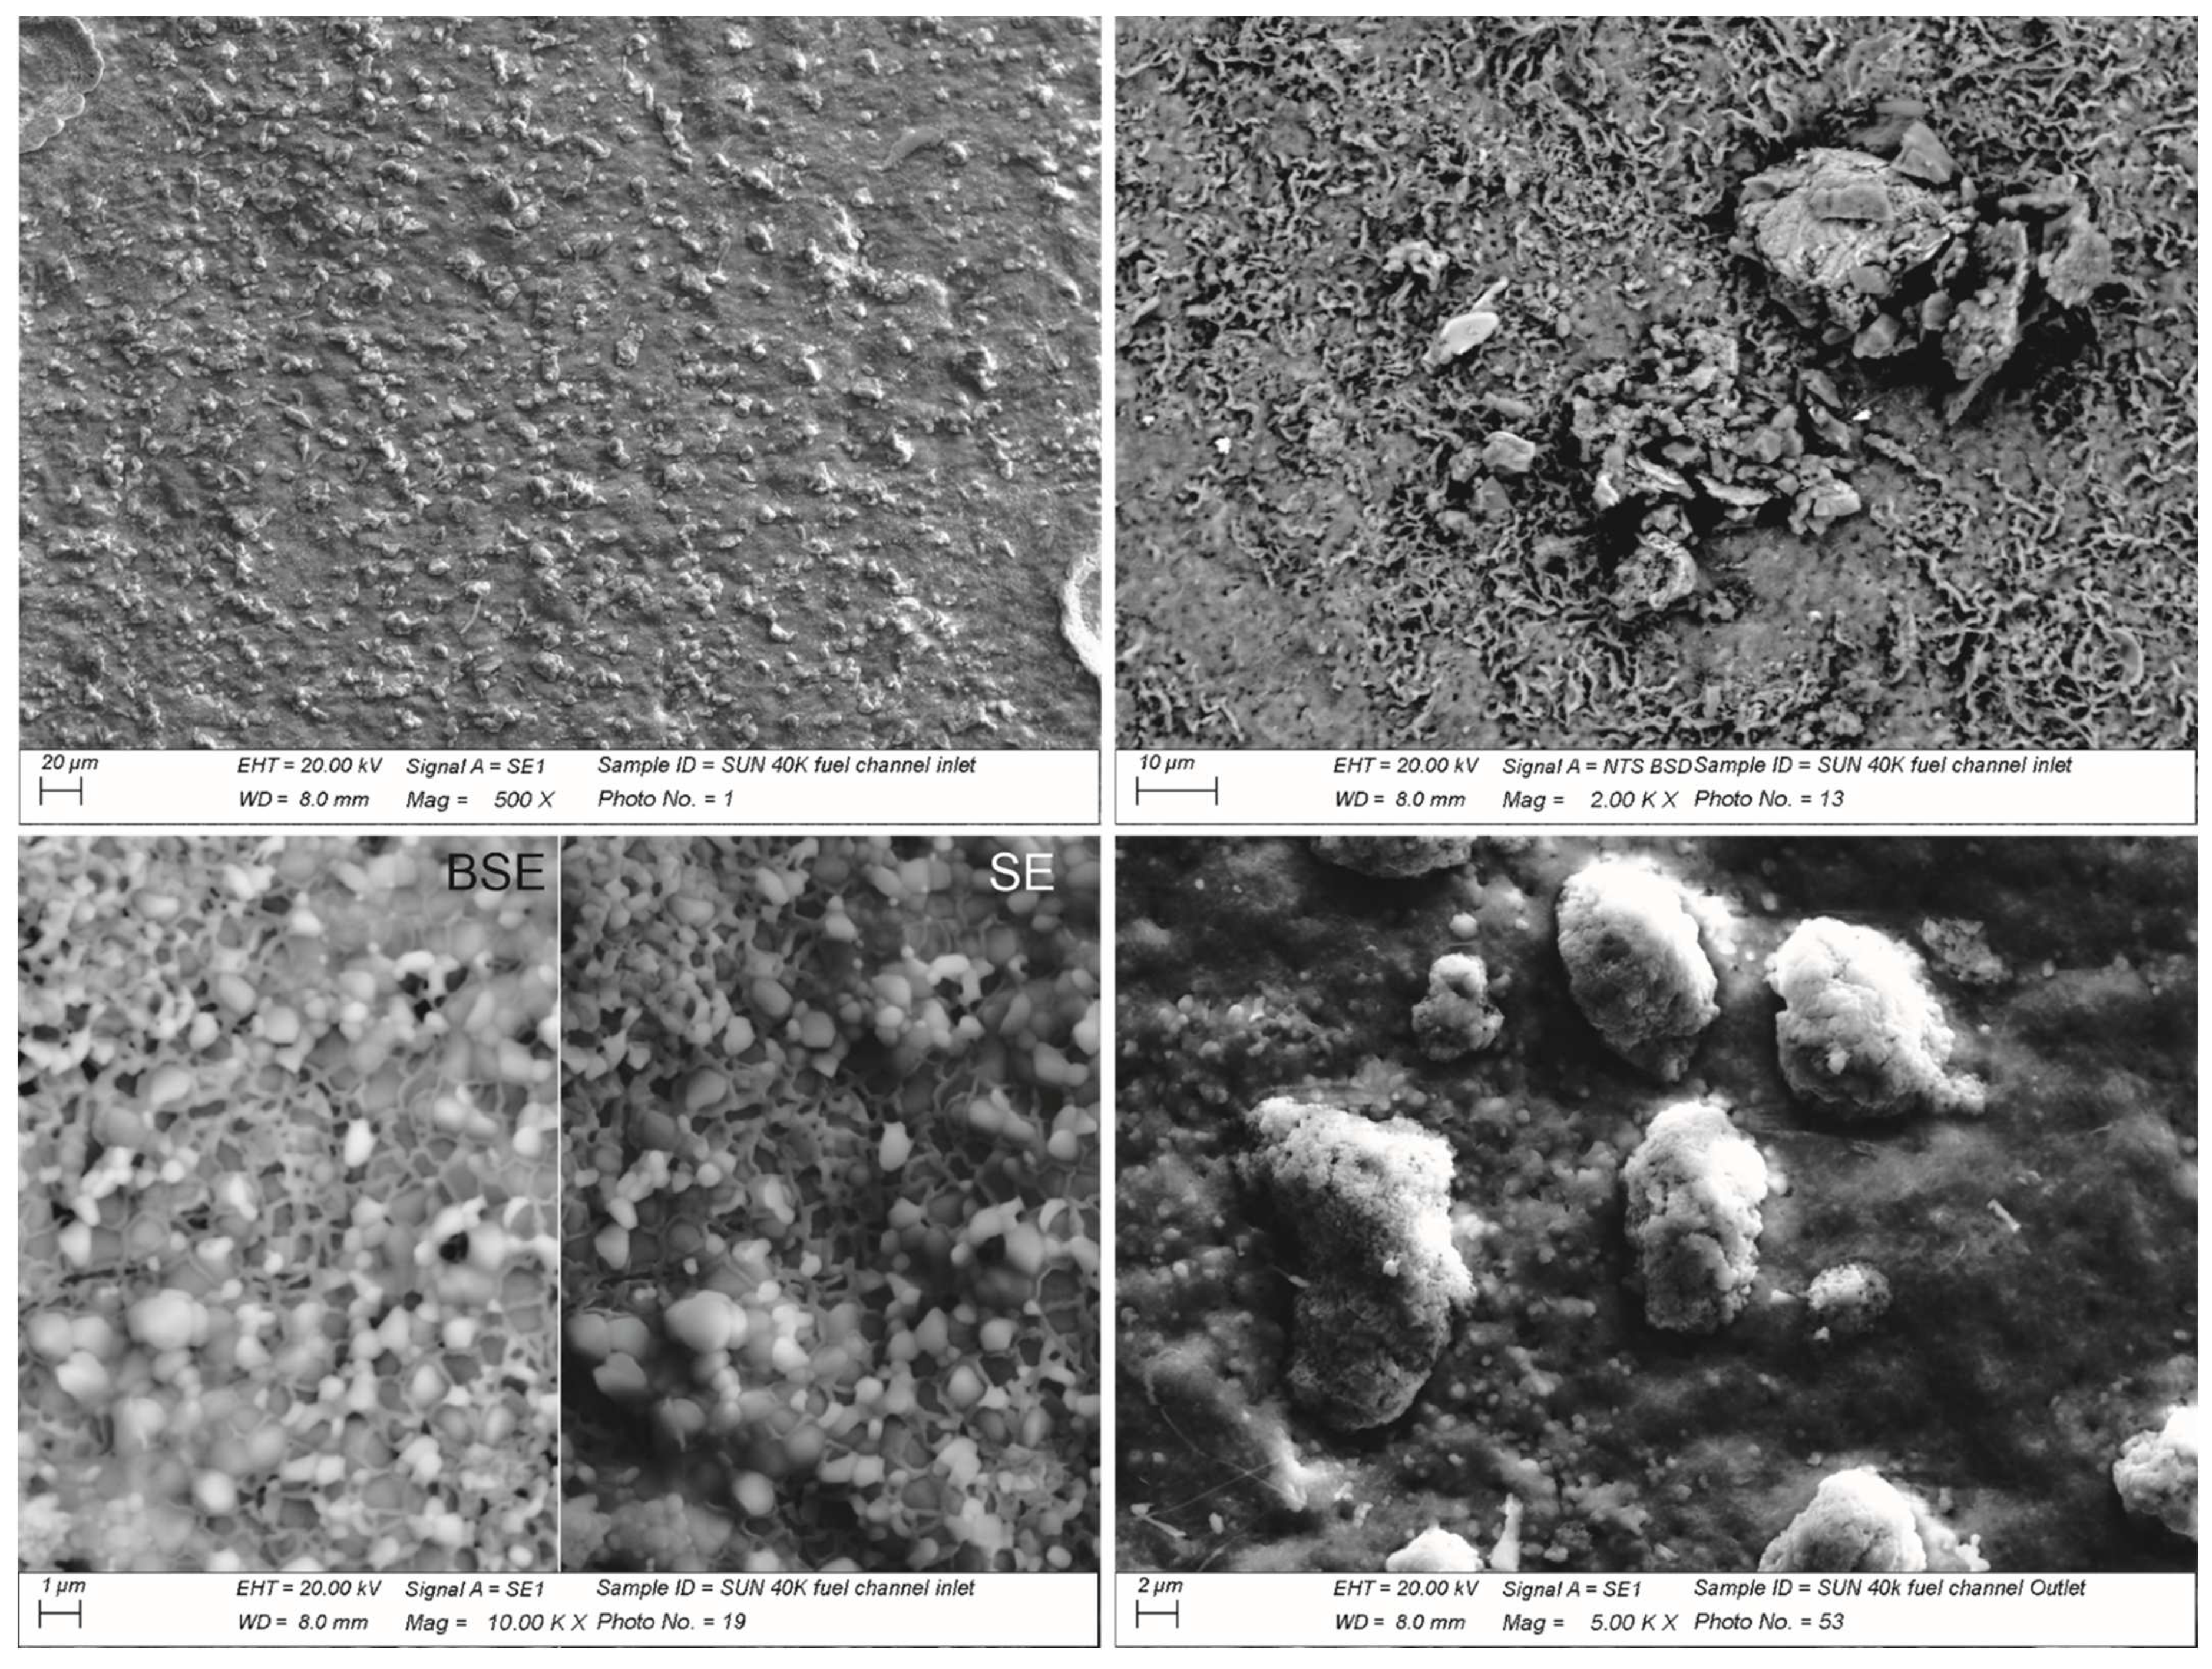
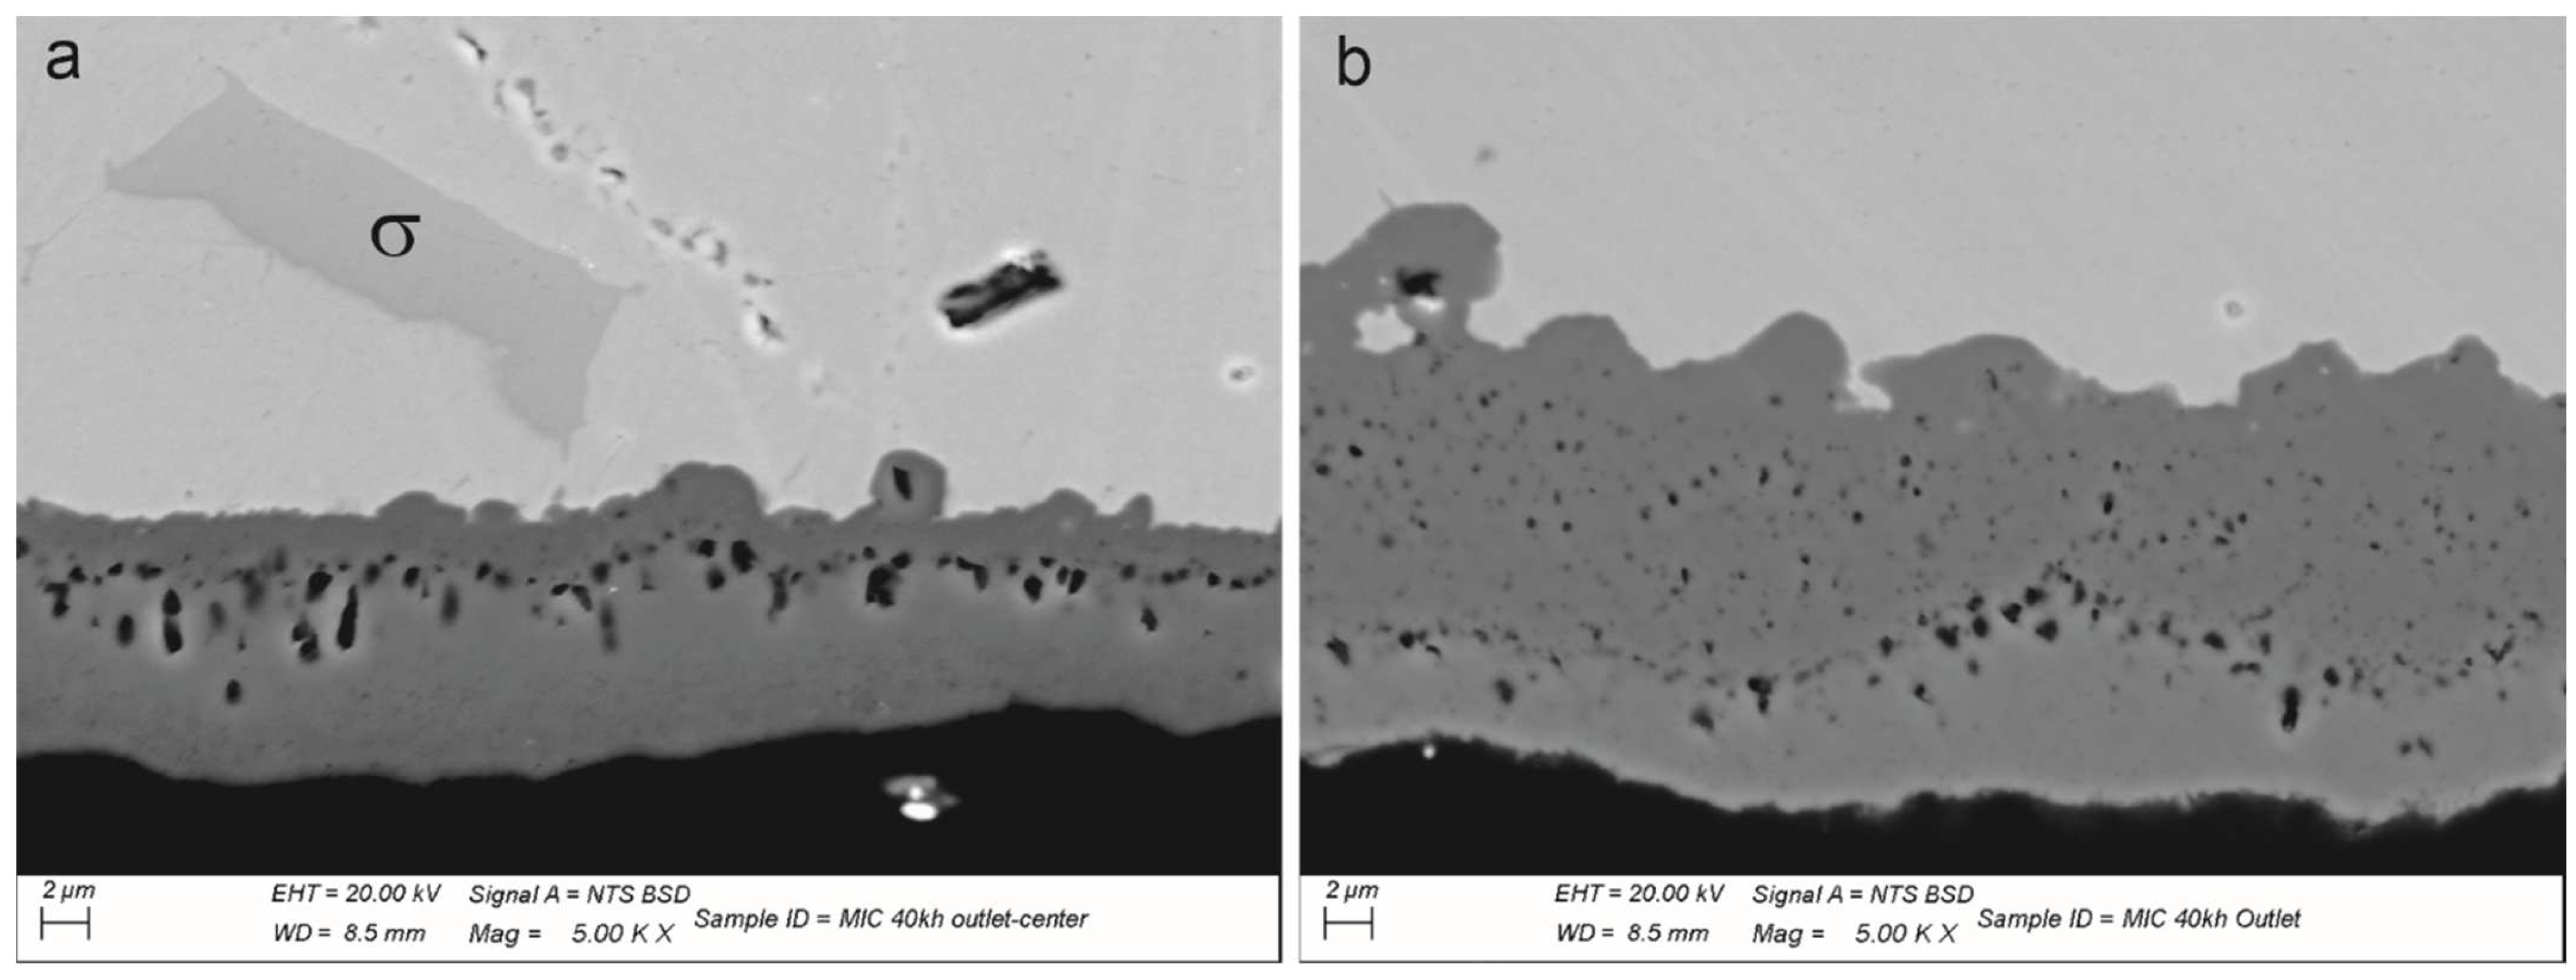
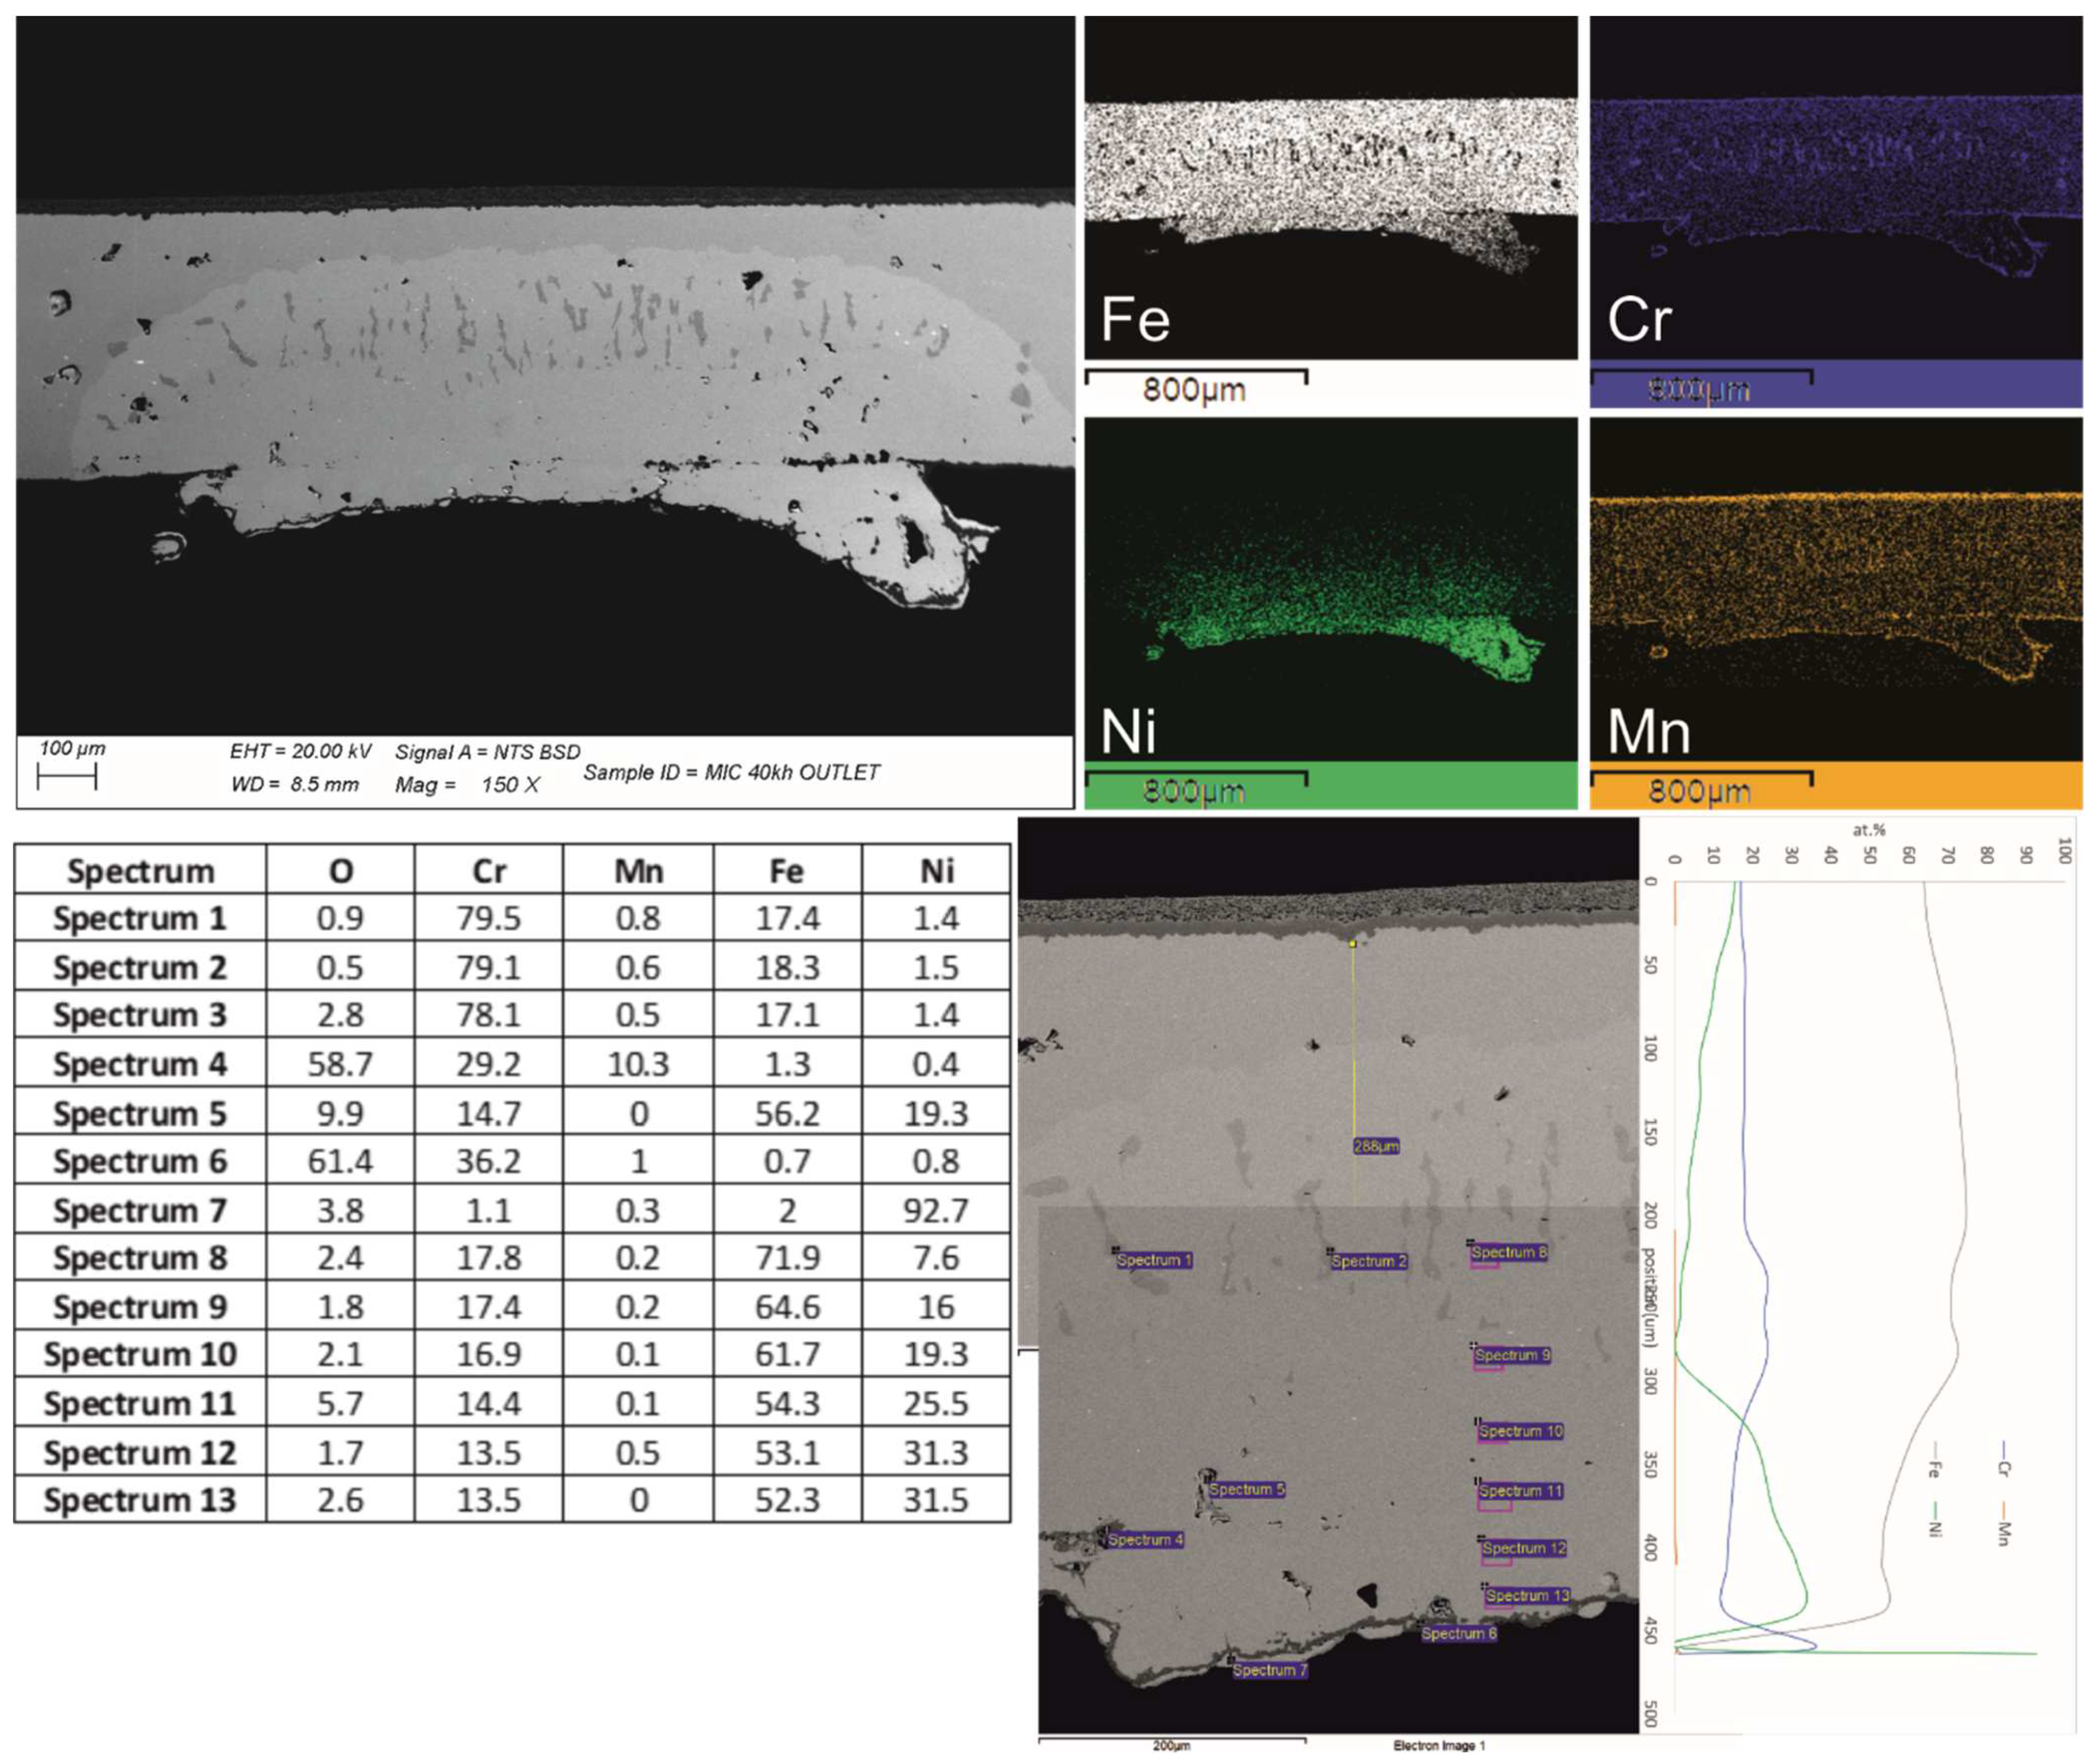
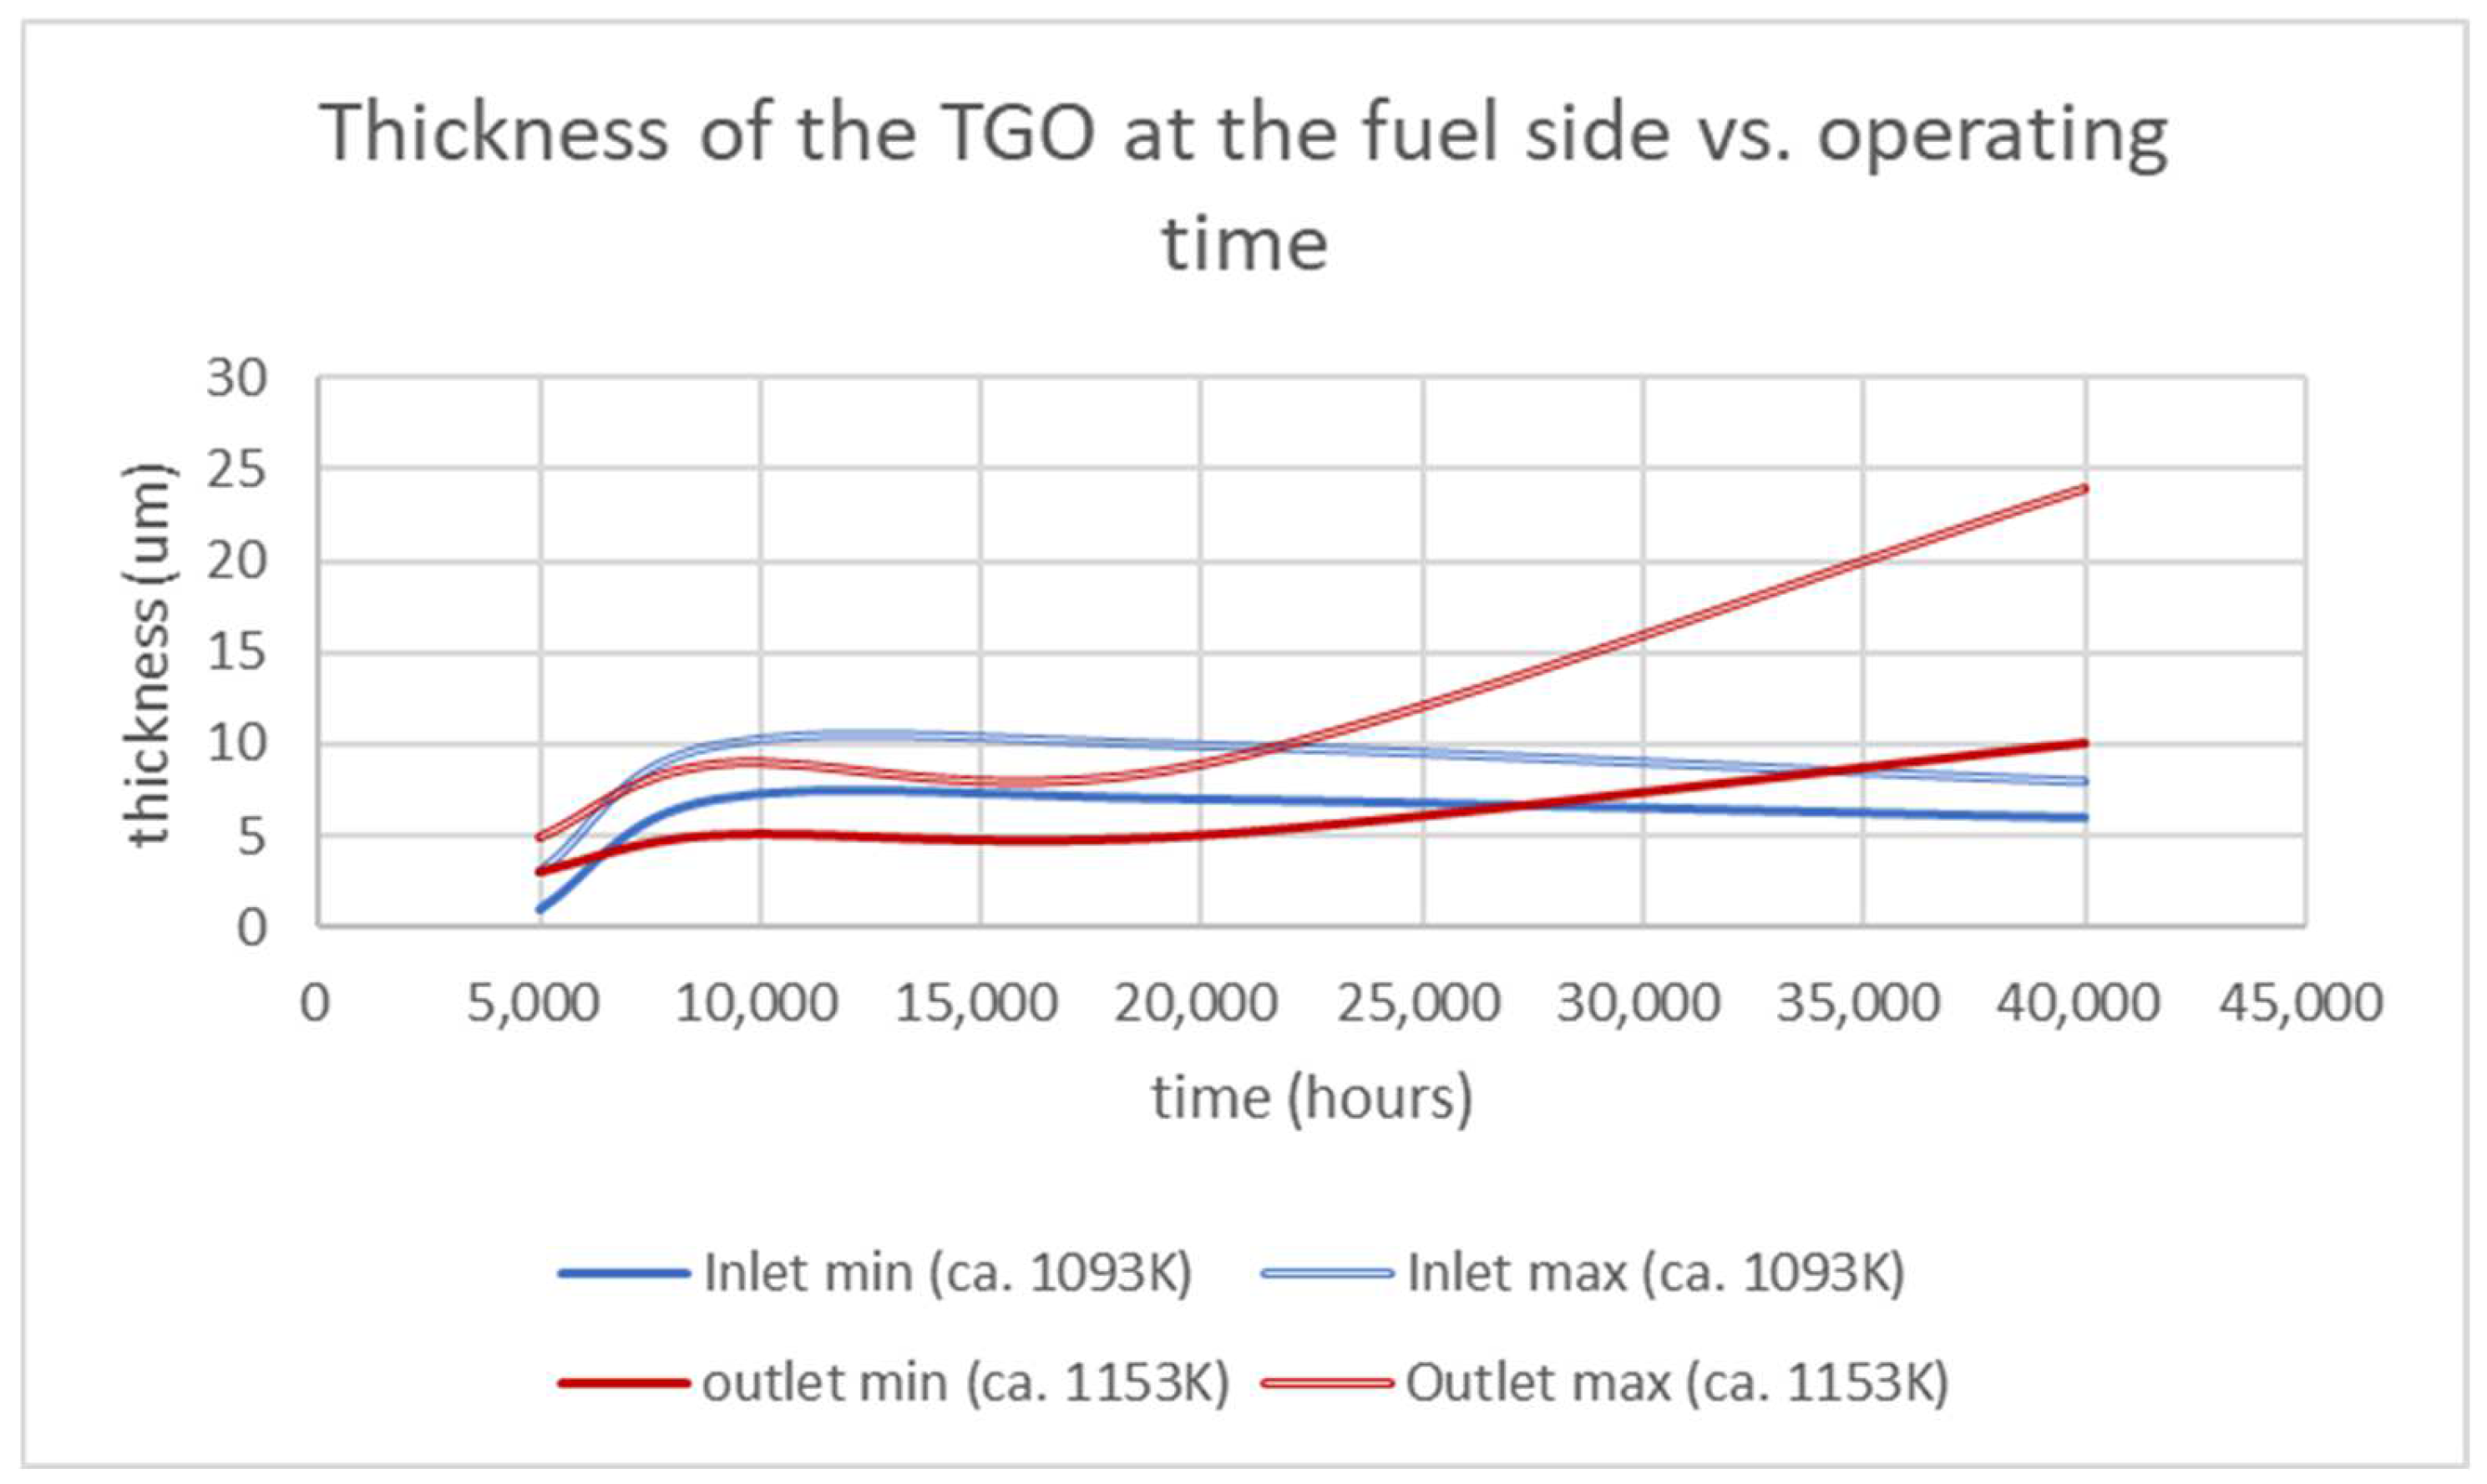
3.2. The Fuel Side
4. Conclusions
Author Contributions
Funding
Data Availability Statement
Conflicts of Interest
References
- Hansen, J.B. Solid oxide electrolysis—A key enabling technology for sustainable energy scenarios. Faraday Discuss. 2015, 182, 9–48. [Google Scholar] [CrossRef] [PubMed]
- Dincer, I. Green methods for hydrogen production. Int. J. Hydrogen Energy 2011, 37, 1954–1971. [Google Scholar] [CrossRef]
- Tao, Z.; Fu, M.; Liu, Y.; Gao, Y.; Tong, H.; Hu, W.; Lei, L.; Bi, L. High-performing proton-conducting solid oxide fuel cells with triple-conducting cathode of Pr0.5Ba0.5(Co0.7Fe0.3)O3-δ tailored with W. Int. J. Hydrogen Energy 2021, 47, 1947–1953. [Google Scholar] [CrossRef]
- Abdin, Z.; Zafaranloo, A.; Rafiee, A.; Mérida, W.; Lipinski, W.; Khalilpour, K.R. Hydrogen as an energy vector. Renew. Sustain. Energy Rev. 2020, 120, 109620. [Google Scholar] [CrossRef]
- Yokokawa, H. Report of Five-Year NEDO Project on Durability/Reliability of SOFC Stacks. ECS Trans. 2013, 57, 299–308. [Google Scholar] [CrossRef]
- Al-Khori, K.; Al-Ghamdi, S.; Boulfrad, S.; Koç, M. Life Cycle Assessment for Integration of Solid Oxide Fuel Cells into Gas Processing Operations. Energies 2021, 14, 4668. [Google Scholar] [CrossRef]
- Yokokawa, H.; Horita, T.; Yamaji, K.; Kishimoto, H.; Brito, M.E. Degradation of SOFC Cell/Stack Per-formance in Relation to Materials Deterioration. J. Korean Ceram. Soc. 2012, 49, 11. [Google Scholar] [CrossRef]
- Fang, Q.; de Haart, U.; Schäfer, D.; Thaler, F.; Rangel-Hernandez, V.; Peters, R.; Blum, L. Degradation Analysis of an SOFC Short Stack Subject to 10,000 h of Operation. J. Electrochem. Soc. 2020, 167, 144508. [Google Scholar] [CrossRef]
- Alenazey, F.; Alyousef, Y.; AlOtaibi, B.; Almutairi, G.; Minakshi, M.; Cheng, C.K.; Vo, D.-V.N. Degradation Behaviors of Solid Oxide Fuel Cell Stacks in Steady-State and Cycling Conditions. Energy Fuels 2020, 34, 14864–14873. [Google Scholar] [CrossRef]
- Tucker, M.C. Progress in metal-supported solid oxide electrolysis cells: A review. Int. J. Hydrog. Energy 2020, 45, 24203–24218. [Google Scholar] [CrossRef]
- Yan, Y.; Fang, Q.; Blum, L.; Lehnert, W. Performance and degradation of an SOEC stack with different cell components. Electrochim. Acta 2017, 258, 1254–1261. [Google Scholar] [CrossRef]
- Chatzichristodoulou, C.; Chen, M.; Hendriksen, P.V.; Jacobsen, T.; Mogensen, M.B. Understanding degradation of solid oxide electrolysis cells through modeling of electrochemical potential profiles. Electrochim. Acta 2015, 189, 265–282. [Google Scholar] [CrossRef] [Green Version]
- The, D.; Grieshammer, S.; Schroeder, M.; Martin, M.; Al Daroukh, M.; Tietz, F.; Schefold, J.; Brisse, A. Microstructural comparison of solid oxide electrolyser cells operated for 6100 h and 9000 h. J. Power Sources 2014, 275, 901–911. [Google Scholar] [CrossRef]
- Riedel, M.; Heddrich, M.; Friedrich, K.A. Analysis of pressurized operation of 10 layer solid oxide electrolysis stacks. Int. J. Hydrog. Energy 2019, 44, 4570–4581. [Google Scholar] [CrossRef]
- Anghilante, R.; Colomar, D.; Brisse, A.; Marrony, M. Bottom-up cost evaluation of SOEC systems in the range of 10–100 MW. Int. J. Hydrog. Energy 2018, 43, 20309–20322. [Google Scholar] [CrossRef]
- Yoo, J.; Woo, S.; Yu, J.; Lee, S.; Park, G. La0.8Sr0.2MnO3 and (Mn1.5Co1.5)O4 double layer coated by electrophoretic deposition on Crofer22 APU for SOEC interconnect applications. Int. J. Hydrog. Energy 2009, 34, 1542–1547. [Google Scholar] [CrossRef]
- Zhang, X.; O’Brien, J.E.; O’Brien, R.; Hartvigsen, J.J.; Tao, G.; Housley, G.K. Improved durability of SOEC stacks for high temperature electrolysis. Int. J. Hydrog. Energy 2013, 38, 20–28. [Google Scholar] [CrossRef]
- Yokokawa, H.; Horita, T.; Sakai, N.; Yamaji, K.; Brito, M.E.; Xiong, Y.-P.; Kishimoto, H. Thermodynamic considerations on Cr poisoning in SOFC cathodes. Solid State Ion. 2006, 177, 3193–3198. [Google Scholar] [CrossRef]
- Ardigò, M.R.; Popa, I.; Chevalier, S.; Girardon, P.; Perry, F.; Laucournet, R.; Brevet, A.; Desgranges, C. Effect of coatings on long term behaviour of a commercial stainless steel for solid oxide electrolyser cell interconnect application in H2/H2O atmosphere. Int. J. Hydrog. Energy 2014, 39, 21673–21677. [Google Scholar] [CrossRef]
- Bianco, M.; Ouweltjes, J.P.; Van Herle, J. Degradation analysis of commercial interconnect materials for solid oxide fuel cells in stacks operated up to 18,000 h. Int. J. Hydrog. Energy 2019, 44, 31406–31422. [Google Scholar] [CrossRef]
- Ghiara, G.; Piccardo, P.; Bongiorno, V.; Repetto, L.; Geipel, C.; Spotorno, R. Characterization of metallic interconnects extracted from Solid Oxide Fuel Cell stacks operated up to 20,000 h in real life conditions: The fuel side. Int. J. Hydrog. Energy 2021, 46, 23815–23827. [Google Scholar] [CrossRef]
- Ghiara, G.; Piccardo, P.; Bongiorno, V.; Geipel, C.; Spotorno, R. Characterization of Metallic Interconnects Extracted from Solid Oxide Fuel Cell Stacks Operated up to 20,000 h in Real Life Conditions: The Air Side. Energies 2020, 13, 6487. [Google Scholar] [CrossRef]
- Bianco, M.; Caliandro, P.; Diethelm, S.; Yang, S.; Dellai, A.; Van Herle, J.; Steinberger-Wilckens, R. In-situ experimental benchmarking of solid oxide fuel cell metal interconnect solutions. J. Power Sources 2020, 461, 228163. [Google Scholar] [CrossRef]
- Paravidino, D.; Piccardo, P.; Spotorno, R. A Novel Method for Evaluation of Chromium Evaporation from Solid Oxide Fuel Cells Interconnects: A Feasibility Study. Mater. Sci. Forum 2021, 1016, 1109. [Google Scholar] [CrossRef]
- ThyssenKrupp. VDM, Crofer 22 APU—Material, Data Sheet No 4046. 2010. Available online: https://kipdf.com/vdm-crofer-22-apu-material-data-sheet-no-may-2010-edition_5ab1d0be1723dd339c808799.html (accessed on 5 May 2022).
- Quadakkers, W.J.; Shemet, V.; Singheiser, L. US Patent No.2,003,059,335, 11 September 2003.
- Timurkutluk, B.; Toros, S.; Onbilgin, S.; Korkmaz, H.G. Determination of formability characteristics of Crofer 22 APU sheets as interconnector for solid oxide fuel cells. Int. J. Hydrog. Energy 2018, 43, 14638–14647. [Google Scholar] [CrossRef]
- Wu, J.; Liu, X. Recent Development of SOFC Metallic Interconnect. J. Mater. Sci. Technol. 2010, 26, 293–305. [Google Scholar] [CrossRef]
- Jin, Y.; Sheng, J.; Hao, G.; Guo, M.; Hao, W.; Yang, Z.; Xiong, X.; Peng, S. Highly dense (Mn,Co)3O4 spinel protective coating derived from MneCo metal precursors for SOFC interconnect applications. Int. J. Hydrog. Energy 2022, 47, 13960–13968. [Google Scholar] [CrossRef]
- Mah, J.C.W.; Muchtar, A.; Somalu, M.R.; Ghazali, M.J. Metallic interconnects for solid oxide fuel cell: A review on protective coating and deposition techniques. Int. J. Hydrog. Energy 2017, 42, 9219–9229. [Google Scholar] [CrossRef]
- Spotorno, R.; Paravidino, D.; Delsante, S.; Piccardo, P. Volatilization of chromium from AISI 441 stainless steel: Time and temperature dependence. Surf. Coat. Technol. 2022, 433, 128125. [Google Scholar] [CrossRef]
- Bongiorno, V.; Spotorno, R.; Paravidino, D.; Piccardo, P. On the High-Temperature Oxidation and Area Specific Resistance of New Commercial Ferritic Stainless Steels. Metals 2021, 11, 405. [Google Scholar] [CrossRef]
- Talic, B.; Venkatachalam, V.; Hendriksen, P.V.; Kiebach, R. Comparison of MnCo2O4 coated Crofer 22 H, 441, 430 as interconnects for intermediate-temperature solid oxide fuel cell stacks. J. Alloys Compd. 2020, 821, 153229. [Google Scholar] [CrossRef]
- Przybylski, K.; Brylewski, T.; Durda, E.; Gawel, R.; Kruk, A. Oxidation properties of the Crofer 22 APU steel coated with La0.6Sr0.4Co0.2Fe0.8O3 for IT-SOFC interconnect applications. J. Therm. Anal. 2014, 116, 825–834. [Google Scholar] [CrossRef] [Green Version]
- Si, X.; Wang, D.; Li, C.; Qi, J.; Cao, J. Exploring the role of Mn–Co spinel coating on Crofer 22 APU in adjusting reactions with the Ag based sealant during reactive air brazing. J. Mater. Res. Technol. 2021, 16, 608–618. [Google Scholar] [CrossRef]
- Magdefrau, N.J.; Chen, L.; Sun, E.Y.; Yamanis, J.; Aindow, M. Formation of spinel reaction layers in manganese cobaltite—coated Crofer22 APU for solid oxide fuel cell interconnects. J. Power Sources 2013, 227, 318–326. [Google Scholar] [CrossRef]
- Amendola, R.; Gannon, P.; Ellingwood, B.; Hoyt, K.; Piccardo, P.; Genocchio, P. Oxidation behavior of coated and preoxidized ferritic steel in single and dual atmosphere exposures at 800 °C. Surf. Coat. Technol. 2012, 206, 2173–2180. [Google Scholar] [CrossRef]
- Ansara, I.; Chart, T.; Chevalier, P.Y. Phase Diagrams for FE-CR-NI Based Alloys. In Directorate-General for Research and Innovation (European Commission); Technical Report, EUR 9657; European Commission: Brussels, Belgium, 1996. [Google Scholar]
- Ohring, M. Interdiffusion, Reactions, and Transformations in Thin Films. In Materials Science of Thin Films, 2nd ed.; Academic Press: Cambridge, MA, USA; Elsevier: Amsterdam, The Netherlands, 2002; p. 641. [Google Scholar]


| Operation Type | SOFC (µCHP) |
|---|---|
| Total runtime/h | 30 k hours in field conditions using reformed hydrogen10 k hours in laboratory conditions of H2/N2 |
| Fuel gas (Co-flow) | Reformed methane: 44% N2; 34% H2; 16% CO; 4% H2O; 2% CO2H2/N2: 3% humidified |
| Nominal temperature/K | 1123 |
| Current density/mA·cm−2 | 90–200 |
| Wt. % | Cr | Fe | C | Mn | Si | Ti | La | Others |
|---|---|---|---|---|---|---|---|---|
| Minimum | 20.0 | bal. | 0.30 | 0.03 | 0.04 | Cu, Al | ||
| Maximum | 24.0 | 0.03 | 0.80 | 0.50 | 0.20 | 0.20 |
| Area | TGO Lower Thickness (μm) | TGO Higher Thickness (μm) |
|---|---|---|
| Inlet | 2 | 5 |
| Inlet-center | 4 | 11 |
| Center-outlet | 4 | 14 |
| Outlet | 9 | 17 |
| Area | TGO Lower Thickness (μm) | TGO Higher Thickness (μm) |
|---|---|---|
| Inlet | 6 | 8 |
| Inlet-center | 3 | 9 |
| Center-outlet | 7 | 18 |
| Outlet | 10 | 24 |
Publisher’s Note: MDPI stays neutral with regard to jurisdictional claims in published maps and institutional affiliations. |
© 2022 by the authors. Licensee MDPI, Basel, Switzerland. This article is an open access article distributed under the terms and conditions of the Creative Commons Attribution (CC BY) license (https://creativecommons.org/licenses/by/4.0/).
Share and Cite
Piccardo, P.; Spotorno, R.; Geipel, C. Investigation of a Metallic Interconnect Extracted from an SOFC Stack after 40,000 h of Operation. Energies 2022, 15, 3548. https://doi.org/10.3390/en15103548
Piccardo P, Spotorno R, Geipel C. Investigation of a Metallic Interconnect Extracted from an SOFC Stack after 40,000 h of Operation. Energies. 2022; 15(10):3548. https://doi.org/10.3390/en15103548
Chicago/Turabian StylePiccardo, Paolo, Roberto Spotorno, and Christian Geipel. 2022. "Investigation of a Metallic Interconnect Extracted from an SOFC Stack after 40,000 h of Operation" Energies 15, no. 10: 3548. https://doi.org/10.3390/en15103548
APA StylePiccardo, P., Spotorno, R., & Geipel, C. (2022). Investigation of a Metallic Interconnect Extracted from an SOFC Stack after 40,000 h of Operation. Energies, 15(10), 3548. https://doi.org/10.3390/en15103548