Article

Synthesis of High Surface Area—Group 13—Metal Oxides via Atomic Layer Deposition on Mesoporous Silica

by
Robert Baumgarten
1,
Piyush Ingale
1,
Kristian Knemeyer
1,
Raoul Naumann d’Alnoncourt
1,*,
Matthias Driess
1,2 and
Frank Rosowski
1,3
1
BasCat—UniCat BASF JointLab, Technische Universität Berlin, Hardenberstraße 36, 10623 Berlin, Germany
2
Institut für Chemie: Metallorganik und Anorganische Materialien, Technische Universität Berlin, Straße des 17. Juni 135, 10623 Berlin, Germany
3
Process Research and Chemical Engineering, BASF SE, Carl-Bosch-Straße 38, 67056 Ludwigshafen, Germany
*
Author to whom correspondence should be addressed.
Nanomaterials 2022, 12(9), 1458; https://doi.org/10.3390/nano12091458
Submission received: 29 March 2022 / Revised: 14 April 2022 / Accepted: 21 April 2022 / Published: 25 April 2022
(This article belongs to the Section Synthesis, Interfaces and Nanostructures)

Abstract

:
The atomic layer deposition of gallium and indium oxide was investigated on mesoporous silica powder and compared to the related aluminum oxide process. The respective oxide (GaOx, InOx) was deposited using sequential dosing of trimethylgallium or trimethylindium and water at 150 °C. In-situ thermogravimetry provided direct insight into the growth rates and deposition behavior. The highly amorphous and well-dispersed nature of the oxides was shown by XRD and STEM EDX-mappings. N2 sorption analysis revealed that both ALD processes resulted in high specific surface areas while maintaining the pore structure. The stoichiometry of GaOx and InOx was suggested by thermogravimetry and confirmed by XPS. FTIR and solid-state NMR were conducted to investigate the ligand deposition behavior and thermogravimetric data helped estimate the layer thicknesses. Finally, this study provides a deeper understanding of ALD on powder substrates and enables the precise synthesis of high surface area metal oxides for catalytic applications.

Graphical Abstract

1. Introduction

Group 13 metal oxides (e.g., Al2O3, Ga2O3, and In2O3) possess key properties for a broad range of applications such as semiconductors, optoelectronics, and catalysts. Aluminum oxide is used as an insulator in gate transistors [1], as inert fillers [2], and as ceramics due to its firmness [3]. Gallium oxide can be applied as oxygen-gas sensors [4], as surface passivation of solar cells [5], and in electroluminescent devices [6]. Because of its high optical transparency and electric properties, indium oxide is used in numerous optoelectronic applications such as photovoltaics [7], light-emitting diodes [8], and modern displays [9].
In addition to electronic applications, group 13 metal oxides are crucial components of heterogeneous catalysts. Al2O3 acts as a typical catalyst support, for example in Pt-Sn/Al2O3 which is employed industrially for the dehydrogenation of propane [10]. Ga2O3 has been studied for the dehydrogenation of light alkanes such as propane. Moreover, In2O3-based catalysts have received tremendous attention due to their ability to convert CO2-rich syngas into methanol [11,12]. Especially in heterogeneous catalysis, most of the reactions take place at active sites on the material’s surface. Therefore, a high surface area and homogeneous dispersion of deposited interfaces (e.g., metal oxides) are vital for enhanced activity [13].
The native bulk oxides of gallium and indium exhibit specific surface areas below 120 m2/g [12,14,15]. In order to increase the surface areas for catalytic applications, the oxides can be deposited on a carrier material such as porous silica, alumina, and carbon with up to 600 m2/g [16,17]. One well-established tool for the deposition of uniform, nanoscale films is atomic layer deposition (ALD). This technique follows sequential reactions of a gaseous precursor and a reactant with the terminal groups of a material’s surface, growing one sub-monolayer per cycle (ca. 1 Å) [18]. One of the most commonly studied materials grown by ALD is Al2O3, using trimethylaluminum (TMA) and water as a precursor-reactant combination [19]. Alumina can be deposited on substrates with various topographies such as flat silicon wafers for passivation [20], electrodes for enhanced cyclability [21], and even polymers [22].
Since ALD is applicable to materials with different topographies, it progressively gained recognition in heterogeneous catalysis [23,24]. It was also investigated as a synthesis tool for the precise deposition of active metals [25,26] or metal oxides [27,28,29]. For instance, alumina overcoating on a Pt/Al2O3 catalyst was shown to prevent the sintering of Pt during propane dehydrogenation (PDH) [30]. Additionally, an alucone layer on Ni/SiO2 prevented unwanted carbon formation under dry reforming conditions [31]. Further, ZnO ALD was applied to synthesize PDH-active Pt1Zn1 nano-alloys [32]. Thereby, SiO2 was used as a carrier material for the ZnO ALD layer to increase the specific surface area up to 400 m2/g. Although AlOx ALD is widely applied in catalyst research, synthesis strategies employing ALD of the other group 13 oxides (e.g., GaOx and InOx) are seldom investigated. Yet, there are some examples such as the usage of GaOx ALD to introduce acid sites on zeolites [28] or the application of InOx ALD to grow an In2O3 layer over Pt/Al2O3 as an efficient PDH catalyst [29].
To date, published studies on the deposition behavior of GaOx or InOx ALD on powder substrates are limited, especially with regard to higher surface area and porous structure [33]. On flat substrates, however, different precursor-reactant combinations were studied for the deposition of GaOx such as GaMe3/O2-plasma [34,35,36,37], GaEt3/O2-plasma [38,39], Ga(iOPr)3/H2O [40], Ga(CpMe5)/ O2 + H2O [41], and [Ga(NMe2)3]2/O2-plasma [42]. Yet, all of them aimed for coatings of Si-wafer, fused silica, or SiO2 terminated Si, focusing for example on electronic applications such as thin-film transistors [43]. The same accounts for InOx ALD investigations on flat substrates which comprise the usage of numerous combinations such as InCl3/H2O [44], InMe3/(H2O or O2-plasma) [45,46,47,48], InEt3/O2-plasma [39], InCp/O2 + H2O [49,50], and others [46,51,52,53,54,55,56,57,58].
The consensus of the studies collected above is that water as an oxygen source, especially in combination with GaMe3, leads to low growth rates due to the insufficient removal of methyl ligands [35]. Similar conclusions were made for the combination of InMe3 and water [47]. Nevertheless, Kim et al. [45] found that a longer Langmuir exposure of H2O (ca. 2 Torr·s) enabled the complete exchange of methyl groups, yielding In2O3 with linear growth per cycle (gpc). These findings can be rationalized by high activation barriers to remove the methyl group through water (Ea(Ga-CH3) = 151.0 and (In-CH3) = 169.8 kJ/mol), calculated by Shong et al. [59]. Insufficient ligand removal can be overcome by the usage of reactants with higher oxidation potential such as O2-plasma [47]. However, plasma has the drawback of swift recombination on larger steel set-ups [60,61] and might lead to unwanted changes in the surface morphology of the substrate [62]. In addition to ALD, metal organic chemical vapor deposition (MOCVD) was used to synthesize defined layers of indium oxides. For example, Kakanakova-Georgieva et al. managed to stabilize two-dimensional (2D) layers of InO between graphene and Si/C via MOCVD of InMe3 [63]. Hereby, DFT calculations were applied to investigate bonding and structure particularities, revealing a sequence of O-In-In-O for the 2D InO quadruple layer [64]. However, on amorphous silica, the formation of highly ordered oxides is unlikely as the surface structure is far more complex than ordered Si/C.
In order to use the full potential of ALD for the modification of porous substrates, deeper knowledge about the deposition mechanisms on powders is essential. Additionally, ALD on powders demands different process parameters which are less relevant for the coating of flat substrates [65,66]. For instance, diffusion limitations in the pores and high surface areas (100–500 m2/g) require different reactor geometries and longer dosing times [66,67]. Fixed- or fluidized-bed reactors were shown to be convenient, however, they cannot accommodate spectroscopic ellipsometry or a quartz crystal microbalance (QCM) for in-situ monitoring. Therefore, ALD processes on powders such as AlOx/SiO2 [68], ZnO/SiO2 [67], and POx/V2O5 [69] were studied using a magnetic suspension balance for in-situ thermogravimetric analysis [70]. In the current study, we progressed with detailed investigations of the ALD growth behavior of gallium and indium oxides on mesoporous silica powder as a model system. The respective oxide was deposited with up to three cycles by the sequential dosing of trimethylgallium (TMG)/H2O and trimethylindium (TMI)/H2O at 150 °C.

2. Materials and Methods

2.1. Materials

Silica powder (SiO2 amorphous, ≥99%, high-purity grade (Davisil Grade 636), average pore size 60 Å, particle size 250–500 µm, specific surface area 505 m2/g, Sigma-Aldrich, St. Louis, MO, UAS) was used as a substrate for atomic layer deposition. Trimethylaluminium (Al(CH3)3, TMA, elec. grade (99.999%—Al)), Trimethylgallium (Ga(CH3)3, TMG, elec. grade (99.999%—Ga)), and Trimethylindium (In(CH3)3, TMI, elec. grade (99.999%—In)) (Strem Chemicals Europe, Bischheim, France) were employed as atomic layer deposition precursors. Water (H2O, CHROMASOLV®, for HPLC, Riedel-de Haën/ Honeywell Specialty Chemicals Seelze GmbH, Seelze, Germany) served as a reactant and was used without further purification. High purity argon (Ar, 99.999%) was used as a carrier and purging gas.

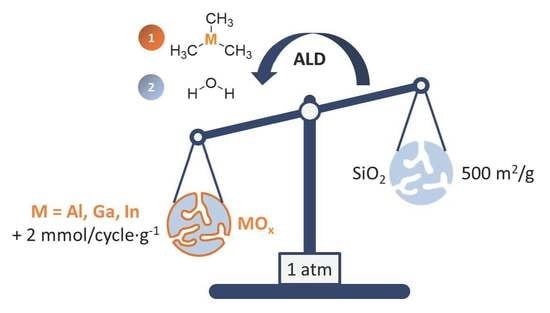
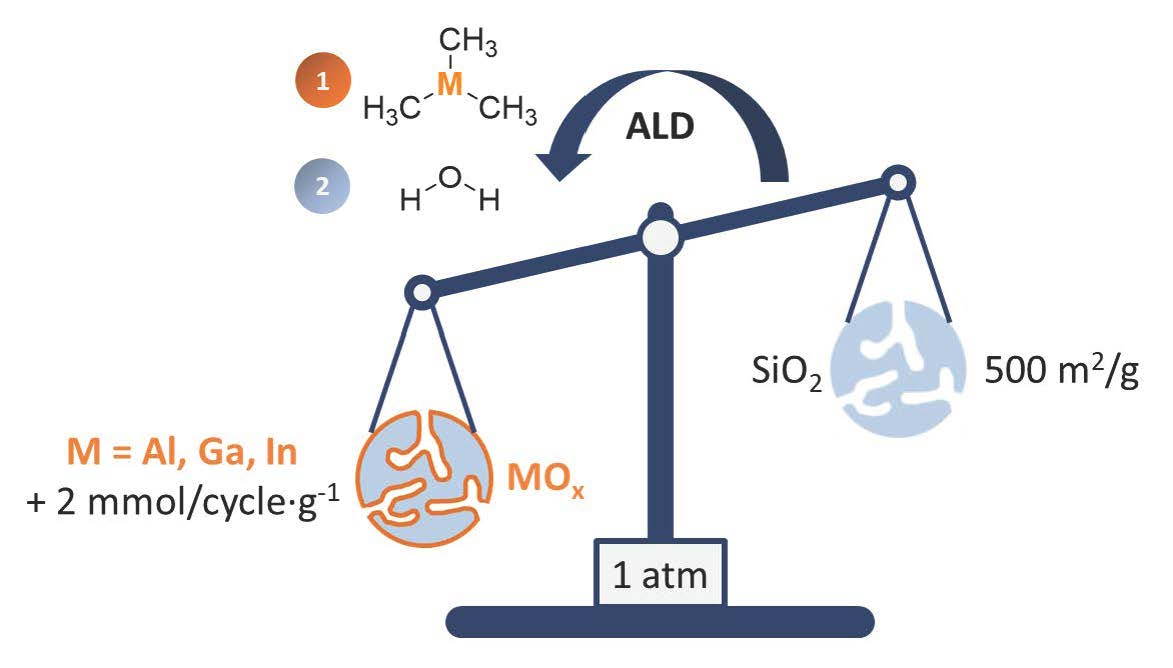
2.2. Atomic Layer Deposition of GaOx and InOx on SiO2

Initially, the deposition behavior was examined in a magnetic suspension balance (MSB) for in-situ monitoring of mass changes (marked with MSB or in-situ). Afterward, the developed processes were scaled up in a quartz tube fixed bed reactor, producing up to 20 mL of ALD-modified material for ex-situ analysis. Both self-build setups possess fixed bed geometry operating at atmospheric pressure with top-to-bottom flow, as further described elsewhere [70]. In the MSB, GaOx, and InOx ALD was carried out under a constant flow of 50 mL/min containing precursor or reactant diluted in argon. For each cycle, reactants were dosed until no further mass change was detected to ensure saturation. The same procedure accounted for intermediate purging steps to ensure the removal of gaseous precursors. For the larger fixed bed reactor (FB), a continuous flow of 100 mL/min was applied and saturation of the precursor was determined by an online quadrupole mass spectrometer (Pfeiffer Vacuum, Asslar, Germany). The point of saturation is reached once a constant ion current of unreacted precursor ions is measured in the MS shortly after the signal breakthrough (TMG: 69 m/z for Ga* and TMI: 115 m/z for In*), similar to previously described [67]. The precursor chamber of TMG was kept at RT and TMI at 80 °C while the reactors were maintained at 150 °C. For both oxides, three cycles were performed employing an ALD-sequence (cycle) of TMX/Ar-purge/H2O/Ar-purge on dried silica powder.

2.3. Characterization of the Materials

Nitrogen physisorption measurements were performed at liquid N2 temperature (77 K) using a Quadrasorb SI (Quantachrome GmbH & Co. KG, Odelzhausen, Germany). Prior to measurements, the samples were degassed at 150 °C for 2 h. The specific surface areas were determined applying the B.E.T. method (Brunauer–Emmett–Teller) and the corresponding pore size distribution was calculated from the desorption branches using the B.J.H. method (Barrett–Joyner–Halenda). Powder X-ray diffraction (XRD) patterns were acquired with an X‘PERT Pro (PANalytical, Malvern, UK) equipped with a scintillation detector, using Cu Kα1 radiation (λ = 0.154 nm). Inductively coupled plasma optical emission spectrometry (ICP-OES) was employed to determine In and Ga contents and measured on a Varian 720-ES (Varian Inc., Palo Alto, CA, USA). Solutions from the powder were prepared via acidic leaching. Respective metals were detached from silica in a sealed container using saturated hydrochloric acid (35%) at 120 °C. The spectroscope was three-point calibrated with a commercially available, diluted standard for In and Ga. Mass fractions of carbon, hydrogen, nitrogen, and sulfur were determined by combustion analysis (CHN), executed on a EuroEA Elemental Analyzer (HEKAtech GmbH, Wegberg, Germany). FT-IR spectroscopy was measured in transmission (4000–400 cm−1) on a Bruker ALPHA FT-IR spectrometer inside a glove box. Samples were diluted with KBr, ground in a mortar, and pressed into pellets. Prior to preparation, samples were dried at 130 °C for 3 h and transferred into the glovebox. Spectra were collected as data point tables by the usage of OPUS (Bruker, Billerica, MA, USA). Solid-state (SS) nuclear magnetic resonance (NMR) spectra were recorded with a Bruker Avance 400 MHz spectrometer operating at 100.56 MHz for 13C and 79.44 MHz for 29Si. High-power decoupled (HPDEC) 13C and 29Si cross-polarization magic angle spinning (CP/MAS) NMR experiments were carried out at a MAS rate of 10 kHz, contact time of 2.0 ms, and a recycle delay of 2 s, using a 4 mm MAS HX double-resonance probe. Spectra are referenced to those of external tetramethylsilane (TMS) at 0 ppm for 13C and 29Si, using adamantane and tetrakis(trimethylsilyl)silane (TKS) as secondary references, respectively. X-ray photoelectron spectroscopy (XPS) was carried out on a K-Alpha™ + X-ray Photoelectron Spectrometer System (Thermo Fisher Scientific, Waltham, MA, USA), equipped with a Hemispheric 180° dual-focus analyzer connected to a 128-channel detector. The X-ray monochromator applies micro-focused Al−Kα radiation. The as-prepared samples were loaded directly on the sample holder for measurement. Data were collected with an X-ray spot size of 200 μm, 20 scans for the survey, and 50 scans for regions. Binding energy surveys were calibrated according to the C1s orbital fixed at 284.8 eV. Scanning transmission electron microscopy (STEM) was performed on an FEI Talos F200X (Thermo Fisher Scientific, Waltham, MA, USA) with an XFEG field emission gun and acceleration voltage of 200 kV. Energy-dispersive X-ray (EDX) mappings were recorded with a SuperX system of four SDD EDX detectors (Analysis software: Velox 2.9.0 by Thermo Fisher Scientific, Waltham MA, USA). The surface density of OH groups was determined via a Grignard titration method described in detail elsewhere [71]. A j-young NMR tube was loaded with ca. 20 mg of SiO2 (dried at 150 °C), ferrocene, and self-synthesized Mg(CH2Ph)2·2(THF) as Grignard reagent (mass-ratio ca. 3:1:5) inside a glovebox. The solid mixture was suspended in benzen-d6 and the NMR tube was sealed and shaken to let the reagents react with the OH-groups of SiO2. 1H NMR spectra were measured on a Bruker Avance II 200 MHz spectrometer (Bruker BioSpin MRI GmbH, Ettlingen, Germany). The total number of OH-sites was determined by calculating the number of moles of toluene produced (based on its methyl group peak integral at 2.1 ppm) using ferrocene as an internal standard.

3. Results

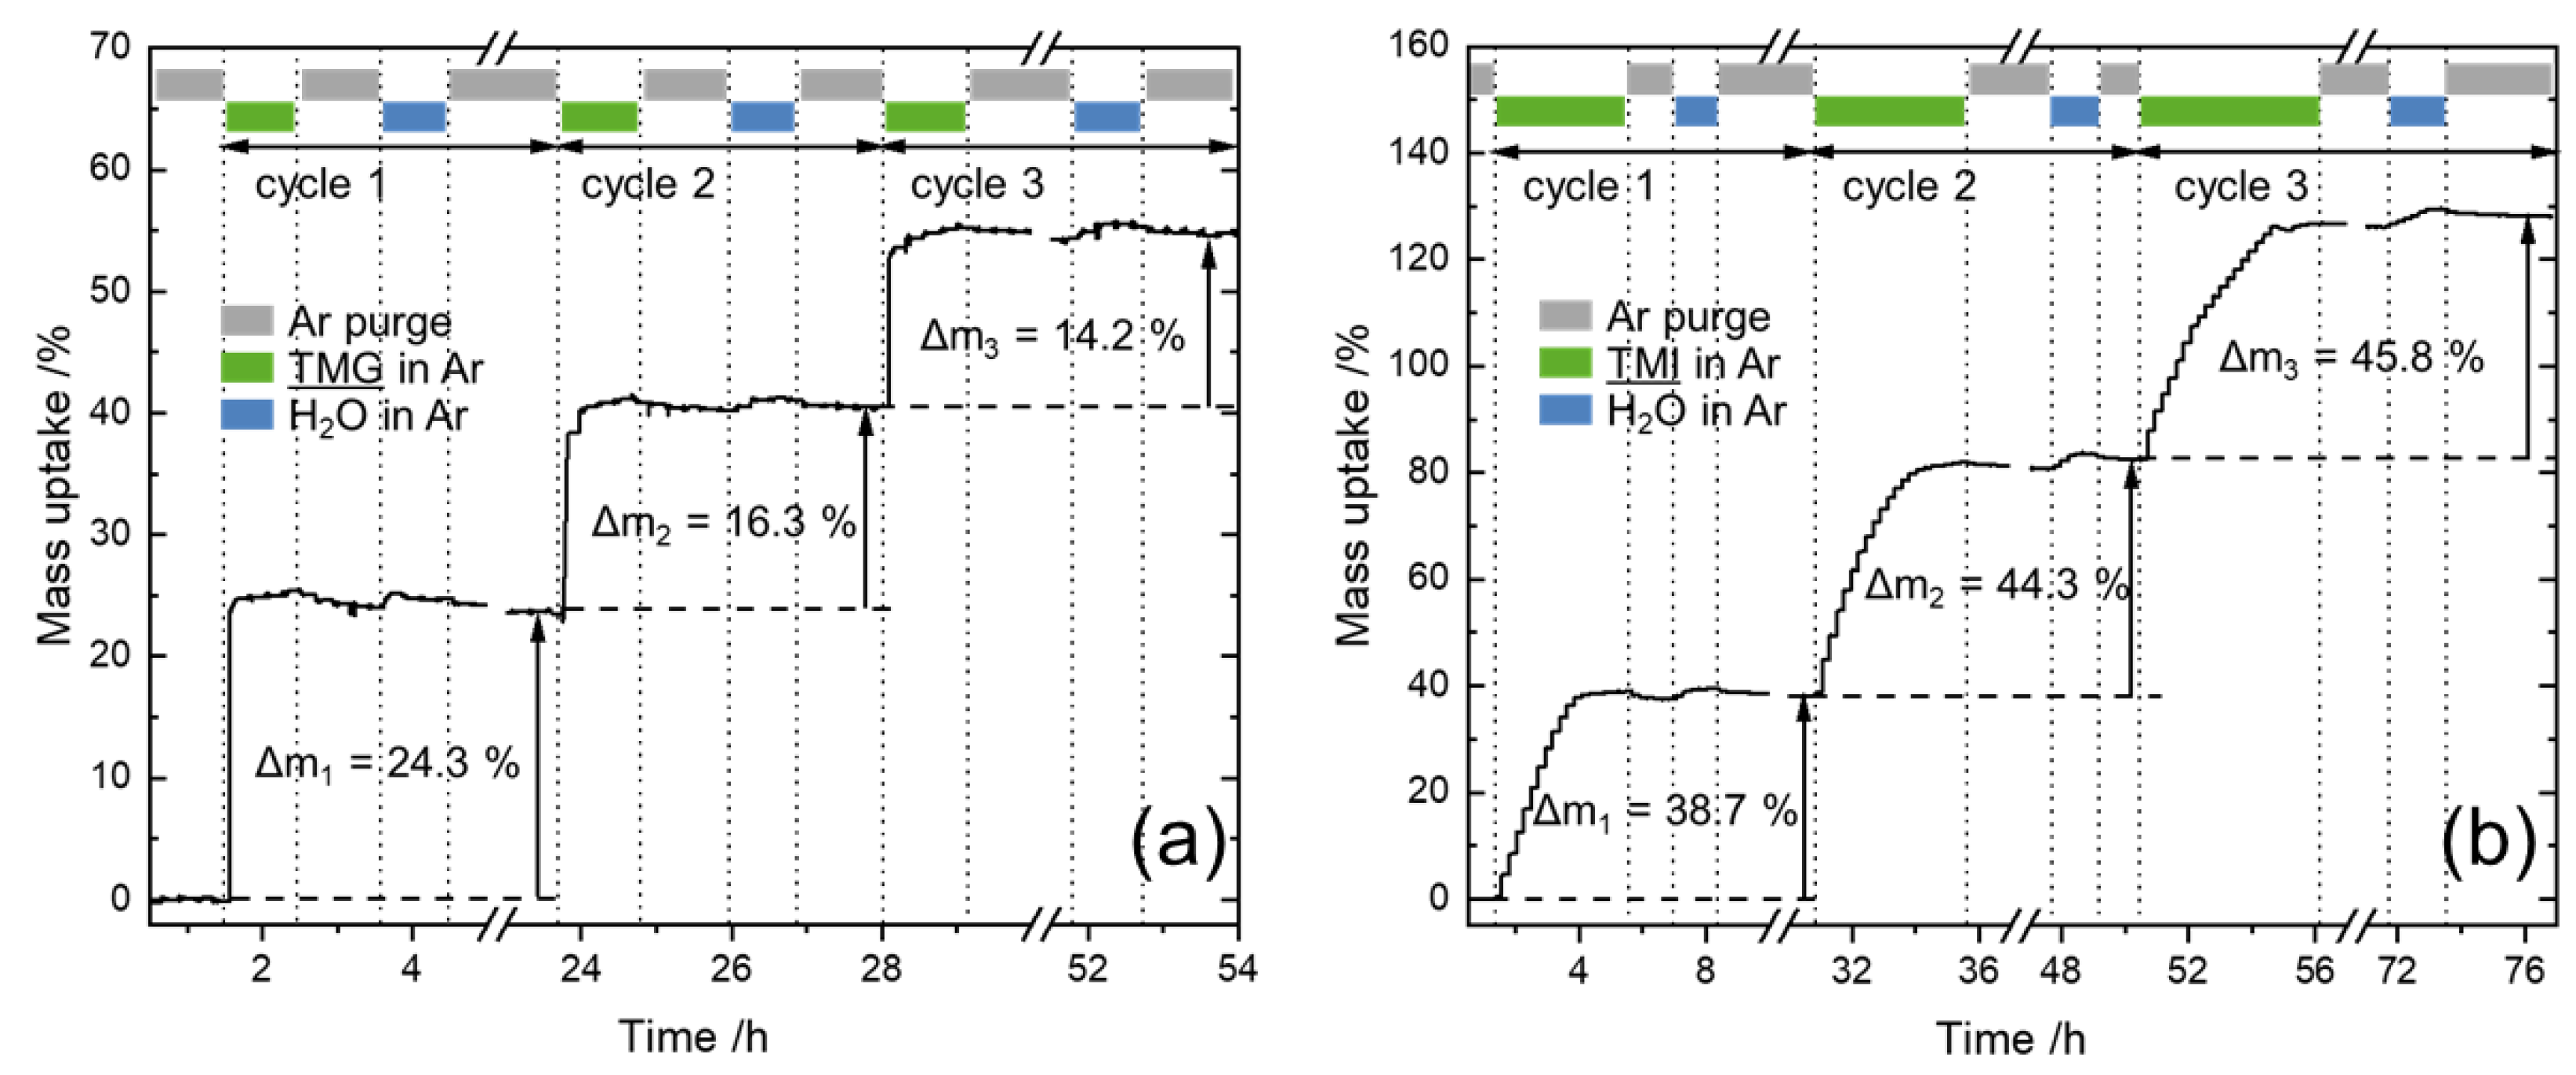
3.1. In-Situ Thermogravimetric Analysis

Deposition of GaOx and InOx was carried out on mesoporous SiO2 using the ALD processes of TMG/H2O and TMI/H2O at 150 °C. The mass change during ALD was monitored using an in-situ magnetic suspension balance (MSB, Figure 1). Both ALD processes showed self-limitation for all first half-cycles when the precursor is dosed as well as during the ligand removal steps in the second half-cycles, representing ALD growth behavior. In the case of GaOx ALD, self-limitation of precursor chemisorption was reached within minutes, as for InOx, the first half-cycles extended over two hours. This can be rationalized by the three times higher vapor pressure of the gallium precursor under our conditions (TMG300K = 327 mbar [72] and TMI353K = 107 mbar [73]). Subsequently, the slight increase in mass during the second half-cycles relates to the exchange of the methyl group (15 g/mol) by the heavier OH-groups (17 g/mol) introduced by water.
In the following, the trend of growth is discussed based on the in-situ mass-uptake, defined as the mass deposited by ALD divided by the initial mass of the support (Table 1). In the first full cycle, the GaOx ALD led to a mass-uptake of 24.3 wt% while the uptake declined within the second and third cycles to 16.3 and 14.2 wt%. This indicates either a substrate enhanced growth or incomplete ligand removal in the second half-cycles, as further discussed in the following section.
Interestingly, Elam et al. observed a declining ALD growth of GaOx due to insufficient removal of methyl ligands using TMG/water above 200 °C [35]. Our in-situ gravimetric studies also indicated lower GaOx uptakes (−33%) after the first ALD cycles. However, the use of H2O as a reactant did not hinder distinct growth during subsequent cycles. Moreover, a fourth cycle was conducted (Figure S1), resulting in uptakes of 13.4 wt% GaOx being of the same order of magnitude as the third cycle (14.2 wt%). Therefore, incomplete ligand removal does not necessarily translate to full inhibition of further growth.
In contrast, the InOx ALD led to a mass-uptake of 38.7 wt% in the first cycle and increased to 44.3 and 45.8 wt% in the following cycles. Increased uptake at higher cycle numbers hints at higher reactivity between the precursor and deposited oxides or a higher abundance of OH-groups compared to SiO2. Elam et al. demonstrated poor nucleation employing TMI/H2O in a quartz crystal microbalance and therefore proposed using O2-plasma [47]. Nevertheless, our study clearly demonstrates the constant growth of InOx on SiO2, indicating the suitability of H2O as a reactant. A similar observation was made by Kim et al. for the deposition of InOx on a SiO2 terminated silicon flat substrate [45].
Under the rough assumption, that the deposited oxides have a stoichiometry of M2O3 (M = Al, Ga or In), the molar uptakes per cycle were calculated based on the thermogravimetric data (Table 1). For each oxide and ALD cycle, the deposited moles of M2O3 per gram SiO2 are around 1 mmol/g. This indicates similar deposition behavior for each oxide and the deposited mass is a function of the molar mass (Table S1 in Supplementary Materials).
Additionally, assuming a stoichiometry of M2O3 (M = Ga or In), the estimated metal contents were 14.5 wt% (Ga) and 23.1 wt% (In) after the first ALD cycle in the magnetic suspension balance (Table 2). The contents determined by ICP-OES were 14.6 wt% (Ga) and 21.1 wt% (In) which points to a stoichiometry of M2O3 for GaOx. Therefore, condensation of Ga(OH)x species might already occur in the first cycle. However, the mass fraction of indium is overestimated for the first cycle, indicating that the actual deposited species has a lower mass fraction of indium than in In2O3.
Considering chemisorbed In(OH)2 instead delivered an estimated indium content of 21.5 wt% which matches the measured content of 21.1 wt% (In). For subsequent cycles, the estimated indium contents have a better fit to ICP-OES when In2O3 is assumed. Hence, chemisorbed In(OH)2 might resist condensation and do not collapse towards oxidic species in the first cycle. In subsequent cycles, the formation of In2O3 is favored during the reaction with TMI and water.

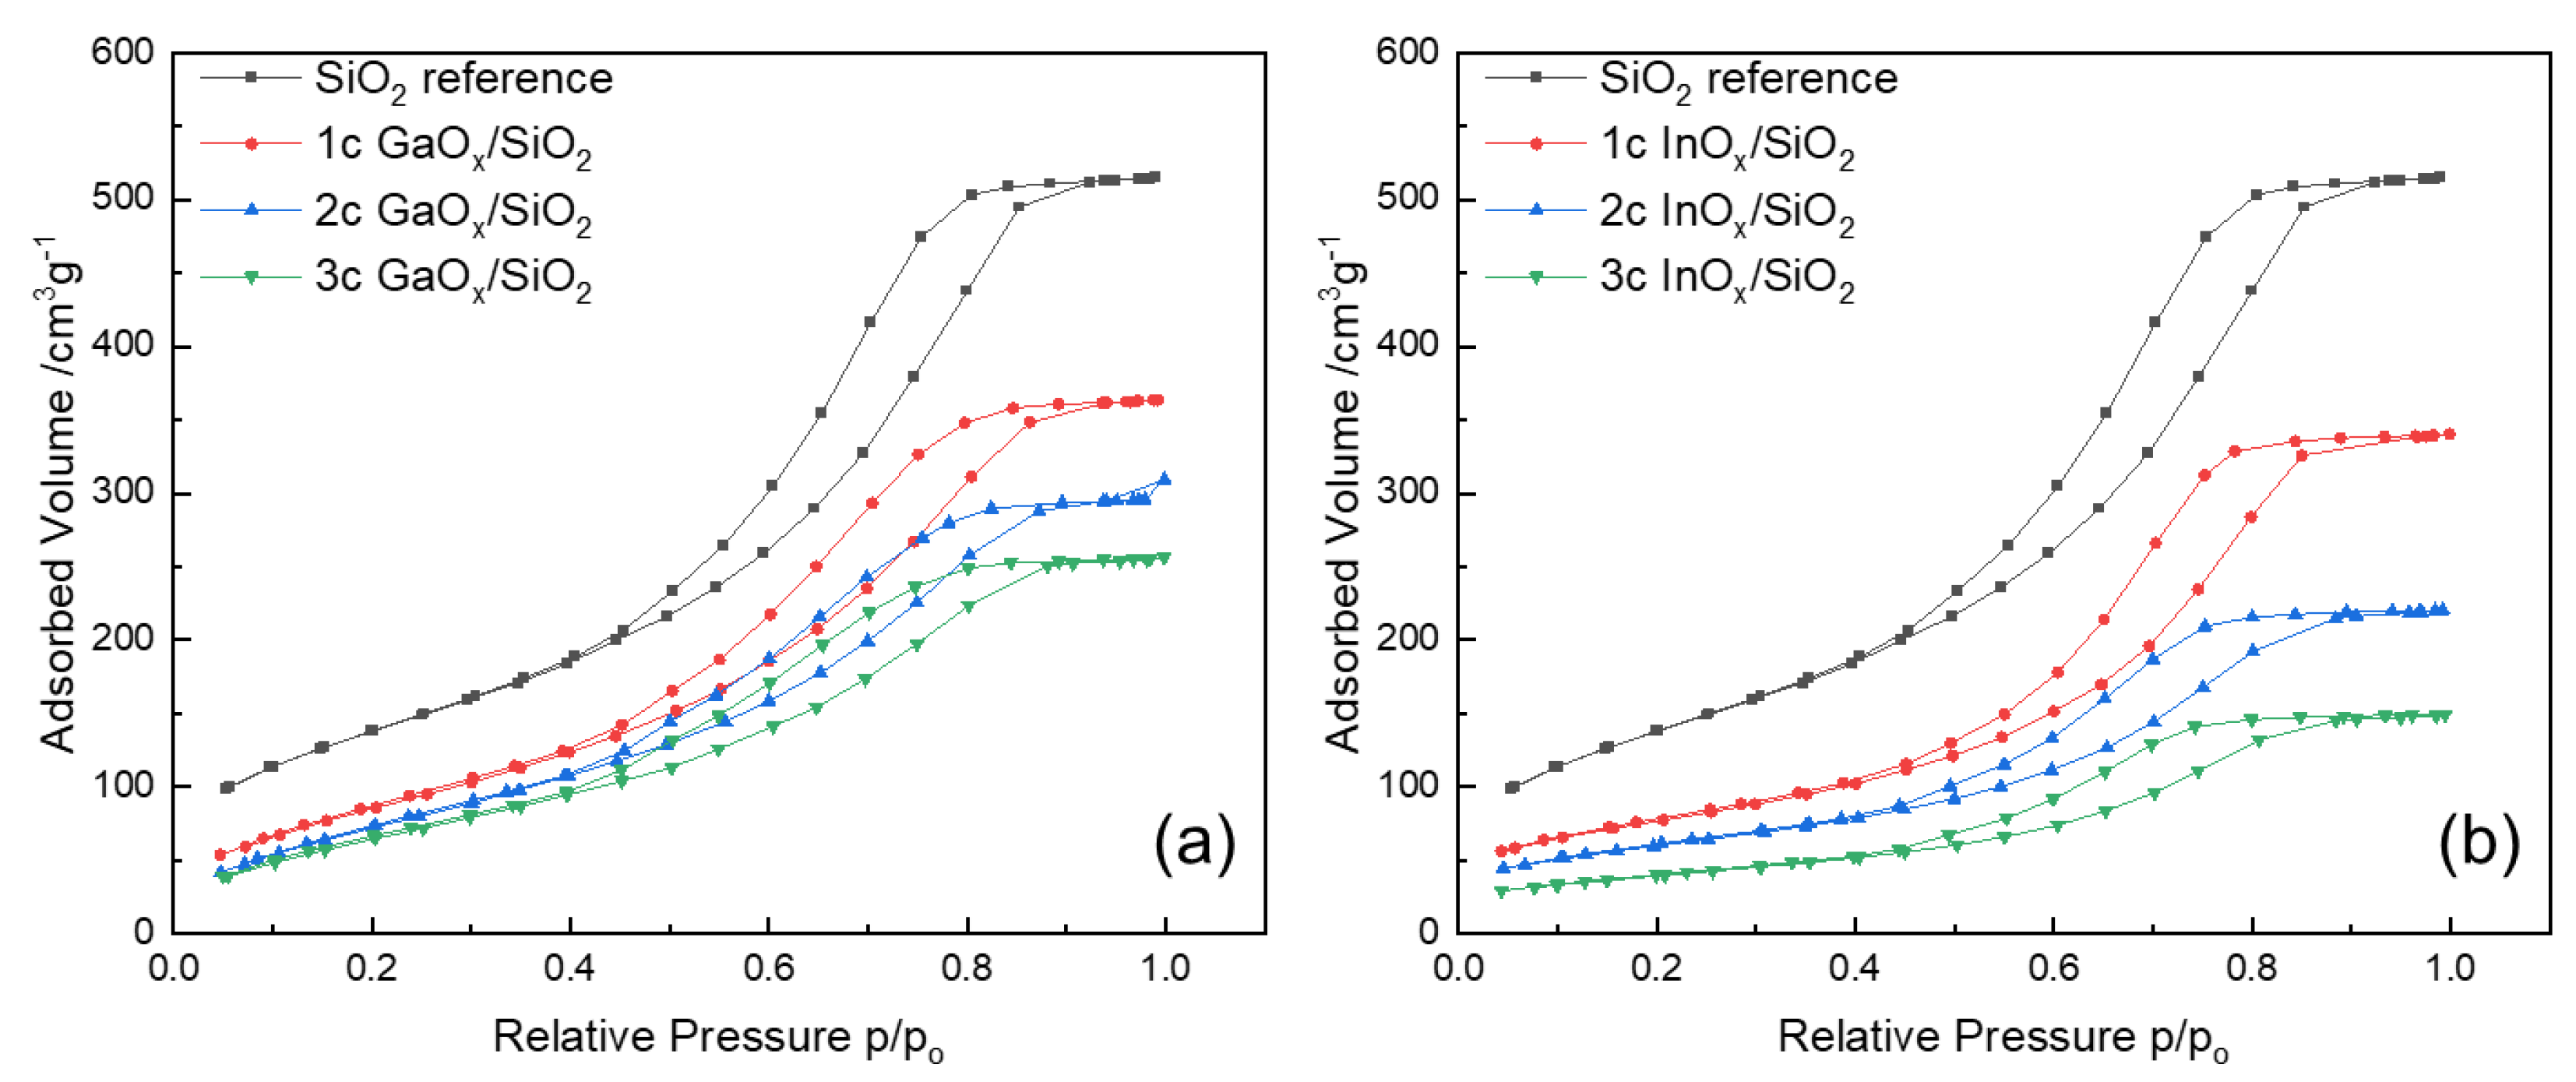
3.2. Effect of ALD on Surface Area and Pore Size

N2 physisorption measurements were conducted to analyze ALD-induced changes to the surface area and pore structure of silica. The resulting isotherms are shown in Figure 2 and the differential pore size distributions are displayed in the supplementary material. All samples led to a type IV(a) isotherm with a mixture of type H1 and H2(b) hysteresis loop, characteristic of capillary condensation in materials with larger mesopores (>4 nm).
The contribution of the H1 mode derives from equilibrium (liquid-vapor) transitions at cylindrical pores, indicated by mostly parallel adsorption and desorption branches. The addition of the H2(b) mode is associated with delayed phase transition at more complex structures, such as ink-bottle-shaped pores with a wide distribution of neck sizes [74,75]. For all samples, the overall shape of the hysteresis is not affected by ALD indicating maintained pore character and conformal coating with GaOx and InOx [76].
The volume of adsorbed N2 decreased as a function of the ALD cycle number which translates to the loss of specific surface area. The related values, calculated from the N2 isotherm using the BET method, are shown in Table 3. A stepwise decrease in specific surface area from 505 to 259 m2/g was observed within three ALD cycles of GaOx. At the same time, the total pore volume was approximately halved from 0.79 to 0.39 cm3/g. Furthermore, the InOx ALD showed an even more pronounced effect as the specific surface area decreased to 142 m2/g and the pore volume to 0.23 cm3/g after three cycles.
However, the drastic decline of the specific surface area can be rationalized by the significant change in density induced by ALD. With a rising mass fraction of the deposited oxide, the sample exhibits less volume and surface area per gram. For instance, a given quantity of silica reaches 1.83 times its initial mass after two cycles of InOx ALD (Table 1). Consequently, the mass-related (specific) surface area would decrease from initially 505 to 276 m2/g, assuming no change in the exposed surface area. The estimated value is in good agreement with the measured value of 216 m2/g. Similar findings were made for the AlOx process on porous silica [68]. In fact, the observed changes are in a reasonable range as demonstrated in detail in the supplementary materials (Tables S2–S4 and Schemes S1–S3).
Additionally, the pore size distributions were calculated using the BJH method based on the rough assumption of having only regular and cylindrical pores (Figures S2 and S3 in Supplementary Materials). In both cases, ALD led to an even shift to smaller pore diameters with increasing cycle numbers. At the same time, the absolute desorption volume decreased, as it is also normalized to the mass of the sample. Both phenomena indicate that the pores of all diameters are decorated and accessible by the precursors. However, the calculated distribution has to be treated with reservation as the silica substrate featured an irregular and unknown system of different pore types [74,75].

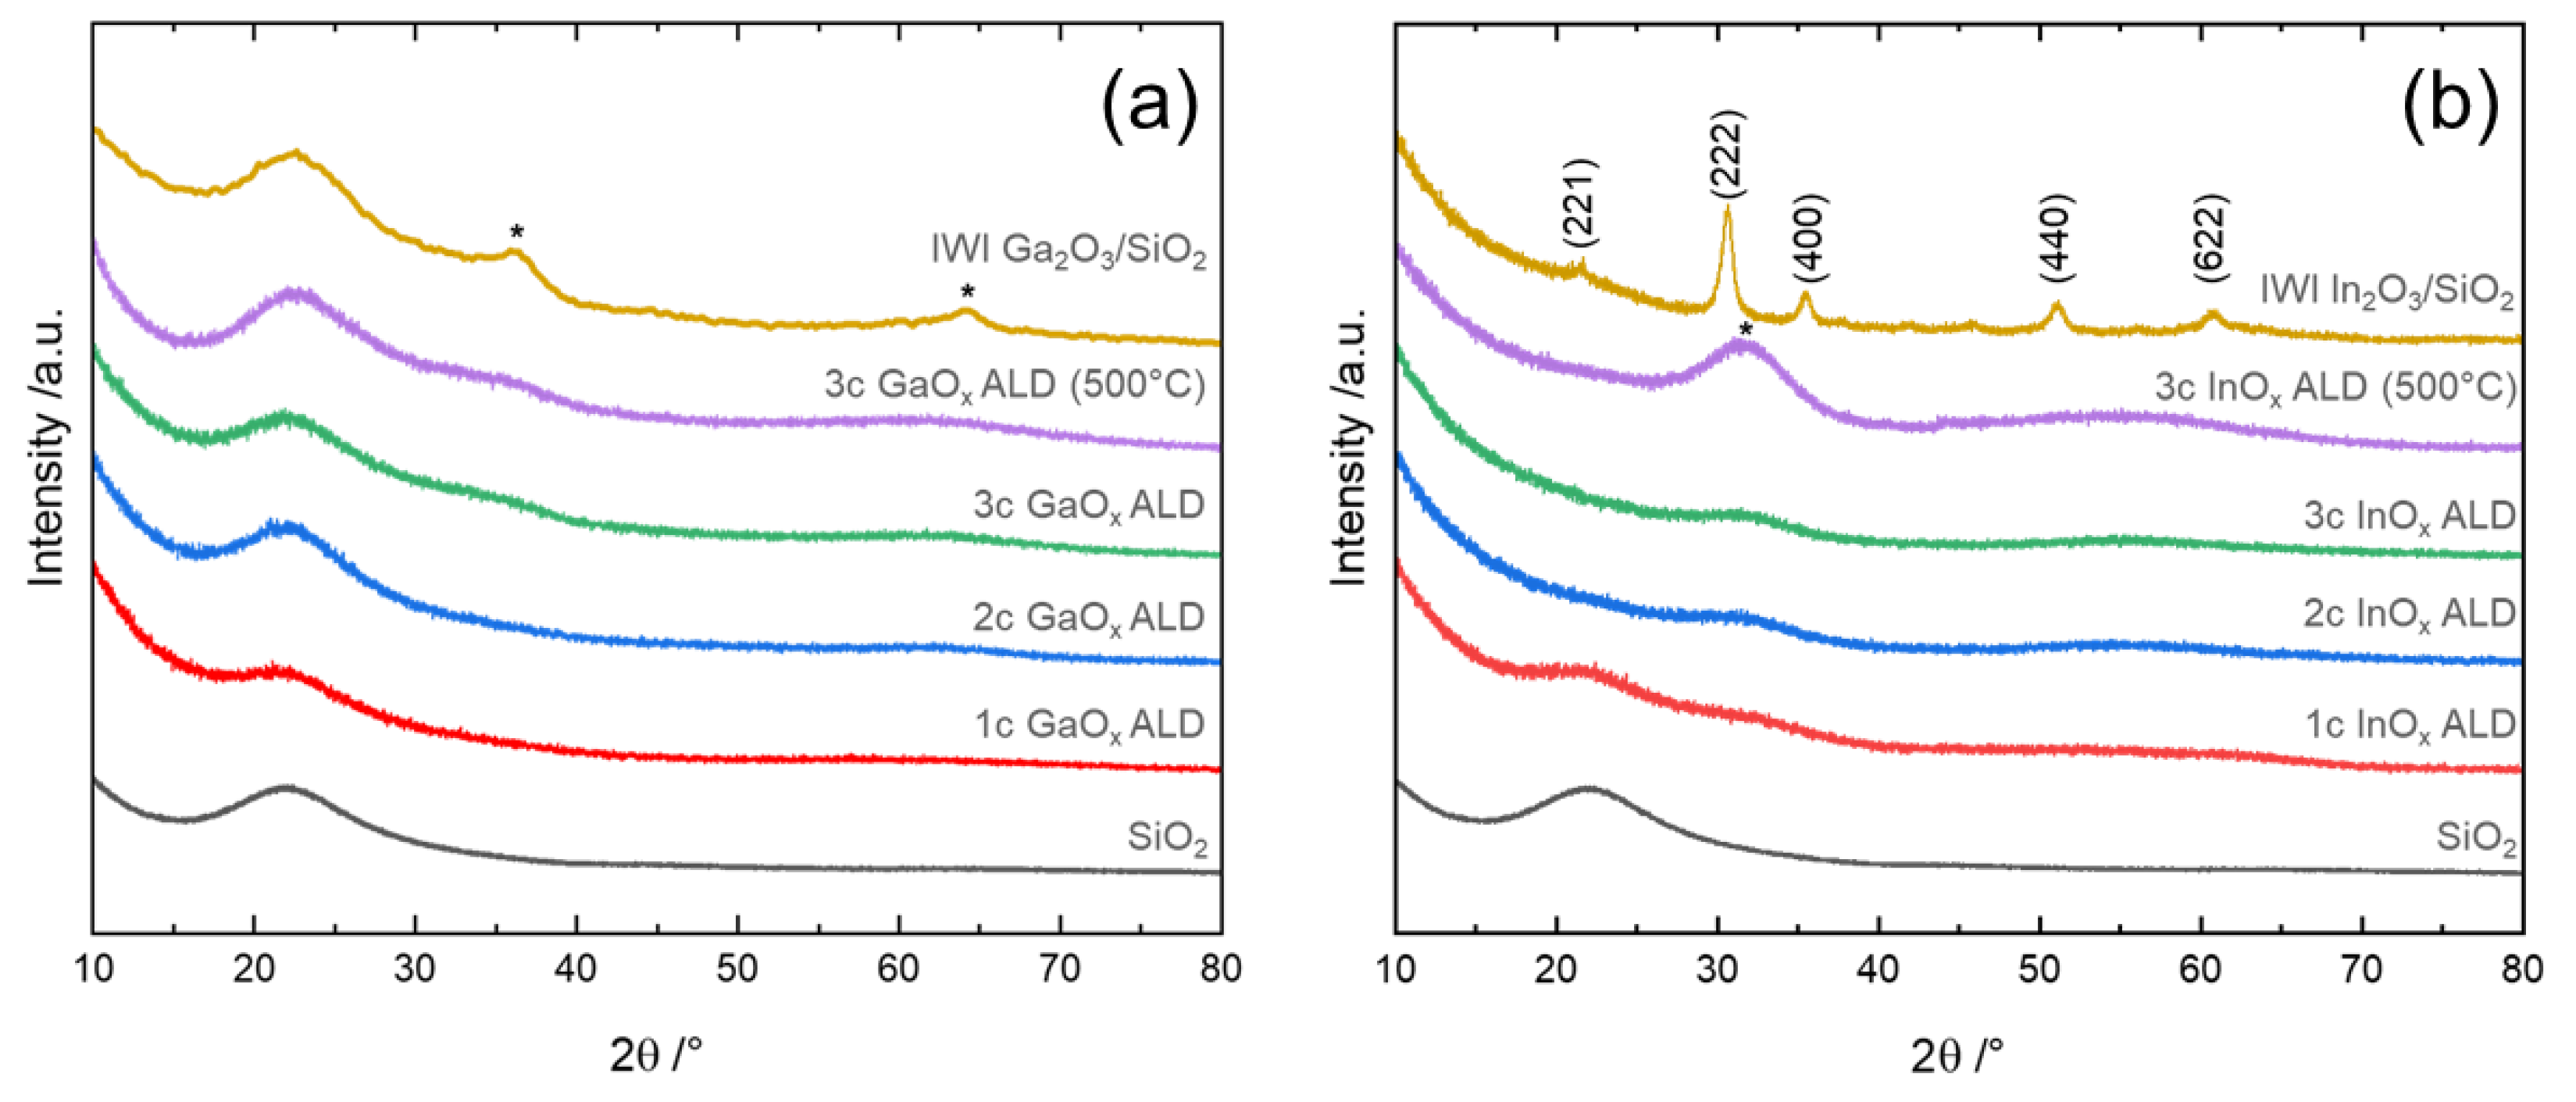
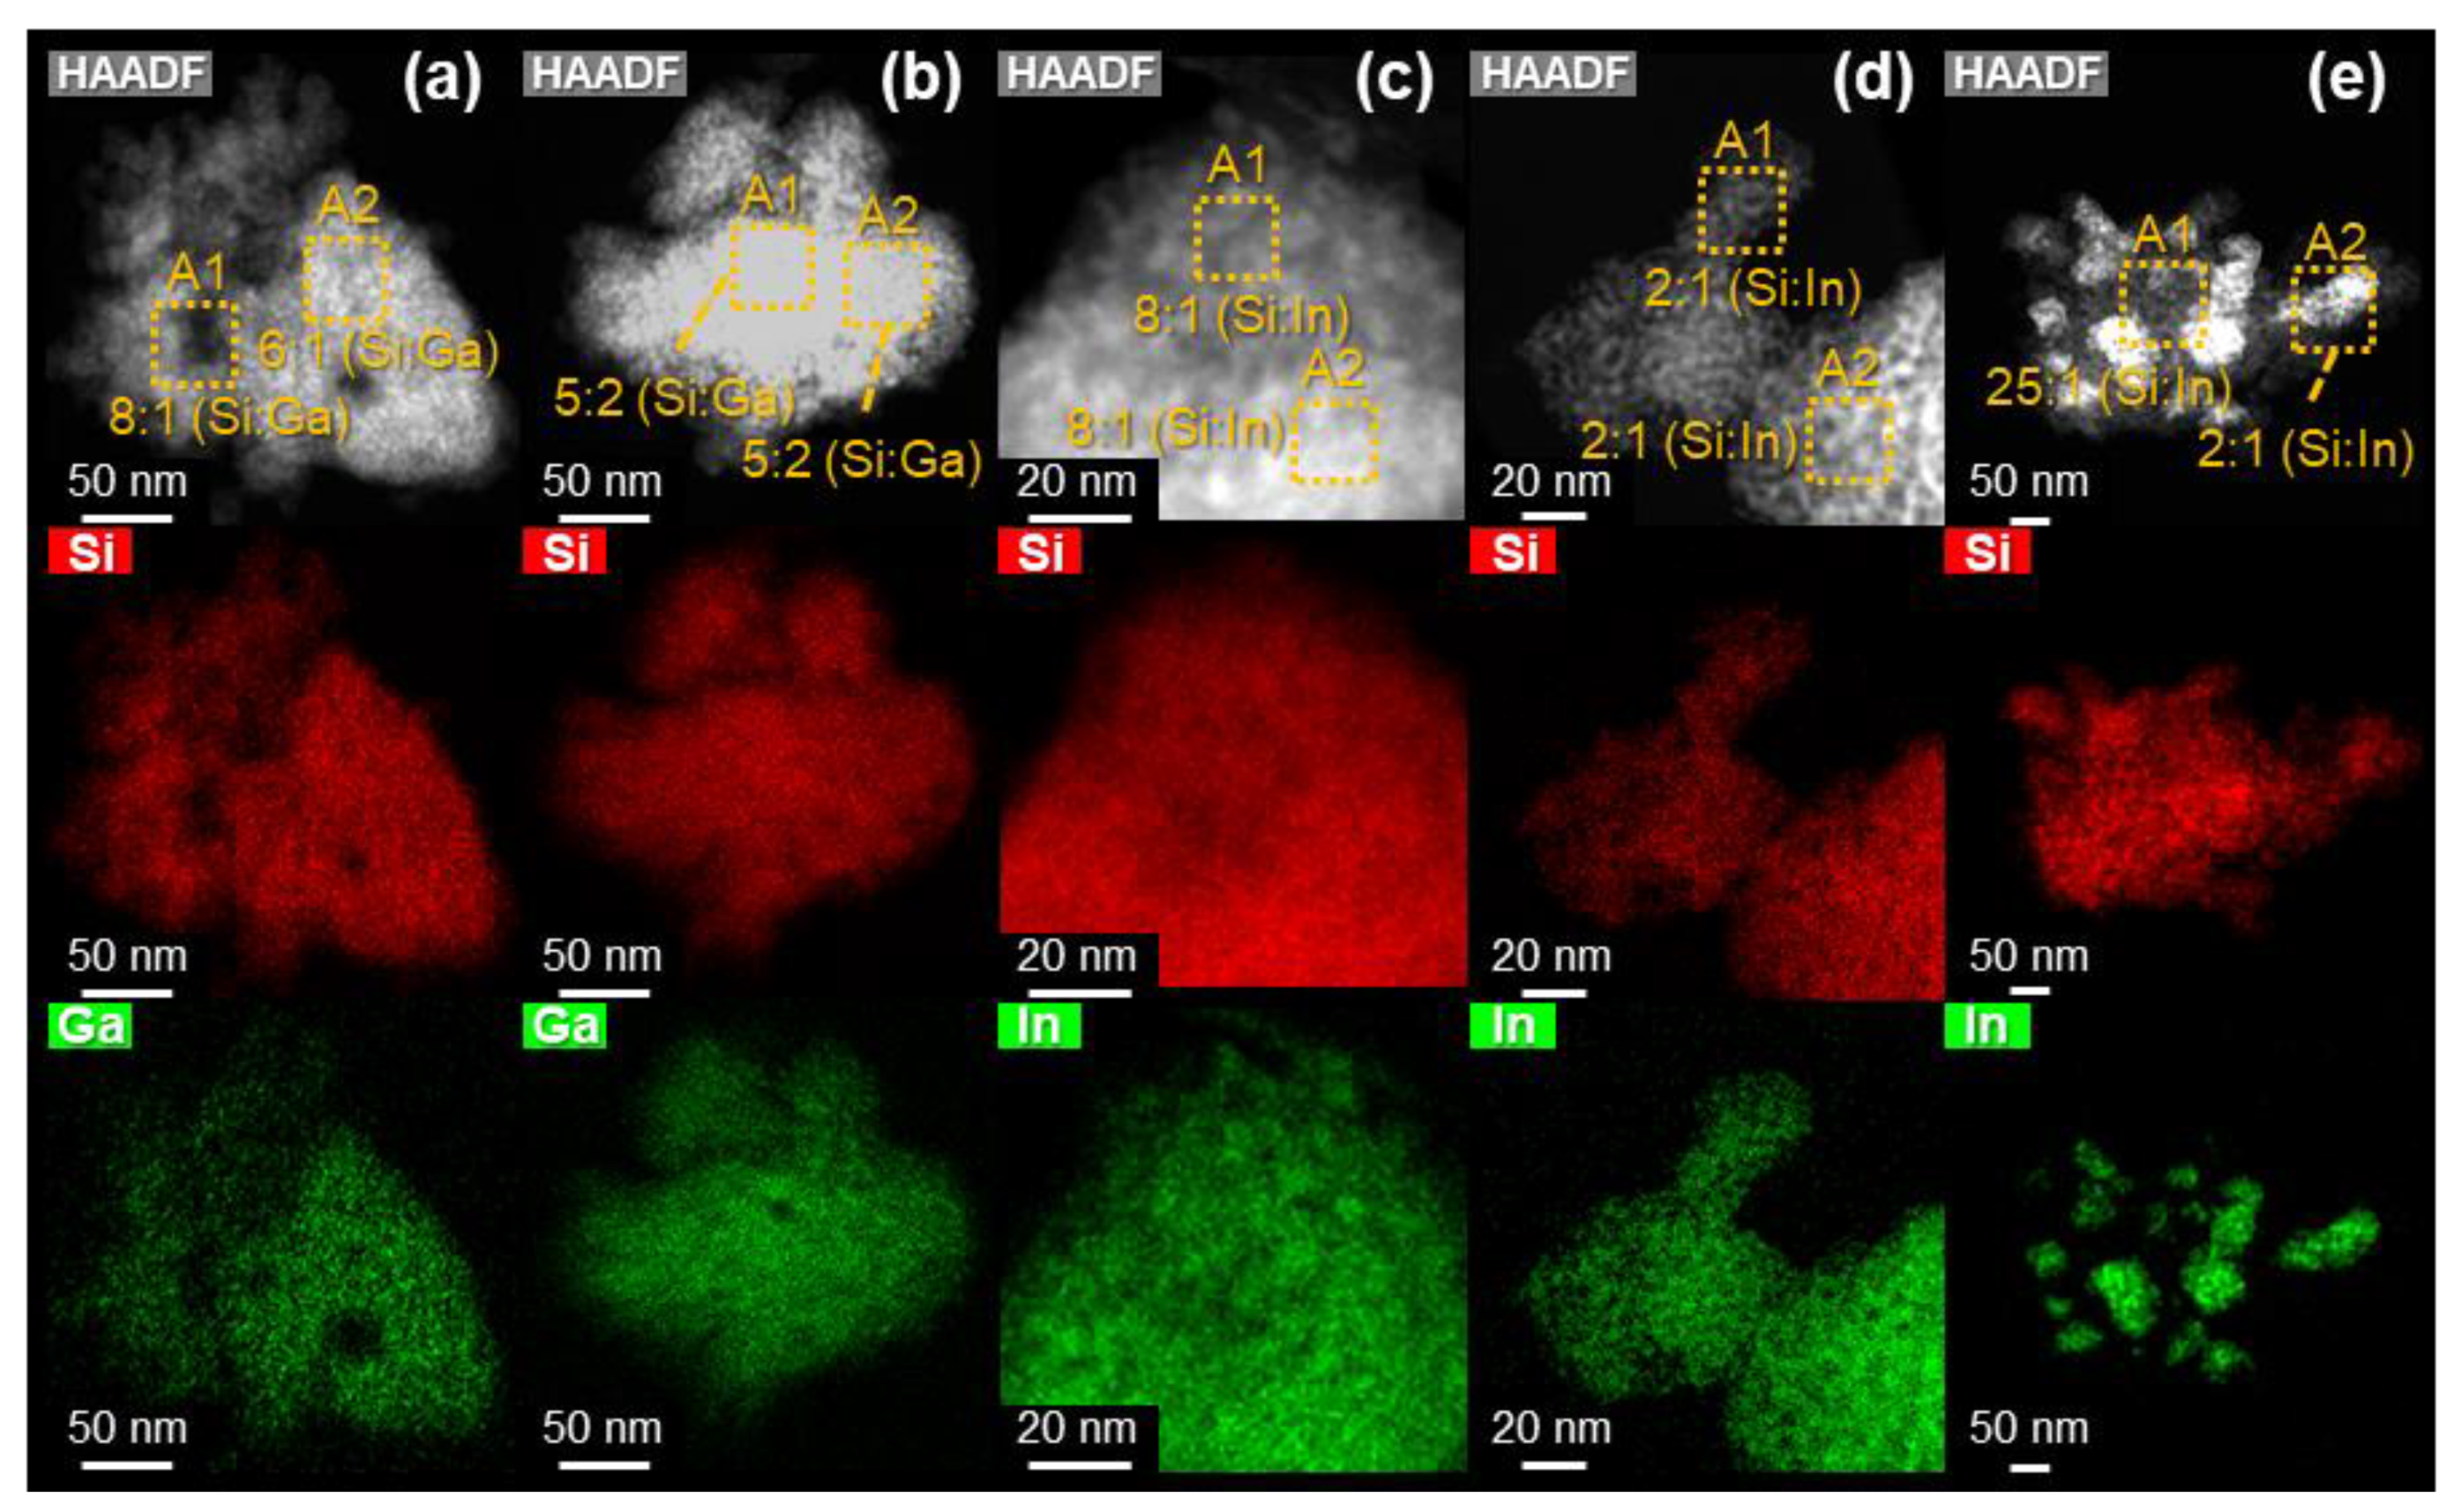
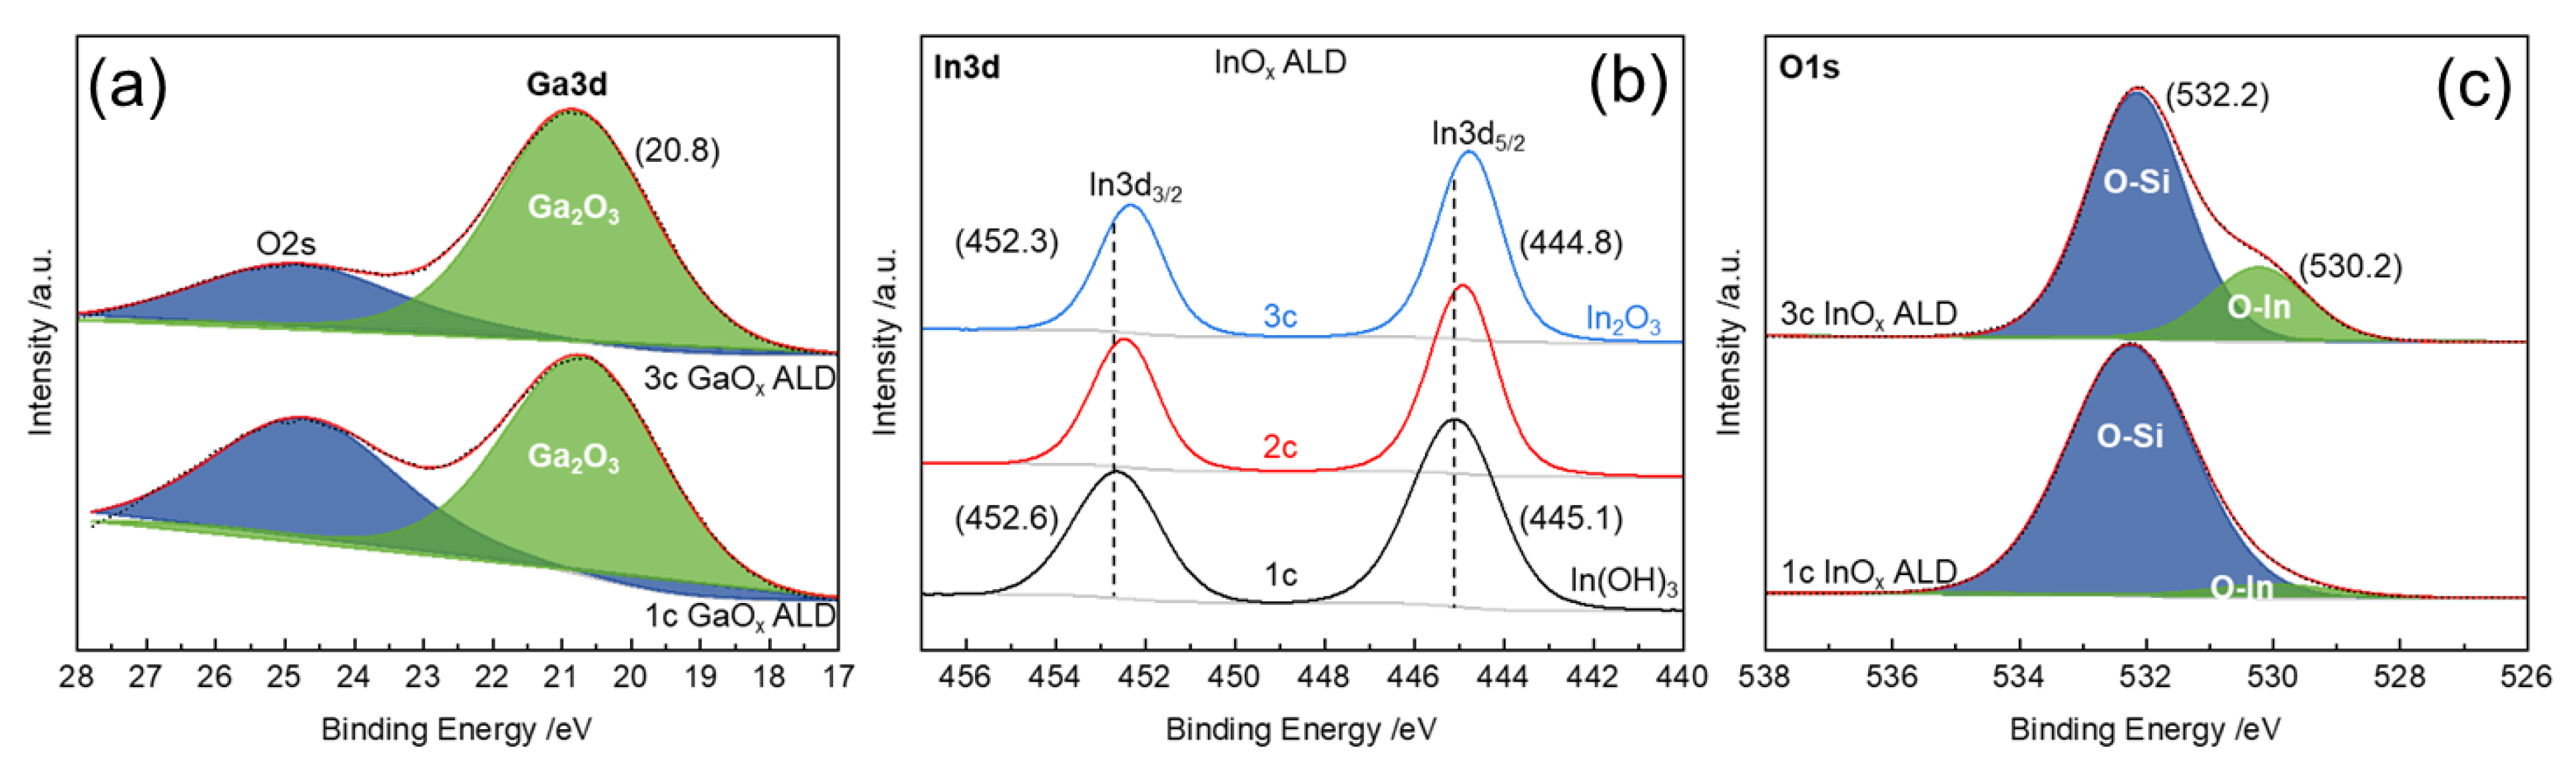
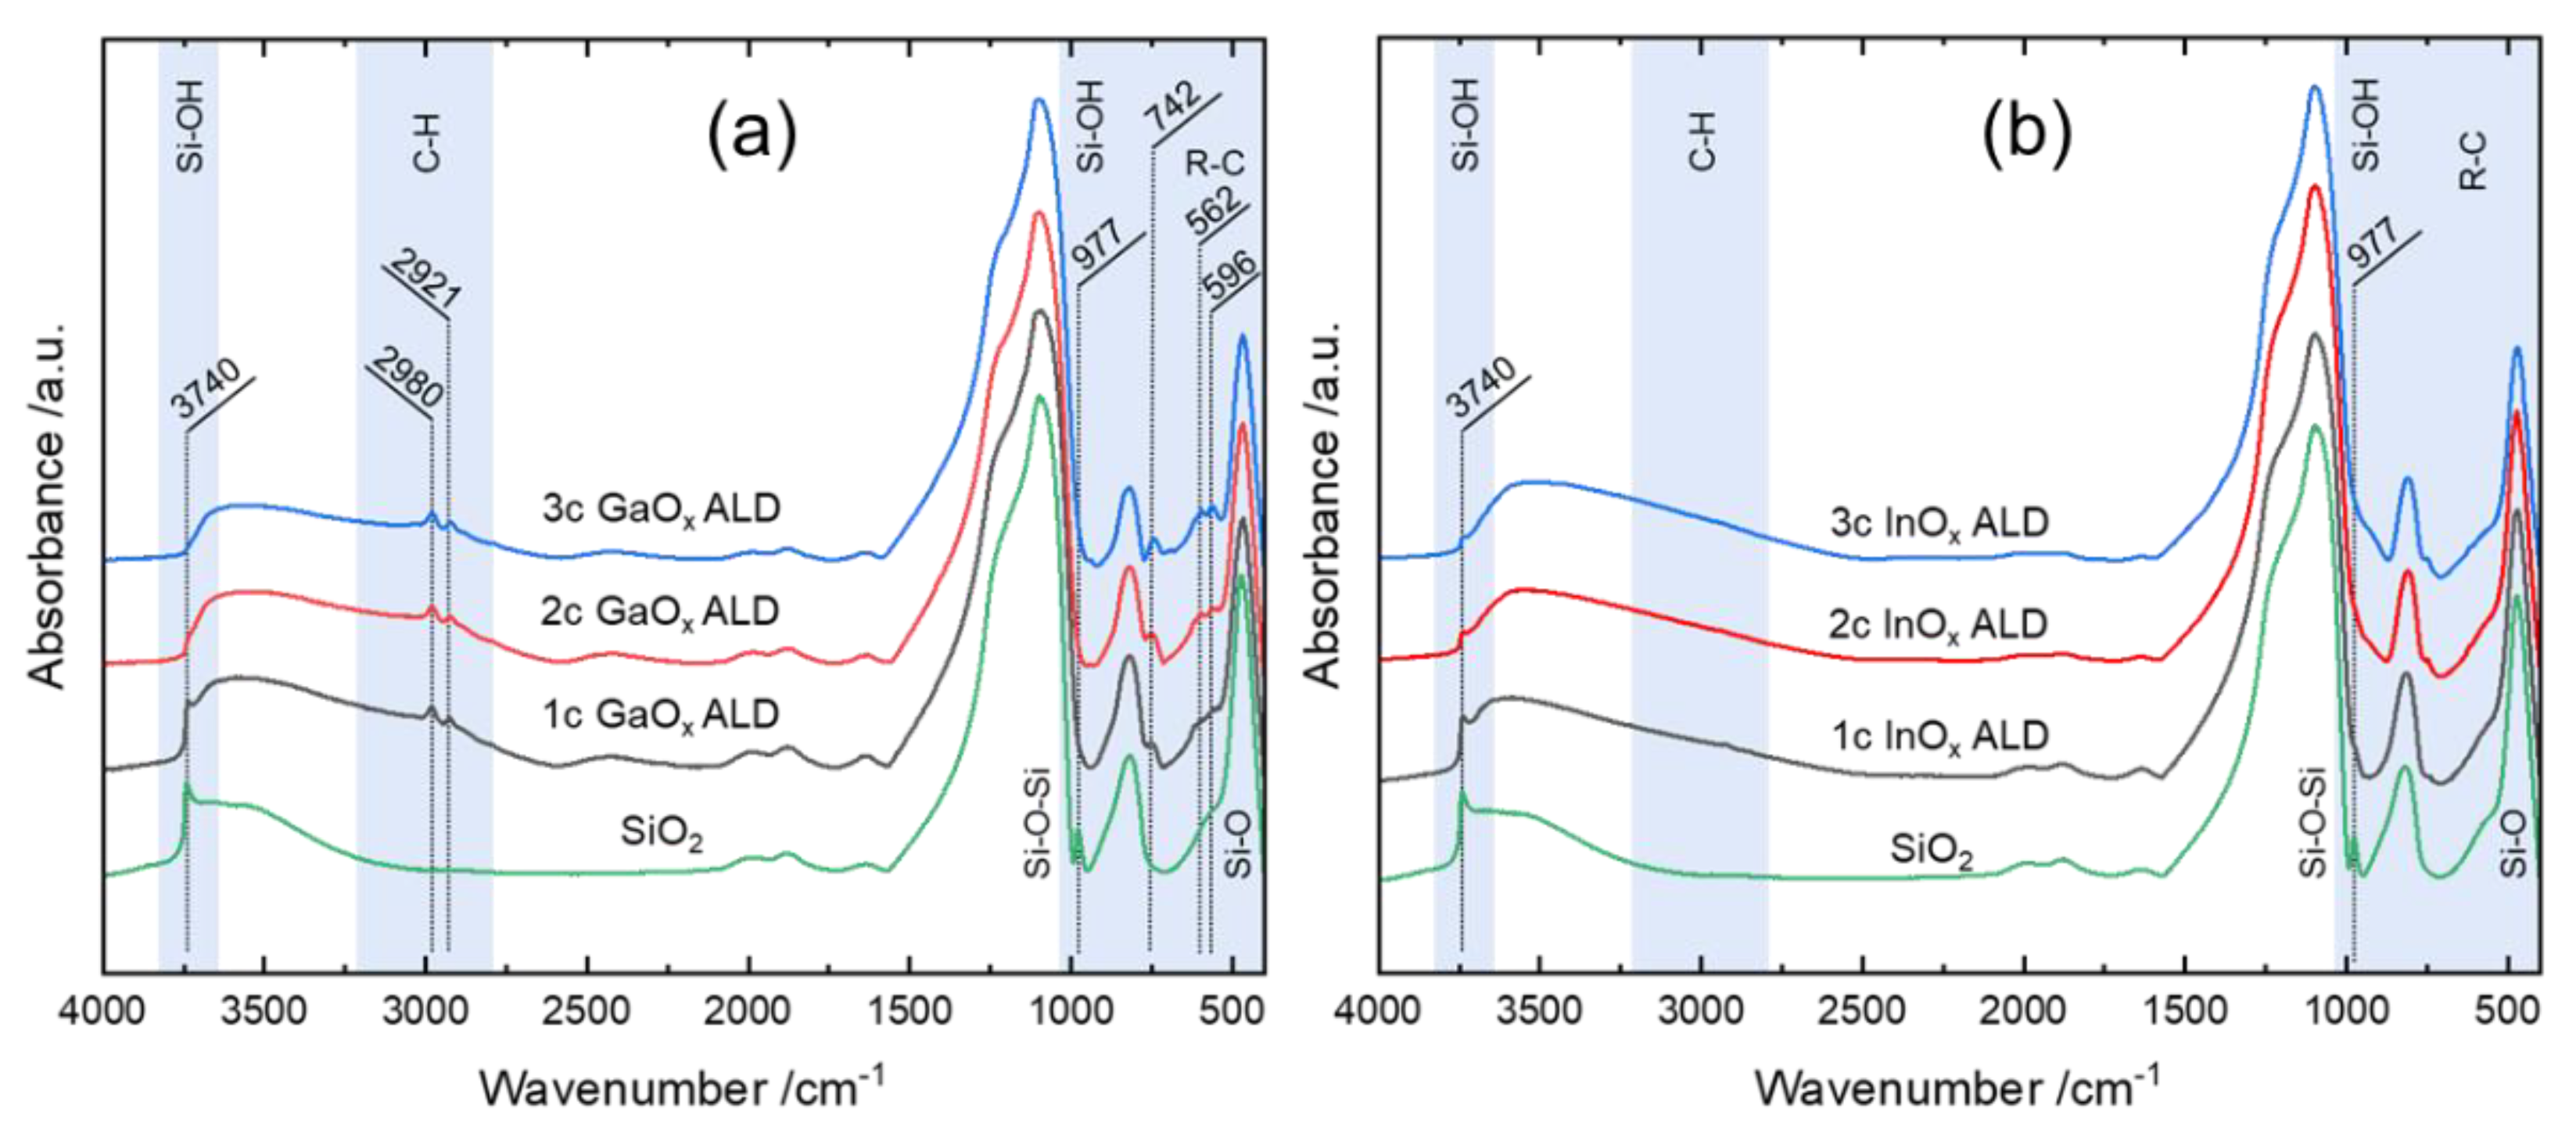
3.3. Investigation of the Formed Phase and Its Dispersion

Powder X-ray diffraction (XRD) was employed to rule out the formation of crystalline agglomerates greater than the typical detection limit of around 2 nm [77,78]. The X-ray diffractograms of the as-deposited GaOx show no crystalline phase after three ALD cycles, thus being XRD amorphous (Figure 3). Moreover, the broad reflection at 21.8° (2θ), which accounts for amorphous SiO2, and the diffractograms provide no defined intensity features.
X-ray amorphous GaOx films were also deposited by Biyikli et al. [36] until 500 cycles of TMG/O2-plasma. In their case, the transition to crystalline Ga2O3 only occurred under annealing in N2. However, calcination of the three-cycle sample at 500 °C (20% O2) did not result in the formation of detectable crystallites. This underlines the stability and dispersion of the layer despite a mass-fraction of 35 wt% GaOx. As a reference, 19 wt% Ga2O3 was supported on silica using the incipient wetness impregnation method with gallium nitrate (Ga2O3/SiO2) (SI). After calcination at 500 °C, the impregnated sample exhibited broad signals characteristic of α- or β-Ga2O3 [79].
In the case of InOx ALD, the x-ray diffractograms exhibited no distinct reflections, being also XRD amorphous (Figure 3). On the contrary, an additional phase centered around 31.6° (2θ) emerged in the diffractogram of the three-cycle sample after calcination. It lies close to the reflection of the (222) plane of cubic In2O3 typically located around 30.6°(2θ) [80]. It might also be an indication for the (200) facet of In(OH)3 lying between 31 and 32° [81]. However, the new phase might still be nanocrystalline and only the starting point for the formation of In(OH)3 or In2O3 crystallites.
These findings agree with the literature, as Elam et al. showed that defined reflections of the (222) plane of In2O3 only appear upon 800 cycles after annealing or at higher deposition temperatures [47]. For comparison, 27 wt% In2O3 was supported on silica via incipient wetness impregnation and calcined at 500 °C (In2O3/SiO2). The impregnated sample showed sharp reflections characteristic of cubic In2O3. Therefore, the impregnated In2O3 was clearly agglomerated and crystallized, while ALD provided a more dispersed InOx species.
STEM and EDX-mapping revealed agglomeration of the impregnated In2O3 sample with particle sizes between 20 and 100 nm (Figure 4). The calculated crystal diameter based on the 35.5° (2θ) reflection was approximately 21 nm, applying the Debye–Scherrer equation (FWHM = 0.82° (2θ)). Consequently, the atomic ratios between Si and In varied significantly between 25:1 and 2:1 within the mapping. EDX-mappings of the ALD samples of InOx and GaOx on SiO2 demonstrate the opposite, without changes in morphology compared to the underlying support material. In the case of GaOx, the atomic ratio of Si and Ga varied between 6:1 to 8:1 in selected areas after one cycle (Figure 4).
Increased loading of the three-cycle sample led to lower Si:Ga ratios (5:2) while being contained over the whole sample which indicates high dispersion. The same was found for the InOx ALD samples while the In:Si ratios were 8:1 in the one cycle and 2:1 in the three-cycle sample.
X-ray photoelectron spectroscopy (XPS) was conducted to determine the oxidic species of as-deposited InOx and GaOx on SiO2. The photoemission spectra of the Ga3d region showed two overlapping peaks (Figure 5a). One can be assigned to Ga, bound with oxygen as in Ga2O3, located at 20.8 eV. The second derives from the O2s orbital, around 24.8 eV [82,83]. With increasing GaOx cycle number, the intensity of the Ga2O3-related peak (Ga3d) increases in relation to the O2s peak. Decreasing contribution of the O2s signal might be the result of the increased degree of coverage of substrate oxygen (SiO2) by gallium oxide species. An alteration of hydroxylated Ga content was not observed (typ. around 19.6 eV) [84].
The peaks associated with the electron binding energies (BE) of the spin-orbit-coupled In3d orbitals (J = 3/2 and 5/2) are shifted to the lower BE with increasing cycle number (Figure 5b). After one ALD cycle of InOx, the In3d5/2 signal appeared at BE of 445.1 eV which can be assigned to In(OH)3 (445.2 eV [85]). After two cycles, the peak was located at 444.9 eV and after three cycles at 444.8 eV, while the latter is matching the binding energy as in In2O3 (444.7 eV [85]). Therefore, the deposited InOx species might transition from In(OH)x to In2O3 species with increasing cycle number. Additionally, increasing content of In2O3 could be observed within the O1s region (Figure 5c). The related signal was fitted into two peaks at about 532.2 eV and 530.2 eV after the third cycle. The former can be assigned to the oxygen of silica (O-Si) [86] and the second corresponds to oxygen as in In2O3 (O-In) [81,87,88]. Thereby, the ratio between Si and In2O3-related oxygen increased from 20:1 after the first cycle to 3:1 after the third cycle (see also Table S5 in Supplementary Materials).

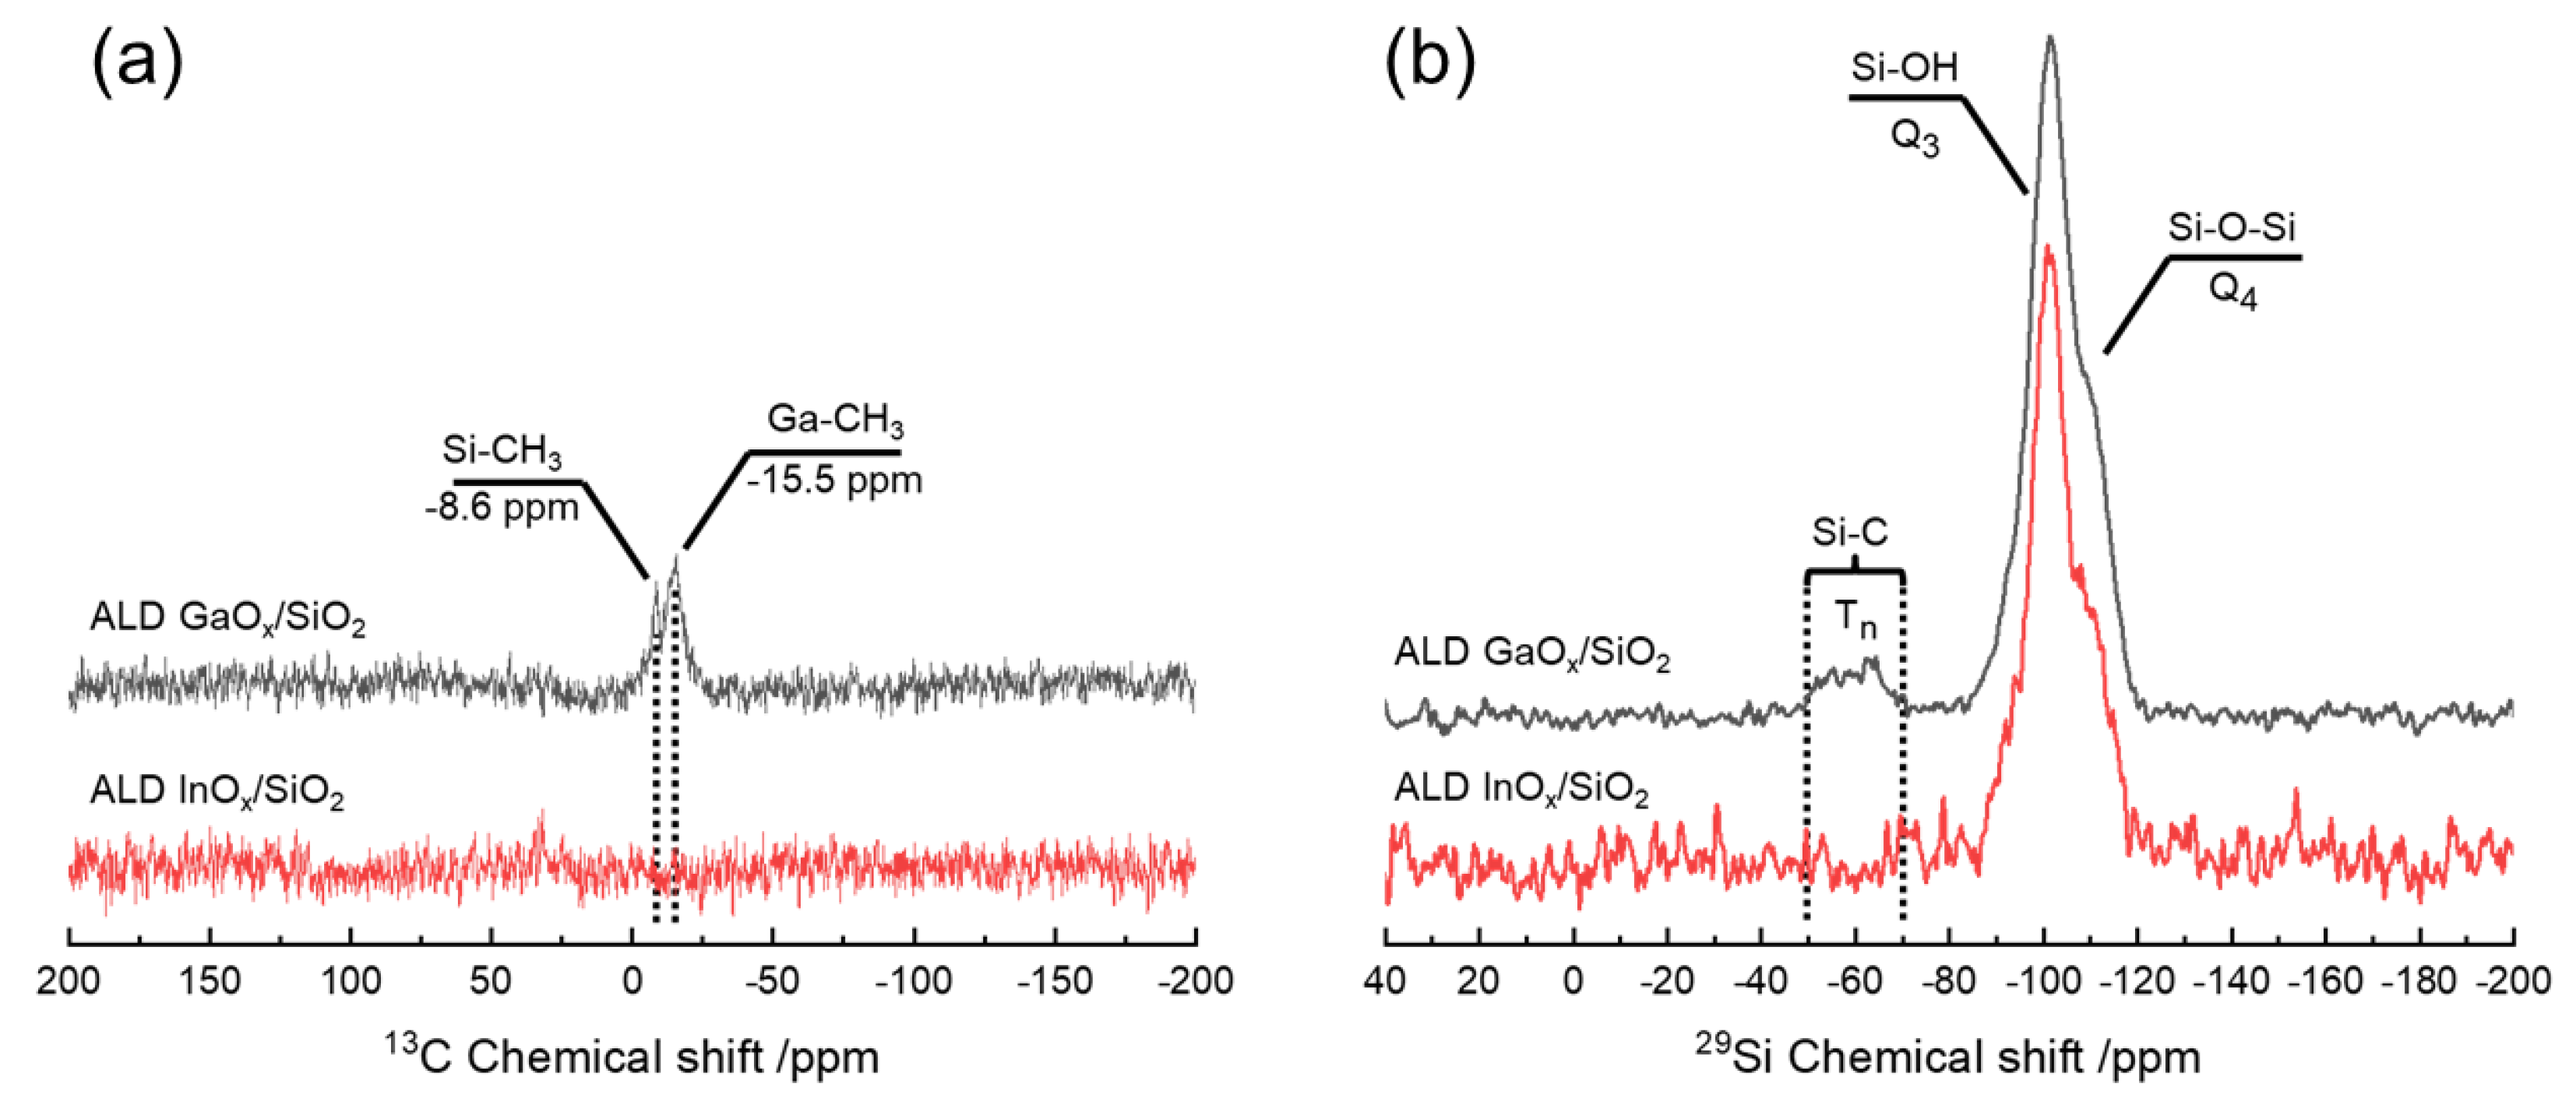
3.4. Determination of Ligand Implementation

The InOx ALD process led to negligible carbon contamination. CHN analysis revealed carbon contents of 0.08, 0.16, and 0.14 wt% after the first, second, and third ALD cycles. The number of moles of deposited indium equating with the moles of incorporated precursors can be determined from the indium content. The ratio between moles of methyl groups of used precursor and moles of carbon provides information about the number of methyl groups still being attached after the dosing of water. As a result, approximately 1 out of 105 methyl groups of the deposited precursor remained, on average, after each cycle.
Ultimately, the question arises where the carbon species is deposited and of which nature it is. In addition to the typical absorption bands of SiO2, the FTIR spectra of InOx/SiO2 showed no features in the C-H stretching regions (Figure 6). The silanol band around 3740 cm−1 and 977 cm−1 decreased in intensity with higher cycle numbers as TMI chemisorbed on Si-OH. Still, the silanol-related bands persisted as weak shoulders after the third cycle. This indicates unreacted Si-OH groups that might be sterically blocked or in the bulk. For further evaluation of carbon species solid-state (SS), NMR analysis is necessary. Yet, the amount of carbon was not sufficient to induce changes in the silicon environment visible in the Tn zone (−50 to 80 ppm) of the 29Si SS-NMR spectrum or signals in the 13C SS-NMR spectra (Figure 7).
Conversely, the GaOx ALD process provided carbon contents of 1.84 (1c), 2.56 (2c), and 2.70 wt% (3c) measured via CHN analysis. The amount of carbon after the first cycle was therefore in the same order of magnitude as for our AlOx/SiO2 process (1.52, 1.59, and 1.33 wt% C [68]). Since the carbon content did not further increase after the second cycle of AlOx, the favored methylation of underlying SiO2 might be the reason for carbon contamination. Conducting the same calculation as for InOx suggests that 1 out of 8 methyl groups persist during the re-hydroxylation of the first cycle and 1 out of 19 persist within three cycles of AlOx. In the case of GaOx, the carbon content increased further for subsequent cycles indicating different carbon deposition behavior. Hereby, one out of five methyl groups remained on the substrate after the first cycle and one out of six within three cycles. A constant proportion of un-removed carbon in each cycle hints at methylated gallium as the contact of TMG to underlying silica becomes less likely with a higher cycle number.
The FTIR spectra of GaOx/SiO2 (Figure 6) held two sharp absorption bands in the C–H stretching region at 2980 and 2921 cm−1 which can be attributed to [νasC-H] and [νsC-H] of methyl species [89,90,91]. Hereby, Si-CH3 is formed through the dissociative chemisorption of TMG on Si-O-Si, and methoxy species were not found [92,93]. The band at 2980 cm−1 is essentially shifted to a higher wavenumber and therefore attributed to methylated gallium as reported by Ring et al. [93]. Additionally, new features emerge in the fingerprint region at 742, 596, and 562 cm−1. The band at 742 cm−1 is assigned to the CH3 rocking mode, while 596 and 562 cm−1 are related to [νasGa-C2] and [νsGa-C2]. This underlines the formation of resilient, di-methylated gallium [81]. These findings are in line with the results of Elam et al. as they also detected CH3 species via FTIR which were not fully removed upon exposure to water [35]. At the same time, the bands corresponding to silanol at around 3740 and 977 cm−1 disappeared after the third cycle, indicating nearly full coverage of Si–OH between the second and third cycles.
In the present case, methylation was also observed in the 13C SS-NMR spectra as broad signals with maxima positioned around −8.6 and −15.5 ppm chemical shift (Figure 7). The peak closest to 0 ppm can be assigned to mono-methylated silicon (O3–Si–CH3) and the signal more up-field might derive from methylated gallium (O-Ga-CH3 or O-Ga-(CH3)2) [94,95]. The formation of methoxy species or longer alkyl chains can be ruled out as they typically appear down-field at around 50 or 22 ppm [89,96,97]. Methylation of gallium indeed explains inhibition of uptake as full recreation of hydroxyl termination is impossible. Nevertheless, OH-groups and bridging oxygens were sufficiently available on the outer layer of GaOx which resulted in distinct growth in all cycles.
The presence of alkyl species in the vicinity of Si was also observed in the 29Si SS-NMR spectrum of GaOx/SiO2 (Figure 7). The broad signal reaching from −50 to −70 ppm agrees with the classic Tn zone of alkylated SiO2 [98]. Within the Tn zone, the maxima found between −55 and −59 ppm can be assigned to T2 (HO-Si-CH3) being attached to two bridging oxygen of the silica bulk. The maxima in the T3 region, located between −62 and −65 ppm, are related to Si-CH3 being connected to three bridging oxygen [94,99,100,101].
This essentially proves the methylation of silicon during the GaOx ALD process. Methylation of silicon mostly originates from the dissociation of precursors on oxygen-bridged silicon. Therefore, the TMG precursor might favor the dissociation reaction more than TMI. Finally, the distorted peak positioned between −85 and −120 ppm is clearly assignable to silanol groups and bridged silicon of Q3+4 (O3-Si-OH, O4-Si) [100,102].

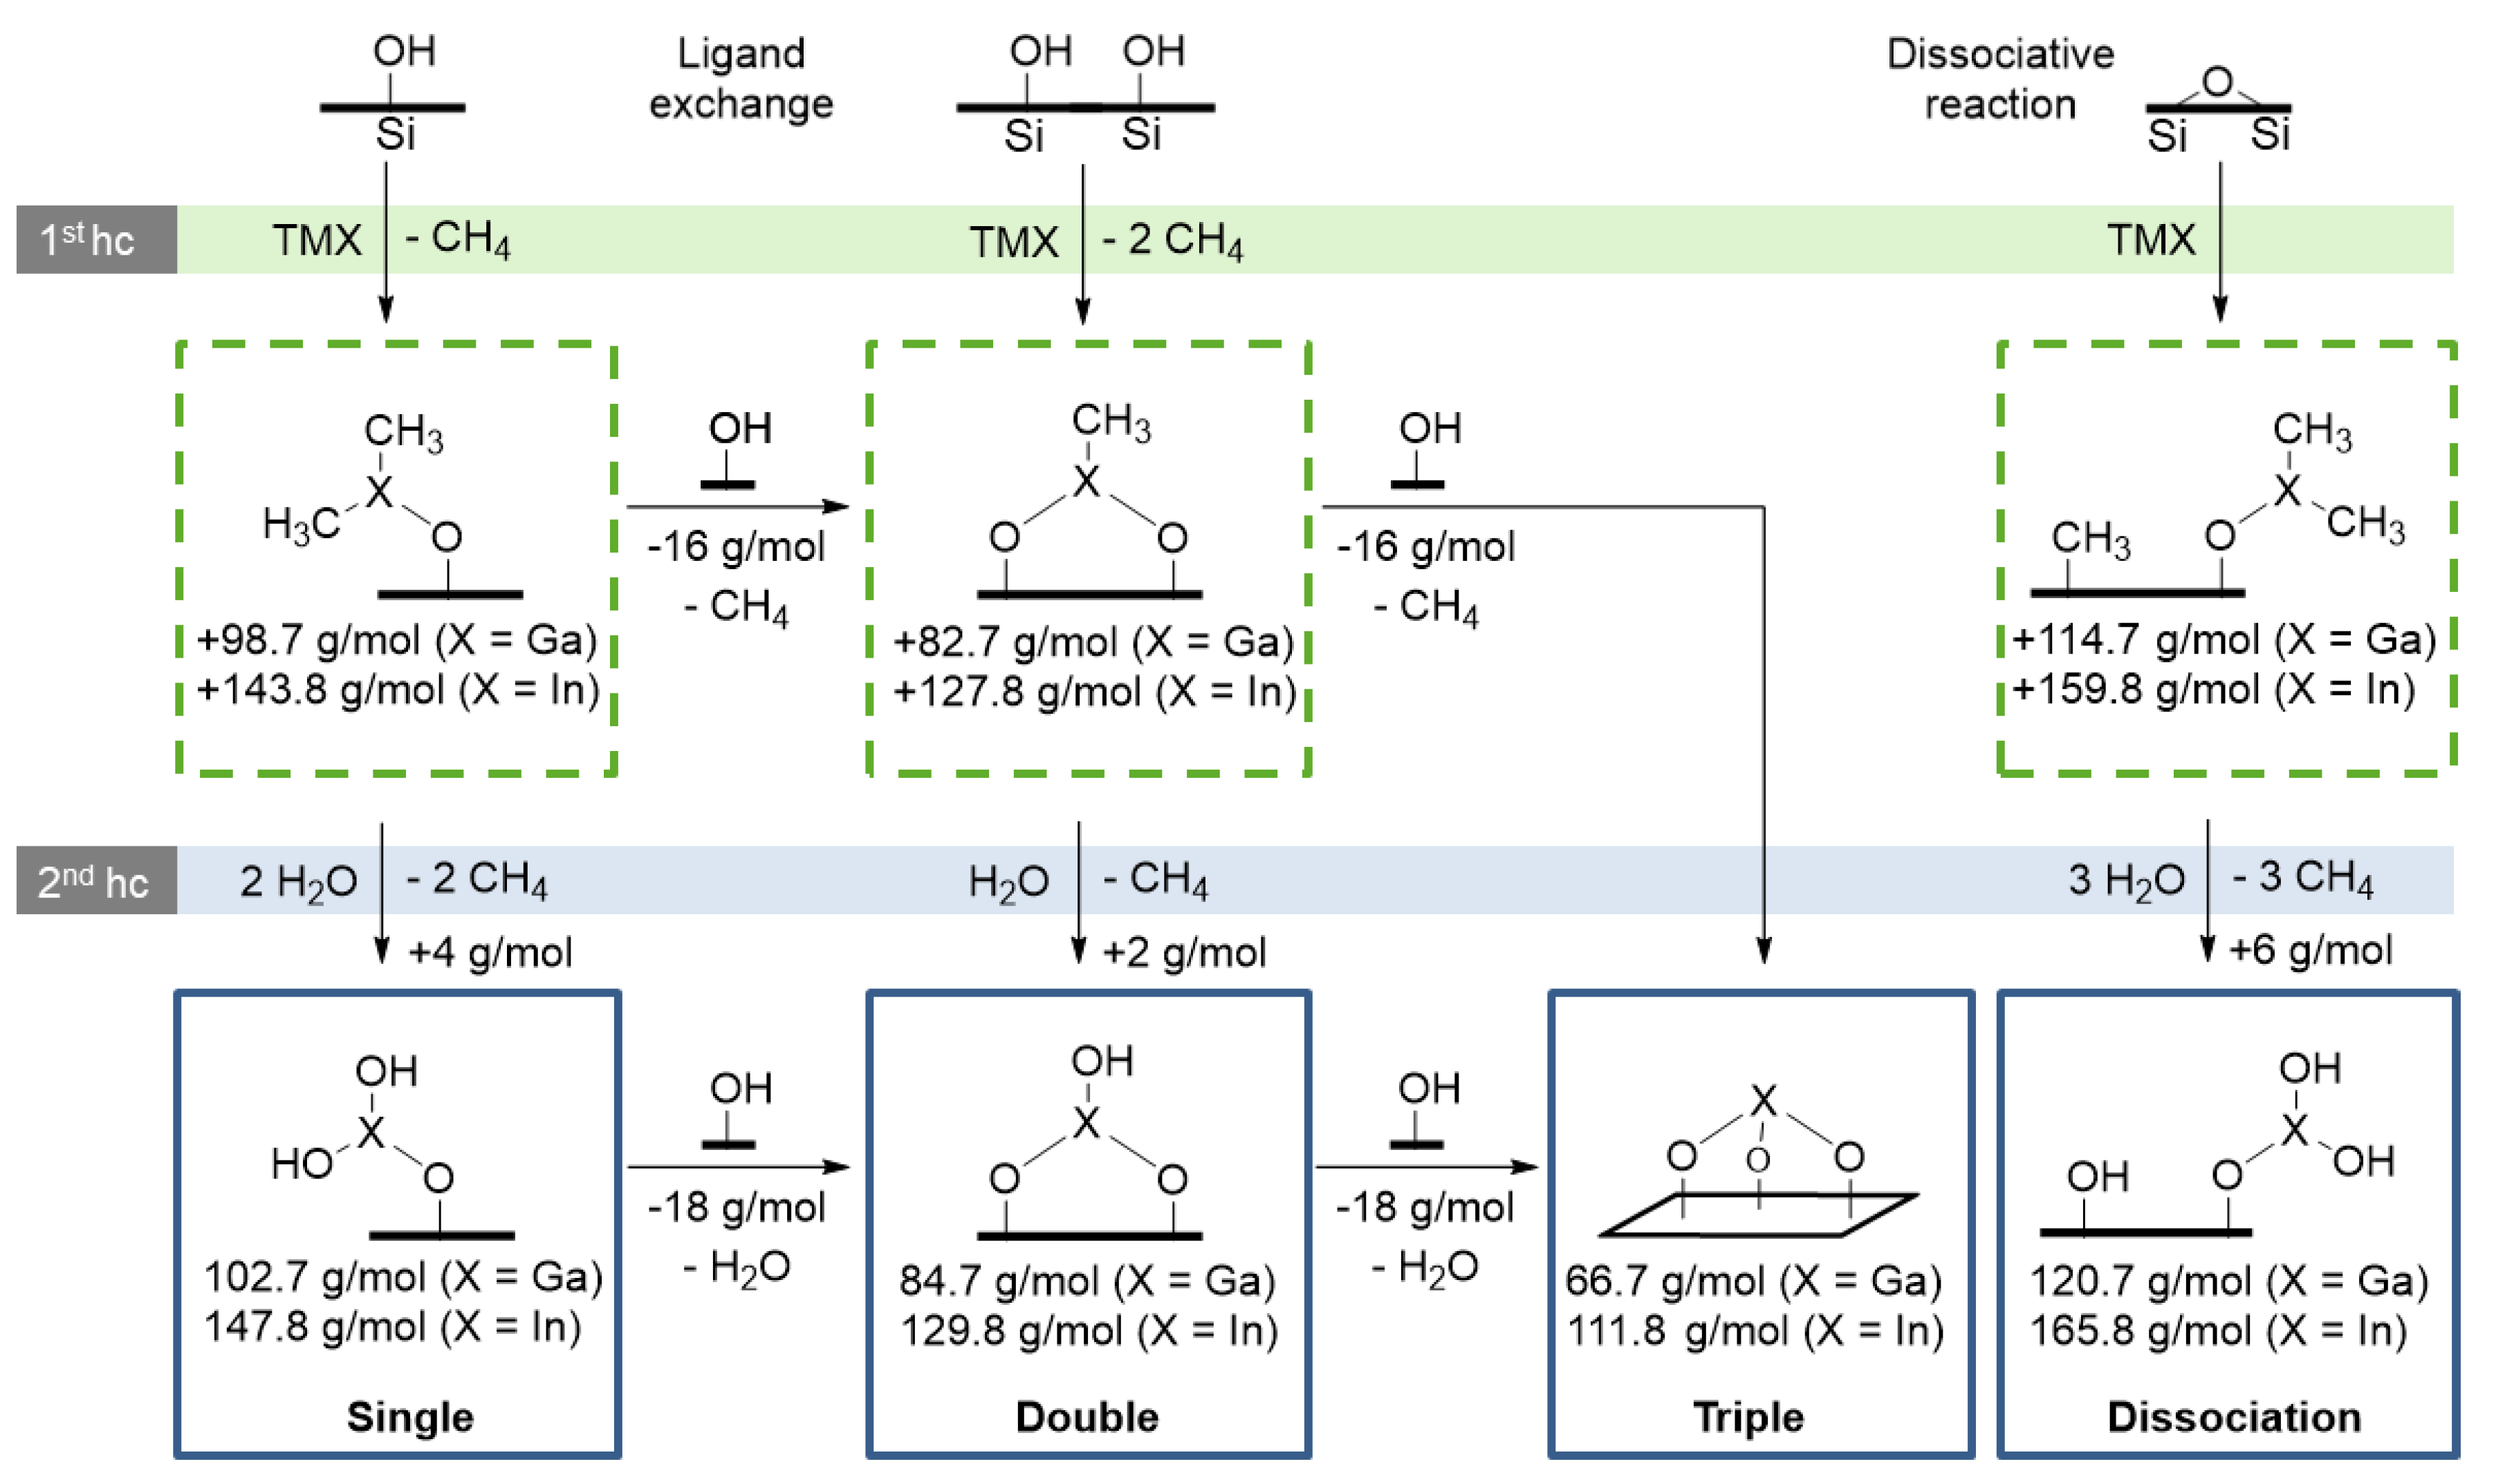
3.5. Decryption of the Growth Mechanism

Combining in-situ thermogravimetric data with ICP-OES facilitates the determination of a tendency of the ligand exchange mechanism during the first cycle of the GaOx and InOx ALD. The carbon content is neglected for convenience and multiple dissociation steps are excluded as repeated dissociation does not lead to further change in mass.
In the first cycle, the precursor TMX (X = Ga or In) can either react with Si-OH groups in a ligand exchange mechanism or with bridging oxygen of Si-O-Si (Figure 8). In the case of ligand exchange, the mass-uptake per mol of precursor depends on the number of ligands being replaced by silanol groups. The dissociative chemisorption of TMX on bridging oxygen results in the highest molar mass-uptake because all methyl groups are chemisorbed [93]. Subsequently, the methyl groups are exchanged by OH groups through a reaction with water. Thereby, methane is released as the only byproduct detected by the mass spectrometer.
Dividing the mass fraction of metal oxide (in-situ) by the moles of metal in the sample (ICP-OES) yields the average molar mass of chemisorbed precursor (in g/molPre). As a result, the GaOx ALD process led to mass gains of 93.3 g/molTMG after the first, 95.4 g/molTMG after the second, and 94.9 g/molTMG after the third cycle. This indicates the single (+102.7 g/molTMG) and double (+84.7 g/molTMG) ligand exchange mechanism to occur as also estimated for AlOx ALD [68]. However, the contribution of dissociative chemisorption cannot be neglected as methylated silica was found by NMR.
The number of surface OH-groups of silica was determined as 3 OH/nm2 via Grignard titration. Considering the specific surface area of GaOx/SiO2 and the mass fraction of gallium, the number of Ga atoms is calculated to be 3.75 Ga/nm2 after the first cycle. Therefore, dissociative chemisorption of TMG is necessary to reach the number of deposited gallium atoms. Any ratio of the ligand exchange reactions using the maximum number of 3 OH-groups/nm2 filled up with dissociative reactions to obtain 3.75 Ga/nm2 leads to around a 106 g/molTMG uptake. As the first cycle only led to 93.3 g/molTMG, condensation of Ga(OH)x might already happen within the first cycle, resulting in lower uptakes and M2O3 stoichiometry.
In the case of the InOx ALD process, 151.8 g/molTMI is added in the first cycle. As the uptake is higher than the theoretical maximum by ligand exchange (147.8 g/molTMI), dissociation clearly has a contribution. The mass fraction of indium suggests 4 In/nm2 being deposited in the first cycle. Any combination of ligand exchange reactions and dissociation, leading to 4 In/nm2 and consumption of 3 OH/nm2 (silica), would yield an uptake of 152.3 g/molTMI. This value is close to the observed mass gain of 151.8 g/molTMI which proves the dissociative reaction occurs.
In the second and third cycles, the average molar mass of the chemisorbed precursor is 135.9 g/molTMI and 133.2 g/molTMI which are between a single (+147.8 g/molTMI) and double (+129.8 g/molTMI) ligand exchange mechanism (Figure 8). Therefore, chemisorption of TMI on In(OH)x might favor the ligand exchange mechanism, whereas dissociative chemisorption has a higher contribution when reacting with SiO2. This phenomenon is accompanied by increased OH-group densities of 5–6 OH/nm2 after InOx deposition, which allows more ligand exchange reactions. Moreover, less uptake per mole of used precursor might also be the result of condensation reactions between In-OH after the first cycle. Condensation leads to more intra-molecular In-O-In bonds which result in M2O3 character in higher cycles as suggested by XPS.

3.6. Estimated ALD Oxide Layer Thickness

The layers’ thickness is of special interest as it is comparable to literature values for flat substrates. It also serves as an approximate indicator for the formation of a closed monolayer as previously reported for AlOx on powder [68]. Within the first cycles, the grown oxide follows the nature of the substrate’s surface, enforcing an amorphous structure with less density than the crystalline bulk oxide [103]. With further cycles, the layer eventually transforms into more crystalline material, yet the structure can only be estimated roughly.
In order to estimate the thickness of the InOx layers, a density of 6.75 g/cm3 is assumed, which was determined by Chung et al. for amorphous, ALD-grown In2O3 [104]. Considering the respective mass fraction and surface area, InOx grows 1.5 Å per cycle on average (gpc), generating a 4.6 Å thick oxide layer after three cycles (Table 4). The gpc is in the upper range of values reported for flat substrates which vary from 0.3 Å to around 2 Å [48,51,52,53]. Moreover, the growth increases with cycle number, which might be due to the favored formation of In(OH)x in the first cycle [104].
For the amorphous GaOx film, a reduced density of 5.5 g/cm3 is considered, calculated by Elam et al. [35]. As a result, the estimated gpc is 0.7 Å, leading to a layer thickness of 2.2 Å after the third cycle (Table 4). This is in agreement with values reported for flat substrates which are in the range of 0.5–1.5 Å [35,42]. As a comparison, TMA/H2O on the silica powder led to similar gpc of around 0.8 Å [68].
In cubic In2O3, the indium atoms are octahedrally coordinated with two different O-O distances depending on the miller plane orientation. Along the (110) plane, the average oxygen layer distance is approximately 2.5 Å and along the (111) plane, In2O3 grows less dense with a distance of 3.5 Å [105,106]. The calculated thickness for the second cycle (2.8 Å) indicates a defined monolayer being formed after the second and latest within the third cycle (4.6 Å). In β-Ga2O3, the gallium atoms are either octahedral or tetrahedral coordinated by oxygen with average distances of 2.8 and 3.0 Å [107,108]. Therefore, a monolayer is not considered to be formed within three cycles, as the estimated layer thickness reaches 2.2 Å after three cycles of GaOx ALD. This is in line with findings for the AlOx ALD on silica powder, as we estimated a monolayer to be formed around the third cycle [68].

4. Conclusions

The ALD processes for the deposition of gallium and indium oxide on mesoporous silica powder using trimethylgallium or trimethylindium and water were investigated. In-situ thermogravimetry confirmed self-limitation of the precursor-chemisorption and water was shown to be effective for the ligand removal. CHN analysis revealed carbon amounts below 0.2 wt% after InOx ALD and the deposited carbon species in the case of GaOx ALD were determined as methylated Si and Ga by FTIR and SS-NMR. Both processes showed distinct growth in every cycle, leading to mass fractions of 20–35 wt% GaOx and 28–56 wt% InOx within three ALD cycles. Thermogravimetric and ICP-OES data suggested a stoichiometry of Ga2O3 being present already after the first cycle. In the case of InOx ALD, the transition from In(OH)x to In2O3 with increasing cycle number was observed by XPS and confirmed by calculations based on thermogravimetric data and ICP-OES.
Despite their high mass fractions, the oxides were found to be highly dispersed and amorphous by STEM EDX-mappings and XRD. Additionally, the ALD processes led to specific surface areas of 260–340 m2/g for GaOx and 140–280 m2/g for InOx determined by N2 physisorption analysis. The layer thicknesses were estimated based on thermogravimetric data which revealed a gpc of 0.7 Å for GaOx and 1.5 Å for InOx. In conclusion, the study provides new insights into the ALD of GaOx and InOx on mesoporous supports with high surface area. Both processes can potentially be applied for catalyst synthesis while the oxide loading is tunable by the cycle number. Supported ALD catalysts might be further investigated for application in hydrogenation and dehydrogenation catalysis.

Supplementary Materials

The following supporting information can be downloaded at: https://www.mdpi.com/article/10.3390/nano12091458/s1, Figure S1: In-situ gravimetric monitoring of 4 ALD cycles GaOx on SiO2 powder, Figure S2: Differential pore size distributions of GaOx ALD modified SiO2, Figure S3: Differential pore size distributions of InOx ALD modified SiO2, Figure S4: STEM-HAADF image and EDX-mappings of (a) 1 ALD cycle GaOx on mesoporous SiO2, Figure S5: STEM-HAADF image and EDX-mappings of (b) 3 ALD cycle GaOx on mesoporous SiO2, Figure S6: STEM-HAADF image and EDX-mappings of (c) 1 ALD cycle InOx on mesoporous SiO2, Figure S7: STEM-HAADF image and EDX-mappings of (d) 3 ALD cycle InOx on mesoporous SiO2, Figure S8: STEM-HAADF image and EDX-mappings of (e) impregnated In2O3 (22 wt% In) on mesoporous SiO2, Table S1: Metal-uptakes of Al, Ga and In on SiO2 within 3 cycles of ALD using TMX (X = A, G, I) and water, Table S2: Estimated (blue) specific surface areas (ESA) and total pore volumes (EPV) of ALD-modified SiO2 based on model 1, Table S3: Estimated (blue) specific surface area (ESA) and mass-uptake (EUp) of ALD-modified SiO2 based on model 2, Table S4: Estimated (blue) surface area (ESA) and pore volume (EPV) of ALD-modified SiO2 based on model 3, Table S5: Fit parameters for the XPS scans of the Ga3d, In3d and O1s regions after GaOx and InOx ALD on SiO2, Scheme S1: Schematic description of model 1, based on two ALD cycles of InOx on SiO2, Scheme S2: Schematic description of model 2 (Core-shell), based on two ALD cycles of InOx on SiO2, Scheme S3: Schematic description of model 3 (volumetric), based on two ALD cycles of InOx on SiO2.

Author Contributions

Conceptualization, R.B., R.N.d. and F.R.; data curation, R.B.; formal analysis, R.B.; investigation, R.B., P.I., K.K. and R.N.d.; methodology, R.B. and P.I.; validation, R.B., P.I., K.K. and R.N.d.; visualization, R.B.; writing—original draft preparation, R.B.; writing—review and editing, P.I., K.K., R.N.d., M.D. and F.R.; project administration, R.N.d. and F.R.; resources, F.R.; funding acquisition, M.D. and F.R.; supervision, R.N.d., M.D. and F.R. All authors have read and agreed to the published version of the manuscript.

Funding

The work was partially funded by the Deutsche Forschungsgemeinschaft (DFG, German Research Foundation) under Germany´s Excellence Strategy–EXC 2008–390540038–UniSysCat.

Data Availability Statement

Data can be requested individually from the corresponding author.

Acknowledgments

The authors want to thank the following colleagues: Stephen Lohr (BASF), Jan Dirk Epping, Kevin Profita, Sophie Hund (TU Berlin), Frank Girgsdies, Maike Hashagen, and Christian Rohner (FHI). The work was conducted in the framework of the BasCat JointLab between BASF SE, the TU Berlin, and the FHI. We thank the Berlin Cluster of Excellence UniSysCat for support.

Conflicts of Interest

The authors declare no conflict of interest. The funders had no role in the design of the study; in the collection, analyses, or interpretation of data; in the writing of the manuscript, or in the decision to publish the results.

References

  1. Katiyar, P.; Jin, C.; Narayan, R.J. Electrical Properties of Amorphous Aluminum Oxide Thin Films. Acta Mater. 2005, 53, 2617–2622. [Google Scholar] [CrossRef]
  2. Lin, D.G.; Vorobyeva, E.V.; Shapovalov, V.M. Influence of Chemically Inert Fillers on the Efficiency of Polyethylene Inhibition by Antioxidants. Russ. J. Appl. Chem. 2014, 87, 966–971. [Google Scholar] [CrossRef]
  3. Sinkó, K. Absorbability of Highly Porous Aluminum Oxide Ceramics. JMSE-A 2017, 7, 37–43. [Google Scholar] [CrossRef] [Green Version]
  4. Almaev, A.V.; Chernikov, E.V.; Davletkildeev, N.A.; Sokolov, D.V. Oxygen Sensors Based on Gallium Oxide Thin Films with Addition of Chromium. Superlattices Microstruct. 2020, 139, 106392. [Google Scholar] [CrossRef]
  5. Garud, S.; Gampa, N.; Allen, T.G.; Kotipalli, R.; Flandre, D.; Batuk, M.; Hadermann, J.; Meuris, M.; Poortmans, J.; Smets, A.; et al. Surface Passivation of CIGS Solar Cells Using Gallium Oxide. Phys. Status Solidi A 2018, 215, 1700826. [Google Scholar] [CrossRef]
  6. Wellenius, P.; Suresh, A.; Foreman, J.V.; Everitt, H.O.; Muth, J.F. A Visible Transparent Electroluminescent Europium Doped Gallium Oxide Device. Mater. Sci. Eng. B 2008, 146, 252–255. [Google Scholar] [CrossRef]
  7. Qin, M.; Ma, J.; Ke, W.; Qin, P.; Lei, H.; Tao, H.; Zheng, X.; Xiong, L.; Liu, Q.; Chen, Z.; et al. Perovskite Solar Cells Based on Low-Temperature Processed Indium Oxide Electron Selective Layers. ACS Appl. Mater. Interfaces 2016, 8, 8460–8466. [Google Scholar] [CrossRef] [PubMed]
  8. Chen, P.-C.; Shen, G.; Chen, H.; Ha, Y.; Wu, C.; Sukcharoenchoke, S.; Fu, Y.; Liu, J.; Facchetti, A.; Marks, T.J.; et al. High-Performance Single-Crystalline Arsenic-Doped Indium Oxide Nanowires for Transparent Thin-Film Transistors and Active Matrix Organic Light-Emitting Diode Displays. ACS Nano 2009, 3, 3383–3390. [Google Scholar] [CrossRef]
  9. Charlet, E.; Grelet, E.; Brettes, P.; Bock, H.; Saadaoui, H.; Cisse, L.; Destruel, P.; Gherardi, N.; Seguy, I. Ultrathin Films of Homeotropically Aligned Columnar Liquid Crystals on Indium Tin Oxide Electrodes. Appl. Phys. Lett. 2008, 92, 24107. [Google Scholar] [CrossRef]
  10. Sattler, J.J.H.B.; Ruiz-Martinez, J.; Santillan-Jimenez, E.; Weckhuysen, B.M. Catalytic Dehydrogenation of Light Alkanes on Metals and Metal Oxides. Chem. Rev. 2014, 114, 10613–10653. [Google Scholar] [CrossRef]
  11. Castro-Fernández, P.; Mance, D.; Liu, C.; Moroz, I.B.; Abdala, P.M.; Pidko, E.A.; Copéret, C.; Fedorov, A.; Müller, C.R. Propane Dehydrogenation on Ga2O3 -Based Catalysts: Contrasting Performance with Coordination Environment and Acidity of Surface Sites. ACS Catal. 2021, 11, 907–924. [Google Scholar] [CrossRef]
  12. Martin, O.; Martín, A.J.; Mondelli, C.; Mitchell, S.; Segawa, T.F.; Hauert, R.; Drouilly, C.; Curulla-Ferré, D.; Pérez-Ramírez, J. Indium Oxide as a Superior Catalyst for Methanol Synthesis by CO2 Hydrogenation. Angew. Chem. Int. Ed. Engl. 2016, 55, 6261–6265. [Google Scholar] [CrossRef] [PubMed]
  13. Somorjai, G.A.; Li, Y. Introduction to Surface Chemistry and Catalysis, 2nd ed.; Wiley: Oxford, UK, 2010; ISBN 978-0-470-50823-7. [Google Scholar]
  14. Segawa, M.; Sato, S.; Kobune, M.; Sodesawa, T.; Kojima, T.; Nishiyama, S.; Ishizawa, N. Vapor-Phase Catalytic Reactions of Alcohols over Bixbyite Indium Oxide. J. Mol. Catal. A Chem. 2009, 310, 166–173. [Google Scholar] [CrossRef]
  15. Zheng, B.; Hua, W.; Yue, Y.; Gao, Z. Dehydrogenation of Propane to Propene over Different Polymorphs of Gallium Oxide. J. Catal. 2005, 232, 143–151. [Google Scholar] [CrossRef]
  16. Pan, B.; Yuan, G.; Zhao, X.; Han, N.; Huang, Y.; Feng, K.; Cheng, C.; Zhong, J.; Zhang, L.; Wang, Y.; et al. Highly Dispersed Indium Oxide Nanoparticles Supported on Carbon Nanorods Enabling Efficient Electrochemical CO2 Reduction. Small Sci. 2021, 1, 2100029. [Google Scholar] [CrossRef]
  17. Shao, C.-T.; Lang, W.-Z.; Yan, X.; Guo, Y.-J. Catalytic Performance of Gallium Oxide Based-Catalysts for the Propane Dehydrogenation Reaction: Effects of Support and Loading Amount. RSC Adv. 2017, 7, 4710–4723. [Google Scholar] [CrossRef] [Green Version]
  18. George, S.M. Atomic Layer Deposition: An Overview. Chem. Rev. 2010, 110, 111–131. [Google Scholar] [CrossRef]
  19. Puurunen, R.L. Surface Chemistry of Atomic Layer Deposition: A Case Study for the Trimethylaluminum/Water Process. J. Appl. Phys. 2005, 97, 121301. [Google Scholar] [CrossRef]
  20. Dingemans, G.; Seguin, R.; Engelhart, P.; de van Sanden, M.C.M.; Kessels, W.M.M. Silicon Surface Passivation by Ultrathin Al2O3 Films Synthesized by Thermal and Plasma Atomic Layer Deposition. Phys. Status Solidi RRL 2010, 4, 10–12. [Google Scholar] [CrossRef]
  21. Cheng, H.-M.; Wang, F.-M.; Chu, J.P.; Santhanam, R.; Rick, J.; Lo, S.-C. Enhanced Cycleabity in Lithium Ion Batteries: Resulting from Atomic Layer Depostion of Al2O3 or TiO2 on LiCoO2 Electrodes. J. Phys. Chem. C 2012, 116, 7629–7637. [Google Scholar] [CrossRef]
  22. Wilson, C.A.; Grubbs, R.K.; George, S.M. Nucleation and Growth during Al2O3 Atomic Layer Deposition on Polymers. Chem. Mater. 2005, 17, 5625–5634. [Google Scholar] [CrossRef]
  23. O’Neill, B.J.; Jackson, D.H.K.; Lee, J.; Canlas, C.; Stair, P.C.; Marshall, C.L.; Elam, J.W.; Kuech, T.F.; Dumesic, J.A.; Huber, G.W. Catalyst Design with Atomic Layer Deposition. ACS Catal. 2015, 5, 1804–1825. [Google Scholar] [CrossRef] [Green Version]
  24. Sels, B.; Van de Voorde, M. Atomic Layer Deposition for Catalysis. In Nanotechnology in Catalysis; Wiley: Weinheim, Germany, 2017. [Google Scholar]
  25. Lee, W.-J.; Bera, S.; Shin, H.-C.; Hong, W.-P.; Oh, S.-J.; Wan, Z.; Kwon, S.-H. Atomic Layer Deposition: Uniform and Size-Controlled Synthesis of Pt Nanoparticle Catalyst by Fluidized Bed Reactor Atomic Layer Deposition for PEMFCs. Adv. Mater. Interfaces 2019, 6, 1970133. [Google Scholar] [CrossRef] [Green Version]
  26. Mackus, A.J.M.; Weber, M.J.; Thissen, N.F.W.; Garcia-Alonso, D.; Vervuurt, R.H.J.; Assali, S.; Bol, A.A.; Verheijen, M.A.; Kessels, W.M.M. Atomic Layer Deposition of Pd and Pt Nanoparticles for Catalysis: On the Mechanisms of Nanoparticle Formation. Nanotechnology 2016, 27, 34001. [Google Scholar] [CrossRef] [PubMed]
  27. Yan, N.; Qin, L.; Li, J.; Zhao, F.; Feng, H. Atomic Layer Deposition of Iron Oxide on Reduced Graphene Oxide and Its Catalytic Activity in the Thermal Decomposition of Ammonium Perchlorate. Appl. Surf. Sci. 2018, 451, 155–161. [Google Scholar] [CrossRef]
  28. Geerts, L.; Ramachandran, R.K.; Dendooven, J.; Radhakrishnan, S.; Seo, J.W.; Detavernier, C.; Martens, J.; Sree, S.P. Creation of Gallium Acid and Platinum Metal Sites in Bifunctional Zeolite Hydroisomerization and Hydrocracking Catalysts by Atomic Layer Deposition. Catal. Sci. Technol. 2020, 10, 1778–1788. [Google Scholar] [CrossRef]
  29. Yan, H.; He, K.; Samek, I.A.; Jing, D.; Nanda, M.G.; Stair, P.C.; Notestein, J.M. Tandem In2O3-Pt/Al2O3 Catalyst for Coupling of Propane Dehydrogenation to Selective H2 Combustion. Science 2021, 371, 1257–1260. [Google Scholar] [CrossRef]
  30. Lu, Z.; Tracy, R.W.; Abrams, M.L.; Nicholls, N.L.; Barger, P.T.; Li, T.; Stair, P.C.; Dameron, A.A.; Nicholas, C.P.; Marshall, C.L. Atomic Layer Deposition Overcoating Improves Catalyst Selectivity and Longevity in Propane Dehydrogenation. ACS Catal. 2020, 10, 13957–13967. [Google Scholar] [CrossRef]
  31. Ingale, P.; Guan, C.; Kraehnert, R.; Naumann d’Alnoncourt, R.; Thomas, A.; Rosowski, F. Design of an Active and Stable Catalyst for Dry Reforming of Methane via Molecular Layer Deposition. Catal. Today 2021, 362, 47–54. [Google Scholar] [CrossRef]
  32. Ingale, P.; Knemeyer, K.; Preikschas, P.; Ye, M.; Geske, M.; Naumann d’Alnoncourt, R.; Thomas, A.; Rosowski, F. Design of PtZn Nanoalloy Catalysts for Propane Dehydrogenation through Interface Tailoring via Atomic Layer Deposition. Catal. Sci. Technol. 2021, 11, 484–493. [Google Scholar] [CrossRef]
  33. Pallister, P.J.; Buttera, S.C.; Barry, S.T. Quantitative Surface Coverage Calculations via Solid-State NMR for Thin Film Depositions: A Case Study for Silica and a Gallium Amidinate. J. Phys. Chem. C 2014, 118, 1618–1627. [Google Scholar] [CrossRef]
  34. Allen, T.G.; Cuevas, A. Plasma Enhanced Atomic Layer Deposition of Gallium Oxide on Crystalline Silicon: Demonstration of Surface Passivation and Negative Interfacial Charge. Phys. Status Solidi RRL 2015, 9, 220–224. [Google Scholar] [CrossRef]
  35. Comstock, D.J.; Elam, J.W. Atomic Layer Deposition of Ga2O3 Films Using Trimethylgallium and Ozone. Chem. Mater. 2012, 24, 4011–4018. [Google Scholar] [CrossRef]
  36. Donmez, I.; Ozgit-Akgun, C.; Biyikli, N. Low Temperature Deposition of Ga2O3 Thin Films Using Trimethylgallium and Oxygen Plasma. J. Vac. Sci. Technol. A Vac. Surf. Film. 2013, 31, 01A110. [Google Scholar] [CrossRef]
  37. Kröncke, H.; Maudet, F.; Banerjee, S.; Albert, J.; Wiesner, S.; Deshpande, V.; Dubourdieu, C. Effect of O2 Plasma Exposure Time during Atomic Layer Deposition of Amorphous Gallium Oxide. J. Vac. Sci. Technol. A 2021, 39, 52408. [Google Scholar] [CrossRef]
  38. Rafie Borujeny, E.; Sendetskyi, O.; Fleischauer, M.D.; Cadien, K.C. Low Thermal Budget Heteroepitaxial Gallium Oxide Thin Films Enabled by Atomic Layer Deposition. ACS Appl. Mater. Interfaces 2020, 12, 44225–44237. [Google Scholar] [CrossRef]
  39. Shih, H.-Y.; Chu, F.-C.; Das, A.; Lee, C.-Y.; Chen, M.-J.; Lin, R.-M. Atomic Layer Deposition of Gallium Oxide Films as Gate Dielectrics in AlGaN/GaN Metal-Oxide-Semiconductor High-Electron-Mobility Transistors. Nanoscale Res. Lett. 2016, 11, 235. [Google Scholar] [CrossRef] [Green Version]
  40. Choi, D.; Chung, K.-B.; Park, J.-S. Low Temperature Ga2O3 Atomic Layer Deposition Using Gallium Tri-Isopropoxide and Water. Thin Solid Film. 2013, 546, 31–34. [Google Scholar] [CrossRef]
  41. Mizutani, F.; Higashi, S.; Inoue, M.; Nabatame, T. Atomic Layer Deposition of High Purity Ga2O3 Films Using Liquid Pentamethylcyclopentadienyl Gallium and Combinations of H2O and O2 Plasma. J. Vac. Sci. Technol. A 2020, 38, 22412. [Google Scholar] [CrossRef]
  42. O’Donoghue, R.; Rechmann, J.; Aghaee, M.; Rogalla, D.; Becker, H.-W.; Creatore, M.; Wieck, A.D.; Devi, A. Low Temperature Growth of Gallium Oxide Thin Films via Plasma Enhanced Atomic Layer Deposition. Dalton Trans. 2017, 46, 16551–16561. [Google Scholar] [CrossRef]
  43. Kim, H.Y.; Jung, E.A.; Mun, G.; Agbenyeke, R.E.; Park, B.K.; Park, J.-S.; Son, S.U.; Jeon, D.J.; Park, S.-H.K.; Chung, T.-M.; et al. Low-Temperature Growth of Indium Oxide Thin Film by Plasma-Enhanced Atomic Layer Deposition Using Liquid Dimethyl (N-ethoxy-2,2-dimethylpropanamido) indium for High-Mobility Thin Film Transistor Application. ACS Appl. Mater. Interfaces 2016, 8, 26924–26931. [Google Scholar] [CrossRef]
  44. Asikainen, T.; Ritala, M.; Leskelä, M. Atomic Layer Deposition Growth of Zirconium Doped In2O3 Films. Thin Solid Films 2003, 440, 152–154. [Google Scholar] [CrossRef]
  45. Lee, D.-J.; Kwon, J.-Y.; Lee, J.I.; Kim, K.-B. Self-Limiting Film Growth of Transparent Conducting In2O3 by Atomic Layer Deposition using Trimethylindium and Water Vapor. J. Phys. Chem. C 2011, 115, 15384–15389. [Google Scholar] [CrossRef]
  46. Maeng, W.J.; Choi, D.; Park, J.; Park, J.-S. Indium Oxide Thin Film Prepared by Low Temperature Atomic Layer Deposition Using Liquid Precursors and Ozone Oxidant. J. Alloys Compd. 2015, 649, 216–221. [Google Scholar] [CrossRef]
  47. Mane, A.U.; Allen, A.J.; Kanjolia, R.K.; Elam, J.W. Indium Oxide Thin Films by Atomic Layer Deposition Using Trimethylindium and Ozone. J. Phys. Chem. C 2016, 120, 9874–9883. [Google Scholar] [CrossRef]
  48. Salami, H.; Uy, A.; Vadapalli, A.; Grob, C.; Dwivedi, V.; Adomaitis, R.A. Atomic Layer Deposition of Ultrathin Indium Oxide and Indium Tin Oxide Films Using a Trimethylindium, Tetrakis(dimethylamino)tin, and Ozone Precursor System. J. Vac. Sci. Technol. A 2019, 37, 10905. [Google Scholar] [CrossRef]
  49. Elam, J.W.; Libera, J.A.; Hryn, J.N. Indium Oxide ALD Using Cyclopentadienyl Indium and Mixtures of H2O and O2. ECS Trans. 2011, 41, 147–155. [Google Scholar] [CrossRef]
  50. Libera, J.A.; Hryn, J.N.; Elam, J.W. Indium Oxide Atomic Layer Deposition Facilitated by the Synergy between Oxygen and Water. Chem. Mater. 2011, 23, 2150–2158. [Google Scholar] [CrossRef]
  51. Han, J.H.; Jung, E.A.; Kim, H.Y.; Da Kim, H.; Park, B.K.; Park, J.-S.; Son, S.U.; Chung, T.-M. Atomic Layer Deposition of Indium Oxide Thin Film from a Liquid Indium Complex Containing 1-Dimethylamino-2-Methyl-2-Propoxy Ligands. Appl. Surf. Sci. 2016, 383, 1–8. [Google Scholar] [CrossRef]
  52. Ma, Q.; Zheng, H.-M.; Shao, Y.; Zhu, B.; Liu, W.-J.; Ding, S.-J.; Zhang, D.W. Atomic-Layer-Deposition of Indium Oxide Nano-films for Thin-Film Transistors. Nanoscale Res. Lett. 2018, 13, 4. [Google Scholar] [CrossRef] [Green Version]
  53. Elam, J.W.; Martinson, A.B.F.; Pellin, M.J.; Hupp, J.T. Atomic Layer Deposition of In2O3 Using Cyclopentadienyl Indium: A New Synthetic Route to Transparent Conducting Oxide Films. Chem. Mater. 2006, 18, 3571–3578. [Google Scholar] [CrossRef]
  54. Kim, D.; Nam, T.; Park, J.; Gatineau, J.; Kim, H. Growth Characteristics and Properties of Indium Oxide and Indium-Doped Zinc Oxide by Atomic Layer Deposition. Thin Solid Films 2015, 587, 83–87. [Google Scholar] [CrossRef]
  55. Nilsen, O.; Balasundaraprabhu, R.; Monakhov, E.V.; Muthukumarasamy, N.; Fjellvåg, H.; Svensson, B.G. Thin Films of In2O3 by Atomic Layer Deposition using In(acac)3. Thin Solid Films 2009, 517, 6320–6322. [Google Scholar] [CrossRef]
  56. Ramachandran, R.K.; Dendooven, J.; Poelman, H.; Detavernier, C. Low Temperature Atomic Layer Deposition of Crystalline In2O3 Films. J. Phys. Chem. C 2015, 119, 11786–11791. [Google Scholar] [CrossRef]
  57. Sheng, J.; Choi, D.; Lee, S.-H.; Park, J.; Park, J.-S. Performance Modulation of Transparent ALD Indium Oxide Films on Flexible Substrates: Transition between Metal-like Conductor and High Performance Semiconductor States. J. Mater. Chem. C 2016, 4, 7571–7576. [Google Scholar] [CrossRef]
  58. Yeom, H.-I.; Ko, J.B.; Mun, G.; Park, S.-H.K. High Mobility Polycrystalline Indium Oxide Thin-Film Transistors by Means of Plasma-Enhanced Atomic Layer Deposition. J. Mater. Chem. C 2016, 4, 6873–6880. [Google Scholar] [CrossRef] [Green Version]
  59. Ansari, A.S.; Raya, S.S.; Shong, B. Mechanistic Investigation on Thermal Atomic Layer Deposition of Group 13 Oxides. J. Phys. Chem. C 2020, 124, 17121–17134. [Google Scholar] [CrossRef]
  60. Singh, H.; Coburn, J.W.; Graves, D.B. Recombination Coefficients of O and N Radicals on Stainless Steel. J. Appl. Phys. 2000, 88, 3748–3755. [Google Scholar] [CrossRef]
  61. Schindler, P.; Logar, M.; Provine, J.; Prinz, F.B. Enhanced Step Coverage of TiO2 Deposited on High Aspect Ratio Surfaces by Plasma-Enhanced Atomic Layer Deposition. Langmuir 2015, 31, 5057–5062. [Google Scholar] [CrossRef]
  62. Lim, K.-B.; Lee, D.-C. Surface Modification of Glass and Glass Fibres by Plasma Surface Treatment. Surf. Interface Anal. 2004, 36, 254–258. [Google Scholar] [CrossRef]
  63. Kakanakova-Georgieva, A.; Giannazzo, F.; Nicotra, G.; Cora, I.; Gueorguiev, G.K.; Persson, P.O.; Pécz, B. Material Proposal for 2D Indium Oxide. Appl. Surf. Sci. 2021, 548, 149275. [Google Scholar] [CrossRef]
  64. Dos Santos, R.B.; Rivelino, R.; Gueorguiev, G.K.; Kakanakova-Georgieva, A. Exploring 2D Structures of Indium Oxide of Different Stoichiometry. CrystEngComm 2021, 23, 6661–6667. [Google Scholar] [CrossRef]
  65. Knemeyer, K.; Baumgarten, R.; Ingale, P.; Naumann d’Alnoncourt, R.; Driess, M.; Rosowski, F. Toolbox for Atomic Layer Deposition Process Development on High Surface Area Powders. Rev. Sci. Instrum. 2021, 92, 25115. [Google Scholar] [CrossRef] [PubMed]
  66. Onn, T.; Küngas, R.; Fornasiero, P.; Huang, K.; Gorte, R. Atomic Layer Deposition on Porous Materials: Problems with Conventional Approaches to Catalyst and Fuel Cell Electrode Preparation. Inorganics 2018, 6, 34. [Google Scholar] [CrossRef] [Green Version]
  67. Ingale, P.; Knemeyer, K.; Piernavieja Hermida, M.; Naumann d’Alnoncourt, R.; Thomas, A.; Rosowski, F. Atomic Layer Deposition of ZnO on Mesoporous Silica: Insights into Growth Behavior of ZnO via In-Situ Thermogravimetric Analysis. Nanomaterials 2020, 10, 981. [Google Scholar] [CrossRef]
  68. Strempel, V.E.; Knemeyer, K.; Naumann d’Alnoncourt, R.; Driess, M.; Rosowski, F. Investigating the Trimethylaluminium/Water ALD Process on Mesoporous Silica by In Situ Gravimetric Monitoring. Nanomaterials 2018, 8, 365. [Google Scholar] [CrossRef] [PubMed] [Green Version]
  69. Knemeyer, K.; Piernavieja Hermida, M.; Ingale, P.; Schmidt, J.; Kröhnert, J.; Naumann d’Alnoncourt, R.; Driess, M.; Rosowski, F. Mechanistic Studies of Atomic Layer Deposition on Oxidation Catalysts—AlOx and POx Deposition. Phys. Chem. Chem. Phys. 2020, 22, 17999–18006. [Google Scholar] [CrossRef]
  70. Strempel, V.E.; Naumann d’Alnoncourt, R.; Driess, M.; Rosowski, F. Atomic Layer Deposition on Porous Powders with in Situ Gravimetric Monitoring in a Modular Fixed Bed Reactor Setup. Rev. Sci. Instrum. 2017, 88, 74102. [Google Scholar] [CrossRef]
  71. Lugmair, C.G.; Fujdala, K.L.; Tilley, T.D. New Tris(tert -butoxy)siloxy Complexes of Aluminum and Their Transformation to Homogeneous Aluminosilicate Materials via Low-Temperature Thermolytic Pathways. Chem. Mater. 2002, 14, 888–898. [Google Scholar] [CrossRef]
  72. Long, L.H.; Sackman, J.F. THe Heat of Formation and Physical Properties of Gallium Trimethyl. Trans. Faraday Soc. 1958, 54, 1797. [Google Scholar] [CrossRef]
  73. Shenai-Khatkhate, D.V.; DiCarlo, R.L.; Ware, R.A. Accurate Vapor Pressure Equation for Trimethylindium in OMVPE. J. Cryst. Growth 2008, 310, 2395–2398. [Google Scholar] [CrossRef]
  74. Cychosz, K.A.; Thommes, M. Progress in the Physisorption Characterization of Nanoporous Gas Storage Materials. Engineering 2018, 4, 559–566. [Google Scholar] [CrossRef]
  75. Thommes, M.; Kaneko, K.; Neimark, A.V.; Olivier, J.P.; Rodriguez-Reinoso, F.; Rouquerol, J.; Sing, K.S. Physisorption of Gases, with Special Reference to the Evaluation of Surface Area and Pore Size Distribution (IUPAC Technical Report). Pure Appl. Chem. 2015, 87, 1051–1069. [Google Scholar] [CrossRef] [Green Version]
  76. Dendooven, J.; Goris, B.; Devloo-Casier, K.; Levrau, E.; Biermans, E.; Baklanov, M.R.; Ludwig, K.F.; van der Voort, P.; Bals, S.; Detavernier, C. Tuning the Pore Size of Ink-Bottle Mesopores by Atomic Layer Deposition. Chem. Mater. 2012, 24, 1992–1994. [Google Scholar] [CrossRef]
  77. Inoue, M.; Kimura, M.; Inui, T. Transparent Colloidal Solution of 2 nm Ceria Particles. Chem. Commun. 1999, 1999, 957–958. [Google Scholar] [CrossRef]
  78. Weibel, A.; Bouchet, R.; Boulc’, F.; Knauth, P. The Big Problem of Small Particles: A Comparison of Methods for Determination of Particle Size in Nanocrystalline Anatase Powders. Chem. Mater. 2005, 17, 2378–2385. [Google Scholar] [CrossRef]
  79. Sharma, A.; Varshney, M.; Saraswat, H.; Chaudhary, S.; Parkash, J.; Shin, H.-J.; Chae, K.-H.; Won, S.-O. Nano-Structured Phases of Gallium Oxide (GaOOH, α-Ga2O3, β-Ga2O3, γ-Ga2O3, δ-Ga2O3, and ε-Ga2O3): Fabrication, Structural, and Electronic Structure Investigations. Int. Nano Lett. 2020, 10, 71–79. [Google Scholar] [CrossRef]
  80. Tan, S.; Gil, L.B.; Subramanian, N.; Sholl, D.S.; Nair, S.; Jones, C.W.; Moore, J.S.; Liu, Y.; Dixit, R.S.; Pendergast, J.G. Catalytic Propane Dehydrogenation over In2O3–Ga2O3 Mixed Oxides. Appl. Catal. A Gen. 2015, 498, 167–175. [Google Scholar] [CrossRef] [Green Version]
  81. Nayak, A.K.; Lee, S.; Sohn, Y.; Pradhan, D. Biomolecule-assisted Synthesis of In(OH)3 Nanocubes and In2O3 Nanoparticles: Photocatalytic Degradation of Organic Contaminants and CO Oxidation. Nanotechnology 2015, 26, 485601. [Google Scholar] [CrossRef]
  82. Carli, R.; Bianchi, C.L. XPS Analysis of Gallium Oxides. Appl. Surf. Sci. 1994, 74, 99–102. [Google Scholar] [CrossRef]
  83. Navarro-Quezada, A.; Alamé, S.; Esser, N.; Furthmüller, J.; Bechstedt, F.; Galazka, Z.; Skuridina, D.; Vogt, P. Near Valence-band Electronic Properties of Semiconducting β−Ga2O3 (100) Single Crystals. Phys. Rev. B 2015, 92, 195306. [Google Scholar] [CrossRef]
  84. Huang, C.; Mu, W.; Zhou, H.; Zhu, Y.; Xu, X.; Jia, Z.; Zheng, L.; Tao, X. Effect of OH− on Chemical Mechanical Polishing of β-Ga2O3 (100) Substrate using an Alkaline Slurry. RSC Adv. 2018, 8, 6544–6550. [Google Scholar] [CrossRef] [Green Version]
  85. Faur, M.; Faur, M.; Jayne, D.T.; Goradia, M.; Goradia, C. XPS Investigation of Anodic Oxides Grown on P-type InP. Surf. Interface Anal. 1990, 15, 641–650. [Google Scholar] [CrossRef]
  86. Miller, M.L.; Linton, W.R. X-ray Photoelectron Spectroscopy of Thermally Treated Silica (SiO2) Surfaces. Anal. Chem. 1985, 57, 2314–2319. [Google Scholar] [CrossRef]
  87. Hoch, L.B.; Wood, T.E.; O’Brien, P.G.; Liao, K.; Reyes, L.M.; Mims, C.A.; Ozin, G.A. The Rational Design of a Single-Component Photocatalyst for Gas-Phase CO2 Reduction Using Both UV and Visible Light. Adv. Sci. 2014, 1, 1400013. [Google Scholar] [CrossRef] [PubMed]
  88. Sun, L.; Li, R.; Zhan, W.; Yuan, Y.; Wang, X.; Han, X.; Zhao, Y. Double-Shelled Hollow Rods Assembled from Nitrogen/Sulfur-Codoped Carbon Coated Indium Oxide Nanoparticles as Excellent Photocatalysts. Nat. Commun. 2019, 10, 2270. [Google Scholar] [CrossRef] [Green Version]
  89. El hadad, A.A.; Carbonell, D.; Barranco, V.; Jiménez-Morales, A.; Casal, B.; Galván, J.C. Preparation of SOL–Gel Hybrid Materials from γ-Methacryloxypropyltrimethoxysilane and Tetramethyl Orthosilicate: Study of the Hydrolysis and Condensation Reactions. Colloid. Polym. Sci. 2011, 289, 1875–1883. [Google Scholar] [CrossRef] [Green Version]
  90. Chen, H.; Fu, S.; Fu, L.; Yang, H.; Chen, D. Simple Synthesis and Characterization of Hexagonal and Ordered Al–MCM–41 from Natural Perlite. Minerals 2019, 9, 264. [Google Scholar] [CrossRef] [Green Version]
  91. Chun, K.S.; Husseinsyah, S. Agrowaste-Based Composites from Cocoa Pod Husk and Polypropylene. J. Thermoplast. Compos. Mater. 2016, 29, 1332–1351. [Google Scholar] [CrossRef]
  92. Morrow, B.A.; McFarlane, R.A. Trimethylgallium Adsorbed on Silica and Its Reaction with Phosphine, Arsine, and Hydrogen Chloride: An Infrared and Raman Study. J. Phys. Chem. 1986, 90, 3192–3197. [Google Scholar] [CrossRef]
  93. Tubis, R.; Hamlett, B.; Lester, R.; Newman, C.G.; Ring, M.A. Formation of Dimethylgalliumoxy and Dichlorogalliumoxy Groups on Silica Surfaces and Catalysis by the Dichlorogalliumoxy Group. Inorg. Chem. 1979, 18, 3275–3276. [Google Scholar] [CrossRef]
  94. Lakomaa, E.-L.; Root, A.; Suntola, T. Surface Reactions in Al2O3 Growth from Trimethylaluminium and Water by Atomic Layer Epitaxy. Appl. Surf. Sci. 1996, 107, 107–115. [Google Scholar] [CrossRef]
  95. Maudoux, N.; Tan, E.; Hu, Y.; Roisnel, T.; Dorcet, V.; Carpentier, J.-F.; Sarazin, Y. Aluminium, Gallium and Indium Complexes Supported by a Chiral Phenolato-Prolinolato Dianionic Ligand. Main Group Met. Chem. 2016, 39, 131–143. [Google Scholar] [CrossRef]
  96. Metroke, T.; Wang, Y.; van Ooij, W.J.; Schaefer, D.W. Chemistry of Mixtures of Bis-[trimethoxysilylpropyl]amine and Vinyltriacetoxysilane: An NMR Analysis. J. Sol.-Gel. Sci. Technol. 2009, 51, 23–31. [Google Scholar] [CrossRef]
  97. Iliashevsky, O.; Rubinov, E.; Yagen, Y.; Gottlieb, M. Functionalization of Silica Surface with UV-Active Molecules by Multivalent Organosilicon Spacer. OJIC 2016, 06, 163–174. [Google Scholar] [CrossRef] [Green Version]
  98. López, T.D.-F.; González, A.F.; Del Reguero, Á.; Matos, M.; Díaz-García, M.E.; Badía-Laíño, R. Engineered Silica Nanoparticles as Additives in Lubricant Oils. Sci. Technol. Adv. Mater. 2015, 16, 55005. [Google Scholar] [CrossRef] [PubMed] [Green Version]
  99. Gadzała-Kopciuch, R.; Kluska, M.; Wełniak, M.; Buszewski, B. Silicon Dioxide Surfaces with Aryl Interaction Sites for Chromatographic Applications. Mater. Chem. Phys. 2005, 89, 228–237. [Google Scholar] [CrossRef]
  100. Szwarc-Rzepka, K.; Ciesielczyk, F.; Jesionowski, T. Preparation and Physicochemical Properties of Functionalized Silica/Octamethacryl-Silsesquioxane Hybrid Systems. J. Nanomater. 2013, 2013, 674237. [Google Scholar] [CrossRef]
  101. Schütz, M.R.; Sattler, K.; Deeken, S.; Klein, O.; Adasch, V.; Liebscher, C.H.; Glatzel, U.; Senker, J.; Breu, J. Improvement of Thermal and Mechanical Properties of a Phenolic Resin Nanocomposite by in Situ Formation of Silsesquioxanes from a Molecular Precursor. J. Appl. Polym. Sci. 2010, 117, 2272–2277. [Google Scholar] [CrossRef]
  102. Kapusuz, D.; Durucan, C. Synthesis of DNA-encapsulated Silica Elaborated by Sol–Gel Routes. J. Mater. Res. 2013, 28, 175–184. [Google Scholar] [CrossRef]
  103. Groner, M.D.; Fabreguette, F.H.; Elam, J.W.; George, S.M. Low-Temperature Al2O3 Atomic Layer Deposition. Chem. Mater. 2004, 16, 639–645. [Google Scholar] [CrossRef]
  104. Han, J.H.; Park, B.K.; Chung, T.-M. Atomic Layer Deposition of Pure In2O3 Films for a Temperature Range of 200–300 °C using Heteroleptic Liquid In(DMAMP)2(OiPr) Precursor. Ceram. Int. 2020, 46, 3139–3143. [Google Scholar] [CrossRef]
  105. Hagleitner, D.R.; Menhart, M.; Jacobson, P.; Blomberg, S.; Schulte, K.; Lundgren, E.; Kubicek, M.; Fleig, J.; Kubel, F.; Puls, C.; et al. Bulk and Surface Characterization of In2O3 (001) Single Crystals. Phys. Rev. B 2012, 85, 115441. [Google Scholar] [CrossRef] [Green Version]
  106. Walsh, A.; Catlow, C.R.A. Structure, Stability and Work Functions of the Low Index Surfaces of Pure Indium Oxide and Sn-doped Indium Oxide (ITO) from Density Functional Theory. J. Mater. Chem. 2010, 20, 10438. [Google Scholar] [CrossRef]
  107. Geller, S. Crystal Structure of β-Ga2O3. J. Chem. Phys. 1960, 33, 676–684. [Google Scholar] [CrossRef]
  108. Wei, Y.; Liu, C.; Zhang, Y.; Qi, C.; Li, H.; Wang, T.; Ma, G.; Liu, Y.; Dong, S.; Huo, M. Modulation of Electronic and Optical Properties by Surface Vacancies in Low-Dimensional β-Ga2O3. Phys. Chem. Chem. Phys. 2019, 21, 14745–14752. [Google Scholar] [CrossRef]
Figure 1. In-situ gravimetric monitoring of (a) GaOx ALD and (b) InOx ALD on SiO2 powder at 150 °C using the ALD processes of TMG/H2O and TMI/H2O, respectively. Mass-uptake = ∆m/m0.
Nanomaterials 12 01458 g001
Figure 2. N2 physisorption isotherms of SiO2 coated with (a) 1–3 cycles GaOx ALD and (b) 1–3 cycles InOx ALD, using TMX (X = G or I) and water at 150 °C substrate temperature.
Nanomaterials 12 01458 g002
Figure 3. X-ray diffractograms of (a) 1–3 cycle GaOx ALD and (b) InOx ALD on SiO2 (500 °C) indicate calcination at 500 °C in 20% O2 for 3 h. Ga2O3(19 wt%)/SiO2 and In2O3(27 wt%)/SiO2 were synthesized via incipient wetness impregnation (IWI).
Nanomaterials 12 01458 g003
Figure 4. STEM-HAADF images and EDX-mappings of (a) one ALD cycle GaOx, (b) three-cycle GaOx, (c) one cycle InOx, (d) three-cycle InOx and (e) impregnated In2O3 (27 wt%) on mesoporous SiO2. Respective energy dispersive spectra are displayed in the supplementary materials (Figures S4–S8). Atomic ratios between Si and Ga or In are indicated in the HAADF images in orange and based on the EDX-detector counts.
Nanomaterials 12 01458 g004
Figure 5. X-ray photoelectron scans of the (a) Ga3d, (b) In3d, and O1s regions of as-deposited 1–3 cycle (a) GaOx and (b,c) InOx ALD on SiO2. Intensities were normalized to values between 0 and 1 for comparison. Surveys were corrected to the C1s orbital peak at 284.8 eV.
Nanomaterials 12 01458 g005
Figure 6. FTIR spectra (4000–400 cm−1) of 1-3 cycle (a) GaOx and (b) InOx ALD on silica using TMX (X = G, I) and water at 150 °C.
Nanomaterials 12 01458 g006
Figure 7. (a) (HPDEC) 13C and (b) 29Si CP/MAS SS-NMR spectra of as-deposited one ALD cycle GaOx and InOx on SiO2 (ppm rel. to TMS).
Nanomaterials 12 01458 g007
Figure 8. Possible reaction pathways during the ALD of trimethyl gallium or indium (TMG, TMI) and water on silica. Calculated mass changes per mol of used precursor are displayed as g/mol. Multiple dissociation steps do not lead to further mass change and are therefore excluded. The abbreviation hc implies an ALD half-cycle.
Nanomaterials 12 01458 g008
Table 1. Mass uptakes, molar uptakes, and total mass fractions of AlOx, GaOx, and InOx on SiO2 during three cycles of ALD using TMX (X = A, G, I) and H2O at 150 °C (GaOx, InOx) or 200 °C (AlOx). Mass-uptake = ∆m/m0; molar-uptake = est.-Mol(M2O3)/m0; mass-fraction (frac.) = ∆m/(m0 + ∆m).
AlOx/SiO2 [68]GaOx/SiO2InOx/SiO2
ALD
Cycles
Mass
Up./%
Molar Up./mmol·g−1Mass
Frac./%
Mass
Up./%
Molar Up.
/mmol·g−1
Mass
Frac./%
Mass
Up./%
Molar Up.
/mmol·g−1
Mass
Frac./%
1+11.9+1.010.6+24.3+1.019.6+38.7+1.027.9
2+11.4+1.018.9+16.3+0.828.9+44.3+1.145.4
3+13.4+1.226.9+14.2+0.735.4+45.8+1.156.3
Sum+36.7+3.226.9+54.8+2.535.4+128.8+3.256.3
Table 2. Mass fractions of GaOx and InOx on SiO2 within three cycles of ALD using TMX (X = G, I) and water at 150 °C. Values are calculated from thermogravimetric data (MSB) and compared to ICP-OES data. Mass-fraction (frac.) = ∆m/(m0 + ∆m).
SampleMass
Frac./%
1 M2O3
Frac./%
2 M(OH)2
Frac./%
Mass Frac./%
(ICP-OES)
1c GaOx19.6 (GaOx)14.5 (Ga)13.1 (Ga)14.6 (Ga)
3c GaOx35.4 (GaOx)26.3 (Ga)23.8 (Ga)26.0 (Ga)
1c InOx27.9 (InOx)23.1 (In)21.5 (In)21.1 (In)
3c InOx56.3 (InOx)46.6 (In)43.4 (In)48.5 (In)
1 calculated from in-situ mass-fraction, assuming M2O3 species being deposited. 2 assuming M(OH)2 species being deposited on a single OH-group each.
Table 3. Specific surface areas (SA, calculated via BET) and total pore volume (PV) after ALD on SiO2 using TMX (X = A, G, I) and water at 200 °C (AlOx) or 150 °C (GaOx, InOx).
AlOx/SiO2 [68]GaOx/SiO2InOx/SiO2
ALD CyclesSA/m2g−1 PV/cm3g−1SA/m2g−1PV/cm3g−1SA/m2g−1PV/cm3g−1
0 5050.795050.795050.79
14350.663360.572770.55
23830.552960.462160.34
33370.472590.391420.23
Table 4. Calculated layer thicknesses of the respective metal oxide on mesoporous silica after 1–3 cycles ALD using TMX (X = A, G, I) and water at 150 °C (gpc = average growth per cycle).
Sample [68]Thickness/ÅSampleThickness/ÅSampleThickness/Å
1c AlOx0.81c GaOx0.91c InOx1.1
2c AlOx1.62c GaOx1.62c InOx2.8
3c AlOx2.53c GaOx2.23c InOx4.6
gpc0.8gpc0.7gpc1.5
Publisher’s Note: MDPI stays neutral with regard to jurisdictional claims in published maps and institutional affiliations.

