Abstract
Palpitations, chest tightness, and shortness of breath are early indications of cardiomegaly, which is an asymptomatic disease. Their causes and treatment strategies are different due to differing indications. Hence, early screening of cardiomegaly levels can be used to make a strategy for administering drugs and surgical treatments. In this study, we will establish a multilayer one-dimensional (1D) convolutional neural network (CNN)-based classifier for automatic cardiomegaly level screening based on chest X-ray (CXR) image classification in frontal posteroanterior view. Using two-round 1D convolutional processes in the convolutional pooling layer, two-dimensional (2D) feature maps can be converted into feature signals, which can enhance their characteristics for identifying normal condition and cardiomegaly levels. In the classification layer, a classifier based on gray relational analysis, which has a straightforward mathematical operation, is used to screen the cardiomegaly levels. Based on the collected datasets from the National Institutes of Health CXR image database, the proposed multilayer 1D CNN-based classifier with K-fold cross-validation has promising results for the intended medical purpose, with precision of 97.80%, recall of 98.20%, accuracy of 98.00%, and F1 score of 0.9799.
1. Introduction
Common heart-related diseases include congenital heart disease, rheumatic heart disease, hypertensive heart disease, and coronary heart disease. In hypertension and coronary heart disease, the symptom of hypertension will gradually increase the load on the left ventricle and will result in a hypertrophic or enlarged heart, namely, cardiomegaly, which leads to heart failure. Most subjects with cardiomegaly have no symptoms; however, some subjects have symptoms such as shortness of breath, abnormal heartbeat (arrhythmia), edema, fatigue, and palpitations. Hence, heart size is an important indicator of cardiac enlargement, including left or right ventricular enlargement. In clinical examinations, cardiomegaly can be initially detected by electrocardiogram (exercise electrocardiogram) and posteroanterior (PA) chest X-ray (CXR) images. For further accurate examinations, cardiac echocardiography (CECHO), cardiac computed tomography (CCT), and cardiac magnetic resonance imaging (CMRI) [1,2,3,4] can accurately estimate the four chambers of the heart to evaluate the enlarged heart or myocardial hypertrophy (left ventricular hypertrophy) in a noninvasive imaging manner. The abovementioned imaging techniques can be used to measure the heart’s size, muscle thickness, and pumping function and identify cardiomegaly, such as left and right ventricular hypertrophy. Cardiomegaly has no pain or immediate risk; thus, its causes and treatment strategies are different, including cardiac hypertrophy and ventricular enlargement. The early detection of cardiomegaly will help the determination of drug and surgical treatments. In addition, using an automatic computer-aided tool is necessary to rapidly screen cardiomegaly levels, including normal condition, mild cardiomegaly, moderate cardiomegaly, and severe cardiomegaly.
CXR imaging is the first-line examination technique and basic medical object detection for cardiopulmonary (thoracic)-related diseases, such as in the National Institutes of Health (NIH) Clinical Center database [5], including pneumonia, pneumothorax, pleural effusion, pulmonary fibrosis, lung cancer, infiltration, emphysema, cardiomegaly, and so on (14 disease labels). The NIH database has more than 30,000 patients’ privacy CXR images and their biomarker information (disease category and location) for scientific and clinical studies and can also translate the investigation results for better treatments and interventions in clinical trials [5,6]. The Japanese Society of Radiological Technology (JSRT) CXR database [7,8] is a standard digital image database with and without chest lung nodules, created by the JSRT in cooperation with the Japanese Radiological Society, containing 154 subjects with lung nodules and 93 subjects without lung nodules [8,9]. Montgomery County’s (Montgomery County, MC, USA) CXR database [10] is a publicly available database for tuberculosis, containing 80 healthy subjects and 58 tuberculosis patients. The abovementioned CXR image database has been widely used for various medical purposes in automatically detecting cardiopulmonary-related diseases, such as training artificial intelligence (AI)-based computer-aided methods, which can help clinicians or radiologists make better diagnostic decisions. For a CXR image, white shadows appear on the right/left lung lobes as solid or partially solid shadows for mass or nodules, and ground glass or cloudy shadows for pneumonia, pulmonary fibrosis, or infiltration, respectively. Thus, pulmonary-related diseases can be identified. However, both the JSRT and MC CXR databases contain no cardiomegaly subjects for our purpose. Hence, CXR images from the NIH dataset are selected in this study. Routine PA CXR images can also rapidly screen dilated cardiomyopathy, which may increase heart’s size on a PA CXR image, such as right/left atrial shadow (atrial enlargement) or right/left ventricular hypertrophy (ventricular enlargement) [11,12]. In clinical applications, the cardiothoracic ratio (CTR) is a simple index to measure the heart size using manual inspection (Figure 1), including normal condition (0.42 < CTR ≤ 0.50), mild/moderate cardiomegaly (0.50 < CTR ≤ 0.60), and severe cardiomegaly (CTR > 0.60) [13,14,15]. However, this manual method is time consuming, and the diagnostic results are dependent on readers’ interpretations and experiences. Hence, in this study, we intend to establish a multilayer classifier for automatic CXR classification in cardiomegaly level screening, which can replace the inspection and manual methods by requiring specific expertise and experience (clinicians and radiologists) for medical imaging examinations.
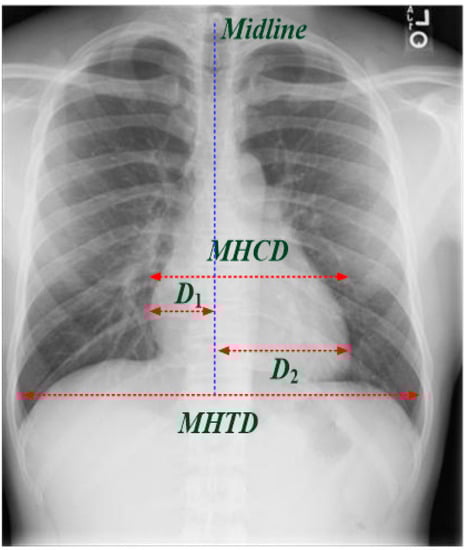
Figure 1.
Measurement of cardiothoracic ratio (CTR) on PA CXR view for cardiomegaly assessment.
Traditional AI-based methods, such as machine learning (ML) classifiers, have been applied for identifying pulmonary-related diseases from CXR images. However, ML methods require handcrafted techniques for feature extraction. To overcome such limitation, deep learning (DL)-based methods with multi convolutional-pooling layers perform the automatic end-to-end image enhancement, noise removal, feature extraction, and classification tasks [16,17], such as U-Net [18,19], Chexnet [20], and CardiacNet [21] for medical imaging applications, for example, cardiomegaly and pneumonia detection and image segmentation of left atrium and proximal pulmonary veins. A DL-based multilayer classifier, based on a two-dimensional (2D) convolutional neural network (CNN), is constructed by multiple layers and integrated alternating convolutional and pooling processing layers for feature enhancement and extraction, followed by one or more fully connected layers to perform the classification tasks; examples include DenseNet (Dense Convolutional Network) [6] and ResNet (Residual Network)/FC-ResNets (Fully Convolutional Residual Network) [22,23]. The abovementioned methods have provided promising results in dealing with 2D images/medical images, video frames, and spectral images [6,18,19,22,23,24]. Hence, feature extraction and classification tasks are integrated into a single learning model for automatically classification applications and can also work with noisy data to improve image resolution for increasing the classification accuracy. However, a traditional multilayer CNN-based scheme may combine the multi convolutional-pooling layers and ML methods, such as artificial neural network, with backpropagation (forward and backpropagation neural network) and Bayesian network, which will increase the computational complexity level and require a large volume of training dataset for training the classifier, resulting in overfitting problems. In addition, the implementation of a CNN-based pattern recognition scheme is required on a graphics processing unit (GPU) to accelerate the training process and parallelize computations with large-scale training data for image classification.
Therefore, in addressing the abovementioned problems, this study aims to simplify the complexity of image processing and classification for designing a multilayer one-dimensional (1D) CNN-based classifier. After region of interest (ROI) extraction, a 2D feature map of the heart in a matrix form can be converted into a vector form as a feature signal by flattening. Hence, the proposed multilayer 1D CNN-based classifier can deal with 1D feature signals for PA CXR image classification for cardiomegaly level screening. The multi-1D convolutional processing can continually enhance the incoming feature signals and then increase accurate identification, such as electrocardiogram, phonoangiograph, photoplethysmography classifications, and sleep apnea detection [25,26,27,28,29]. In addition, subsequent 1D convolutional-pooling processes use simpler linear weighted sums to deal with the 1D feature signals and can also remove unwanted noise. In clinical applications, this process has a real-time and simple architectural implementation, which has a compact configuration to perform multi-1D kernel convolutional processes [27,28,30,31] for signal feature extractions. Then, the downsampling (pooling) process is used to reduce the dimensionality of enhanced feature signals and multi-convolutional outputs. Overfitting can be overcome by reducing the dimensions of the feature signals. In the classification layer, a gray relation analysis (GRA) [32,33]-based fully connected layer is connected to the pooling layer from the convolutional layer to perform multiclass classifications, which are used to differentiate normal condition from mild/moderate cardiomegaly or severe cardiomegaly with the capability of nonlinear separability. In experimental validations, PA CXR images are obtained from the National Institutes of Health (NIH, Rockville Pike, Bethesda, Maryland) Clinical Center database [5,6,34], including training and testing datasets for training the classifier and validating the classifier’s feasibility in clinical applications. Using cross-validation, the experimental results will indicate the classifier’s efficiency for automatic cardiomegaly level screening on PA CXR images, with precision (%), recall (%), accuracy (%), and F1 score indexes [16].
The remainder of this study is organized as follows: Section 2 describes the materials and methods, including the experimental setup, CXR image collection and preprocessing, and multilayer 1D CNN design for establishing a classifier for cardiomegaly level screening. Section 3 and Section 4 present the feasibility tests and experiment results for clinical applications, and the conclusions, respectively.
2. Materials and Methods
2.1. Experimental Setup
The database of NIH CXR images comprised 112,120 PA CXR images with disease labels from 30,805 patients, which were collected from 1992 to 2015 and stored in hospitals’ picture archiving and communication systems [5]. This database showed common thoracic diseases, such as lung cancer/nodule mass, lung fibrosis, pulmonary embolic disease, lung infections, and cardiomegaly, which can be detected and located with multi-labels (containing 14 disease labels) for further validation by using artificial intelligence methods. In clinical applications, the CTR is an index to measure the enlargement of the cardiac silhouette, and CTR can be represented as follows [13,14,15]:
where the CTR index is measured on PA CXR view (as seen in Figure 1), which is the ratio of maximal horizontal cardiac diameter to maximal horizontal thoracic diameter; D1 is the greatest perpendicular diameter from the midline to the right heart border; D2 is the greatest perpendicular diameter from the midline to the left heart border. “Normal condition” is determined as 0.42 < CTR ≤ 0.50; <0.42 is usually considered as pathologic, which indicates “smaller heart,” and >0.50 is usually used to predict mortality and abnormal conditions, such as non-fatal myocardial infarction or coronary death, indicating 0.50 < CTR ≤ 0.55 as “mild cardiomegaly,” 0.55 < CTR ≤ 0.60 as “moderate cardiomegaly,” and CTR > 0.60 as “severe cardiomegaly,” which is also correlated with left ventricular (LV) size and LV ejection fraction for assessing LV systolic function [4]. In addition, atrial enlargement may result from congenital and acquired conditions, such as ventricular septal defect, patent ductus arteriosus, mitral stenosis, or LV failure, which can also show characteristic findings on a frontal CXR image. Hence, the CTR index can be used as a threshold value to label the level of cardiomegaly. Then, the labeled CXR images can be used to train the proposed 1D CNN-based classifier to separate “normal condition” from “mild/moderate cardiomegaly” or “severe cardiomegaly.”
2.2. CXR Image Collection and Preprocessing
The PA CXR images can be converted from the Digital Imaging and Communication in Medicine format to a tagged image file (TIF) format. The TIF is a lossless image format that can lower the computation time for automatic CXR image examinations. Each size of the CXR image is specified at 1024 (width) × 1024 (length) pixel image, 8 bits/pixel, with 0–255 grayscale values. Digital image processing should speed up the pattern recognition task; hence, we performed resizing to downscale images from 1024 × 1024 pixels to 420 × 420 pixels (as seen in Figure 1), which are converted from the DICOM format to a TIF format, and then used a bounding box (BB) to extract the ROI at 100 × 200 BB and obtain the heart pathologic information from the midline to the right heart border and from the midline to the left heart border, as shown in the ROI extractions in Figure 2, thereby keeping sufficient image visual details for indicating atrial and ventricular information, respectively. We will select 200 patients (images) from the NIH CXR image database, including 100 patients with labeled cardiomegaly and 100 patients labeled no finding (normal condition). The feature maps can be mined from such patients to explore the proposed classifier and validate classifier’s performances.
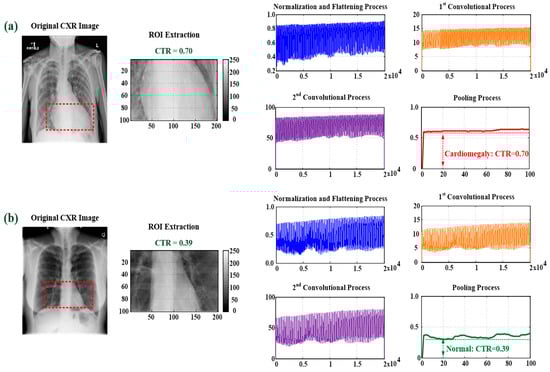
Figure 2.
Feature map extraction with ROI extraction, normalization, and flattening; first and second convolutional processes; and pooling process. (a) For cardiomegaly, CTR = 0.69; (b) for normal condition, CTR = 0.39.
2.3. Multilayer 1D Convolutional Neural Network Design
2.3.1. Feature Extraction Layer with Two-Round 1D Convolutional Processes
In analyzing the 2D CXR images, in the feature extraction layer, we performed normalization and flattening (FLAT) processes to convert the CXR image from matrix form (100 × 200) to vector form (1 × 20,000). FLATx in a vector form is presented as follows:
where Ixy ∈ [0, 255] is the pixel value at location (x, y) in a n × m image (n = 100 and m = 200), x = 1, 2, 3, …, n, and y = 1, 2, 3, …, m. In addition, FLATIx is known as the feature signal. Then, two 1D convolutional operators in this study were used to perform two-round enhancement by using Xc[i] = FLATIx,c[i] * Hc[j] (symbol “*” is the convolution operator), which can be presented in a discrete-time convolutional form [16]:
where FLATIx,c[i] is the feature signal in the cth convolutional process; i = 1, 2, 3, …, n m; index, c, c = 1, 2, is the number of 1D convolutional process for feature enhancement (Figure 2); Hc[j] is the discrete Gaussian window with the sliding stride = 1 for 1D signal process, which is used to deal with two-round feature signals with sampling point, j = 0, 1, 2, …, Mc − 1 (Index, Mc, is the data length of the 1D convolution mask, M1 = 200 and M2 = 25 in this study). The enhanced feature signal, Xc[i], at the cth convolutional process can be obtained by the summation of all the multiplications of FLATIx,c[i–j] and the weighted values of Hc[j] (Figure 2). Then, downsampling (pooling) [15,16,18,19] was used to reduce the dimension of the enhanced feature signal, which can be expressed as follows:
where x[i] is the 1D pooling process, which is obtained with the sliding stride = 200, and “max(X2)” is the maximum value in signal stream X2. Hence, the two-round 1D convolutional and pooling processes were used to enhance the incoming feature signal and remove the noise, as shown in the feature maps for cardiomegaly and normal condition in Figure 2, which can obtain the stable feature parameters for identifying cardiomegaly levels. Thus, in this study, flattening, two-round 1D convolutional processes, and pooling can be combined in the feature extraction layer for feature signal enhancement and noise filtering, as seen in Figure 3.
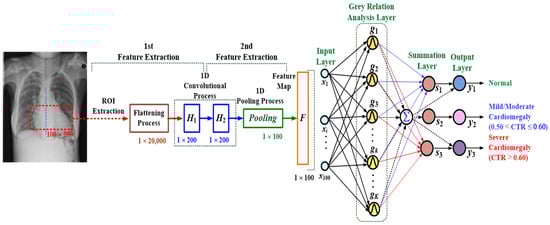
Figure 3.
Architecture of the proposed multilayer 1D convolutional neural network-based classifier for cardiomegaly level screening.
2.3.2. Classification Layer with a GRA-Based Classifier
The GRA-based classifier is based on similarity and dissimilarity among various variables of processes to automatically label the possible class, and it provides information of gray relation levels for prediction and decision-making applications. Its pattern recognition scheme is used to perform the classification task without optimization algorithm and iteration computations [16]. In the classification layer, as seen in Figure 3, a multilayer fully connected network, consisting of an input layer, GRA layer, summation layer, and output layer, was used to establish a GRA-based classifier that is fed a 2D ROI map for cardiomegaly level screening. In the GRA layer, the gray grades as Gaussian functions were used to measure the similarity between a reference feature signal (testing feature signal) and comparative feature signals (training feature signals), which were represented as x0 = [x1(0), x2(0), x3(0), …, xi(0), …, x100(0)] and xk = [x1(k), x2(k), x3(k), …, xi(k), …, x100(k)], k = 1, 2, 3, …, K, respectively. The output of the gray grade, g(k), can be defined as follows [16,35]:
where ED(k) is the Euclidean distance (ED); K is the number of training feature signals, and σ is the standard deviation, which can be represented as follows [32,33,34,35,36]:
where di(k) is the difference between a testing feature signal and training feature signals; Δdmax and Δdmin are the maximum and minimum deviation values, respectively; the standard deviation, σ, can be automatically determined by Δdmax − Δdmin, and K training data are created by feature signals, including (1) normal condition (Nor: 0.42 < CTR ≤ 0.50), (2) mild/moderate cardiomegaly (0.50 < CTR ≤ 0.60), and (3) severe cardiomegaly (CTR > 0.60) [13,14,15]. Then, classifier’s output can be normalized as follows:
where wkj is the network weighted values between the GRA layer and summation layer, which can be set by K × 3 (m = 3) output training data, as denoted by binary values, 1 or 0; the output weighted values in vector form can be labeled as [Nor, Mild/Moderate Cardiomegaly, severe cardiomegaly] = [0/1, 0/1, 0/1] and encoded as (1) Nor: [1,0,0], (2) Mild/Moderate Cardiomegaly: [0,1,0], and (3) Severe Cardiomegaly: [0,0,1]. The final output can be determined by setting the threshold value at 0.5 to confirm the presence (value 1) or absence (value 0) of the disease.
2.4. Classifier’s Performance Validation
The NIH CXR images [5,6,34] were used to evaluate the performance of the proposed multilayer classifier for rapidly screening cardiomegaly levels. The classifier’s performance was validated using the Recall (%), Precision (%), Accuracy (%), and F1 Score indexes, which can be defined as follows [16,33,36]:
where TP and TN are the true positive and true negative, respectively; FP and FN are the false positive and false negative, respectively. In order to achieve the medical purpose, we constructed a workflow for automatic cardiomegaly level screening, including PA CXR images collection, CTR evaluation for heart sizes measurement, ROI extraction, feature signals extraction, classifier training, classifier’s performance evaluation, and keeping its medical purpose in clinical application, as seen the flowchart in Figure 4.
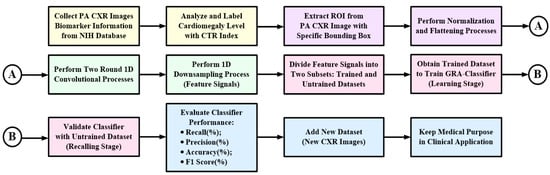
Figure 4.
Flowchart of automatic cardiomegaly level screening for multilayer classifier design in clinical application.
3. Experimental Results and Discussion
3.1. Experimental Setup and Testing Results
This study aimed to use the PA CXR images to screen the cardiomegaly levels, including the normal condition (0.42 < CTR ≤ 0.50), mild/moderate cardiomegaly (0.50 < CTR ≤ 0.60), and severe cardiomegaly (CTR > 0.60). Each CXR image was enrolled from the NIH CXR image database [5,6,34] and was resized from 1024 × 1024 pixels to 420 × 420 pixels (96 dpi, with a bit depth of 32 bits). A total of 200 CXR images were collected and divided into 100 images to train the proposed classifier and 100 images to validate classifier’s performance, including 100 normal condition images (labeled no finding, CTR ≤ 0.50) and 100 cardiomegaly images (CTR > 0.50), as seen in Figure 5. The 200 CXR images included 100 normal condition images, 48 mild/moderate cardiomegaly images, and 52 severe cardiomegaly images. In this study, four processes were used for cardiomegaly level screening: (1) ROI extraction using the contour method [37,38,39], (2) feature signal transformation using flattening, (3) feature signal enhancement using two-round 1D convolutional processes, and (4) automatic feature signal classification using a GRA-based fully connected network. The contour search algorithms, such as active contour or Tanaka contour [37,38,39,40], could use the grayscale values or gray gradient of the image to search the heart contour in a specific region. This information could be used to plot colored contour lines for ROI extraction with 100 × 200 BB, as shown in the flowchart of feature signal extraction in Figure 5. Then, the ROI was fed to the proposed multilayer 1D CNN-based classifier for cardiomegaly level screening. The proposed classifier’s algorithm was implemented on a tablet PC using a high-level graphical programming language in LabVIEW and MATLAB (NI™, Austin, TX, USA), and the GPU (NVIDIA® GeForce® RTX™ 2080 Ti, 1755MHz, 11GB GDDR6) was used to speed up the execution time of pattern recognition tasks. Table 1 shows related data of the proposed multilayer 1D and 2D CNN-based classifiers, including their layer functions, manners, and feature maps. Feasibility tests and comparisons between multilayer 1D and 2D CNN-based classifiers (as seen in Table 1) were shown as follows.
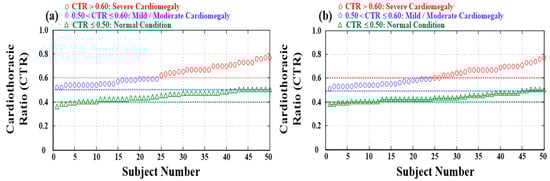
Figure 5.
Distributions and statistics of normal condition (100 subjects), mild/moderate cardiomegaly (48 subjects), and severe cardiomegaly (52 subjects). (a) Training dataset for training classifier and (b) testing dataset for validating classifier.

Table 1.
Related data of the multilayer 1D and 2D CNN-based classifiers.
Randomly selecting 100 enrolled subjects from the NIH CXR image database, including 50 normal condition images, 24 mild/moderate cardiomegaly images, and 26 severe cardiomegaly images, we could extract the feature signals using two-round 1D convolutional processes and could simplify the feature parameters using 1D pooling, which could be used to establish the GRA-based multilayer classifier. In the classification layer, the structure of the GRA-based classifier could be determined by 100 comparative feature signals and 100 output feature patterns (desired labeled classes, including Nor, Mild/Moderate Cardiomegaly, and Severe Cardiomegaly). Then, we could set 100 input nodes, 100 GRA nodes, four summation nodes, and three output nodes. In the feature extraction layer, two-round 1D convolutional processes used the discrete Gaussian function (with stride = 1) to extract and enhance the feature signals (shown in vector form in Figure 6). In the pooling layer, the dimension of the feature signal was rescaled from 1 × 20,000 to 1 × 100 (with stride = 200). Then, this 1 × 100 pooling feature signal was fed into the inputs of the GRA-based classifier and used to perform the pattern recognition task (shown in feature signals for cardiomegaly and normal condition in Figure 7), which could be used to identify the normal condition and cardiomegaly. In the learning stage, the GRA-based classifier performed a straightforward mathematical operation (from Equation (7) to Equation (11)) to deal with the incoming feature signals without iterative computations to adjust the network parameter. The network parameter in the GRA layer was automatically determined by using Equations (8) and (9). For 100 randomly selected CXR testing images, through 10-fold cross-validation tests, the experimental results are shown in Table 2, with an average precision (%) of 97.40% (as the positive predictive value, PPV) and an average recall (%) of 96.64% for predicting mild/moderate cardiomegaly and severe cardiomegaly and accurately identifying abnormality (TP), respectively; an average accuracy of 97.00% for correctly identifying normal and abnormal; and an average F1 score of 0.9701 for evaluating the classifier’s performance to separate the normal condition from cardiomegaly, which was greater than 0.9000, indicating the great potential of the proposed classifier as a classifier model. In addition, the recall (%) as the index of PPV was greater than 80%, indicating the predictive performance of the classifier. For example, as shown in the fold #1 in Table 2, we had 48 correct classifications (TN) and two failures (FN) in identifying normal condition, 22 correct classifications (TP) and two failures (FP) in identifying mild/moderate cardiomegaly, and 26 correct classifications (TP) in identifying severe cardiomegaly. For each fold test, the overall classifier computation had an average of 0.6160 s of CPU time to identify the possible pathology level. As shown in Table 2, the manual method with CTR estimation could also agree with the possible pathology, at an average CTR of 0.4452 ± 0.0383 and 0.6556 ± 0.0725 for the identified normal condition and cardiomegaly, respectively. Hence, we could recommend the use of the multilayer 1D CNN-based classifier to automatically screen the presence of cardiomegaly level on PA CXR images in clinical applications.
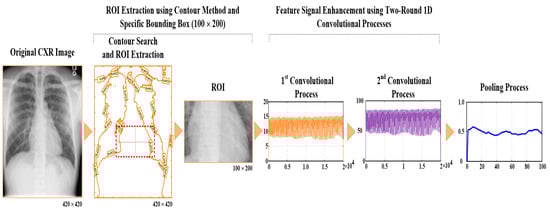
Figure 6.
Flowchart of PA CXR image feature signal enhancement and extraction for cardiomegaly level screening.
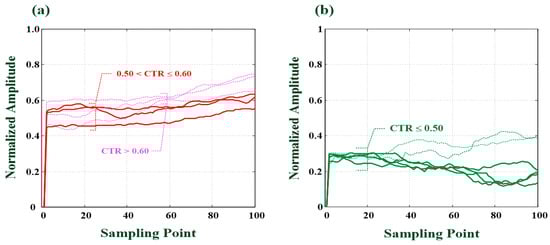
Figure 7.
Feature signals for cardiomegaly and normal condition. (a) Feature signals for cardiomegaly (CTR = 0.60, 0.56, and 0.52), (b) Feature signals for normal condition (CTR < 0.50).
Table 2.
Experimental results of 10-fold cross validation for the proposed multilayer classifier.
For the same training dataset, we could also establish a multilayer 2D CNN-based classifier, as a fully connecting topology network, consisting of a two-round 2D convolutional layer, a pooling layer, a flattening layer, and a fully connecting classification network (related classifier data are shown in Table 1). In the convolutional layer, two-round 2D convolutional processes with two 3 × 3 Kernel masks (with stride = 1) in each convolutional process were also used to enhance ROI and to filter unwanted noises. In the pooling and flattening layers, the maximum pooling process (with stride = 2) was used to reduce the dimension of the feature map from the convolutional layer and then to flatten the feature map in matrix form to the feature pattern in vector form from 100 × 200 and 25 × 50 to 1 × 1250. In the classification layer, we could establish a multilayer classifier, consisting of 1250 input nodes, 100 pattern nodes, four summation nodes, and three output nodes (Table 1). Table 3 shows the experimental results of 10-fold cross-validation tests, with an average precision (%) of 97.80% and an average recall (%) of 98.20% for predicting the possible cardiomegaly level and correctly identifying TP, respectively; an average accuracy of 98.00% for correctly identifying normal and cardiomegaly; and an average F1 score of 0.9799 for verifying the multilayer 2D CNN-based classifier. For each fold test, overall classifier’s computations took an average of 0.6380 s of CPU time to identify the possible pathology level. Compared with the experimental results of two classifiers, overall evaluation indexes of the multilayer 2D CNN-based classifier were slightly greater than the proposed multilayer classifier. However, the multilayer 2D CNN-based classifier would increase the computational complexity levels, such as the determination of the number of convolutional pooling layers and the size of convolutional masks and optimization (learning) of the algorithm required for training the CNN and addressing overfitting. In contrast to the multilayer 2D CNN-based classifier, the proposed multilayer classifier could be trained using less-labeled data and with real-time implementation. However, the multilayer 2D CNN-based classifier may not be feasible in real-time applications, due to its requirement of more feature parameters for training data, increased high computational complexity with iteration computations, and the need for a GPU to accelerate the training process and parallelize computations. Hence, under the same architecture, such as convolutional pooling layers and classification layer, the performance of the multilayer 1D CNN-based classifier was superior to that of the 2D CNN-based classifier, including simple linear weighted sums for the 1D convolutional process to deal with feature signals and straightforward mathematical operation with adaptive network parameter adjustment for performing pattern recognition tasks.
Table 3.
Experimental results of 10-fold cross-validation for multilayer 2D CNN-based classifier.
3.2. Discussion
We had developed a multilayer 1D CNN-based classifier using PA CXR image classification to screen the disease present in normal condition or cardiomegaly. Through experimental tests, 10-fold cross-validations were performed (as seen in Table 2 and Table 3). Promising results with an average precision of 97.80%, an average recall of 98.20%, an average accuracy of 98.00%, and an average F1 score of 0.9799 were used to evaluate the performance of the classifier. The performance of the proposed multilayer classifier was superior to that of the traditional multilayer 2D CNN-based classifier. Based on the manual inspection method, the results of CTR indexes were consistent with the possible pathology levels (as seen in Table 2 and Table 3), which had good accuracy for identifying the cardiomegaly levels. However, the manual inspection method was time consuming, and its diagnostic results were dependent on clinicians’ and radiologists’ experience. For automatic cardiomegaly level screening, segmentation-based methods, such as active shape model, pixel classification model, and Harris operator [41], could be used to segment the heart and lung regions. Then, the heart region (contour) could be localized to detect the heart boundaries and measure the CTR index for evaluating the enlarged heart or myocardial hypertrophy. In reference [41], a sensitivity of 77% and specificity of 76% were obtained in identifying the cardiomegaly levels. The 2D-CTR (ratio between the boundary perimeter of the heart region and the boundary perimeter of the entire thoracic region) [42] was more closely correlated with the cardiac function than the traditional CTR (as higher indexes for determining abnormality). In addition, as seen in Table 4, the deep learning-based methods, such as 2D U-Net, U-Net + Dense Conditional Random Field (CRF), XLSor model, X-RayNet model, and U-Net with VGG-16 encoding [13,43,44,45,46], were used to train a boundary segmentor to automatically segment heart and lung regions in a PA CXR image and then calculate the CTR index. The VGG-16 Model, U-Net-based CNN Algorithm, and CNN-based ResNet model [22,47,48,49,50] were also used to design a multi-label classifier for screening cardiomegaly images at borderline, moderate and severe levels (or cardiomegaly, and no-cardiomegaly). The abovementioned fully connected CNN-based models usually used more than 10 convolutional-pooling layers for performing the image preprocessing and postprocessing tasks to filter noise, enhance feature, extract features, and then increase the identification accuracy. Hence, these methods could provide a good image resolution and improve the performance for cardiomegaly screening; for example, in literature [13], with lung and heart segmentation and CTR estimation, higher sensitivity of 97% and negative predictive value of 96% for automatic CTR calculation; in literature [48], accuracy of greater than 93% for diagnosis and precise localization of cardiomegaly disease; in literature [49], accuracy of 92% and higher AUC of 0.9408 for detecting cardiomegaly. Hence, these multilayer CNN-based classifiers could provide a good solution for cardiomegaly level screening. However, excessive multi convolutional processes could lead to losing the position and the orientation of the desired object, and excessive multi pooling processes would lose valuable information relating to spatial relationships between features [51]. In addition, multi convolutional-pooling processes and training tasks with a large datasets must be performed with GPU hardware for complex computational processes. Therefore, we had modified the traditional 2D CNN-based multilayer classifier as a 1D CNN-based multilayer classifier to simplify the convolutional process and computational complexity level for performing pattern recognition tasks. Some advantages of the proposed classifier were shown below:
Table 4.
Comparison of the cardiomegaly level screening methods.
- the feature signals could be enhanced by two-round 1D convolutional processes;
- the different cardiomegaly levels could be quantified by two-round 1D convolutional processes which could be used to separate normal from mild/moderate or severe levels (as seen in Figure 7);
- the dimension of feature signals could also be reduced by 1D downsampling process to address the overfitting problems;
- the CRA-based classifier performs classification task with straightforward mathematic operations without complex iteration computations and learning algorithm requirement.
The abovementioned proposed method and other deep-learning-based methods had promising results for heart and lung heart segmentation [13,42,44,45] and diagnosis and localization of cardiomegaly diseases [46,48,49,50]. However, there were some limitations: for example, these methods were designed to be used for their medical purpose in automatic cardiomegaly screening in CXR images and CTR estimation, which could further expand their indications to identify other pathologies in CXR images; and these studies only selected the CXR images of normal and cardiomegaly from other pathologies, such as pneumonia, pleural effusion, pulmonary fibrosis, and pericardium, which would affect the classifier’s ability to achieve our medical purpose. In addition, our proposed classifier could offer promising results in cardiomegaly levels screening, and had a limitation in identifying heart enlargement or myocardial hypertrophy. Hence, the determination of the heart size, such as four chambers (ventricles and atriums), could be evaluated by using CECHO, CCT, and CMRI imaging techniques [1,2,3,4]. For first-line examination with chest radiography, the proposed method could rapidly screen cardiomegaly levels and then help provide more attention on follow-up examination and treatment.
4. Conclusions
In clinical applications, imaging examinations, such as CECHO, CCT, and CMRI [1,2,3,4], were superior to PA CXR in accurately evaluating the heart chamber size and determining the heart chamber, which showed promising sensitivity and specificity in determining cardiac chamber sizes and high correlation between CTR indexes and heart sizes. Based on PA CXR imaging classification, the proposed multilayer classifier could directly screen the cardiomegaly levels in preliminary imaging examination. Hence, through experimental tests, we obtained a high F1 score (>95%) and PPV index (>80%) for screening the normal condition and cardiomegaly, respectively. This method could replace the manual inspection technique for specific tasks requiring expertise and experience in medical image examinations. We could continuously develop its intended medical purpose in real-world application by using the adaptive pattern recognition scheme with a new training dataset, such as clinical data, the JSRT database, or the ChestX-ray8 database.
Author Contributions
Conceptualization: C.-H.L., C.-D.K. and C.-C.P.; analysis and materials: C.-H.L., N.-S.P., P.-Y.C., J.-X.W. and F.-Z.Z.; data analysis: C.-H.L., P.-Y.C., J.-X.W. and F.-Z.Z.; writing—original draft preparation: C.-H.L., N.-S.P., P.-Y.C. and J.-X.W.; writing—review and editing: C.-H.L., N.-S.P. and C.-D.K.; supervision: C.-H.L., N.-S.P. and C.-D.K.; funding acquisition: C.-H.L., C.-D.K. All authors have read and agreed to the published version of the manuscript.
Funding
This work was supported by the Ministry of Science and Technology, Taiwan, under contract number: MOST 110-2221-E-167-005 and MOST 110-2221-E-006-043, duration: 1 August 2021–31 July 2022.
Institutional Review Board Statement
Not applicable.
Informed Consent Statement
Informed consent was obtained from all subjects involved in the study.
Data Availability Statement
The chest X-ray images are enrolled from the NIH (National Institutes of Health, NIH) Clinical Center database for training the proposed classifier and validating the classifier’s performance.
Conflicts of Interest
The authors declare no conflict of interest.
References
- Schlett, C.L.; Kwait, D.C.; Mahabadi, A.A.; Bamberg, F.; O’Donnell, C.J.; Fox, C.S.; Hoffmann, U. Simple area-based measurement for multidetector computed tomography to predict left ventricular size. Eur. Radiol. 2010, 20, 1590–1596. [Google Scholar] [CrossRef] [PubMed]
- Centurión, O.A.; Scavenius, K.E.; Miño, L.M.; Sequeira, O.R. Evaluating cardiomegaly by radiological cardiothoracic ratio as compared to conventional echocardiography. J. Cardiol. Curr. Res. 2017, 9, 00319. [Google Scholar]
- Hota, P.; Simpson, S. Going beyond cardiomegaly: Evaluation of cardiac chamber enlargement at non-electrocardiographically gated multidetector CT: Current techniques, limitations, and clinical implications. Radiol. Cardiothorac. Imaging 2019, 1, e180024. [Google Scholar] [CrossRef]
- Malik, S.B.; Kwan, D.; Shah, A.B.; Hsu, J.Y. The Right Atrium: Gateway to the Heart—Anatomic and Pathologic Imaging Findings. Radiographics 2015, 35, 14–31. [Google Scholar] [CrossRef] [PubMed]
- Nation Institutes of Health (NIH). Clinical Center, Images Are Available via Box. 2019. Available online: https://Nihcc.app.box.com/v/ChestXray-NIHCC (accessed on 1 June 2018).
- Wang, X.; Peng, Y.; Lu, L.; Lu, Z.; Bagheri, M.; Summers, R.M. ChestX-ray8: Hospital-scale chest X-ray database and benchmarks on weakly-supervised classification and localization of common thorax diseases. In Proceedings of the 2017 IEEE Conference on Computer Vision and Pattern Recognition (CVPR), Honolulu, HI, USA, 21–26 July 2017. [Google Scholar]
- Japanese Society of Radiological Technology. Digital Image Database-JSRT Database. 2004. Available online: http://db.jsrt.or.jp/eng.php (accessed on 1 February 2021).
- Shiraishi, J.; Katsuragawa, S.; Ikezoe, J.; Matsumoto, T.; Kobayashi, T.; Komatsu, K.-I.; Matsui, M.; Fujita, H.; Kodera, Y.; Doi, K. Development of a digital image database for chest radiographs with and without a lung nodule: Receiver operating characteristic analysis of radiologists’ detection of pulmonary nodules. Amer. J. Roentgenol. 2000, 174, 71–74. [Google Scholar] [CrossRef] [PubMed]
- Han, W.K.; Zaki, N.M.; Ali, L. Intelligent Pneumonia Identification From Chest X-rays: A Systematic Literature Review. IEEE Access 2021, 9, 51747–51771. [Google Scholar]
- Jaeger, S.; Candemir, S.; Antani, S.; Wáng, Y.-X.; Lu, P.-X.; Thoma, G. Two public chest X-ray datasets for computer-aided screening of pulmonary diseases. Quant. Imaging Med. Surg. 2014, 4, 475–477. [Google Scholar]
- Quinton, S.; Ker, J.; Rheeder, P.; Deffur, A. The reliability of chest radiographs in predicting left atrial enlargement. Cardiovasc. J. Afr. 2010, 21, 274–279. [Google Scholar] [CrossRef][Green Version]
- Sanchita, S.-P.; Sehrish, J.; Zilla, H. An atypical case of dysphagia: Left atrial enlargement. Am. J. Gastroenterol. 2018, 113, S1013–S1014. [Google Scholar]
- Li, Z.; Hou, Z.; Chen, C.; Hao, Z.; An, Y.; Liang, S.; Lu, B. Automatic Cardiothoracic Ratio Calculation with Deep Learning. IEEE Access 2019, 7, 37749–37756. [Google Scholar] [CrossRef]
- Simkus, P.; Gimeno, M.G.; Banisauskaite, A.; Noreikaite, J.; McCreavy, D.; Penha, D.; Arzanauskaite, M. Limitations of cardiothoracic ratio derived from chest radiographs to predict real heart size: Comparison with magnetic resonance imaging. Insights Imaging 2021, 12, 158. [Google Scholar] [CrossRef] [PubMed]
- Truszkiewicz, K.; Poręba, R.; Gać, P. Radiological Cardiothoracic Ratio in Evidence-Based Medicine. J. Clin. Med. 2021, 10, 2016. [Google Scholar] [CrossRef] [PubMed]
- Lin, C.-H.; Wu, J.-X.; Li, C.-M.; Chen, P.-Y.; Pai, N.-S.; Kuo, Y.-C. Enhancement of Chest X-ray Images to Improve Screening Accuracy Rate Using Iterated Function System and Multilayer Fractional-Order Machine Learning Classifier. IEEE Photon. J. 2020, 12, 1–18. [Google Scholar] [CrossRef]
- Lu, J.-Y.; Lee, P.-Y.; Huang, C.-C. Improving Image Quality for Single-Angle Plane Wave Ultrasound Imaging with Convolutional Neural Network Beamformer. IEEE Trans. Ultrason. Ferroelectr. Freq. Control 2022, 69, 1326–1336. [Google Scholar] [CrossRef] [PubMed]
- Shelhamer, E.; Long, J.; Darrell, T. Fully convolutional networks for semantic segmentation. IEEE Trans. Pattern Anal. Mach. Intell. 2017, 39, 640–651. [Google Scholar] [CrossRef] [PubMed]
- Que, Q.; Tang, Z.; Wang, R.; Zeng, Z.; Wang, J.; Chua, M.; Gee, T.S.; Yang, X.; Veeravalli, B. CardioXNet: Automated detection for cardiomegaly based on deep learning. In Proceedings of the 2018 40th Annual International Conference of the IEEE Engineering in Medicine and Biology Society (EMBC), Honolulu, HI, USA, 18–21 July 2018; pp. 612–615. [Google Scholar]
- Rajpurkar, P.; Irvin, J.; Zhu, K.; Yang, B.; Mehta, H.; Duan, T.; Ding, D.; Bagul, A.; Langlotz, C.; Shpanskaya, K.; et al. CheXNet: Radiologist-level pneumonia detection on chest X-rays with deep learning. arXiv 2017, arXiv:1711.05225. [Google Scholar]
- Mortazi, A.; Rashed, K.; Kawal, R.; Jeremy, B.; Ulas, B. CardiacNET: Segmentation of left atrium and proximal pulmonary veins from MRI using multi-view CNN. In Proceedings of the International Conference on Medical Image Computing and Computer-Assisted Intervention, Quebec City, QC, Canada, 11–13 September 2017; pp. 377–385. [Google Scholar]
- He, K.; Zhang, X.; Ren, S.; Sun, J. Deep residual learning for image recognition. In Proceedings of the 2016 IEEE Conference on Computer Vision and Pattern Recognition (CVPR), Las Vegas, NV, USA, 27–30 June 2016; Volume 1, pp. 770–778. [Google Scholar]
- Drozdzal, M.; Vorontsov, E.; Chartrand, G.; Kadoury, S.; Pal, C. The Importance of Skip Connections in Bio-Medical Image Segmentation; Lecture Notes in Computer Science; Springer International Publishing AG: Basel, Switzerland, 2016. [Google Scholar]
- Ullah, A.; Anwar, S.M.; Bilal, M.; Mehmood, R.M. Classification of arrhythmia by using deep learning with 2-D ECG spectral image representation. Remote Sens. 2020, 12, 1685. [Google Scholar] [CrossRef]
- Kiranyaz, S.; Avci, O.; Abdeljaber, O.; Ince, T.; Gabbouj, M.; Inman, D.J. 1D convolutional neural networks and applications: A survey. Mech. Syst. Signal Processing 2021, 151, 107398. [Google Scholar] [CrossRef]
- Wu, Y.; Yang, F.; Liu, Y.; Zha, X.; Yuan, S. A comparison of 1-D and 2-D deep convolutional neural networks in ECG classification. In Proceedings of the 2018 40th Annual International Conference of the IEEE Engineering in Medicine and Biology Society, Honolulu, HI, USA, 17–21 July 2018. [Google Scholar]
- Lin, C.-H.; Wu, J.-X.; Kan, C.-D.; Chen, P.-Y.; Chen, W.-L. Arteriovenous shunt stenosis assessment based on empirical mode decomposition and 1D convolutional neural network: Clinical trial stage. Biomed. Signal Processing Control 2021, 66, 102461. [Google Scholar] [CrossRef]
- Chen, P.-Y.; Sun, Z.-L.; Wu, J.-X.; Pai, C.C.; Li, C.-M.; Lin, C.-H.; Pai, N.-S. Photoplethysmography analysis with Duffing–Holmes self-synchronization dynamic errors and 1D CNN-based classifier for upper extremity vascular disease screening. Processes 2021, 9, 2093. [Google Scholar] [CrossRef]
- Chang, H.-Y.; Yeh, C.-Y.; Lee, C.-T.; Lin, C.-C. A sleep apnea detection system based on a one-dimensional deep convolution neural network model using single-lead electrocardiogram. Sensors 2020, 20, 4157. [Google Scholar] [CrossRef] [PubMed]
- Syntax: Conv, 1994–2021. Available online: https://www.mathworks.com/help/matlab/ref/conv.html (accessed on 1 January 2021).
- Sequence-to-Sequence Classification Using 1-D Convolutions, 1994–2021. Available online: https://www.mathworks.com/help/deeplearning/ug/sequence-to-sequence-classification-using-1-d-convolutions.html (accessed on 1 January 2021).
- Wua, Y.; Zhou, F.; Kong, J. Innovative design approach for product design based on TRIZ, AD, fuzzy and Grey relational analysis. Comput. Ind. Eng. 2020, 140, 106276. [Google Scholar] [CrossRef]
- Sarrafa, F.; Nejadb, S.H. Improving performance evaluation based on balanced scorecard with grey relational analysis and data envelopment analysis approaches: Case study in water and wastewater companies. Eval. Program Plan. 2020, 79, 101762. [Google Scholar] [CrossRef] [PubMed]
- Baltruschat, I.M.; Nickisch, H.; Grass, M.; Knopp, T.; Saalbach, A. Comparison of deep learning approaches for multi-label chest X-ray classification. Sci. Rep. 2019, 9, 6381. [Google Scholar] [CrossRef]
- Lin, C.-H. Classification enhancible grey relational analysis for cardiac arrhythmias discrimination. Med. Biol. Eng. Comput. 2006, 44, 311–320. [Google Scholar] [CrossRef]
- Chicco, D.; Jurman, G. The advantages of the Matthews correlation coefficient (MCC) over F1 score and accuracy in binary classification evaluation. BMC Genom. 2020, 21, 6. [Google Scholar] [CrossRef]
- Xu, C.; Prince, J.L. Snakes, shapes, and gradient vector flow. IEEE Trans. Image Processing 1998, 7, 359–369. [Google Scholar]
- Wu, J.-X.; Liu, H.-C.; Chen, P.-Y.; Lin, C.-H.; Chou, Y.-H.; Shung, K.K. Enhancement of ARFI-VTI elastography images in order to preliminary rapid screening of benign and malignant breast tumors using multilayer fractional-order machine vision classifier. IEEE Access 2020, 8, 164222–164237. [Google Scholar] [CrossRef]
- Syntax: Contour, 1994–2020, The MathWorks, Inc. Available online: https://www.Mathworks.com/help/matlab/ref/contour.html?searchHighlight=contour&s_tid=srchtitle#mw_79566ff3-439e-493a-8404-f3d2b857d01d (accessed on 1 January 2020).
- Sogancioglu, E.; Murphy, K.; Calli, E.; Scholten, E.T.; Schalekamp, S.; van Gnneken, B. Cardiomegaly detection on chest radiographs: Segmentation versus classification. IEEE Access 2020, 8, 94631–94642. [Google Scholar] [CrossRef]
- Candemir, S.; Jaeger, S.; Lin, W.; Xue, Z.; Antani, S.; Thoma, G. Automatic heart localization and radiographic index computation in chest X-rays. In Proceedings of the 2019 Computer-Aided Diagnosis in Medical Imaging, Bellingham, WA, USA, 24 March 2016; Volume 9785. [Google Scholar]
- Lee, M.S.; Kim, Y.S.; Kim, M.; Usman, M.; Byon, S.S.; Kim, S.H.; Lee, B.I.; Lee, B.-D. Evaluation of the feasibility of explainable computer-aided detection of cardiomegaly on chest radiographs using deep learning. Sci. Rep. 2021, 11, 16885. [Google Scholar] [CrossRef]
- Tang, Y.-B.; Tang, Y.-X.; Xiao, J.; Summers, R.M. XLsor: A robust and accurate lung segmentor on chest-X-rays using Criss-Cross attention and customized radiorealistic abnormalities generation. Proceeding Mach. Learn. Res. 2019, 102, 457–467. [Google Scholar]
- Arsalan, M.; Owais, M.; Mahmood, T.; Choi, J.; Park, K.R. Artificial intelligence-based diagnosis of cardiac and related diseases. J. Clin. Med. 2020, 9, 871. [Google Scholar] [CrossRef] [PubMed]
- Saiviroonporn, P.; Rodbangyang, K.; Tongdee, T.; Chaisangmongkon, W.; Yodprom, P.; Siriapisith, T.; Wonglaksanapimon, S.; Thiravit, P. Cardiothoracic ratio measurement using artifcial intelligence: Observer and method validation studies. BMC Med. Imaging 2021, 21, 95. [Google Scholar] [CrossRef] [PubMed]
- Candemir, S.; Rajaraman, S.; Thoma, G.; Antani, S. Deep learning for grading cardiomegaly severity in chest X-rays: An investigation. In Proceedings of the 2018 IEEE Life Sciences Conference, Montreal, QC, Canada, 28–30 October 2018. [Google Scholar]
- Simonyan, K.; Zisserman, A. Very deep convolutional networks for large-scale image recognition. In Proceedings of the 3rd International Conference on Learning Representations, ICLR 2015, San Diego, CA, USA, 7–9 May 2015. [Google Scholar]
- Bouslama, A.; Laaziz, Y.; Tali, A. Diagnosis and precise localization of cardiomegaly disease using U-NET. Inform. Med. Unlocked 2020, 19, 100306. [Google Scholar] [CrossRef]
- Islam, M.T.; Aowal, M.A.; Minhaz, A.T.; Ashraf, K. Abnormality detection and localization in chest X-rays using deep convolutional neural networks. Computer Vision and Pattern Recognition. arXiv 2017, arXiv:1705.09850. [Google Scholar]
- Yoo, H.; Han, S.; Chung, K. Diagnosis support model of cardiomegaly based on CNN using ResNet and explainable feature map. IEEE Access 2021, 9, 55802–55813. [Google Scholar] [CrossRef]
- Wang, E.; Jiang, Y.; Li, Y.; Yang, J.; Ren, M.; Zhang, Q. MFCSNet: Multi-scale deep features fusion and cost-sensitive loss function based segmentation network for remote sensing images. Appl. Sci. 2019, 9, 4043. [Google Scholar] [CrossRef]
Publisher’s Note: MDPI stays neutral with regard to jurisdictional claims in published maps and institutional affiliations. |
© 2022 by the authors. Licensee MDPI, Basel, Switzerland. This article is an open access article distributed under the terms and conditions of the Creative Commons Attribution (CC BY) license (https://creativecommons.org/licenses/by/4.0/).