
Wind Turbine Noise Behaviorally and Physiologically Changes Male Frogs


Abstract
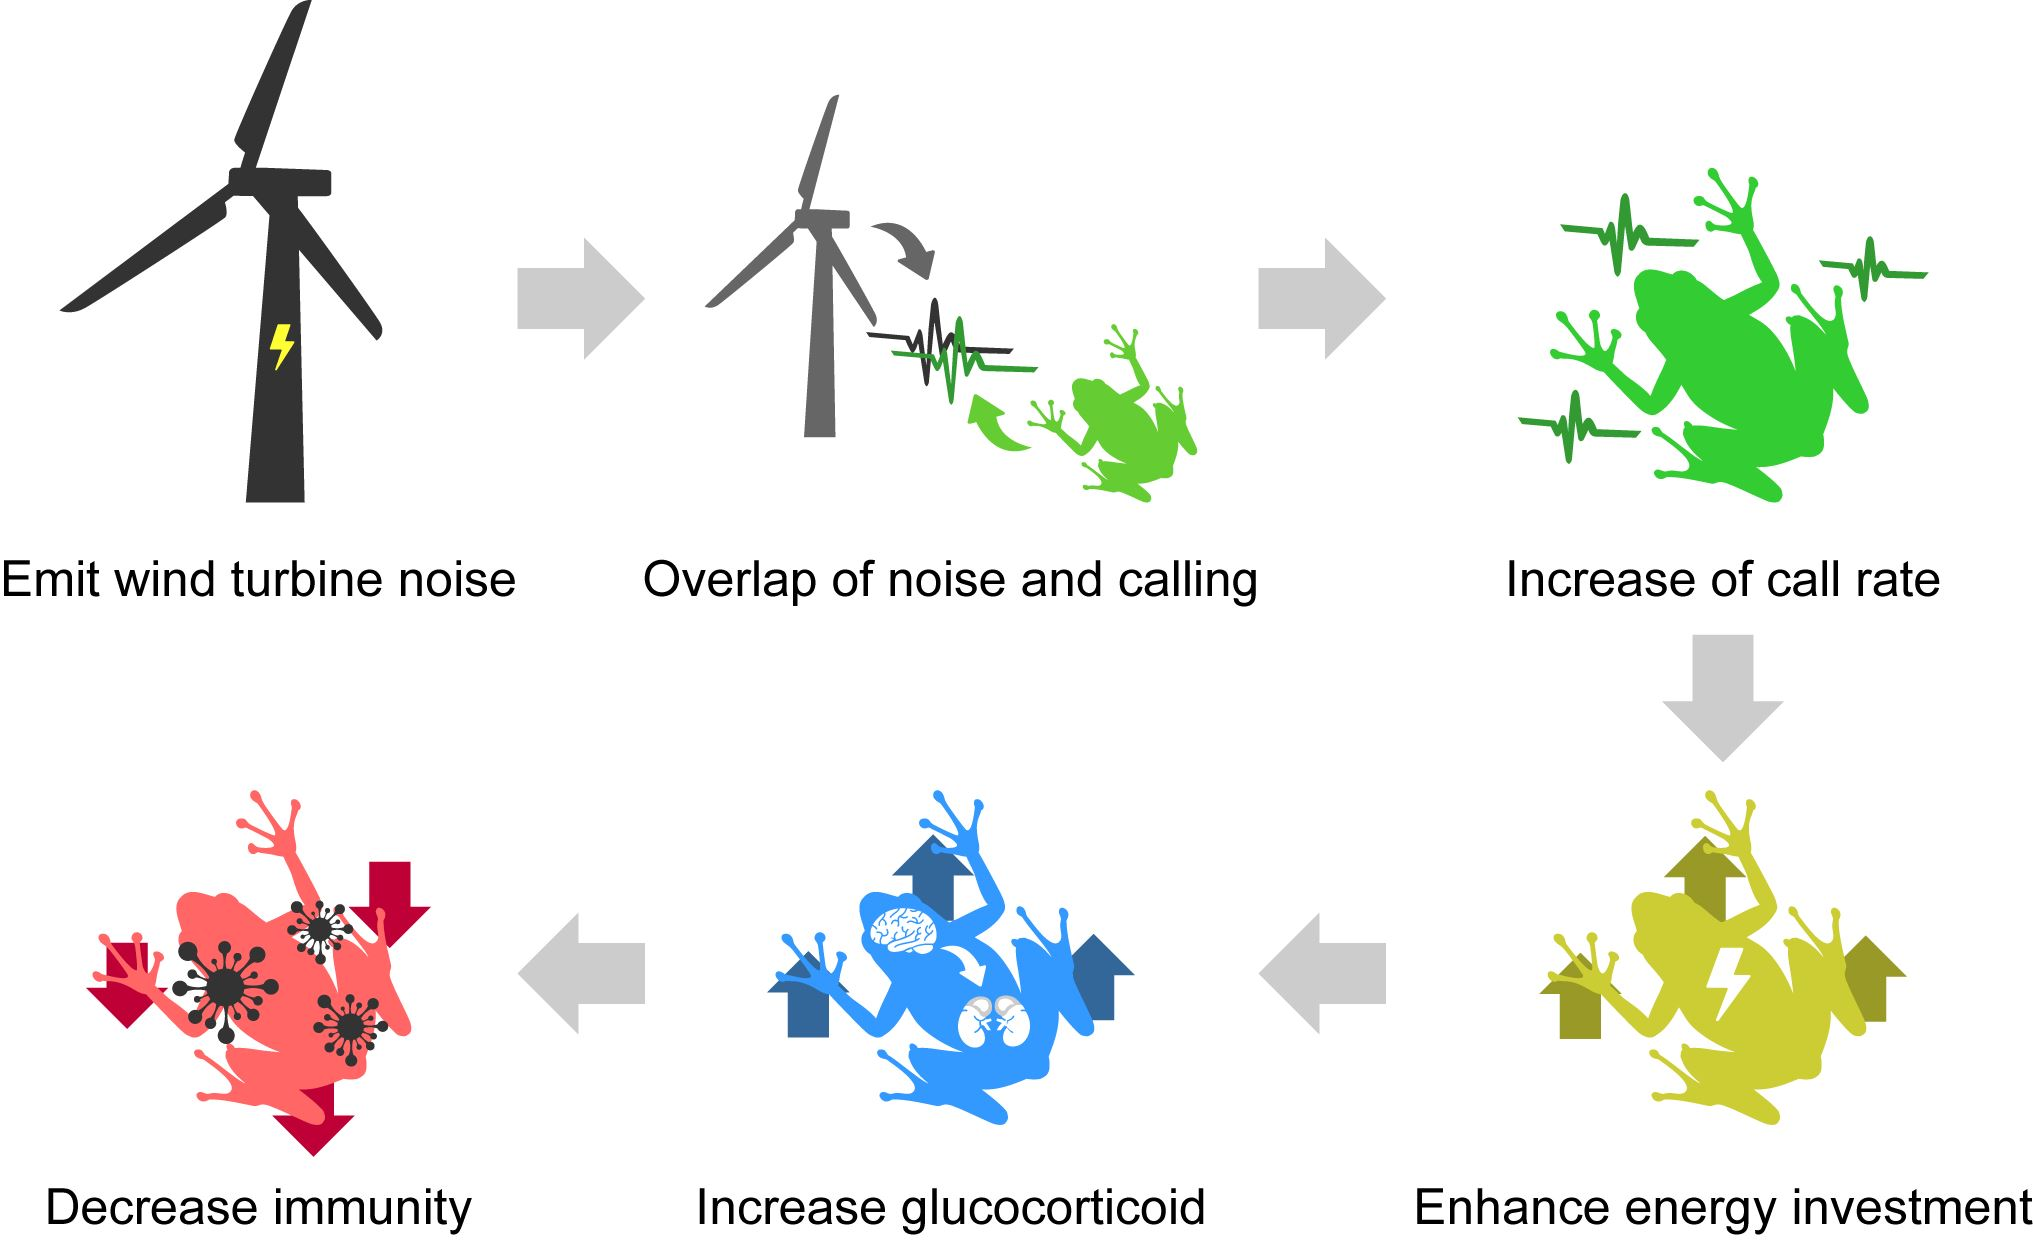
:Simple Summary
Abstract

1. Introduction
2. Materials and Methods
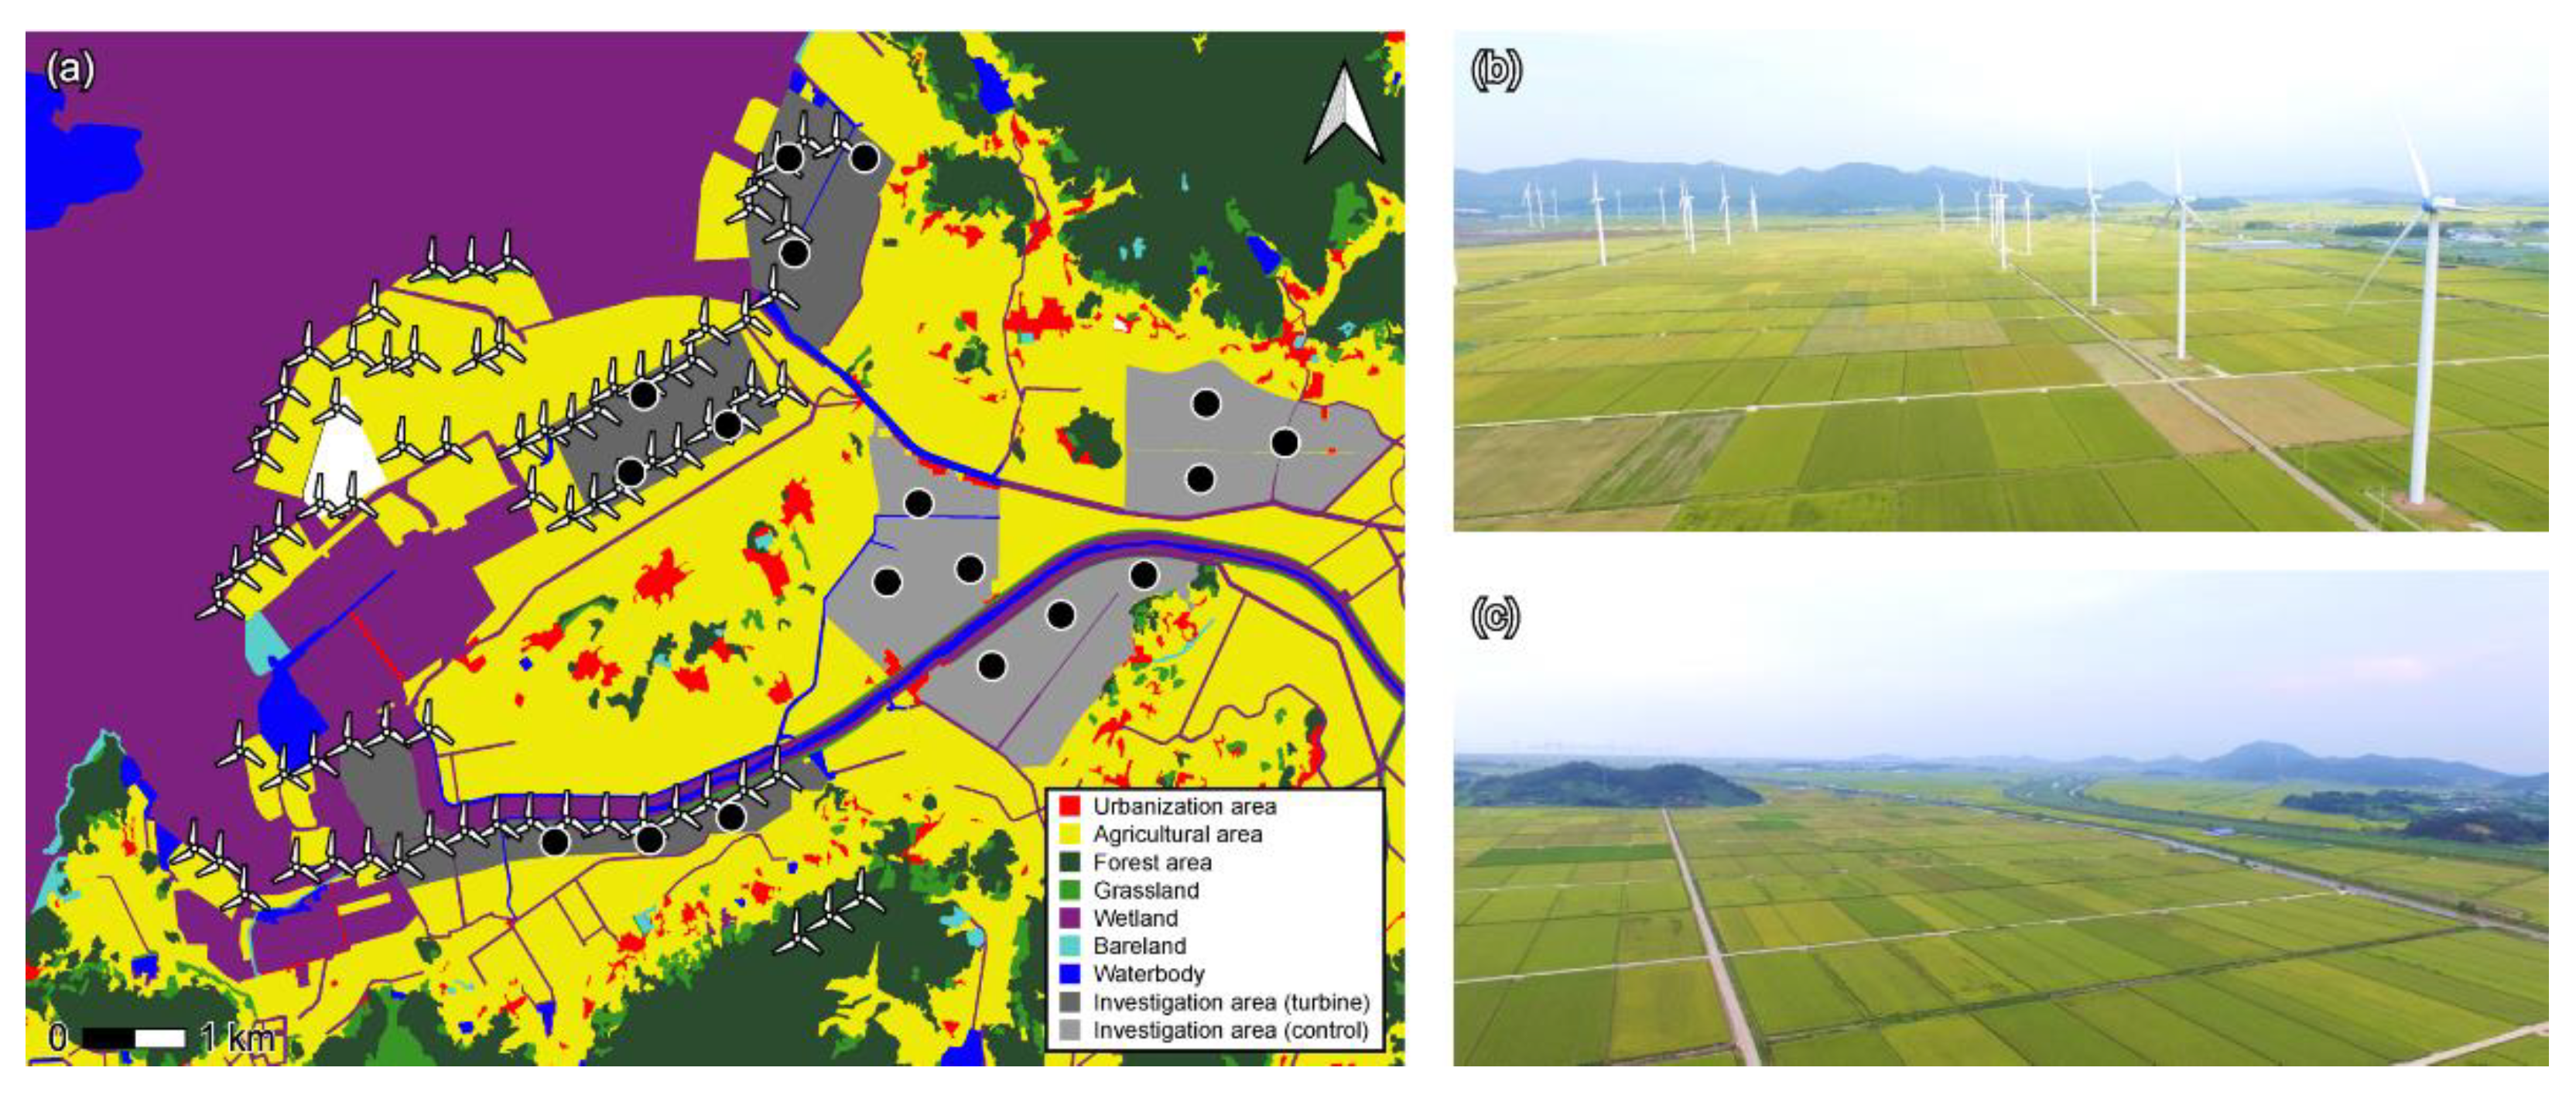
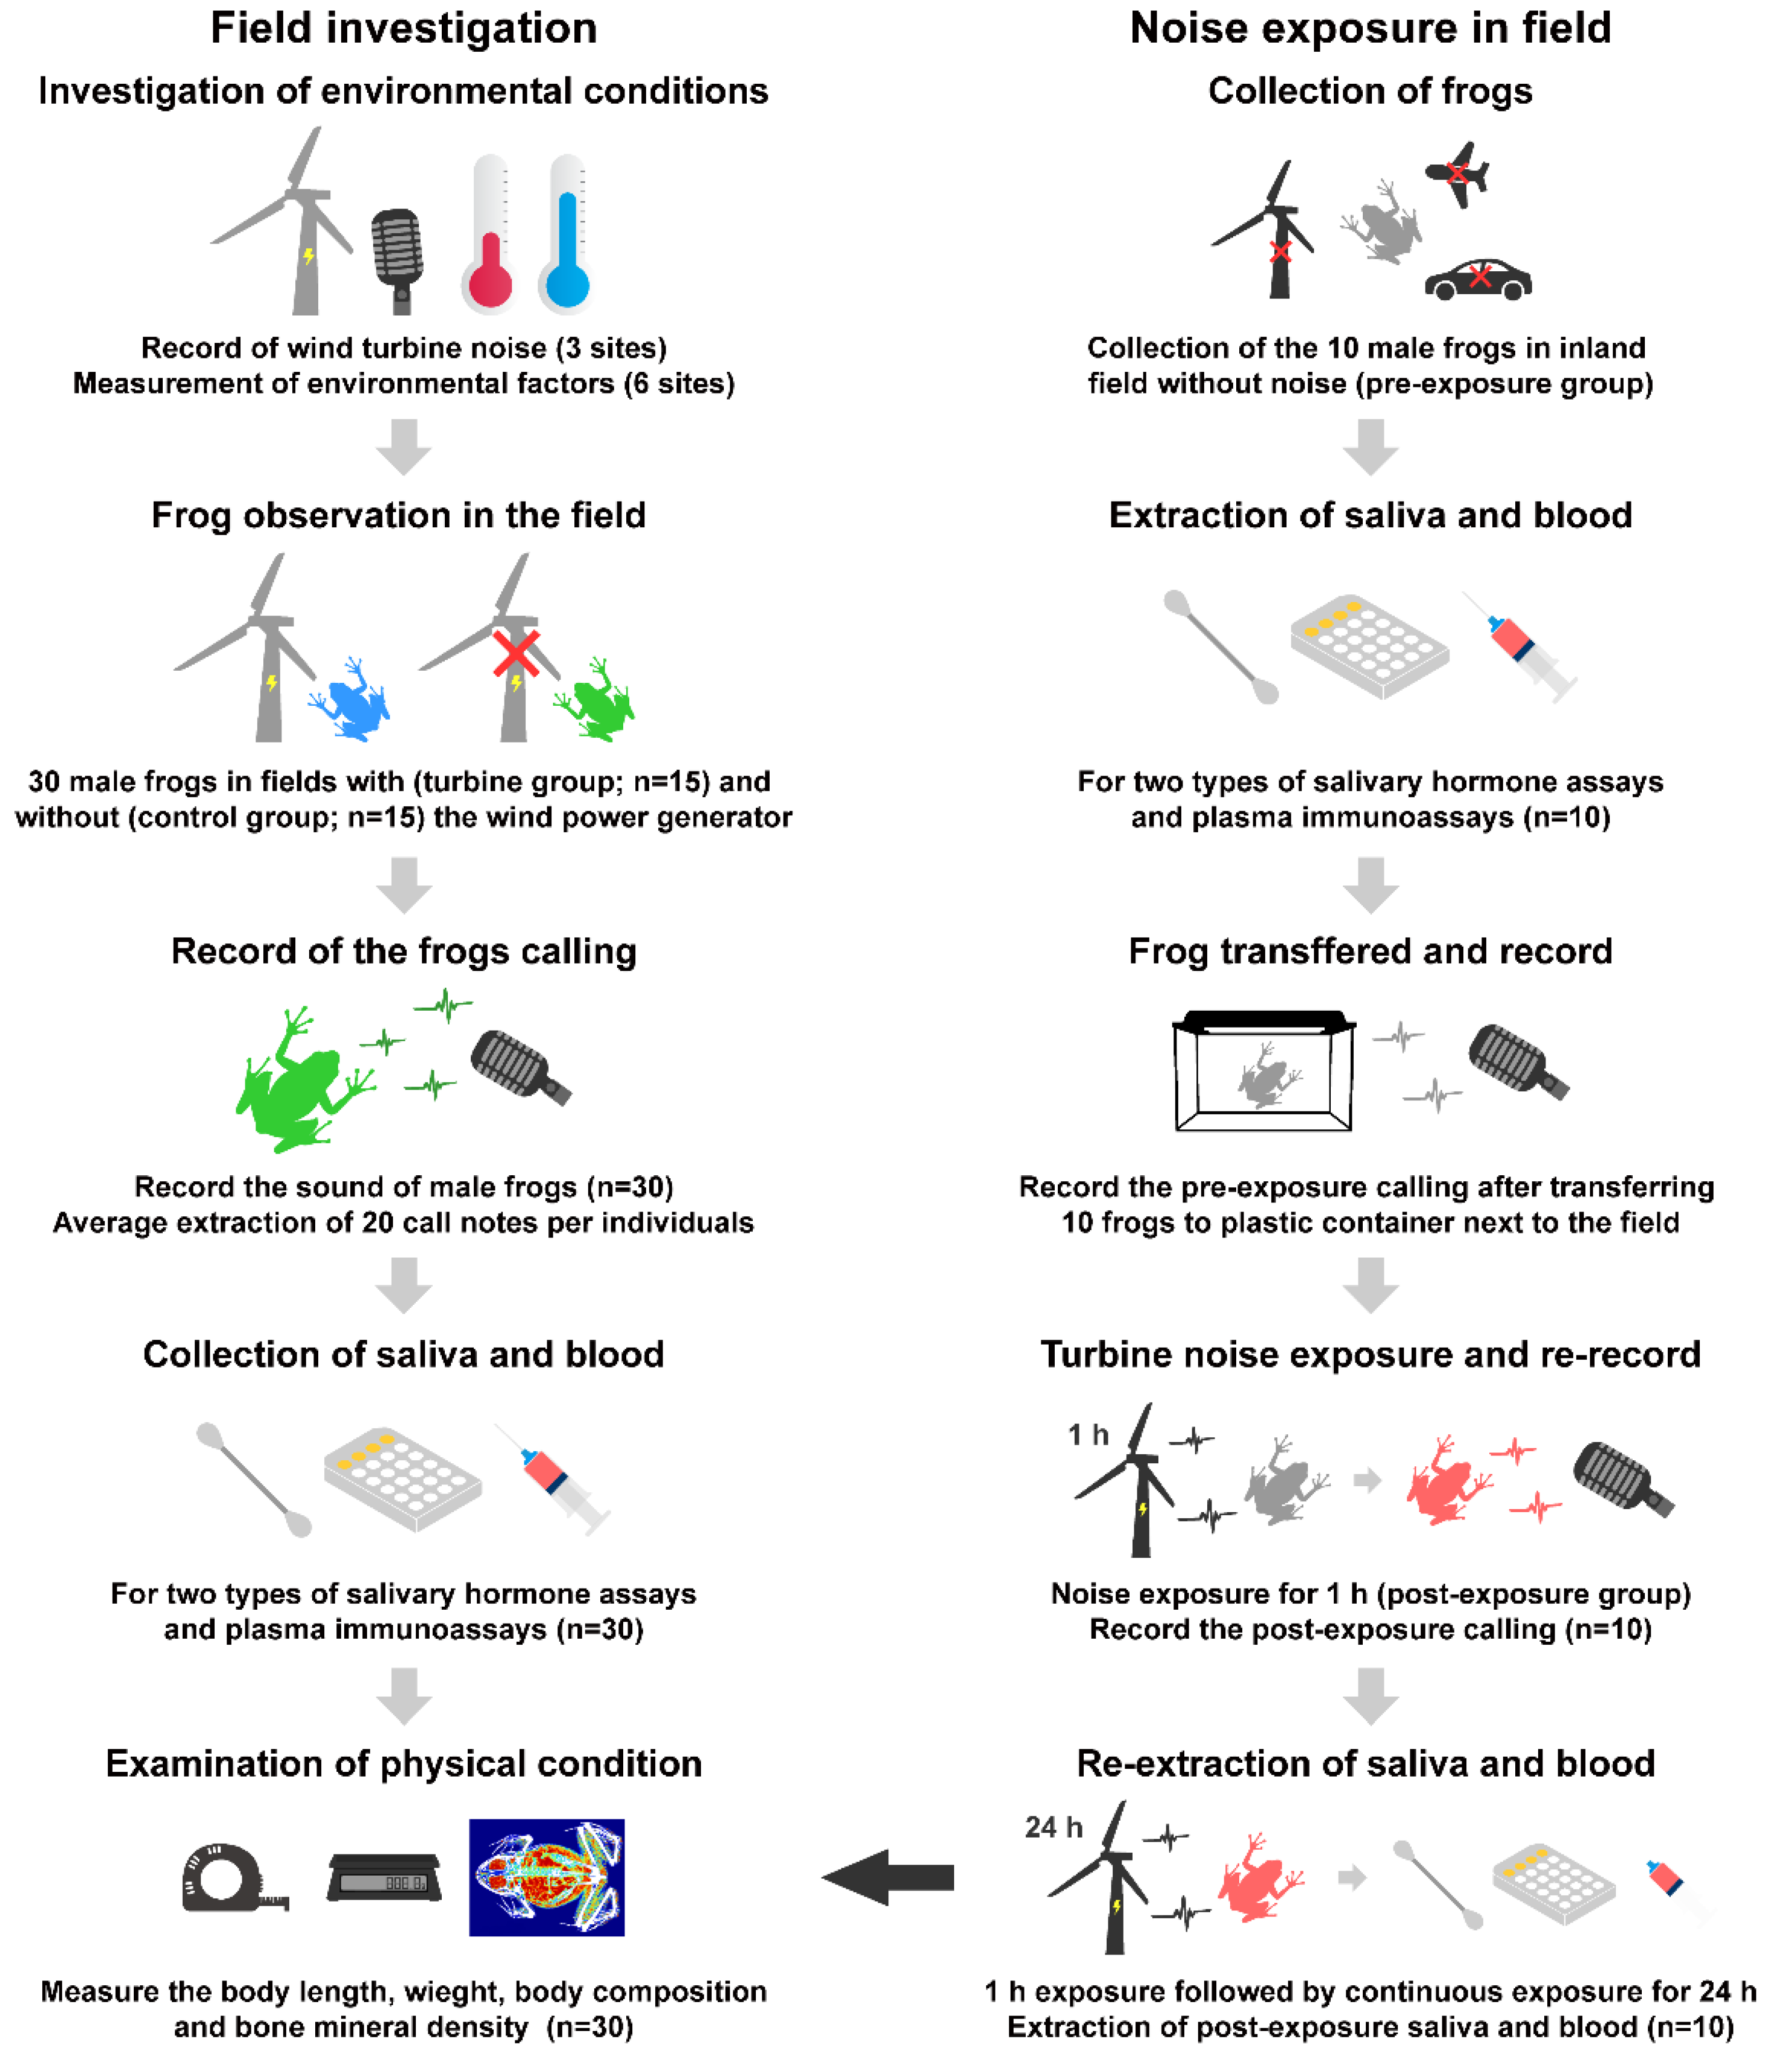
2.1. Field Investigation
2.2. Sample Collection in Field
2.3. Noise Exposure Experiment in the Field
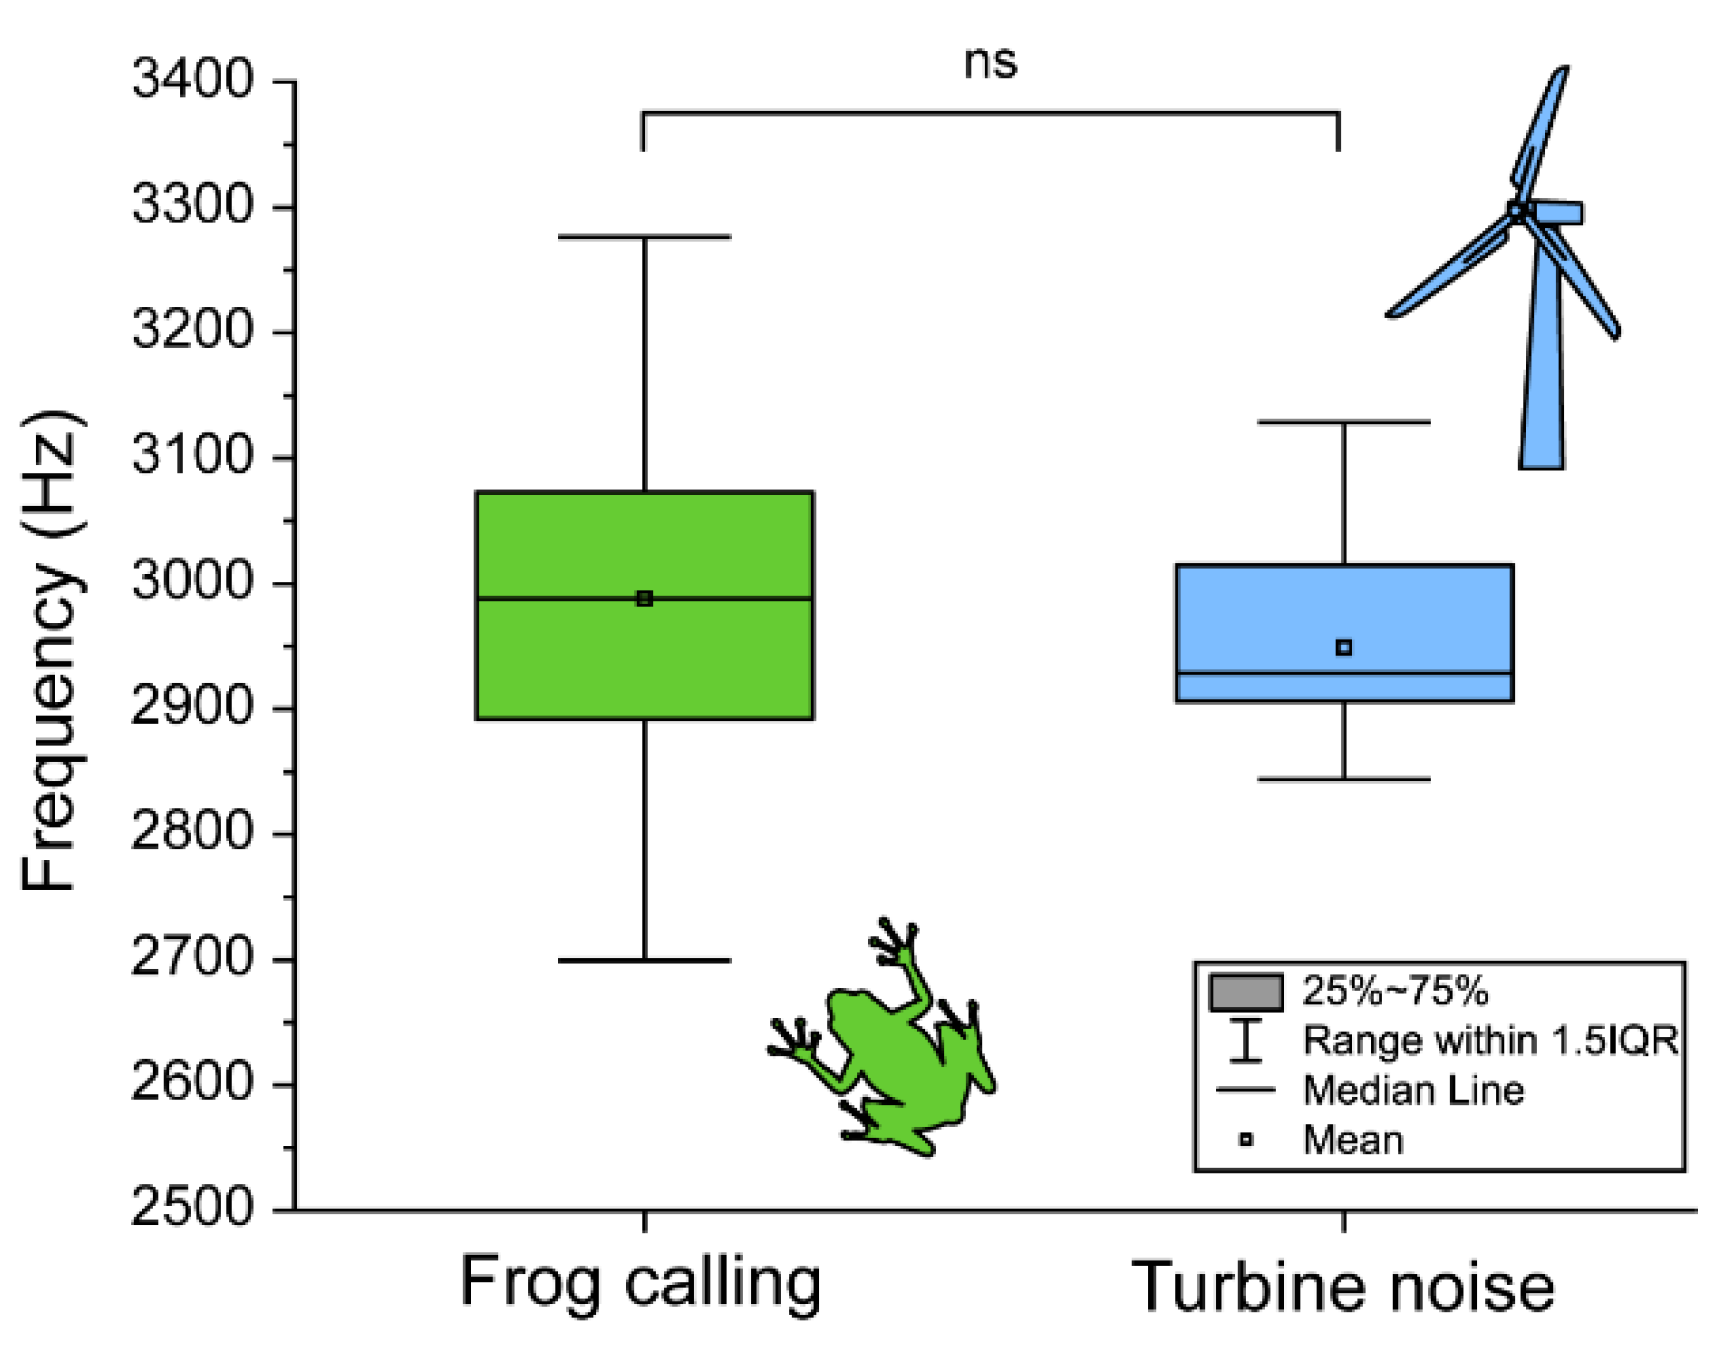
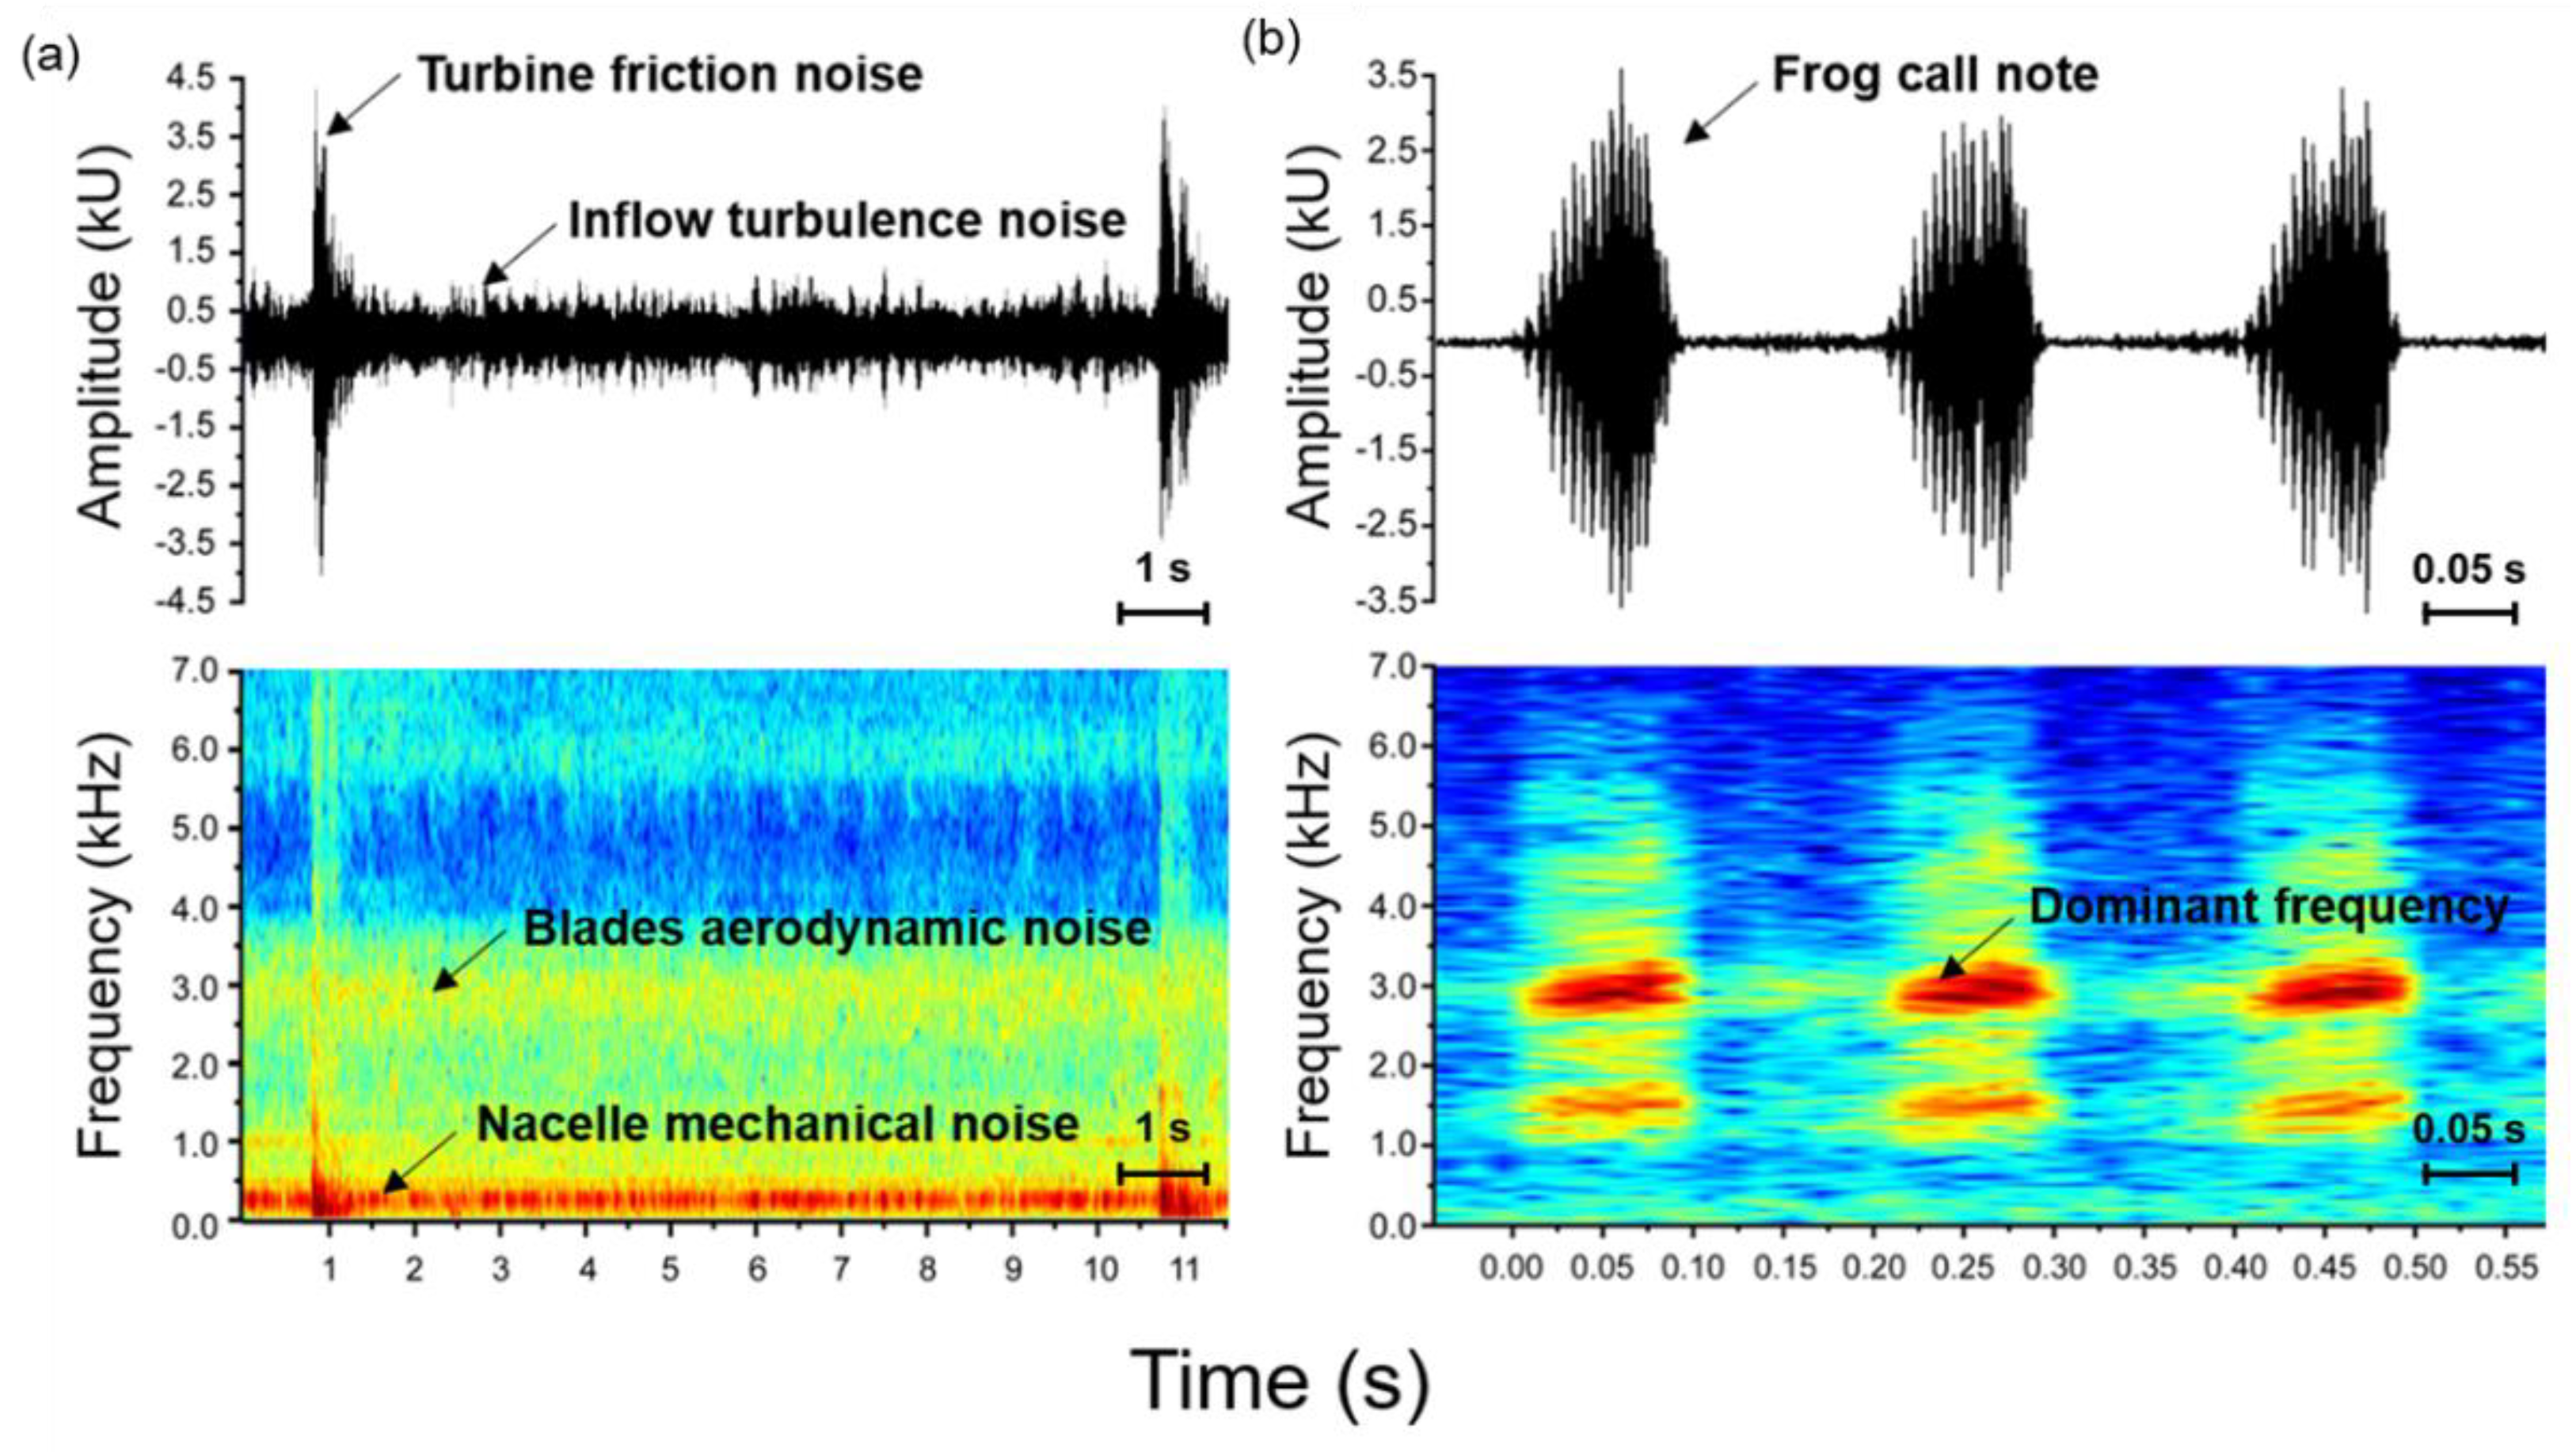
2.4. Call and Noise Recording and Sound Analysis
2.5. Saliva Extraction and Salivary Hormone Assay
2.6. Bacterial Killing Assay Using Plasma
2.7. Statistical Analysis
3. Results
3.1. Environment of Experimental Sites and Basic Physical Information of Frogs
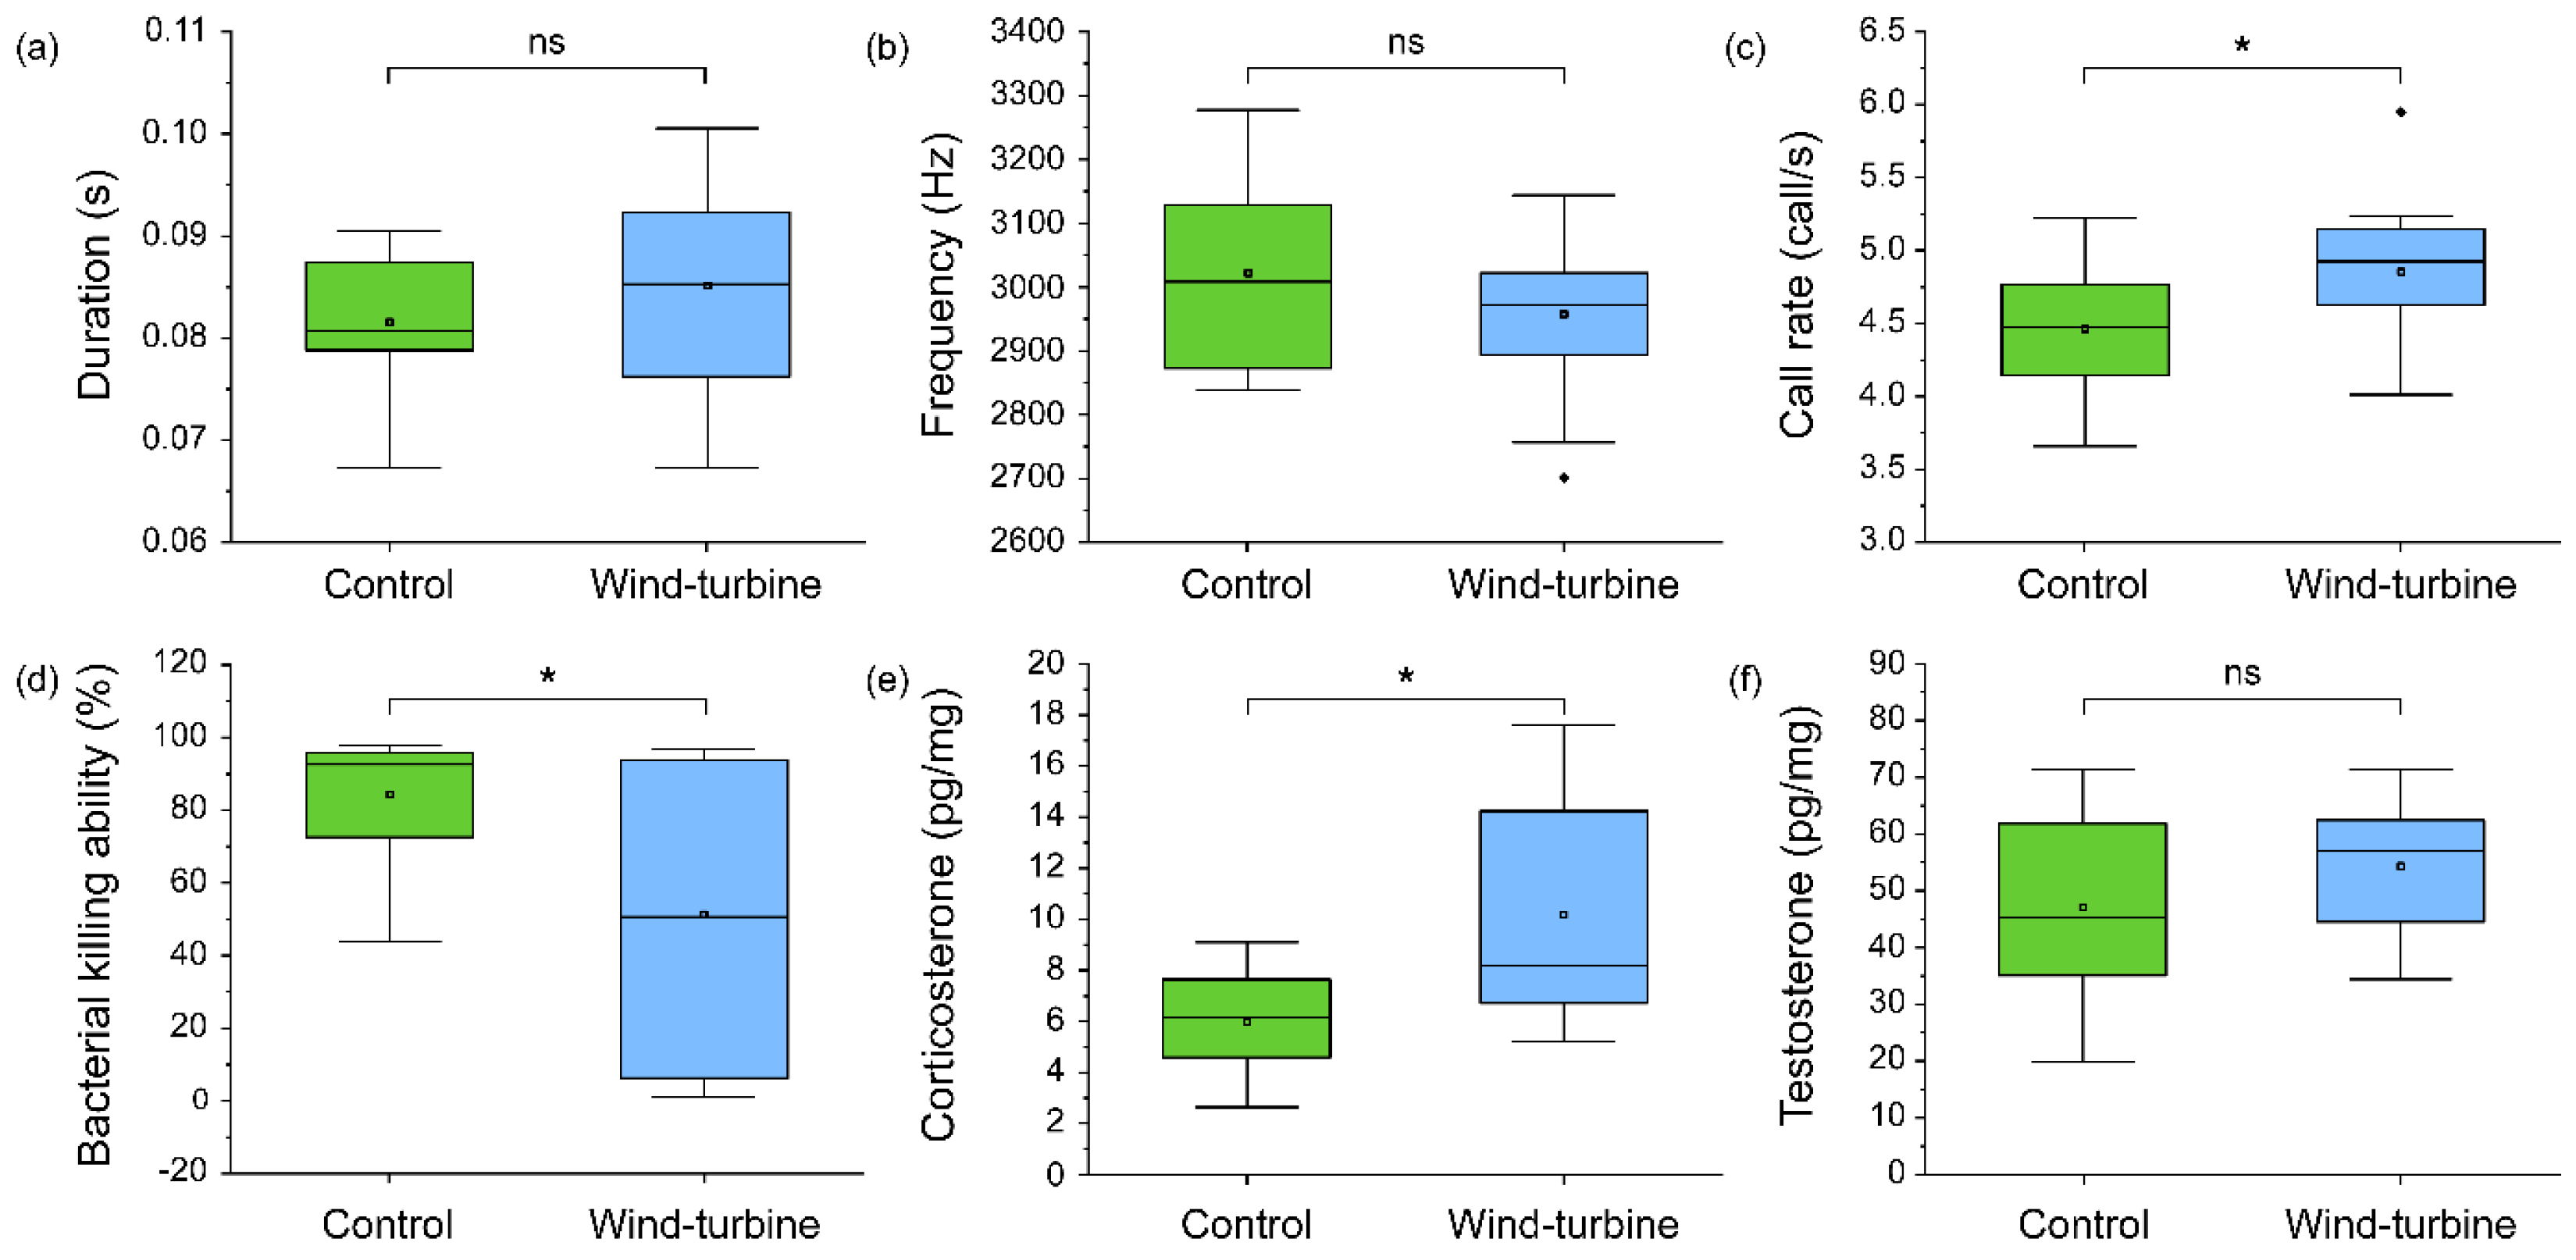
3.2. Difference in the Calling Pattern, Steroid Hormones, and Immunity from the Field Investigation Group
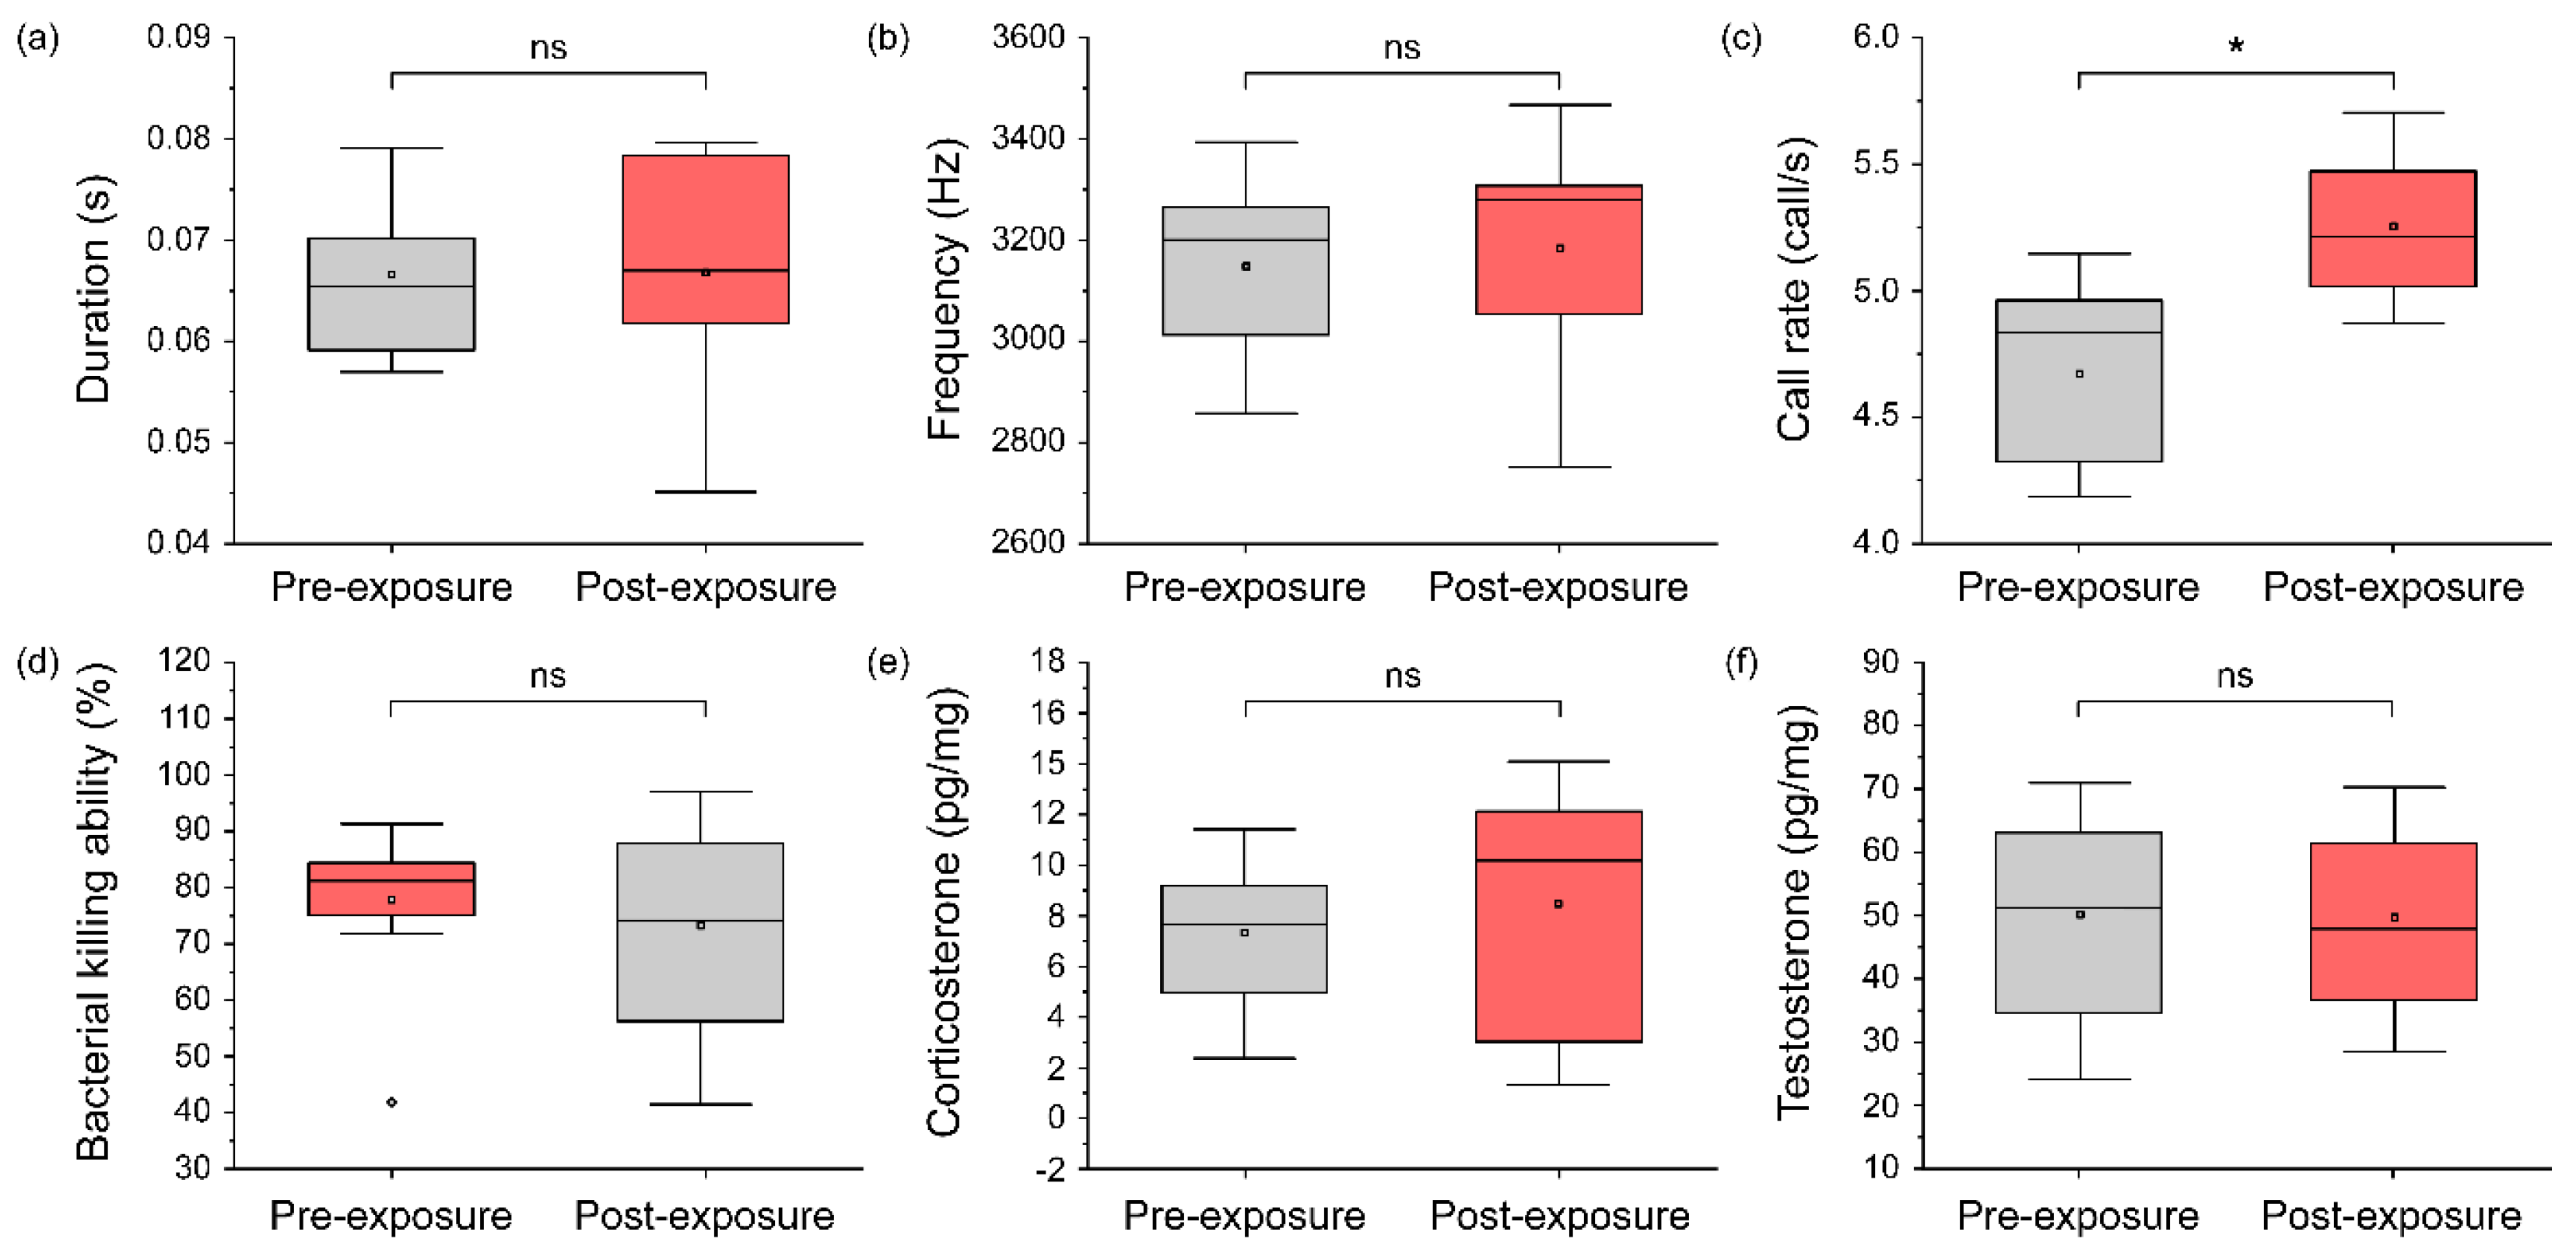
3.3. Changes in the Calling Pattern, Steroid Hormones, and Immunity Due to Turbine Noise Exposure
3.4. Relationship among Calling Pattern, Status of Hormones and Immunity of D. japonicus
4. Discussion
5. Conclusions
Author Contributions
Funding
Institutional Review Board Statement
Informed Consent Statement
Data Availability Statement
Conflicts of Interest
Appendix A
TCA Treatment for the Salivary Hormone Assay
Appendix B

| Predicted Variable | Predictor Variable | Coeff. | Std. Err. | Beta | t | p | R2 | F (p) | Df 1, 2 |
|---|---|---|---|---|---|---|---|---|---|
| Duration | (Intercept) | 0.11 | 0.04 | 2.42 | 0.02 | 0.18 | 1.05 (0.41) | 5, 24 | |
| Frequency | −1.27 × 10⁻⁵ | 1.24 × 10⁻⁵ | −0.20 | −1.03 | 0.32 | ||||
| Call rate | −5.04 × 10⁻⁴ | <0.01 | −0.03 | −0.14 | 0.89 | ||||
| BKA | 6.27 × 10⁻⁵ | 5.43 × 10⁻⁵ | 0.25 | 1.16 | 0.26 | ||||
| CORT | 5.63 × 10⁻⁴ | 5.37 × 10⁻⁴ | 0.25 | 1.05 | 0.31 | ||||
| T | 1.55 × 10⁻⁴ | 1.22 × 10⁻⁴ | 0.24 | 1.27 | 0.22 | ||||
| Frequency | (Intercept) | 3509.97 | 346.85 | 10.12 | <0.01 | 0.12 | 0.64 (0.67) | 5, 24 | |
| Duration | −3306.78 | 3220.73 | −0.21 | −1.03 | 0.32 | ||||
| Call rate | −49.37 | 57.74 | −0.18 | −0.86 | 0.40 | ||||
| BKA | 0.32 | 0.90 | 0.08 | 0.36 | 0.72 | ||||
| CORT | 5.93 | 8.77 | 0.17 | 0.68 | 0.51 | ||||
| T | −1.69 | 2.00 | −0.17 | −0.85 | 0.41 | ||||
| Call rate | (Intercept) | 6.03 | 2.48 | 2.43 | 0.02 | 0.19 | 1.15 (0.36) | 5, 24 | |
| Duration | −1.60 | 11.47 | −0.03 | −0.14 | 0.89 | ||||
| Frequency | −5.99 × 10⁻⁴ | 7.00 × 10⁻⁴ | −0.16 | −0.86 | 0.40 | ||||
| BKA | <0.01 | <0.01 | 0.21 | 0.98 | 0.34 | ||||
| CORT | 0.06 | 0.03 | 0.48 | 2.21 | 0.04 | ||||
| T | >−0.01 | <0.01 | −0.09 | −0.44 | 0.66 | ||||
| BKA | (Intercept) | −68.36 | 180.30 | −0.38 | 0.71 | 0.32 | 2.30 (0.08) | 5, 24 | |
| Duration | 840.99 | 727.60 | 0.21 | 1.16 | 0.26 | ||||
| Frequency | 0.02 | 0.05 | 0.06 | 0.36 | 0.72 | ||||
| Call rate | 12.77 | 13.06 | 0.18 | 0.98 | 0.34 | ||||
| CORT | −5.44 | 1.68 | −0.59 | −3.25 | <0.01 | ||||
| T | 0.02 | 0.46 | 0.01 | 0.05 | 0.97 | ||||
| CORT | (Intercept) | −16.41 | 18.05 | −0.91 | 0.37 | 0.41 | 3.36 (0.02) | 5, 24 | |
| Duration | 77.86 | 74.22 | 0.18 | 1.05 | 0.31 | ||||
| Frequency | <0.01 | 0.01 | 0.11 | 0.68 | 0.51 | ||||
| Call rate | 2.72 | 1.23 | 0.35 | 2.21 | 0.04 | ||||
| BKA | −0.06 | 0.02 | −0.52 | −3.25 | <0.01 | ||||
| T | −0.01 | 0.05 | −0.02 | −0.13 | 0.90 | ||||
| T | (Intercept) | 80.70 | 78.40 | 1.03 | 0.31 | 0.12 | 0.68 (0.65) | 5, 24 | |
| Duration | 407.76 | 320.55 | 0.26 | 1.27 | 0.22 | ||||
| Frequency | −0.02 | 0.02 | −0.17 | −0.85 | 0.41 | ||||
| Call rate | −2.59 | 5.88 | −0.09 | −0.44 | 0.66 | ||||
| BKA | <0.01 | 0.09 | 0.01 | 0.05 | 0.97 | ||||
| CORT | −0.11 | 0.89 | −0.03 | −0.13 | 0.90 |
References
- Herbert, G.J.; Iniyan, S.; Sreevalsan, E.; Ragapandian, S. A review of wind energy technologies. Renew. Sustain. Energy Rev. 2007, 11, 1117–1145. [Google Scholar] [CrossRef]
- Díaz, H.; Soares, C.G. Review of the current status, technology and future trends of offshore wind farms. Ocean Eng. 2020, 209, 107381. [Google Scholar] [CrossRef]
- Gibson, L.; Wilman, E.N.; Laurance, W.F. How green is ‘green’energy? Trends Ecol. Evol. 2017, 32, 922–935. [Google Scholar] [CrossRef] [PubMed]
- Punt, M.J.; Croeneveld, R.A.; Van Lerland, E.C.; Stel, J.H. Spatial planning of offshore wind farms: A windfall to marine environmental protection? Ecol. Econ. 2009, 69, 93–103. [Google Scholar] [CrossRef]
- Kunz, T.H.; Arnett, E.B.; Erickson, W.P.; Hoar, A.R.; Johnson, G.D.; Larkin, R.P.; Strickland, M.D.; Thresher, R.W.; Tuttle, M.D. Ecological impacts of wind energy development on bats: Questions, research needs, and hypotheses. Front. Ecol. Environ. 2007, 5, 315–324. [Google Scholar] [CrossRef] [Green Version]
- Kuvelesky, W.P.; Brennan, L.A.; Morrison, M.L.; Boydston, K.K.; Ballard, B.M.; Bryant, F.C. Wind energy development and wildlife conservation: Challenges and opportunities. J. Wildl. Manag. 2007, 71, 2487–2498. [Google Scholar] [CrossRef]
- Kaldellis, J.K.; Apostolou, D.; Kapsali, M.; Kondili, E. Environmental and social footprint of offshore wind energy. Comparison with onshore counterpart. Renew. Energy 2016, 92, 543–556. [Google Scholar] [CrossRef]
- Knopper, L.D.; Ollson, C.A. Health effects and wind turbines: A review of the literature. Environ. Health 2011, 10, 78. [Google Scholar] [CrossRef] [Green Version]
- Vanhellemont, Q.; Ruddick, K. Turbid wakes associated with offshore wind turbines observed with Landsat 8. Remote Sens. Environ. 2014, 145, 105–115. [Google Scholar] [CrossRef] [Green Version]
- Hammar, L.; Wikström, A.; Molander, S. Assessing ecological risks of offshore wind power on Kattegat cod. Renew. Energy 2014, 66, 414–424. [Google Scholar] [CrossRef]
- Hammar, L.; Perry, D.; Gullström, M. Offshore wind power for marine conservation. Open J. Mar. Sci. 2015, 6, 66–78. [Google Scholar] [CrossRef] [Green Version]
- Koschinski, S.; Culik, B.M.; Henriksen, O.D.; Tregenza, N.; Ellis, G.; Jansen, C.; Kathe, G. Behavioural reactions of free-ranging porpoises and seals to the noise of a simulated 2 MW windpower generator. Mar. Ecol. Prog. Ser. 2003, 265, 263–273. [Google Scholar] [CrossRef] [Green Version]
- Nabe-Nielsen, J.; Sibly, R.M.; Tougaard, J.; Teilmann, J.; Sveegaard, S. Effects of noise and by-catch on a Danish harbour porpoise population. Ecol. Model. 2014, 272, 242–251. [Google Scholar] [CrossRef] [Green Version]
- Liu, W. A review on wind turbine noise mechanism and de-noising techniques. Renew. Energy 2017, 108, 311–320. [Google Scholar] [CrossRef]
- Tamura, H.; Ohgami, N.; Yajima, I.; Iida, M.; Ohgami, K.; Fujii, N.; Itabe, H.; Kusudo, T.; Yamashita, H.; Kato, M. Chronic exposure to low frequency noise at moderate levels causes impaired balance in mice. PLoS ONE 2012, 7, e39807. [Google Scholar] [CrossRef]
- Waye, K.P.; Bengtsson, J.; Rylander, R.; Hucklebridge, F.; Evans, P.; Clow, A. Low frequency noise enhances cortisol among noise sensitive subjects during work performance. Life Sci. 2002, 70, 745–758. [Google Scholar] [CrossRef]
- Ambrose, S.E.; Rand, R.W.; Krogh, C.M. Wind turbine acoustic investigation: Infrasound and low-frequency noise—a case study. Bull. Sci. Technol. Soc. 2012, 32, 128–141. [Google Scholar] [CrossRef]
- Van den Berg, F. Wind turbine noise: An overview of acoustical performance and effects on residents. In Proceedings of the Annual Conference of the Australian Acoustical Society, Victor Harbor, Australia, 17–20 November 2013. [Google Scholar]
- Mikolajczak, J.; Borowski, S.; Marc-Pienkowska, J.; Odrowaz-Sypniewska, G.; Bernacki, Z.; Siodmiak, J.; Szterk, P. Preliminary studies on the reaction of growing geese (Anser anser f. domestica) to the proximity of wind turbines. Pol. J. Vet. Sci. 2013, 16, 679–686. [Google Scholar] [CrossRef] [Green Version]
- Whalen, C.E.; Brown, M.B.; McGee, J.; Powell, L.A.; Walsh, E.J. Effects of wind turbine noise on the surrounding soundscape in the context of greater-prairie chicken courtship vocalizations. Appl. Acoust. 2019, 153, 132–139. [Google Scholar] [CrossRef]
- Agnew, R.C.; Smith, V.J.; Fowkes, R.C. Wind turbines cause chronic stress in badgers (Meles meles) in Great Britain. J. Wildl. Dis. 2016, 52, 459–467. [Google Scholar] [CrossRef] [Green Version]
- Wells, K.D. Anuran Vocal Communication. In The Ecology and Behavior of Amphibians; Wells, K.D., Ed.; University of Chicago Press: Chicago, IL, USA, 2007; pp. 268–337. [Google Scholar]
- Gerhardt, H.C.; Klump, G.M. Masking of acoustic signals by the chorus background noise in the green tree frog: A limitation on mate choice. Anim. Behav. 1988, 36, 1247–1249. [Google Scholar] [CrossRef]
- Grace, M.; Noss, R. Evidence for selective avoidance of traffic noise by anuran amphibians. Anim. Conserv. 2018, 21, 343–351. [Google Scholar] [CrossRef]
- Parris, K.M.; Velik-Lord, M.; North, J.M. Frogs call at a higher pitch in traffic noise. Ecol. Soc. 2009, 14, 25. [Google Scholar] [CrossRef] [Green Version]
- Troïanowski, M.; Mondy, N.; Dumet, A.; Arcanjo, C.; Lengagne, T. Effects of traffic noise on tree frog stress levels, immunity, and color signaling. Conserv. Biol. 2017, 31, 1132–1140. [Google Scholar] [CrossRef]
- Vargas-Salinas, F.; Amézquita, A. Traffic noise correlates with calling time but not spatial distribution in the threatened poison frog. Andinobates bombetes. Behaviour 2013, 150, 569–584. [Google Scholar] [CrossRef]
- Kruger, D.J.; Du Preez, L.H. The effect of airplane noise on frogs: A case study on the Critically Endangered Pickersgill’s reed frog (Hyperolius pickersgilli). Ecol. Res. 2016, 31, 393–405. [Google Scholar] [CrossRef]
- Caorsi, V.Z.; Both, C.; Cechin, S.; Antunes, R.; Borges-Martins, M. Effects of traffic noise on the calling behavior of two Neotropical hylid frogs. PLoS ONE 2017, 12, e0183342. [Google Scholar] [CrossRef] [Green Version]
- Legett, H.D.; Madden, R.P.; Aihara, I.; Bernal, X.E. Traffic noise differentially impacts call types in a Japanese treefrog (Buergeria japonica). Ethology 2020, 126, 576–583. [Google Scholar] [CrossRef]
- Assis, V.R.; Navas, C.A.; Mendonça, M.T.; Gomes, F.R. Vocal and territorial behavior in the Smith frog (Hypsiboas faber): Relationships with plasma levels of corticosterone and testosterone. Comp. Biochem. Physiol. Part A Mol. Integr. Physiol. 2012, 163, 265–271. [Google Scholar] [CrossRef]
- Joshi, A.M.; Narayan, E.J.; Gramapurohit, N.P. Vocalisation and its association with androgens and corticosterone in a night frog (Nyctibatrachus humayuni) with unique breeding behaviour. Ethology 2019, 125, 774–784. [Google Scholar] [CrossRef]
- Moore, I.T.; Jessop, T.S. Stress, reproduction, and adrenocortical modulation in amphibians and reptiles. Horm. Behav. 2003, 43, 39–47. [Google Scholar] [CrossRef]
- Tennessen, J.B.; Parks, S.E.; Langkilde, T. Traffic noise causes physiological stress and impairs breeding migration behaviour in frogs. Conserv. Physiol. 2014, 2, cou032. [Google Scholar] [CrossRef] [PubMed] [Green Version]
- Marketon, J.I.W.; Glaser, R. Stress hormones and immune function. Cell. Immunol. 2008, 252, 16–26. [Google Scholar] [CrossRef] [PubMed]
- Romero, M.L.; Butler, L.K. Endocrinology of stress. Int. J. Comp. Psychol. 2007, 20, 89–95. [Google Scholar]
- Hirai, T.; Matsui, M. Feeding habits of the Japanese tree frog, Hyla japonica, in the reproductive season. Zool. Sci. 2000, 17, 977–982. [Google Scholar] [CrossRef] [Green Version]
- Hirai, T.; Matsui, M. Feeding relationships between Hyla japonica and Rana nigromaculata in rice fields of Japan. J. Herpetol. 2002, 2002, 662–667. [Google Scholar] [CrossRef]
- Borzee, A.; Kim, J.Y.; Cunha, M.A.M.; Lee, D.; Sin, E.; Oh, S.; YI, Y.; Jang, Y. Temporal and spatial differentiation in microhabitat use: Implications for reproductive isolation and ecological niche specification. Integr. Zool. 2016, 11, 375–387. [Google Scholar] [CrossRef]
- Borzee, A.; Kim, J.Y.; Jang, Y. Asymmetric competition over calling sites in two closely related treefrog species. Sci. Rep. 2016, 6, 32569. [Google Scholar] [CrossRef] [Green Version]
- Kamp, I.; Berg, F. Health effects related to wind turbine sound, including low-frequency sound and infrasound. Acoust. Aust. 2018, 46, 31–57. [Google Scholar] [CrossRef] [Green Version]
- Schmidt, J.H.; Klokker, M. Health effects related to wind turbine noise exposure: A systematic review. PLoS ONE 2014, 9, e114183. [Google Scholar] [CrossRef] [Green Version]
- Romero, L.M.; Reed, J.M. Collecting baseline corticosterone samples in the field: Is under 3 min good enough? Comp. Biochem. Physiol. A 2005, 140, 73–79. [Google Scholar] [CrossRef] [PubMed]
- Madelaire, C.B.; de Oliveira Cassettari, B.; Gomes, F.R. Immunomodulation by testosterone and corticosterone in toads: Experimental evidences from transdermal application. Gen. Comp. Endocrinol. 2019, 273, 227–235. [Google Scholar] [CrossRef] [PubMed]
- Titon, S.C.M.; Junior, B.T.; Assis, V.R.; Vasconcelos-Teixeira, R.; Neto, P.G.G.; Lima, A.S.; de França Ferreira, L.; Fernandes, P.A.; Gomes, F.R.; Markus, R.P. Hormonal daily variation co-varies with immunity in captive male bullfrogs (Lithobates catesbeianus). Gen. Comp. Endocrinol. 2021, 303, 113702. [Google Scholar] [CrossRef] [PubMed]
- Park, J.K.; Do, Y. Evaluating the physical condition of Hyla japonica using radiographic techniques. Sci. Total Environ. 2020, 726, 138596. [Google Scholar] [CrossRef]
- Grafe, U. Use of metabolic substrates in the gray treefrog Hyla versicolor. implications for calling behavior. Copeia 1997, 1997, 356–362. [Google Scholar] [CrossRef]
- Madelaire, C.B.; Gomes, F.R. Breeding under unpredictable conditions: Annual variation in gonadal maturation, energetic reserves and plasma levels of androgens and corticosterone in anurans from the Brazilian semi-arid. Gen. Comp. Endocrinol. 2016, 228, 9–16. [Google Scholar] [CrossRef]
- Contreras, C.M.; Gutiérrez-Garcia, A.G. Cortisol Awakening Response: An Ancient Adaptive Feature. J. Psychiatr Psychiatr. Disord. 2018, 2, 29–40. [Google Scholar] [CrossRef]
- Vincenzo De Sanctis, M.; Soliman, A.; Yassin, M.; Garofalo, P. Cortisol levels in central adrenal insufficiency: Light and shade. Pediatr. Endocrinol. Rev. 2015, 12, 213–219. [Google Scholar]
- Halfwerk, W.; Blaas, M.; Kramer, L.; Hijner, N.; Trillo, P.A.; Bernal, X.E.; Page, R.A.; Goutte, S.; Ryan, M.J.; Ellers, J. Adaptive changes in sexual signalling in response to urbanization. Nat. Ecol. Evol. 2019, 3, 374–380. [Google Scholar] [CrossRef] [Green Version]
- Aihara, I.; Horai, S.; Kitahata, H.; Aihara, K.; Yoshikawa, K. Dynamical calling behavior experimentally observed in Japanese tree frogs (Hyla japonica). IEICE Trans. Fundam. Electron. 2007, 90, 2154–2161. [Google Scholar] [CrossRef]
- Park, S.; Jeong, G.; Jang, Y. No reproductive character displacement in male advertisement signals of Hyla japonica in relation to the sympatric H. suweonensis. Behav. Ecol. Sociobiol. 2013, 67, 1345–1355. [Google Scholar] [CrossRef]
- Hammond, T.T.; Au, Z.A.; Hartman, A.C.; Richards-Zawacki, C.L. Assay validation and interspecific comparison of salivary glucocorticoids in three amphibian species. Conserv. Physiol. 2018, 6, coy055. [Google Scholar] [CrossRef] [PubMed]
- Assis, V.R.; Titon, S.C.M.; Barsotti, A.M.G.; Spira, B.; Gomes, F.R. Antimicrobial capacity of plasma from anurans of the Atlantic Forest. S. Am. J. Herpetol. 2013, 8, 155–160. [Google Scholar] [CrossRef]
- Desprat, J.L.; Lengagne, T.; Dumet, A.; Desouhant, E.; Mondy, N. Immunocompetence handicap hypothesis in tree frog: Trade-off between sexual signals and immunity. Behav. Ecol. 2015, 26, 1138–1146. [Google Scholar] [CrossRef]
- Marler, C.; Ryan, M. Energetic constraints and steroid hormone correlates of male calling behaviour in the túngara frog. J. Zool. 1996, 240, 397–409. [Google Scholar] [CrossRef]
- Bevier, C.R. Utilization of energy substrates during calling activity in tropical frogs. Behav. Ecol. Sociobiol. 1997, 41, 343–352. [Google Scholar] [CrossRef]
- Hopkin, C.J.; James, S.; Grigg, G.C. Ecology and taxonomy-driven deviations in the frog call–body size relationship across the diverse Australian frog fauna. J. Zool. 2009, 278, 36–41. [Google Scholar]
- Wells, K.D.; Taigen, T.L. The effect of social interactions on calling energetics in the gray treefrog (Hyla versicolor). Behav. Ecol. Sociobiol. 1986, 19, 9–18. [Google Scholar] [CrossRef]
- Ziegler, L.; Arim, M.; Bozinovic, F. Intraspecific scaling in frog calls: The interplay of temperature, body size and metabolic condition. Oecologia 2016, 181, 673–681. [Google Scholar] [CrossRef]
- Penna, M.; Pottstock, H.; Velasquez, N. Effect of natural and synthetic noise on evoked vocal responses in a frog of the temperate austral forest. Anim. Behav. 2005, 70, 639–651. [Google Scholar] [CrossRef]
- Rollins-Smith, L.A. Amphibian immunity–stress, disease, and climate change. Dev. Comp. Immunol. 2017, 66, 111–119. [Google Scholar] [CrossRef] [PubMed] [Green Version]
- Assis, V.R.; Titon, S.C.M.; Gomes, F.R. Acute stress, steroid plasma levels, and innate immunity in Brazilian toads. Gen. Comp. Endocrinol. 2019, 273, 86–97. [Google Scholar] [CrossRef] [PubMed]
- Titon, S.C.M.; Junior, B.T.; Assis, V.R.; Kinker, G.S.; Fernandes, P.A.C.M.; Gomes, F.R. Interplay among steroids, body condition and immunity in response to long-term captivity in toads. Sci. Rep. 2018, 8, 17168. [Google Scholar] [CrossRef]
- Folstad, I.; Karter, A.J. Parasites, bright males, and the immunocompetence handicap. Am Nat. 1992, 139, 603–622. [Google Scholar] [CrossRef]
- Stuart, S.N.; Chanson, J.S.; Cox, N.A.; Young, B.E.; Rodrigues, A.S.; Fischman, D.L.; Waller, R.W. Status and trends of amphibian declines and extinctions worldwide. Science 2004, 306, 1783–1786. [Google Scholar] [CrossRef] [Green Version]
- Braude, S.; Tang-Martinez, Z.; Taylor, G.T. Stress, testosterone, and the immunoredistribution hypothesis. Behav. Ecol. 1999, 10, 345–350. [Google Scholar] [CrossRef] [Green Version]
- Klein, S.L. Hormones and mating system affect sex and species differences in immune function among vertebrates. Behav. Processes 2000, 51, 149–166. [Google Scholar] [CrossRef]
- Zuk, M.; McKean, K.A. Sex differences in parasite infections: Patterns and processes. Int. J. Parasitol. 1996, 26, 1009–1024. [Google Scholar] [CrossRef]
- Hawley, D.M.; Altizer, S.M. Disease ecology meets ecological immunology: Understanding the links between organismal immunity and infection dynamics in natural populations. Funct. Ecol. 2011, 25, 48–60. [Google Scholar] [CrossRef]
- Wells, K.D.; Schwartz, J.J. The behavioral ecology of anuran communication. In Hearing and Sound Communication in Amphibians; Narins, M., Feng, A.S., Fay, R.R., Popper, A.N., Eds.; Springer: Berlin/Heidelberg, Germany, 2007; pp. 44–86. [Google Scholar]


| Contents | Control | Wind Turbine |
|---|---|---|
| Temperature (℃) | 23.76 ± 0.73 | 23.75 ± 0.73 |
| Humidity (%) | 70.76 ± 3.26 | 69.27 ± 4.29 |
| Illuminance (lux) | 0 | 0 |
| Chorus size | 3.89 ± 1.05 | 3.56 ± 1.01 |
| Background noise (dB) | 40.63 ± 1.55 * | 55.77 ± 1.93 * |
| Contents | Control Group | Wind Turbine Group | Exposure Group |
|---|---|---|---|
| SVL (mm) | 30.94 ± 1.22 | 31.03 ± 1.34 | 30.59 ± 1.39 |
| Body weight (g) | 2.76 ± 0.61 | 2.83 ± 0.44 | 2.67 ± 0.77 |
| Fat mass (g) | 0.62 ± 0.21 | 0.78 ± 0.41 | 0.74 ± 0.26 |
| Fat ratio (%) | 22.26 ± 4.25 | 26.98 ± 11.61 | 27.18 ± 5.16 |
| Lean mass (g) | 2.08 ± 0.42 | 2.00 ± 0.30 | 1.91 ± 0.52 |
| Lean ratio (%) | 75.99 ± 3.88 | 71.49 ± 11.18 | 71.68 ± 4.92 |
| BMD (g/cm2) | 0.05 ± 0.01 | 0.05 ± 0.01 | 0.05 ± 0.01 |
| Predicted Variable | Predictor Variable | Coeff. | Std. Err. | Beta | t | p | R2 | F (p) | Df 1, 2 |
|---|---|---|---|---|---|---|---|---|---|
| CORT | (Intercept) | −16.41 | 18.05 | −0.91 | 0.37 | 0.41 | 3.36 (0.02) | 5, 24 | |
| Duration | 77.86 | 74.22 | 0.18 | 1.05 | 0.31 | ||||
| Frequency | <0.01 | 0.01 | 0.11 | 0.68 | 0.51 | ||||
| Call rate | 2.72 | 1.23 | 0.35 | 2.21 | 0.04 | ||||
| BKA | −0.06 | 0.02 | −0.52 | −3.25 | <0.01 | ||||
| T | −0.01 | 0.05 | −0.02 | −0.13 | 0.90 |
Publisher’s Note: MDPI stays neutral with regard to jurisdictional claims in published maps and institutional affiliations. |
© 2022 by the authors. Licensee MDPI, Basel, Switzerland. This article is an open access article distributed under the terms and conditions of the Creative Commons Attribution (CC BY) license (https://creativecommons.org/licenses/by/4.0/).
Share and Cite
Park, J.-K.; Do, Y. Wind Turbine Noise Behaviorally and Physiologically Changes Male Frogs. Biology 2022, 11, 516. https://doi.org/10.3390/biology11040516
Park J-K, Do Y. Wind Turbine Noise Behaviorally and Physiologically Changes Male Frogs. Biology. 2022; 11(4):516. https://doi.org/10.3390/biology11040516
Chicago/Turabian StylePark, Jun-Kyu, and Yuno Do. 2022. "Wind Turbine Noise Behaviorally and Physiologically Changes Male Frogs" Biology 11, no. 4: 516. https://doi.org/10.3390/biology11040516
APA StylePark, J.-K., & Do, Y. (2022). Wind Turbine Noise Behaviorally and Physiologically Changes Male Frogs. Biology, 11(4), 516. https://doi.org/10.3390/biology11040516