
Synthesis of Iron Gallate (FeGa2O4) Nanoparticles by Mechanochemical Method


Abstract
:1. Introduction
2. Experimental
3. Results and Discussion
4. Conclusions
Author Contributions
Funding
Institutional Review Board Statement
Informed Consent Statement
Data Availability Statement
Conflicts of Interest
References
- Gao, H.; Liu, S.; Li, Y.; Conte, E.; Cao, Y. A Critical Review of Spinel Structured Iron Cobalt Oxides Based Materials for Electrochemical Energy Storage and Conversion. Energies 2017, 10, 1787. [Google Scholar] [CrossRef] [Green Version]
- Li, Y.; Yuan, Z.; Meng, F. Spinel-Type Materials Used for Gas Sensing: A Review. Sensors 2020, 20, 5413. [Google Scholar] [CrossRef] [PubMed]
- Šutka, A.; Gross, K.A. Spinel ferrite oxide semiconductor gas sensors. Sens. Actuators B Chem. 2016, 222, 95–105. [Google Scholar] [CrossRef]
- Preethi, V.; Kanmani, S. Photocatalytic hydrogen production. Mater. Sci. Semicond. Process. 2013, 16, 561–575. [Google Scholar] [CrossRef]
- Suresh, R.; Rajendran, S.; Kumar, P.S.; Vo, D.-V.N.; Cornejo-Ponce, L. Recent advancements of spinel ferrite based binary nanocomposite photocatalysts in wastewater treatment. Chemosphere 2021, 274, 129734. [Google Scholar] [CrossRef] [PubMed]
- Grimes, R.W.; Anderson, A.B.; Heuer, A.H. Predictions of cation distributions in AB2O4 spinels from normalized ion energies. J. Am. Chem. Soc. 1989, 111, 1–7. [Google Scholar] [CrossRef]
- Rafiq, M.A.; Javed, A.; Rasul, M.N.; Nadeem, M.; Iqbal, F.; Hussain, A. Structural, electronic, magnetic and optical properties of AB2O4 (A = Ge, Co and B = Ga, Co) spinel oxides. Mater. Chem. Phys. 2020, 257, 123794. [Google Scholar] [CrossRef]
- Pinto, A. Magnetization and Anisotropy in Gallium Iron Oxide. J. Appl. Phys. 1966, 37, 4372–4376. [Google Scholar] [CrossRef]
- Abrahams, S.C.; Reddy, J.M.; Bernstein, J.L. Crystal Structure of Piezoelectric Ferromagnetic Gallium Iron Oxide. J. Chem. Phys. 1965, 42, 3957–3968. [Google Scholar] [CrossRef]
- Ghose, J.; Hallam, G.C.; Read, D.A. A magnetic study of FeGa2O4. J. Phys. C Solid State Phys. 1977, 10, 1051–1057. [Google Scholar] [CrossRef]
- Huang, C.-C.; Su, C.-H.; Liao, M.-Y.; Yeh, C.-S. Magneto-optical FeGa2O4 nanoparticles as dual-modality high contrast efficacy T2 imaging and cathodoluminescent agents. Phys. Chem. Chem. Phys. 2009, 11, 6331–6334. [Google Scholar] [CrossRef] [PubMed]
- Alldredge, L.M.B.; Chopdekar, R.; Nelson-Cheeseman, B.B.; Suzuki, Y. Spin-polarized conduction in oxide magnetic tunnel junctions with magnetic and nonmagnetic insulating barrier layers. Appl. Phys. Lett. 2006, 89, 182504. [Google Scholar] [CrossRef]
- Myoung, B.R.; Han, S.K.; Kim, S.J.; Kim, C.S. The Magnetic Behaviors of Spin-Glass FeGa2O4 system. IEEE Trans. Magn. 2012, 48, 1567–1569. [Google Scholar] [CrossRef]
- Sánchez, J.; Cortés-Hernández, D.A.; Escobedo-Bocardo, J.C.; Almanza-Robles, J.M.; Reyes-Rodríguez, P.Y.; Jasso-Terán, R.A.; Bartolo-Pérez, P.; De-León-Prado, L.E. Synthesis of MnxGa1−xFe2O4 magnetic nanoparticles by thermal decomposition method for medical diagnosis applications. J. Magn. Magn. Mater. 2017, 427, 272–275. [Google Scholar] [CrossRef]
- He, Z.-H.; Gao, J.-F.; Kong, L.-B. Iron Gallium Oxide with High-Capacity and Super-Rate Performance as New Anode Materials for Li-Ion Capacitors. Energy Fuels 2021, 35, 8378–8386. [Google Scholar] [CrossRef]
- Sánchez, J.; Prado, L.E.D.L.; Hernández, D.A.C. Magnetic Properties and Cytotoxicity of Ga-Mn Magnetic Ferrites Synthesized by the Citrate Sol-Gel Method. Int. J. Chem. Mol. Eng. 2017, 11, 590–595. [Google Scholar]
- Paudel, T.R.; Zakutayev, A.; Lany, S.; D’Avezac, M.; Zunger, A. Doping Rules and Doping Prototypes in A2BO4 Spinel Oxides. Adv. Funct. Mater. 2011, 21, 4493–4501. [Google Scholar] [CrossRef]
- Urso, C.; Barawi, M.; Gaspari, R.; Sirigu, G.; Kriegel, I.; Zavelani-Rossi, M.; Scotognella, F.; Manca, M.; Prato, M.; de Trizio, L.; et al. Colloidal Synthesis of Bipolar Off-Stoichiometric Gallium Iron Oxide Spinel-Type Nanocrystals with Near-IR Plasmon Resonance. J. Am. Chem. Soc. 2016, 139, 1198–1206. [Google Scholar] [CrossRef] [Green Version]
- Myoung, B.R.; Lim, J.T.; Kim, C.S. Crystallograhic and Magnetic Properties of Fe1−xNixGa2O4. J. Korean Phys. Soc. 2017, 70, 85–88. [Google Scholar] [CrossRef]
- Lyubutin, I.S.; Starchikov, S.S.; Gervits, N.E.; Lin, C.-R.; Tseng, Y.-T.; Shih, K.-Y.; Lee, J.-S.; Ogarkova, Y.L.; Korotkov, N.Y. Structural, magnetic and electronic properties of Fe1+xGa2−xO4 nanoparticles synthesized by the combustion method. Phys. Chem. Chem. Phys. 2016, 18, 22276–22285. [Google Scholar] [CrossRef]
- Lyubutin, I.S.; Starchikov, S.S.; Gervits, N.E.; Lin, C.-R.; Tseng, Y.-T.; Shih, K.-Y.; Lee, J.-S.; Ogarkova, Y.L.; Baskakov, A.O.; Frolov, K.V. Magnetic Properties and Charge Transfer Transition Induced by Jahn–Teller Effect in FeGa2O4 Nanoparticles. J. Phys. Chem. C 2016, 120, 25596–25603. [Google Scholar] [CrossRef]
- Xu, Z.; Yan, S.-C.; Shi, Z.; Yao, Y.-F.; Zhou, P.; Wang, H.-Y.; Zou, Z.-G. Adjusting the Crystallinity of Mesoporous Spinel CoGa2O4 for Efficient Water Oxidation. ACS Appl. Mater. Interface 2016, 8, 12887–12893. [Google Scholar] [CrossRef] [PubMed]
- Sun, X.; Maeda, K.; Le Faucheur, M.; Teramura, K.; Domen, K. Preparation of (Ga1−xZnx) (N1−xOx) solid-solution from ZnGa2O4 and ZnO as a photo-catalyst for overall water splitting under visible light. Appl. Catal. A Gen. 2007, 327, 114–121. [Google Scholar] [CrossRef]
- Zhang, Q.; Saito, F. A review on mechanochemical syntheses of functional materials. Adv. Powder Technol. 2012, 23, 523–531. [Google Scholar] [CrossRef]
- Takacs, L. Self-sustaining reactions induced by ball milling. Prog. Mater. Sci. 2002, 47, 355–414. [Google Scholar] [CrossRef]
- Janot, R.; Guérard, D. One-step synthesis of maghemite nanometric powders by ball-milling. J. Alloys Compd. 2002, 333, 302–307. [Google Scholar] [CrossRef]
- Patterson, A.L. The Scherrer formula for X-ray particle size determination. Phys. Rev. 1939, 56, 978–982. [Google Scholar] [CrossRef]
- Rabiei, M.; Palevicius, A.; Monshi, A.; Nasiri, S.; Vilkauskas, A.; Janusas, G. Comparing Methods for Calculating Nano Crystal Size of Natural Hydroxyapatite Using X-ray Diffraction. Nanomaterials 2020, 10, 1627. [Google Scholar] [CrossRef]
- Mote, V.D.; Purushotham, Y.; Dole, B.N. Williamson-Hall analysis in estimation of lattice strain in nanometer-sized ZnO particles. J. Theor. Appl. Phys. 2012, 6, 6. [Google Scholar] [CrossRef] [Green Version]
- Prabhu, Y.T.; Rao, K.V.; Kumar, V.S.S.; Kumari, B.S. X-ray Analysis by Williamson-Hall and Size-Strain Plot Methods of ZnO Nanoparticles with Fuel Variation. World J. Nano Sci. Eng. 2014, 04, 21–28. [Google Scholar] [CrossRef]
- Zak, A.K.; Majid, W.H.A.; Abrishami, M.E.; Yousef, R. X-ray analysis of ZnO nanoparticles by WilliamsoneHall and sizeestrain plot methods. Solid State Sci. 2011, 13, 251–256. [Google Scholar]
- Stukowski, A.; Markmann, J.; Weissmüller, J.; Albe, K. Atomistic origin of microstrain broadening in diffraction data of nanocrystalline solids. Acta Mater. 2009, 57, 1648–1654. [Google Scholar] [CrossRef]
- Dolgonos, A.; Mason, T.O.; Poeppelmeier, K.R. Direct optical band gap measurement in polycrystalline semiconductors: A critical look at the Tauc method. J. Solid State Chem. 2016, 240, 43–48. [Google Scholar] [CrossRef] [Green Version]
- Farooq, M.I.; Khan, M.S.; Yousaf, M.; Zhang, K.; Zou, B. Antiferromagnetic Magnetic Polaron Formation and Optical Properties of CVD-Grown Mn-Doped Zinc Stannate (ZTO). ACS Appl. Electron. Mater. 2020, 2, 1679–1688. [Google Scholar] [CrossRef]
- Shigetomi, S.; Ikari, T. Optical properties of GaSe grown with an excess and a lack of Ga atoms. J. Appl. Phys. 2003, 94, 5399. [Google Scholar] [CrossRef]
- Walsh, A.; Da Silva, J.L.F.; Wei, S.-H. Origins of band-gap renormalization in degenerately doped semiconductors. Phys. Rev. B 2008, 78, 075211. [Google Scholar] [CrossRef] [Green Version]

| Sample Name | The Rotation Speed (Rpm) | The Milling Environments | Times of Open to Ambient Atmosphere | Charge Ratio (Powder to Ball Weight Ratio) | Duration (Hour) |
|---|---|---|---|---|---|
| FeGaO-01 | 300 | Air | 8 | 1:30 | 84 |
| FeGaO-02 | 360 | Air | 3 | 1:30 | 36 |
| FeGaO-03 | 360 | released gas * | 0 | 1:30 | 36 |
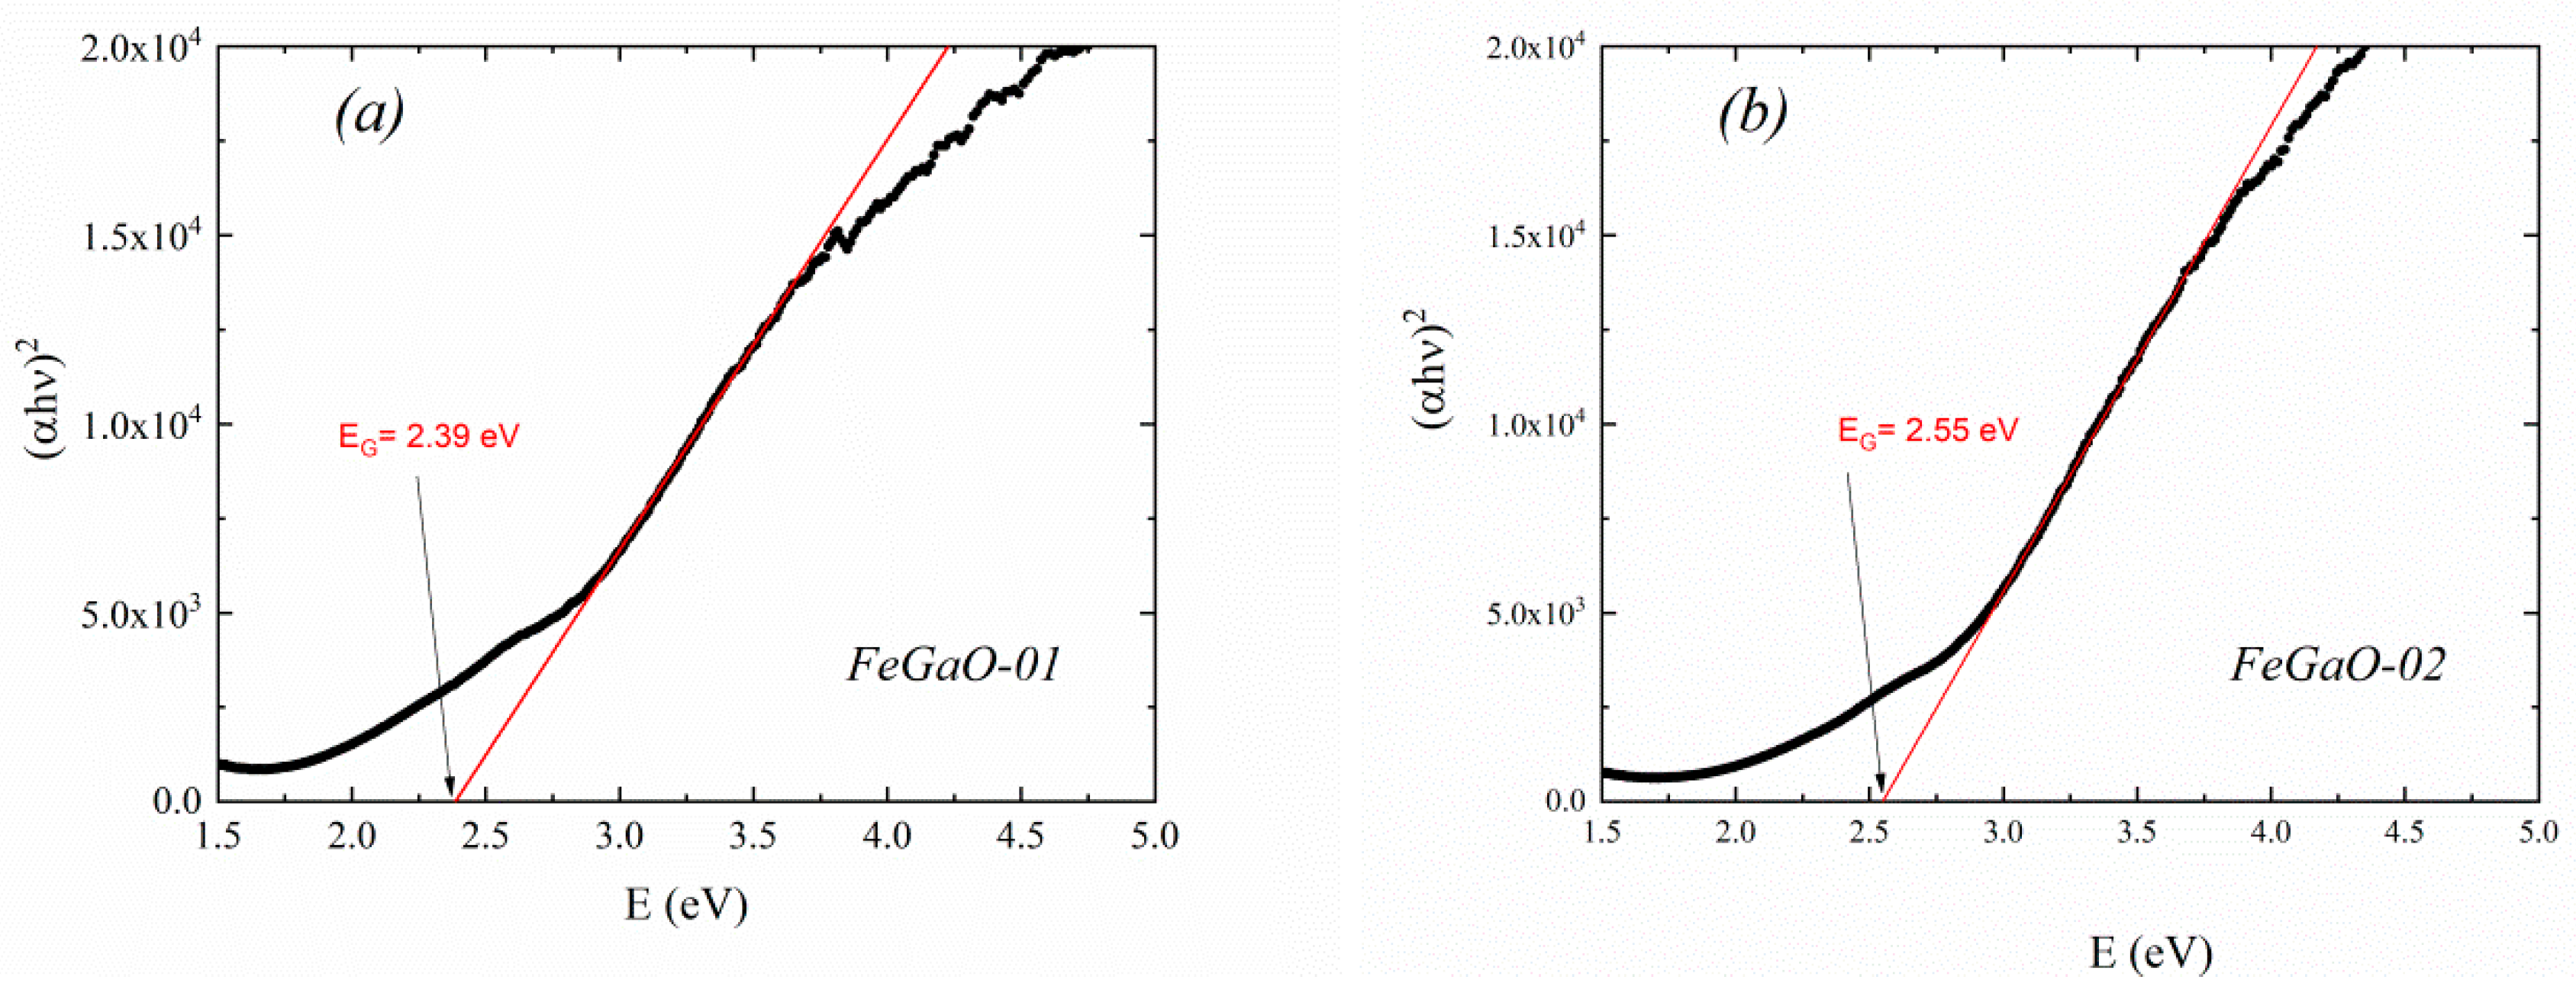
| Sample Name | Particle Size (nm) | Microstrain of Particles | Rietveld Refinement | Band Gap (eV) | ||||||||
|---|---|---|---|---|---|---|---|---|---|---|---|---|
| Space Group | Bragg R Factors (RB) | χ2 Values | The Lattice Constant a (Å) | Occupancy Ratios | ||||||||
| Tetrahedral Site | Octahedral Site | |||||||||||
| Fe1 | Ga1 | O3 | Fe2 | Ga2 | ||||||||
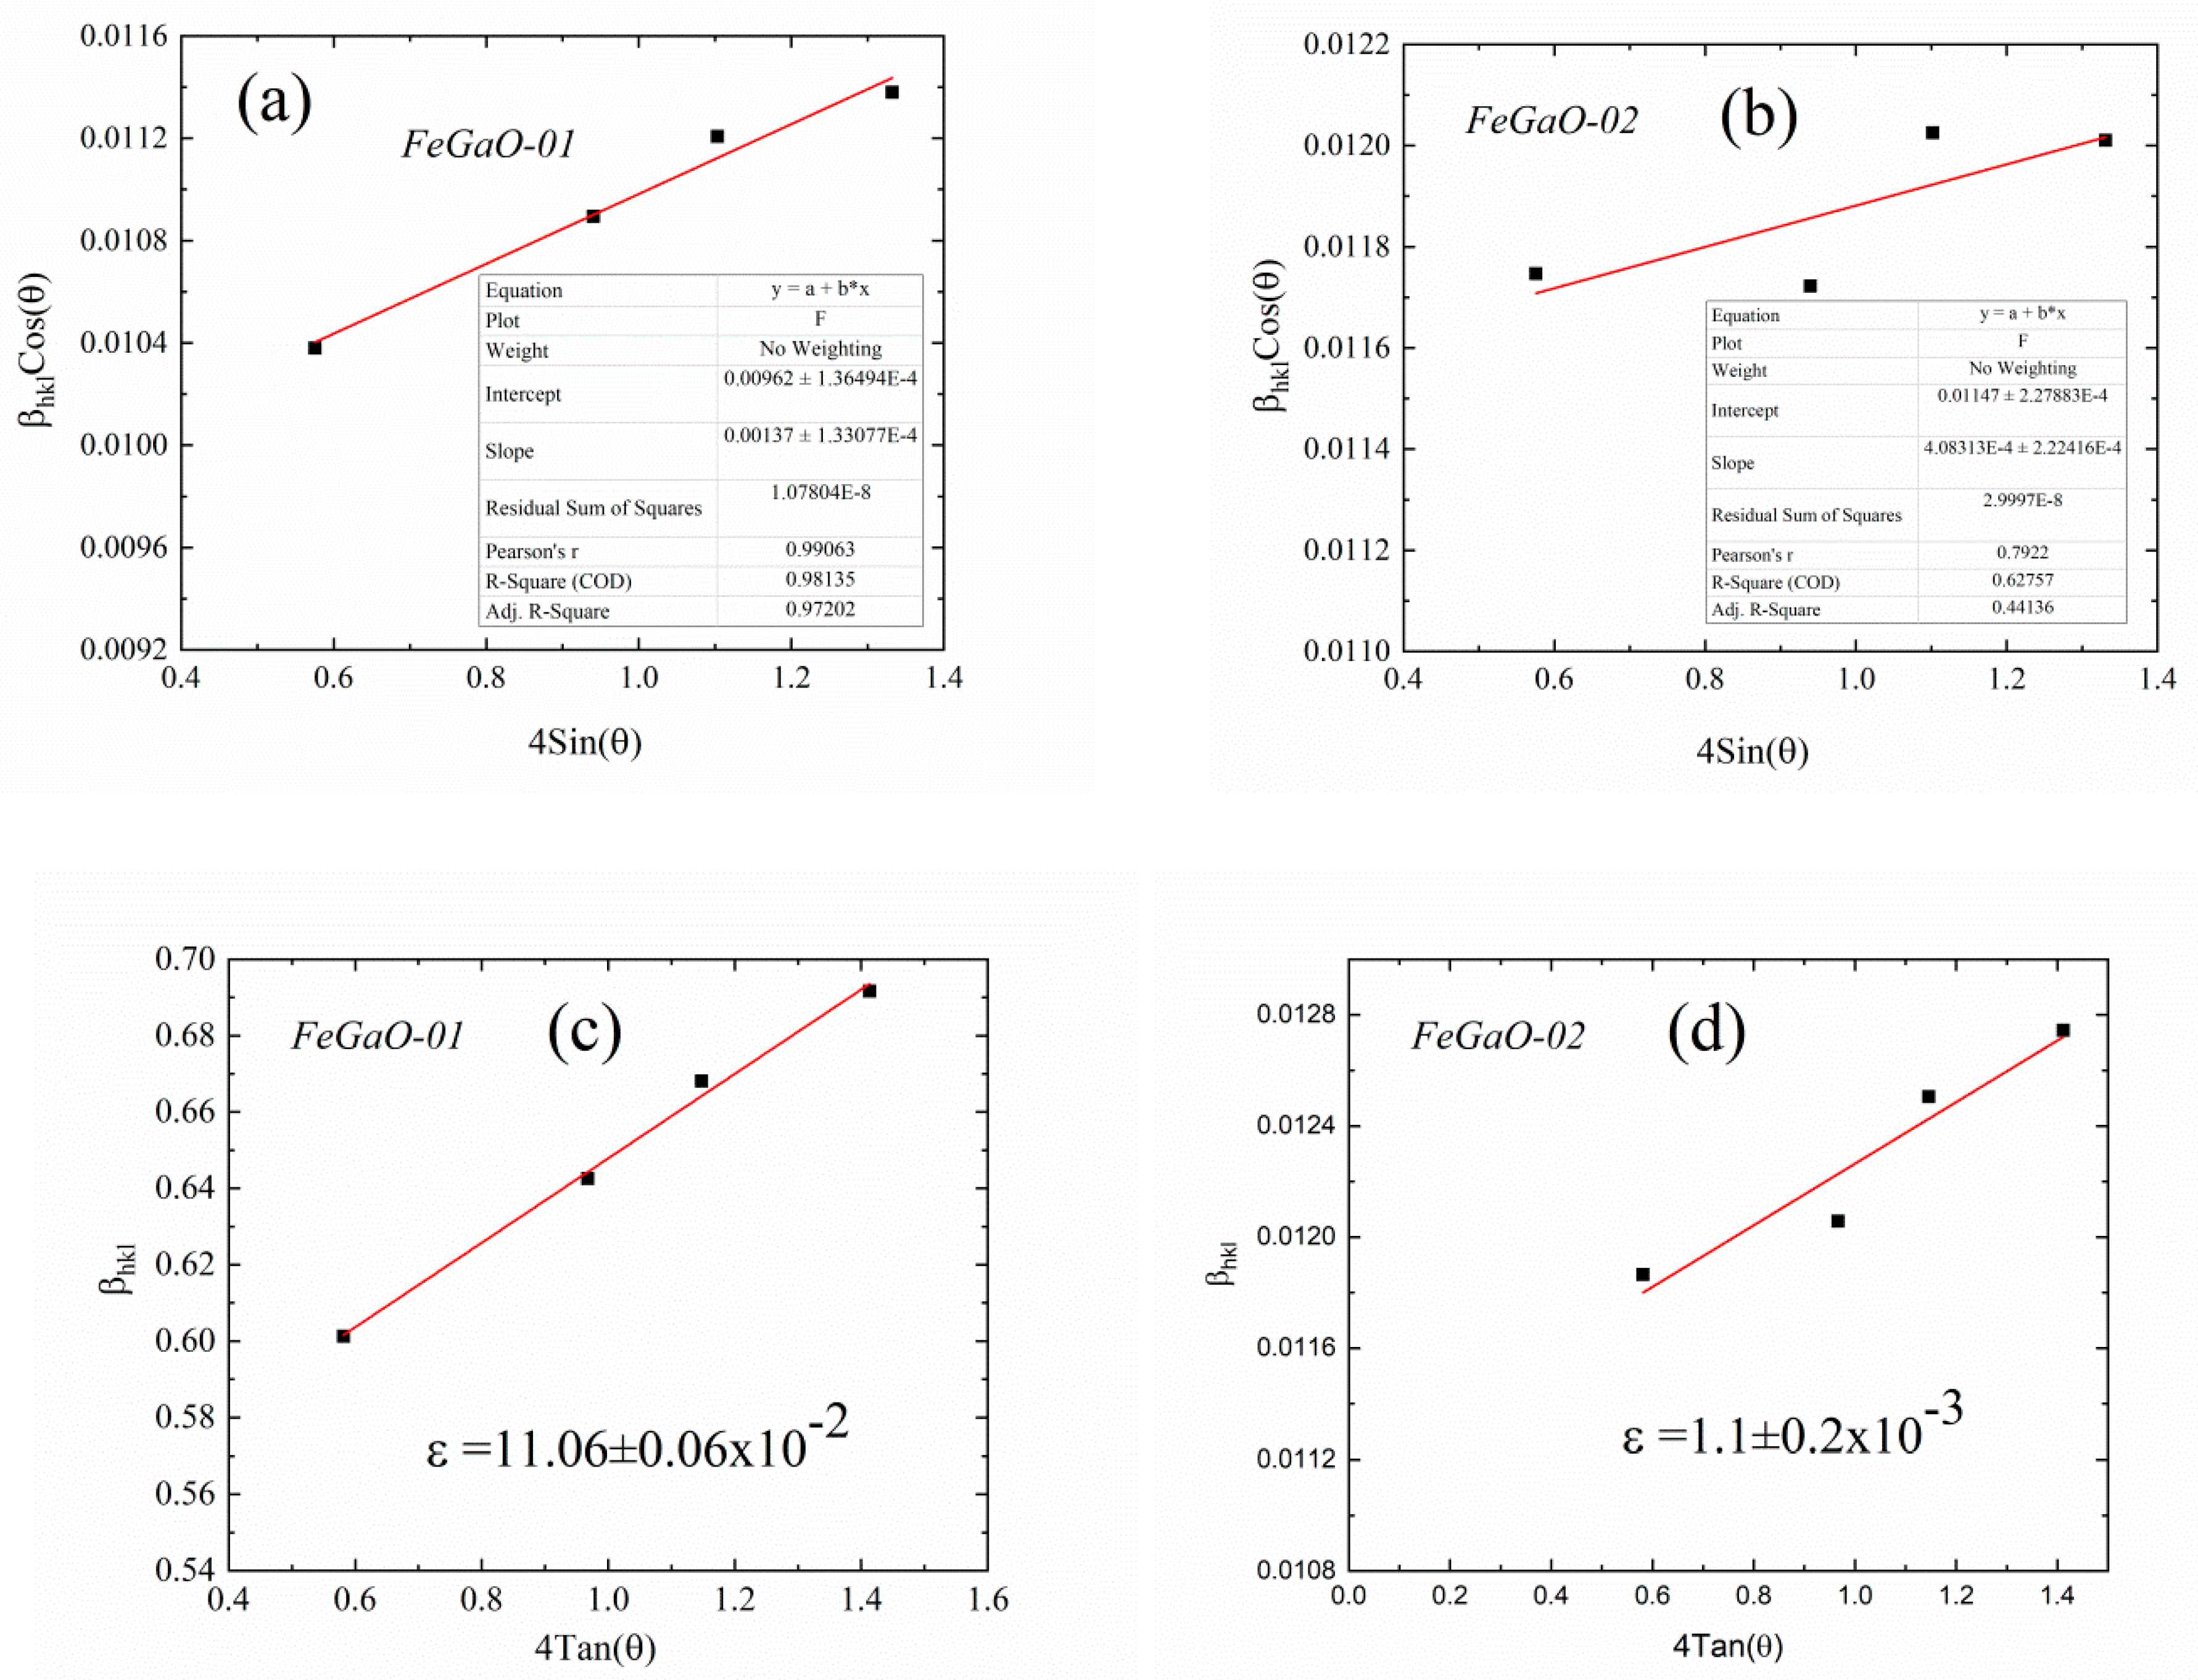
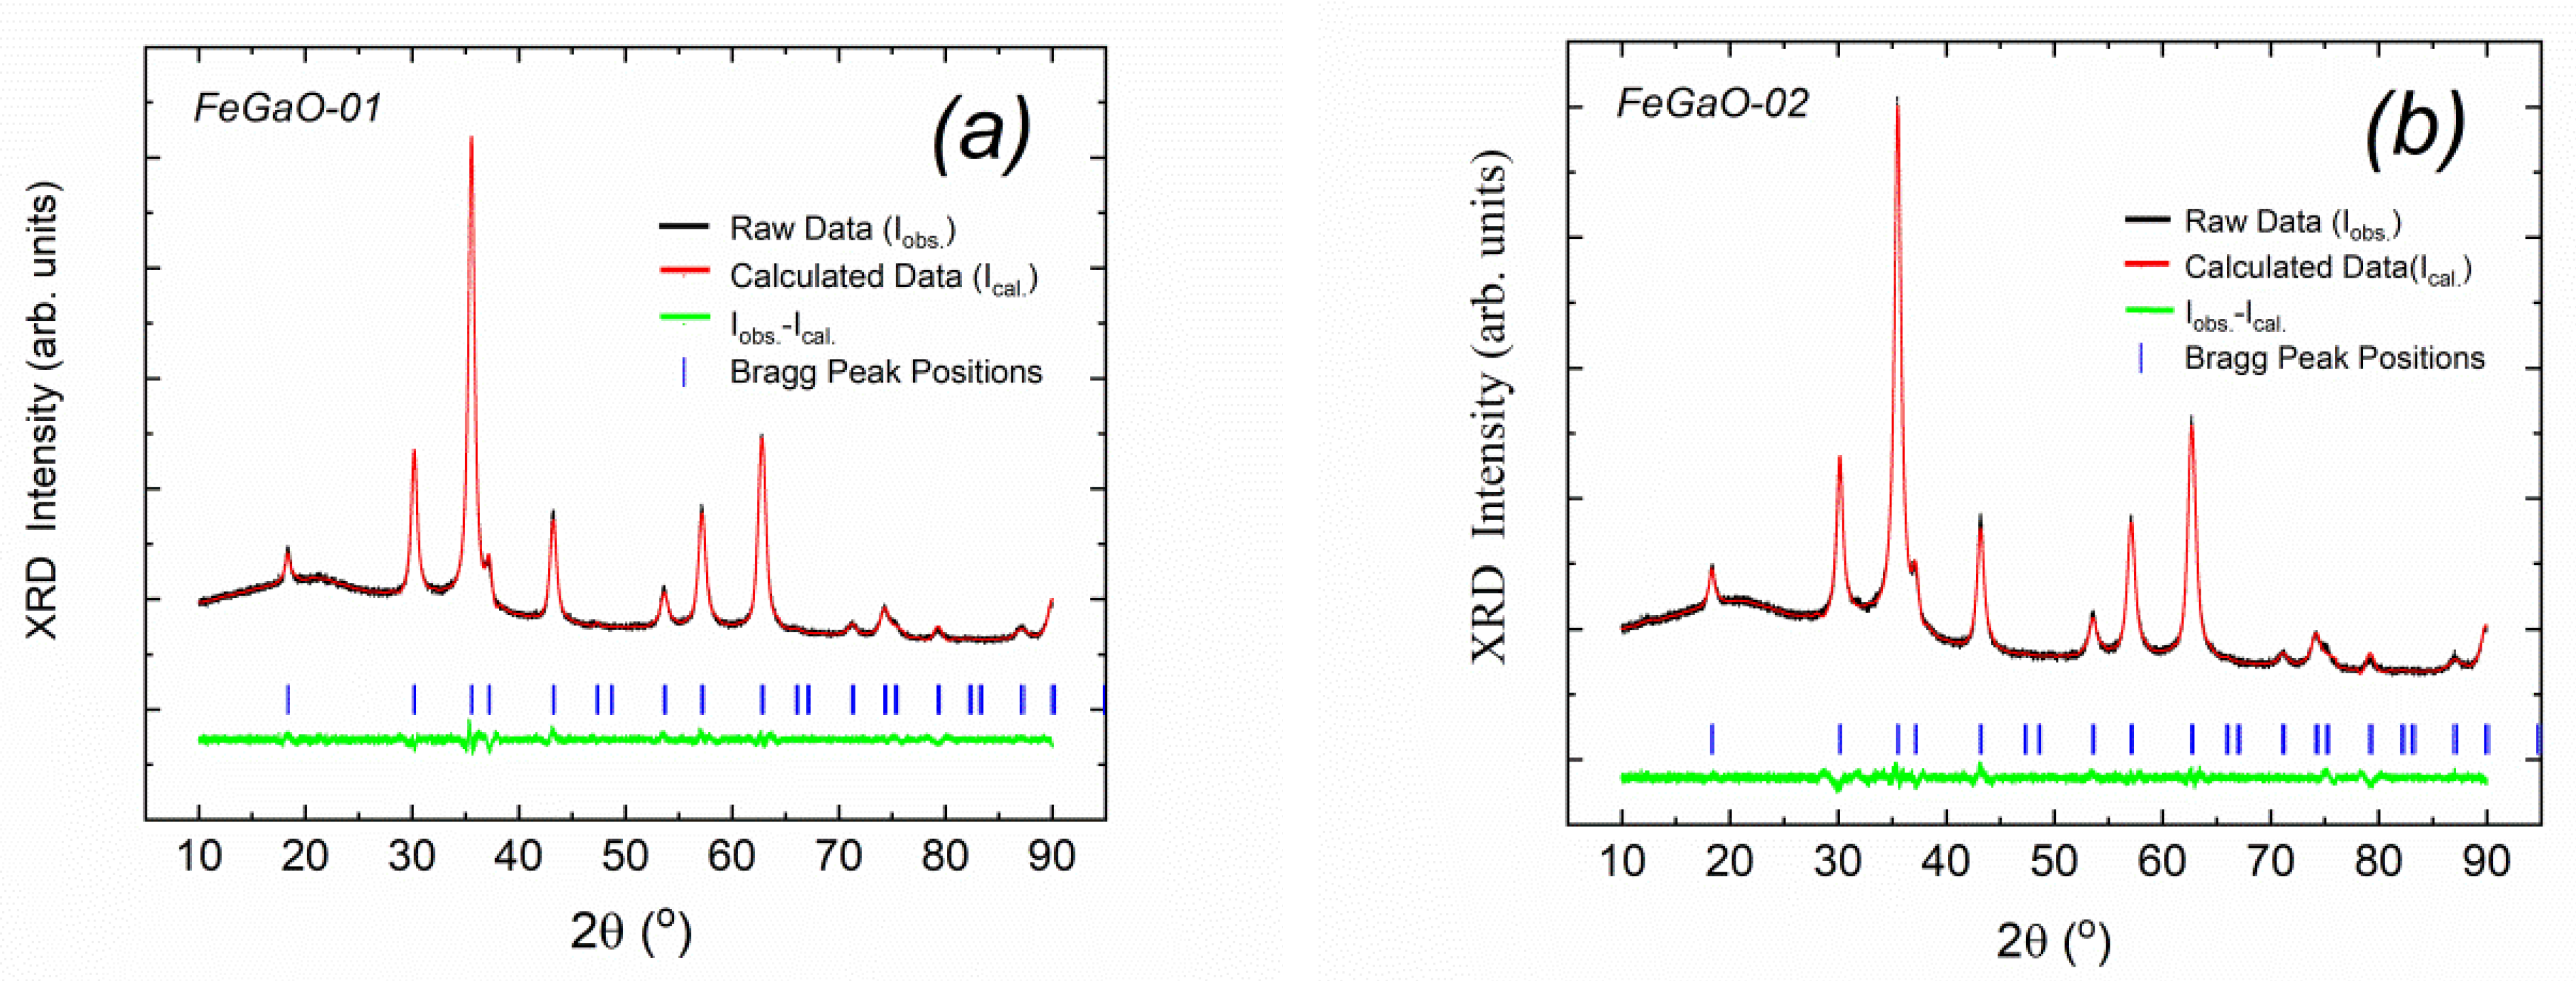
| FeGaO-01 | 14.4 | 11.06 ±0.06 × 10⁻² | F4d132 (No. 210) | 0.842 | 0.368 | 8.3687 ±0.0001 | 0.0693 | 0.1540 | 0.4417 | 0.1540 | 0.0693 | 2.39 ± 0.02 |
| FeGaO-02 | 12.0 | 1.1 ±0.2 × 10⁻³ | 0.910 | 0.338 | 8.3790 ±0.0003 | 0.0794 | 0.1397 | 0.4310 | 0.1760 | 0.0767 | 2.55 ± 0.01 | |
Publisher’s Note: MDPI stays neutral with regard to jurisdictional claims in published maps and institutional affiliations. |
© 2022 by the authors. Licensee MDPI, Basel, Switzerland. This article is an open access article distributed under the terms and conditions of the Creative Commons Attribution (CC BY) license (https://creativecommons.org/licenses/by/4.0/).
Share and Cite
Can, M.M.; Akbaba, Y.; Kaneko, S. Synthesis of Iron Gallate (FeGa2O4) Nanoparticles by Mechanochemical Method. Coatings 2022, 12, 423. https://doi.org/10.3390/coatings12040423
Can MM, Akbaba Y, Kaneko S. Synthesis of Iron Gallate (FeGa2O4) Nanoparticles by Mechanochemical Method. Coatings. 2022; 12(4):423. https://doi.org/10.3390/coatings12040423
Chicago/Turabian StyleCan, Musa Mutlu, Yeşim Akbaba, and Satoru Kaneko. 2022. "Synthesis of Iron Gallate (FeGa2O4) Nanoparticles by Mechanochemical Method" Coatings 12, no. 4: 423. https://doi.org/10.3390/coatings12040423
APA StyleCan, M. M., Akbaba, Y., & Kaneko, S. (2022). Synthesis of Iron Gallate (FeGa2O4) Nanoparticles by Mechanochemical Method. Coatings, 12(4), 423. https://doi.org/10.3390/coatings12040423