Abstract
One of the major challenges for agriculture related to climate change is drought. The increasing temperatures and decreasing precipitation in many parts of the world have enhanced the frequency and severity of drought events. Therefore, a detailed analysis is required in order to determine the drought frequency and take the necessary precautions. In this study, the climatic conditions in the agricultural region of Çukurova (Turkey) were analysed. Meteorological data for the three provinces of Adana, Mersin, and Osmaniye were used. The aim was to calculate the Standardized Precipitation Index (SPI) for each of the three provinces analysed, and to use these values to detect drought during the different growth periods of maize. We also investigated whether the SPI values for the last 30 years differ significantly between the provinces. Furthermore, indicators such as the duration, magnitude, severity, recurrence, and drought frequency were also calculated. Using linear regression analysis, we determined whether there were trends in the multi-year data for the total precipitation and mean temperature. In addition, the water deficiency was determined by examining the amount of water required by maize and the adequacy of the precipitation in each development period. As a result, it was found that the Çukurova region is prone to droughts, but they follow a mild course in most cases. However, no statistically significant differences were observed between the SPI values in the three provinces. The calculated average approximate drought recurrences (Tr) and expected intensities (Iave) were Tr ~ 1.036 years and Iave ~ 5.634 mm year−1 in 3 years for Adana, Tr ~ 1.031 years and Iave ~ −0.312 mm year−1 in 3 years for Mersin, and Tr ~ 1.052 years and Iave ~ −0.084 mm year−1 in 3 years Osmaniye. The research carried out in this paper confirmed that maize cultivation in the Çukurova region is vulnerable to drought, and adaptation actions should be taken immediately.
1. Introduction
The development of industry in recent years and the growth in the world’s population mean that the human influence on nature is constantly increasing. People directly impact the environment, e.g., through greenhouse gas emissions, excessive deforestation, or structural changes to the Earth’s surface. Greenhouse gas emissions contribute to increased air temperature, rising water levels in the oceans, the disappearance of glaciers, and shrinking ice caps in the Arctic and Antarctic regions. The observed global warming increases the risk and intensity of phenomena which are unfavourable to agriculture, such as drought, heat waves, violent storms or temperature drops and snowstorms [1,2].
Research and forecasts indicate that a warmer and drier climate will affect agriculture worldwide. A changing climate will make farming easier in Asia and worse in North America, Europe and Africa. According to forecasts [3], global maize and soybean yields could fall by 5% between 2050 and 2100 (and by up to 20% in some regions of the USA). The European Environment Agency [4] also points out that yields of non-irrigated crops—such as wheat, maize and sugar beet—are expected to decrease in southern Europe by up to 50% by 2050. Turkey is one of the Mediterranean basin countries that will be most affected by the climate change that can be seen due to global warming within its complex climate structure. Naturally, different regions of Turkey will be affected by climate change to varying degrees due to being surrounded by seas on three sides, and due to having a fragmented topography and orographic characteristics [5]. A temperature increase of 2 °C in the Mediterranean Basin will cause unexpected weather events, heat waves, and an increase in the number and impact of forest fires, and thus loss of biodiversity and agricultural productivity, and most importantly, drought. In Turkey, arid and semi-arid regions and semi-humid regions (South East, Central Anatolia, Aegean and Mediterranean Regions) that do not have sufficient water will be affected more by the increasing temperature [6]. The potential effects of climate change in this country will be affected by the predicted negative aspects such as irregular precipitation, especially the decrease in water resources, forest fires, drought, desertification, and ecological deterioration [7].
Using the latest research and climate models on crop development, scientists have shown that in a warming climate, it will become increasingly difficult to cultivate maize at the expense of wheat, the range of which is expected to increase. As global temperatures rise, it will be possible to grow it at ever higher latitudes, expanding the temperate climate [8]. However, temperature is not the only factor determining yields. To a certain extent, the higher concentration of carbon dioxide in the atmosphere positively affects photosynthesis and water retention, and increases yields, but this is at the expense of nutrient depletion in the crop. With climate change, farmers will have to adapt to the coming environmental changes and take more effective care of the soil and its capacity to retain water, carbon and nutrients. This will force farmers to look for new solutions and production methods. Therefore, the problem of adaptation to climate change is becoming one of the most significant challenges for modern agriculture.
Due to climate change, drought is felt more every day. Drought is a worldwide threat in dry and humid areas [9]. Drought is defined as a natural event that occurs as a result of the region receiving less precipitation for a longer period than normal, or as a result of the precipitation falling below the long annual average, which causes the land and water resources to be adversely affected, and causes the hydrological balance to deteriorate. The increasing temperatures and decreasing precipitation in many parts of the world due to global climate change increase the frequency and severity of drought events. Decreases in precipitation and drought are felt three times more in water resources. As a result, agricultural production will be affected the most. Droughts can be broadly classified into four types: meteorological, hydrological, agricultural and socioeconomic [10,11,12]. Meteorological droughts are defined as periods of rainfall deficiency. Meteorological droughts are also the starting point for hydrological droughts [13]. The next stage is agricultural drought, defined as a significant decrease in soil moisture, leading to crop failure. Worsening drought can lead to so-called socioeconomic drought. Its occurrence is related, for example, to the fact that natural water reservoirs and systems created by human action cannot satisfy the water demand [14]. Therefore, if the drought is not detected in time and the necessary precautions are not taken, it will cause significant damage to countries’ economies. The correct estimation of drought characteristics is crucial for the planning of efficient water resource use and agricultural production [15]. This is particularly important given that climate models indicate that the Mediterranean area is a hotspot for climate change in the current century [16].
More than 100 drought indices—such as the SPI [17], Erinç index [18], Percentage of the normal index [19], Palmer drought severity index [20,21], and Exploration drought index (RDI)—are used to determine drought in the world [22]. Among these indices, only the SPI is preferred more because of its use of the fewest meteorological variables (precipitation) and ease and simplicity of calculation at different time intervals. In addition, it allows the determination of both short-term and long-term meteorological and agricultural droughts [23].
Global research has increasingly focused on the assessment of the impact of drought on maize based on climate and agriculture data [24]. The impact of drought on maize crops is dependent on the plant growth stage, the duration of prevalence, and the intensity of the stress [25]. The drought occurrence during the milky-mature maize growth stage strongly affects yield changes [26]. Other studies on the effect of drought on different stages of maize development suggest that drought from the tasseling stage to the milk stage had the strongest effect on yields. In contrast, drought occurring from the milk stage to the physiological maturity stage was the least damaging [27]. It was also noted that an increase in the severity of drought stress reduced the seed yield and harvest index. The greater the drought stress, the greater the differences obtained in relation to the control plots [28]. Furthermore, it has been shown that drought-induced reductions in leaf, stalk, and plant total dry matter, and in leaf and stalk water content have a positive exponential or linear relationship with the water stress degree [29]. The measurements carried out to date show that drought is a serious challenge for maize cultivation. It is therefore important to carry out research and experiments in order to better understand this phenomenon, and to be able to detect it quickly and predict its course and intensity. The analysis of drought in the past will also make it possible to prevent the effects of future droughts more effectively.
In this study, the climatic conditions in the Çukurova region, one of Turkey’s agricultural districts, were analysed. Daily temperature and precipitation values measured at meteorological observation stations in three provinces (Adana, Mersin and Osmaniye) of the Çukurova region were used. This study aimed to calculate the SPI values for each of the three provinces analysed, and to use these values to detect drought in the different maize growth periods. It was also hypothesized that the Adana, Mersin and Osmaniye provinces were not statistically significantly different in terms of their SPI values during the maize growth period in the last 30 years. In addition, linear regression analysis was used to determine whether there are trends in the multi-year data for the total precipitation and mean temperature. Furthermore, the water deficiency was determined by examining the amount of water required by the plant and the adequacy of precipitation in each development period. This research will help us to understand the course of the drought in the agricultural region of Çukurova, Turkey. It will also indicate whether there is a need for different anti-drought measures for maize cultivation in this area.
2. Materials and Methods
2.1. Study Area
The Çukurova region is located in the east of the Mediterranean region, and it includes the provinces of Adana, Mersin and Osmaniye (Figure 1). The region has typical Mediterranean climate characteristics. The winters are warm and rainy, and summers are hot and dry. The overall average rainfall in the region is 647 mm. It rains, on average, 76 days a year. In total, 51% of the precipitation falls in winter, 26% falls in spring, 18% falls in autumn, and 5% falls in summer. Although the air is humid in the summer, there is no precipitation in some years. With the effect of the climate and latitude, hot, humid weather is seen in the region in summer. Although the average relative humidity is 66%, it rises above 90% in the summer. The long annual average temperature is 18.7 °C. Because the study area is hot, and because the climatic conditions are very different according to the altitude and surface forms in the region, there are also changes in the precipitation in the region. Although it varies from province to province, it is a summer day approximately 195.6 days a year in the region. The highest average temperature is seen in Mersin and its surroundings. While the average temperature of January is 15 °C, the average temperature in July, which is the hottest month, is 28 °C. The annual precipitation average of Mersin and its surroundings is higher than that of Adana and its surroundings, and the annual precipitation is 1096 mm. The average number of rainy days in the region is 85 days [30,31,32]. This paper uses data from meteorological stations of the Çukurova region located in three provinces: Adana (37°03′00.0″ N, 35°21′00.0″ E), Mersin (36°48′00.0″ N, 34°38′00.0″ E), and Osmaniye (37°06′00.0″ N, 36°15′00.0″ E). These data included the daily temperature (maximum, minimum and average) and precipitation (total, average, maximum and minimum) measured between 1950 and 2020. The main land use in the Çukurova region is agriculture. As much as 38% of the area of this region is arable land [33]. In terms of the soil texture class, this area has clay, clay loam, sandy clay loam, sandy loam, and loamy sand [34]. The Çukurova plain is shaped by three main rivers: the Ceyhan, the Seyhan, and the Berdan. The Çukurova Deltas contain precious wetlands containing numerous plant taxa, including many endemic and endangered plants [35]. Part of Cukurova is occupied by the Seyhan River Basin, with a predominantly Mediterranean climate, while the upper central part has a Continental climate [36]. The land-use structure in this basin is as follows: grassland (31.74%), dry cropland (22.22%), evergreen needleleaf forest (19.37%), and irrigated cropland (15.21%). On the other hand, the annual water balance is shown below: rainfall, 634 mm; evapotranspiration, 411.3 mm; runoff, 281.6 mm; and irrigation, 53.8 mm [37]. Most of the arable land of the Çukurova plain is irrigated by the Seyhan Dam Lake [38]. The analysis of satellite images in summer for this plain showed that maize occupies the largest area, at 76,778.5 ha, cotton occupies 20,499.6 ha, soybean occupies 17,796.7 ha, and watermelon occupies 6343.6 ha [39]. Furthermore, citrus plantations are also popular crops in the Çukurova region.
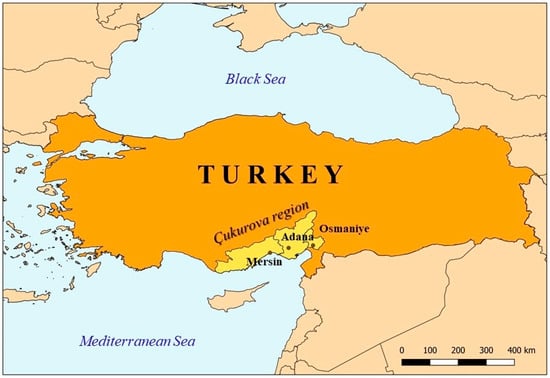
Figure 1.
The geographical location of the study area (the Çukurova region).
2.2. Methodology
2.2.1. Meteorological Data Analysis during the Maize Growing Period
The analysis of the meteorological data (precipitation and temperatures) in the Çukurova region was carried out over the entire maize growth period. This period includes the following five growth stages: the germination, seedling-tassel emergence, tassel-cob, peak formation–maturation, and harvest periods. The length of each maize development period, its start and end dates, the average water requirement (Pbgi) and the necessary average temperature are given in Table 1 [40,41,42]. The longest growing period of maize (60 days) is seedling-tassel emergence; the shortest one is the harvest (7 days). The plant has the highest daily water requirements during the tassel-cob phase, which is 8.13 mm·day−1 or 243.9 mm throughout this growth phase. The lowest daily Pbgi values occur in the germination period, at 2.03 mm·day−1, and the required temperature is the lowest, at 10–11 °C. The highest average temperature values are needed during harvest, and are 28–30 °C.

Table 1.
Average amount of water required by maize for each growing period (Pbgi) [40,41,42].
2.2.2. Standardized Precipitation Index (SPI)
In this research, the Standardized Precipitation Index (SPI) was used to determine the size, duration, severity and frequency of the drought in each growing period of maize in three provinces (Adana, Mersin, and Osmaniye) of the Çukurova region. SPI is a general meteorological drought index which was adopted by the World Meteorological Organization (WMO) in 2009 in order to determine national or regional droughts. The index uses long-term precipitation data. The index is used to calculate the dry and rainy periods that occur when the precipitation observed (Pi) in the region is below (Pi < P’) or above (Pi > P’) the long annual average (P’), or when the region receives more or less precipitation for longer than normal. SPIs calculated according to the cumulative probability value are evaluated by transforming the precipitation data into a standard normal probability distribution. In addition, past rainy (wet, humid) or drought periods can be determined on a national or regional basis, as well as future projections (forecasts) [10,43,44,45,46,47]. The negative value of the SPI value indicates the drought period, and the positive value indicates the precipitation period. The advantage of SPI is that drought intensities and sizes can be determined for different time intervals (1, 3, 6, 9, 12, 24 and 48 months) [48]. Bonaccorso et al. [49] suggested that SPI is more effective in the determination of the drought affecting short-term agricultural studies, such as 3 and 6 months, and in water resources, drought studies conducted in long time intervals such as 12 and 24 months. Theoretically, the probability distribution of SPI is the same as the normal (z) distribution used in statistics. Normal distribution breakpoints are used to classify SPI [48]. In this study, the SPI values were calculated for the different growth periods of maize in three provinces (Adana, Mersin, Osmaniye) using a formula:
Here, xi is the data of the precipitation time series, is the mean of the precipitation time series, and σ is the standard deviation of the precipitation time series [42,44,47,50,51].
The drought classification [52] presented in Table 2 was applied for the calculated SPI values.
Table 2.
Standardized Precipitation Index (SPI) and the drought classification scale.
2.2.3. Drought Duration (L) and Magnitude (M)
Besides the SPI values, the drought duration (L) was also calculated based on the available meteorological data. It is the length of time between the beginning and the end of the drought periods in which each successive dry period(s) occurs during the observation period [43,50,51,53,54].
In this publication, the drought magnitude (M) was also estimated. It is defined as the sum of the precipitation series data differences (drought), or the magnitude of the drought event experienced in a period when the precipitation series data (xi) falls below the average () of the long-term precipitation series data during the observation period. M is calculated from the following formula:
Here, the drought duration of each dry period occurring in the observation period is D, and SPIi is the SPI value at time i [43,50,51,53,54].
2.2.4. Drought Intensity/Severity (I)
Another calculated parameter was the drought severity (I). It is an indicator used to determine the level of drought in dry periods [54]. It is obtained by dividing the cumulative (cumulative) drought magnitude values obtained by summing the SPI values within each dry period during the observation period with the duration of the dry periods. Ii is calculated from the following formula:
Here, M is the drought size in period I, and L is the drought duration in period i [43,48,50,51,53,54,55].
2.2.5. Drought Frequency (f)
This paper also estimates the drought frequency (f). This term is defined as the number of dry periods per period of drought occurring during the observation period [54], or as the number of recurrences of each dry period (duration) occurring during the observation period.
Here, D is the number of dry periods in the observation period, and T is the total observation period [43,51,53,54,56].
2.2.6. Drought Recurrence (Tr)
The last drought-related parameter analysed was the drought recurrence. It is expressed as the repetition of any data in the observation series data, such as the hydrometeorological data, at a certain time.
Here, f is the frequency value (%) and Tr is the recurrence (year) [57].
2.3. Statistical Analysis
Several statistical analyses were also carried out in the study. They concerned the obtained results of the drought indices and the meteorological conditions occurring in the investigated provinces. Precipitation, one of the hydrometeorological variables, is one of the elements in which the climate changes the most over time. This variability is the most prominent feature of arid, semi-arid, or continental climates. Two methods are mainly used to determine the precipitation change and variability. These are Linear Regression Analysis (LRA) and Coefficient of Variation (CV), and were used in this study. LRA is expressed with a mathematical model developed to estimate the value (x) of a dependent variable from the value of an independent variable. In addition, the direction and size of the relationship between the variables are determined. The linear regression equation is as follows:
In the equation, y is the dependent variable, x is the independent variable, β0 is the y-axis intercept, β1 is the slope coefficient, ε is the error term, and N is the number of observation series data [57,58,59,60,61,62,63].
The second analysis carried out in this work involved the determination of the coefficient of variation (CV). Statistically, the hydrometeorological observation time-series data (xi) is the percentage (%) of the change of the standard deviation concerning the mean of the series; it is dimensionless (unitless). In addition, it is an appropriate measure to compare the variability in different classified or grouped series.
Here, xi is the observation series data, σ is the observation series standard deviation, is the observation series mean, and N is the number of observation series data. Among the serial data, the fact that the CV approaches zero indicates that the homogeneity (variability) decreases, and that it is greater than 20% indicates that the serial data is homogeneous [57,60,62,63,64]. All of the above statistical characteristics were determined using Microsoft Excel software.
The obtained SPI values were checked for potential differences between the provinces studied as part of the study. For this purpose, appropriate statistical tests were carried out in the R environment, more precisely in the program RStudio v1.2.5019. With the statistical tests’ help, the hypothesis that the SPI values calculated for the maize growth period from 1990 to 2020 do not differ significantly among the three provinces was verified.
3. Results
3.1. Meteorological Conditions in the Çukurova Region
Daily temperature and precipitation values measured (1950–2020) at the meteorological observation stations of the Adana, Mersin and Osmaniye provinces in the study area were used for the analyses conducted in this paper. The statistical characteristics of the long annual total precipitation (Pt) and temperature (T, [°C]) values are given in Table 3. Besides these, the extreme values (minimum and maximum), mean values (Ave) and standard deviation values (s) are included.
Table 3.
Statistical characteristics of the annual total precipitation and temperature of meteorology stations.
The highest temperature values of 44.4 °C were observed in the Adana province during the tassel-cob period. The same region also recorded the lowest values over the germination period (4.4 °C). Considering the average temperatures throughout the maize development period, the highest value was observed in Osmaniye, at 35.3 °C. The other two provinces achieved similar average temperature values for this period, at 22.3 °C for Mersin province and 22.6 °C for Adana. As for precipitation, the average values over the whole period of maize growth were the highest in the Osmaniye province (268.6 mm). Meanwhile, the lowest Pt Ave values were recorded in Mersin (102 mm). It should be noted that they are, at the same time, more than twice lower than those in the Osmaniye province. In the case of Adana, this value was 161.6 mm. Graphical representations of the long-year annual total precipitation (Pt) and average temperature (Tave) changes in each different growth period during the total growing period of maize, and the Linear Regression Analysis (LRA) trend equations are given in Figures S1–S3 in the supplementary materials (Supplementary S1). The study also analysed the annual average temperature changes. The long-term average temperature (Tave) changes required by maize in different development periods in the Çukurova region are given in Figures S1–S3 (Supplementary S1). Based on the LRA posted on the graphs for each maize growth period, several relationships were observed. For each growth period, an increasing trend was observed for Tave in all cases except for the tassel-cob period in Osmaniye province (Figure S2c), where a slightly decreasing trend was noted. When the total growing period of maize is examined, it can be determined that there is an increasing trend in Mersin, Osmaniye and Adana (Figure S3d–f). Furthermore, there has been a trend towards a significant increase in temperatures in the Mediterranean region [65,66]. A comparison was also made between the temperature values recommended for each maize development period in Table 1 and the temperature values of the provinces in Table 3 using the graphs in Figures S1–S3 (Supplementary S1). It was observed that there are suitable average temperatures for maize cultivation in all of these periods. However, temperature increases in the Çukurova region may adversely affect plant growth and yield. Moreover, in order to determine the percentage change between the data in the hydrometeorological observation series, the rate of change (RC) was calculated for each development period, and for the total growing period of maize. The results are given in Table 4.
Table 4.
Rates of change (RC) of the precipitation and temperature values for each development period, and for the total growing period of maize.
When Table 4 is examined, the average temperatures in each growth period varied between 1.365 and 3.631 °C in Adana, 1.291 and 4.225 °C in Mersin, and 0.302 and 3.684 °C in Osmaniye; the biggest change for the total growing period was +1.958 °C in Mersin, the smallest change was determined to be in Osmaniye, with +1.106 °C. It was determined that the changes in average temperatures tended to decrease between the germination and tassel-cob periods, and to increase between the peak formation and maturation periods. It was determined that the greatest average temperature change among the development periods of maize occurred during the germination period. Analysing the changes in total precipitation, it was observed that it varies between −173.150 and +56.200. Based on provinces, it was between −173.150 and 23.100 mm in Adana, −52.025 and +56.200 mm in Mersin, and +9.600 and +55.300 mm in Osmaniye. It was determined that the greatest changes occurred in the germination and seedling-tassel emergence periods within the development periods, while the greatest change in the total growing period was in Adana. In contrast, the smallest change occurred in Osmaniye.
3.2. Drought Analysis—Standardized Precipitation Index (SPI)
As part of the conducted research, the calculated values of the standardized precipitation index for particular periods of maize growth in three provinces of the Çukurova region were analyzed. The obtained results with the determined trends are presented in Figure 2, Figure 3 and Figure 4. The SPI was used to calculate the dry periods when a region receives less precipitation than normal. For this purpose, for each development period of maize, calculations with the SPI were made using the long annual total precipitation (Pt) values of the provinces of the Çukurova region.
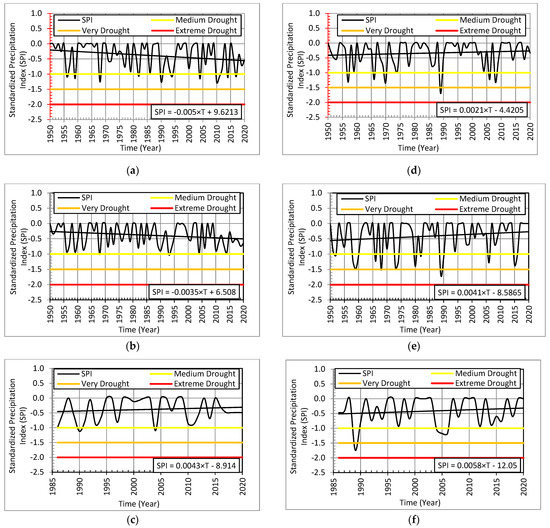
Figure 2.
Changes of the SPI values during (a) the germination period in Adana, (b) the germination period in Mersin, (c) and the germination period in Osmaniye; (d) the seedling-tassel emergence period in Adana, (e) the seedling-tassel emergence period in Mersin, and (f) the seedling-tassel emergence period in Osmaniye.
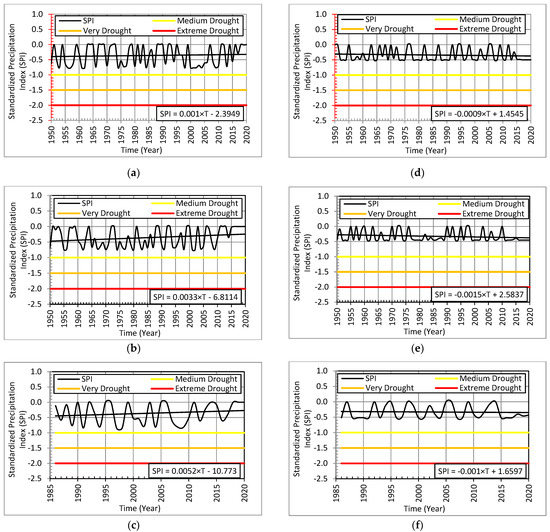
Figure 3.
Changes of the SPI values during (a) the tassel-cob period in Adana, (b) the tassel-cob period in Mersin, and (c) the tassel-Cob period in Osmaniye; and (d) the formation–maturation period in Adana, (e) the formation–maturation period in Mersin, and (f) the formation–maturation period in Osmaniye.
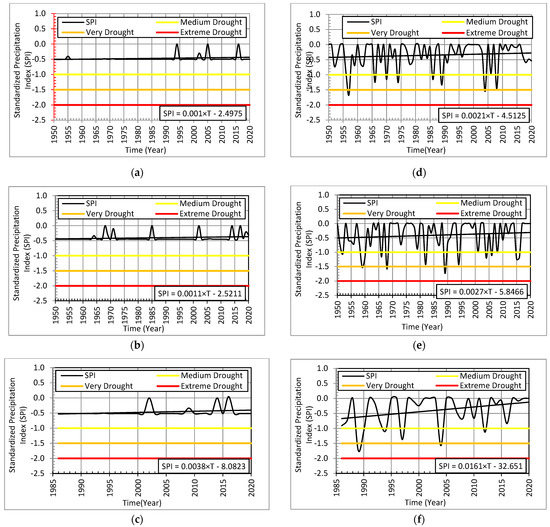
Figure 4.
Changes of the SPI values during (a) the harvest period in Adana, (b) the harvest period in Mersin, and (c) the harvest period in Osmaniye; and (d) the total period of maize growth in Adana, (e) the total period of maize growth in Mersin, and (f) the total period of maize growth in Osmaniye.
Analysing Figure 2, Figure 3 and Figure 4, it can be observed that the SPI values show a decreasing trend during the germination period in the Adana and Mersin provinces. In contrast, an increasing trend was observed for the same period in Osmaniye. For the formation–maturation period, a decreasing trend of SPI was recorded in all of the provinces. However, for the other periods, an increasing trend can be observed, as evidenced by the linear regression equations in the graphs. In general, it was determined that the size and severity of regional droughts are increasing in the Çukurova region. This is confirmed by Figure 4d–f, in which the whole period of maize growth is shown.
3.2.1. Drought Duration (L), Magnitude (M), Intensity (I), Frequency (f) and Recurrence Relationship (Rr)
Knowing the recurrence or frequency in terms of drought is important in revealing how often the decrease in precipitation could have occurred in the past. In order to characterize the drought, using the calculated SPI values and Table 2, the drought magnitudes, duration(s), intensities and frequencies of the dry periods were calculated for each development period and the total growing period. The calculated drought intensity (I) and the frequencies (f) of dry periods are given in Figure 5, Figure 6 and Figure 7.
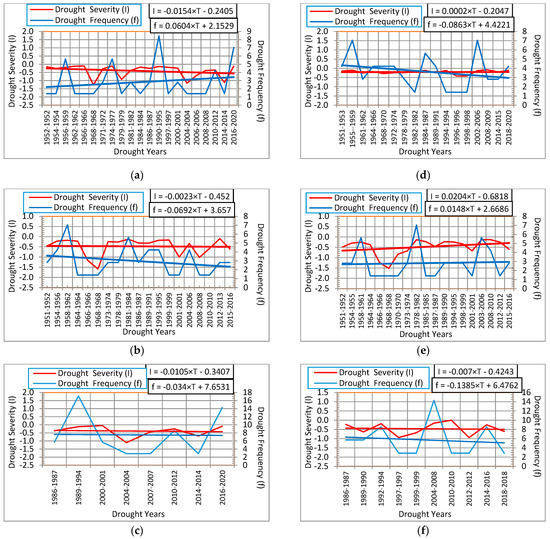
Figure 5.
Drought intensity and frequency changes during (a) the germination period in Adana, (b) the germination period in Mersin, and (c) the germination period in Osmaniye; and (d) the seedling-tassel emergence period in Adana, (e) the seedling-tassel emergence period in Mersin, and (f) the seedling-tassel emergence period in Osmaniye.
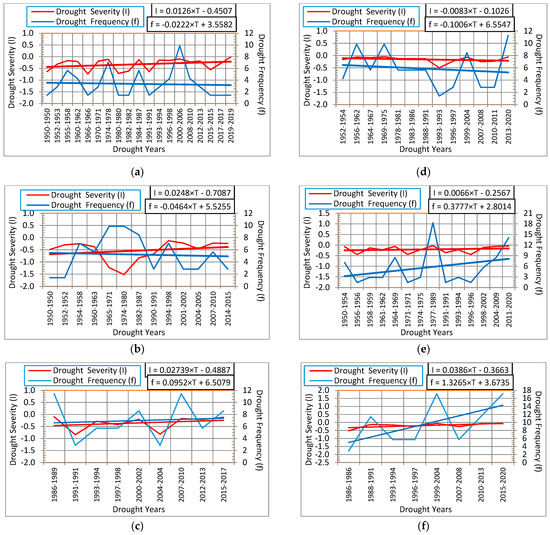
Figure 6.
Drought intensity and frequency changes during (a) the tassel-cob period in Adana, (b) the tassel-cob period in Mersin, and (c) the tassel-cob period in Osmaniye; and (d) the formation–maturation period in Adana, (e) the formation–maturation period in Mersin, and (f) the formation–maturation period in Osmaniye.
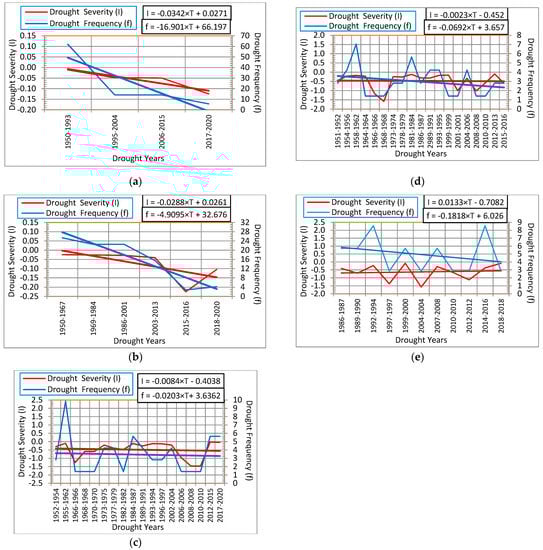
Figure 7.
Drought intensity and frequency changes during (a) the harvest period in Adana and (b) the harvest period in Mersin; and (c) the total period of maize growth in Adana, (d) the total period of maize growth in Mersin, and (e) the total period of maize growth in Osmaniye.
After analyzing Figure 5, Figure 6 and Figure 7, it was observed that, in Adana, there is an increasing trend of drought severity (I) during the periods of seedling emergence—tassel and tassel-cob—and a decreasing trend during the other periods. It was determined that there is a decreasing trend in the germination and harvest periods in Mersin, and an increasing trend in other periods. On the other hand, in Osmaniye, there was a decreasing trend in the periods of germination and seedling-tassel emergence, and an increasing trend in the severity of drought in the other stages. During the harvest period, the drought severity (I) in Adana ranged from −0.011 to −0.125, and showed a decreasing trend (Figure 7a). In Mersin, a decrease was also observed from −0.025 to −0.225 in 2016, whereas afterwards, an increase was noted until a value of −0.105 was reached in 2020 (Figure 7b). In Osmaniye, on the other hand, there was a slight increase in the drought severity values during the harvest period from 1986 (−0.032) to 2020, to a value of −0.025 (data not shown). Analysing the whole period of maize growth (Figure 7c–e), it can be observed that Adana and Mersin showed a rising trend of drought severity, while Osmaniye showed a declining one.
Furthermore, the drought frequency (f) course can also be read from Figure 5, Figure 6 and Figure 7. An increasing trend of f during the germination period was observed only in Adana province, and during seedling-tassel emergence only in Mersin. In contrast, during the tassel-cob and harvest periods, an increase in drought intensity occurred only in the Osmaniye province, and a decrease was recorded in the others. Kranz et al. [42] stated that the tassel-cob and peak formation–maturation periods are critical for fruit formation in maize cultivation. The water demand of the plant increases in July, August and June. In these periods, it is emphasized that serious decreases in yield may occur if the plant is stressed due to drought. For the formation–maturation period, an increasing trend of f was observed in Mersin and Osmaniye. For the harvest period, a decreasing trend was noted in both Adana and Mersin (Figure 7a,b). However, in the Osmaniye province, the f values increased between 1986 and 2020, from 45.71% to 51.43% (data not shown). In general, a decreasing trend of drought frequency (f) was noticed in all three provinces during the whole maize growth period. This is a positive development for maize cultivation in the Çukurova region. However, the increasing trend during the critical tassel-cob periods in Osmaniye and during the formation–maturation period in Mersin and Osmaniye should not be forgotten.
For the total growing period of maize in the Çukurova region, using Figure 7c–e, the annual average drought frequencies were as follows. The fave was calculated as ~3.443% in Adana, ~2.965% in Mersin, and ~4.935% in Osmaniye. The average drought intensities (Ii) were calculated using the calculated annual fave values and the equations in Figure 7d–f. The calculated Ii values are as follows: Adana Iave, ~5.634 mm year−1; Mersin Iave, ~−0.312 mm year−1; and Osmaniye Iave, ~−0.084 mm year−1. The calculated fave values were converted into the average drought recurrences (Tr) using Equation (5). Accordingly, they were calculated as Tr ~ 1.036 years in 3 years for Adana, Tr ~ 1.031 years in 3 years for Mersin, and Tr ~ 1.052 years in 3 years for Osmaniye.
3.2.2. Drought Classification and Statistical Analysis of the SPI Values for the Provinces
The SPI values calculated in this study were classified according to the commonly used scale presented in Table 2. This scale is recommended by [46], and is used at the European Drought Observatory. The SPI classification was performed for the growth period of maize from 1950 to 2020, taking into account the distribution between the individual developmental periods. The results obtained for each province of the Çukurova region are presented in Table 5.
Table 5.
Classification of the annual long drought (SPI) values of the maize plant.
It has been determined that the droughts in the region in 1952, 1966 and 2004 were very important. On a regional scale, normal seasons and moderate drought were found in each development period and the total growing season of maize. Regarding drought in the region, it was observed that starting from the tassel-cob period, it increased during the crown formation and maturation periods, especially during the harvest period. It was found that the occurrence of normal seasons and moderate drought intensified in Adana, and was normal in Mersin and Osmaniye during the periods of germination, peak formation and maturation of maize after 2009.
Furthermore, as part of the statistical analyses performed, the hypothesis that the SPI values calculated for the entire maize growth period from 1990 to 2020 do not differ significantly among the three provinces was also verified. Only records of the last 30 years (1990–2020) were used for the analysis due to the lack of data for Osmaniye province from 1950 to 1985. The analyses were performed in the R environment. First, the assumption of normality of the SPI distributions for the three provinces was checked using the Shapiro–Wilk test. A significance level of α = 0.05 was used. The Shapiro–Wilk test obtained the following results: for Adana, a p value of 0.3; for Mersin, a p value of 0.5799; and for Osmaniye, a p value of 0.681. The p values for each of the three provinces were greater than 0.05, and thus the assumption of normal distribution was met. The basic statistical characteristics for the calculated SPI values over the period 1990–2020 for each province are presented in Table 6.
Table 6.
Statistical characteristics of SPI during 1990–2020 for each province.
The next stage was Bartlett’s test. It was intended to verify the hypothesis of variance homogeneity. In this case, the significance level of α = 0.05 was also applied. As a result of the analysis conducted in the R environment, a p value of 0.03528 < α was obtained. The condition of homogeneity of variance was therefore not met. Therefore, the non-parametric Kruskal Wallis test was applied for further analyses. It was used to verify—at the significance level α = 0.05—the hypothesis H0: the SPI values calculated for the maize growth period in 1990–2020 do not differ significantly among the three provinces. A p value = 0.731 was obtained; therefore, at a significance level of 0.05, there are no grounds to reject the H0 hypothesis. Therefore, it can be concluded that the SPI values calculated for the maize growth period for the last 30 years are not significantly different among the three provinces studied. Therefore, the provinces are characterized by similar conditions concerning this drought index. The course of the SPI values for each province from 1990 to 2020 is shown in Figure 8.
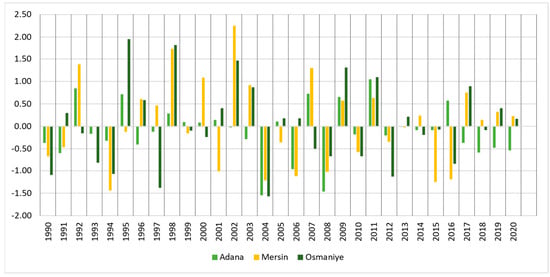
Figure 8.
SPI values during the maize growth period in each province from 1990 to 2010.
Analyzing the course of the SPI values in the last thirty years in the Çukurova region, it can be stated that they varied depending on the year considered. In six years (1990, 1994, 2004, 2008, 2010, and 2012), in all three provinces, the SPI was less than 0. The lowest values were recorded in 2004, and were −1.550 in Adana, −1.205 in Mersin and −1.573 Osmaniye. The highest SPI occurred in 2002, in the Mersin province, and reached 2.240. However, it should be noted that there were small negative SPI values in Adana in the same year. In 1990–2020, only three years’ (1998, 2009, and 2011) SPI values were greater than 0 in all three of the analysed provinces.
4. Discussion
Drought occurs in many climatic regions of the world. It causes significant losses in agriculture manifested by crop yield reductions. Severe droughts have been recorded over the past few decades, and will become more severe as climate change continues [67]. The researchers point out that climate analysis up to 2010 confirms the validity of models which assume that severe and widespread droughts will occur over numerous land areas over the next 30–90 years. These droughts will result from reduced precipitation and/or increased evaporation [68]. Furthermore, droughts’ frequency, intensity, and duration are expected to increase in many important agricultural areas. This situation threatens food production and regional or global security [69,70]. Climate change mainly affects cereal crops. This is also noticeable in arid and semi-arid regions. The plants found in these areas often face periods of water shortage, sometimes referred to as drought stress [71]. Drought stress primarily disrupts plant photosynthesis, affecting plant productivity [72]. As noted by researchers, the central, southern and south-eastern regions of Turkey are under the influence of a semi-arid and dry climate, and face the risk of desertification [73,74]. According to pessimistic scenarios, this risk will increase soon, causing the climate of Southern Turkey to become similar to the desert climate of Syria or Iraq [75]. Therefore, current research on the phenomenon of drought, its extent, and attempts to assess it and its impact on the economy are extremely important [76].
Currently, drought is assessed using a variety of indicators. Based on these, it is possible to determine its temporal and spatial extent, and its degree of severity [23]. In order to assess the magnitude of drought, numerical values have been adopted, so-called indices, which assimilate data from one or more indices characterising precipitation and evapotranspiration into a single numerical value [77,78]. The adopted value provides information on the magnitude and severity of the drought, and can be used to monitor and implement recovery plans. Many drought indices are currently used, including the Standardized Precipitation Index (SPI). The SPI is commonly applied as a meteorological indicator of drought to determine a drought’s duration and/or severity. Its simplicity and flexibility characterize it compared to other indices [79]. Therefore, the SPI index was also used in this study. According to a commonly accepted scale, its calculated values were taken to identify and classify droughts [52]. The SPI values classified as droughts for the last 30 years (1990–2020) in the three provinces of the Çukurova region are shown in Figure 9.
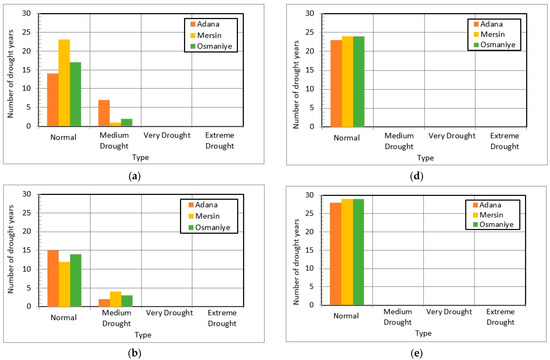
Figure 9.
Variation of the drought numbers in 1990–2020 during the maize growing periods: (a) germination, (b) seddling-tassel emergence, (c) tassel-cob, (d) peak formation–maturation, (e) harvest, and (f) total growth.
Analysing the results obtained, it can be observed that there were only normal seasons for three of the five maize growth periods (tassel-cob, peak formation–maturation, harvest) (Figure 9c–e). There were also medium droughts for the germination period and the seedling-tassel emergence (Figure 9a,b). The highest number of average droughts (7) occurred in Adana province during the germination period. Considering the whole period of maize growth in the Adana and Osmaniye provinces, there was one year (2004) for which the calculated SPI values were classified as a severe drought. Previous studies show that maize is a very sensitive crop to drought. Depending on the plant’s development stage, the occurrence of drought can result in a significant yield loss. Drought will majorly impact yields by causing leaf drop and loss during the emergence period. Furthermore, if drought is present for several growth stages of maize, it can lead to complete yield loss [80]. Severe water stress during the vegetative growth phase results in the stunting of plant growth, significantly reducing the leaf area and yield [81,82]. Maize leaf curl is the main symptom of drought. The research conducted so far shows that the first sign of water shortage is leaf rolling. The longer the leaf rolling, the greater the crop stress. It is assumed that yield loss occurs when drought stress occurs for four consecutive days or more. However, it should be noted that maize subjected to light water stress in the early development or late grain-filling stages shows a certain level of tolerance to water deficit due to its low water requirements at these stages [83]. The correct estimation of plant water needs is crucial for the growing of a productive crop [84]. Moreover, plant water needs help to determine whether irrigation systems are necessary. In the era of ongoing climate change, this aspect is crucial, and is the focus of many scientific papers [85,86,87,88]. The compilation of water needs and a detailed analysis of the meteorological data of the studied region allows for the observance and determination of water deficit periods. The determination of whether precipitation meets plant water needs is particularly important during plant growth. This study presents graphical comparisons (Figure 10) of whether the precipitation values during the growing season in the Çukurova region are sufficient regarding the amount of water required for maize development (Table 1).
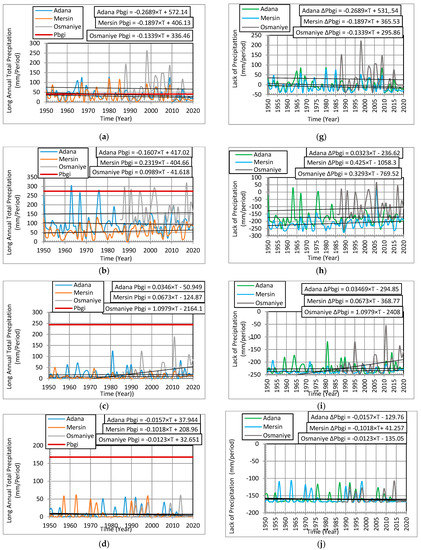
Figure 10.
Variation of the long annual total precipitattion (Pbgi) and lack of precipitation (ΔPbgi) during maize growing periods: (a) Pbgi germination, (b) Pbgi seddling-tassel emergence, (c) Pbgi tassel-cob, (d) Pbgi peak formation–maturation, (e) Pbgi harvest, and (f) Pbgi total growth; and (g) ΔPbgi germination, (h) ΔPbgi seddling-tassel emergence, (i) ΔPbgi tassel-cob, (j) ΔPbgi peak formation–maturation, (k) ΔPbgi harvest, and (l) ΔPbgi total growth.
Analysing the course of changes in annual total precipitation (Pt), a decreasing trend can be observed in the Adana and Mersin provinces during the germination and peak formation–maturation periods. In the seedling-tassel emergence period, a decreasing trend of Pt occurred in Adana, while an increasing trend of Pt was observed in Mersin. An increasing trend was found in both Adana and Mersin during the tassel-cob and peak formation–maturation periods (Figure 10a–f). In Osmaniye, on the other hand, it was determined that there was a tendency to increase in each cultivation period except germination. This result is most likely influenced by the location of the province. It is thought that Osmaniye may be between the Çukurova and Amanos mountainous areas, depending on the geographical and climatic characteristics of Osmaniye, which was reported by [30,31,32]. When the total growing period of maize is examined, it is determined that there is a decreasing trend in Adana, and an increasing trend in Osmaniye and Mersin (Figure 10f). The studies of [65,89] found that there is a decrease in total precipitation in the Eastern Mediterranean coasts of Turkey, and [66] found that the provinces of the Mediterranean region have determined that there are significant trends in decreasing precipitation (total, daily maximum and average) values.
Besides a detailed analysis of the changes in precipitation, we also compared the water needs of maize from Table 1. The difference between the precipitation and needs is shown in Figure 10g–l as lack of precipitation (ΔPbgi). It was determined that the total precipitation during the germination period may be almost sufficient. However, a little irrigation of the plant may be needed. In other periods until the harvest period, it was emphasized that the total precipitation was not sufficient; that is, the plant should be given increased amounts of water so that the plant will not suffer from water stress during these periods. Previous analyses of climatic conditions in Turkey assume that maize yields will be reduced and the growing season shortened due to increased temperatures and water stress [90]. Furthermore, an experiment conducted in Adana demonstrated that water stress reduces the grain weight, grain quality yield, and crude oil, protein and ash yield of maize in Adana. At the same time, some maize hybrids were shown to be less susceptible to this stress [91]. Insufficient available water in the soil impairs the metabolic activity of maize, leading to reduced biomass accumulation and slower photosynthesis by reducing the chlorophyll content of the leaves, with a consequent reduction in maize yield [92]. Previous scientific studies show that progressive drought reduces the maize grain yield more when it occurs in the reproductive phase than in the vegetative phase. Therefore, it can be concluded that the application of irrigation in the reproductive phase is extremely important, and should be an effective way to reduce the effects of drought [93]. On the other hand, concerning episodic drought, a strong effect of this stress on photosynthesis, maize growth and leaf morphological characteristics was observed during both the reproductive and vegetative phases [94]. Maize is a sensitive crop, and is susceptible to drought damage. In many countries, it is grown in areas where the rainfall is between 300 and 500 mm, close to or below the critical level for good yields [95]. However, it is possible to obtain the optimum maize yield through intensive irrigation during the flowering stage, even if the soil water content is insufficient at the vegetative growth and grain-filling stages [96]. Researchers point out that in water deficient areas, growing maize for grain is only justified if irrigation is used. They also stress that a suitable system is drip irrigation, which is more beneficial in the unit production effect obtained than sprinkler irrigation [97].
Researchers note that no single maize breeding strategy has been selected that is most effective in increasing the drought tolerance of this crop [98]. One of the directions taken is to research a variety of genotypes of this plant. The preliminary results show that some genotypes can increase the yield as well as the tolerance to water stress [99]. The application of genomic tools and the use of model plants also have potential in the search for drought-adaptive measures [100]. Furthermore, the cultivation of drought-tolerant maize hybrids may be future-proof, especially in water-limited areas [101]. Therefore, it is important to continue research in this area in order to increase the knowledge and development of this technology. Monitoring and testing crop performance under different drought conditions and severities is also crucial. It has been noted that enzyme activity has great potential to assess the drought tolerance of maize hybrids [102]. Furthermore, the search for methods to identify and classify maize drought is also important. In this respect, the great potential of deep-learning-based approaches has been noted [103].
In order to mitigate the adverse effects of climate change, scientists around the world are developing various mechanisms to prevent temporary water shortages effectively. Their work focuses on developing stress-tolerant and widely adapted crop varieties and improved agronomic practices [104]. Extensive research is being conducted into evaporation-reducing agents—antitranspirants—in agriculture. Previous experiments indicate a great potential of chitosan, which is an antitranspirant, to reduce the negative effects of drought on cereals [105]. Additionally, the introduction of maize varieties tolerant to periodic water shortages or surpluses and resistant to diseases and insect pests may contribute to the adaptation of maize for cultivation in many areas. Furthermore, in combination with precision agriculture, sustainable water management can effectively reduce the impact of adverse climate change. Scientists point out that proper water management is extremely important in Turkey. The use of modern tools and technologies to ensure efficient water use in agriculture, in compliance with environmental regulations, should be one of the priority objectives for the country. It is also crucial to implement proper irrigation methods that reduce water losses and excessive water use [106,107].
5. Conclusions
Maize is one of the most important crops grown globally [108]. It shows great potential for grain [109] and fodder production [110]. In 2020, as many as one-third of the world’s farms grew maize. Moreover, projections indicate that, by 2030, maize will overtake wheat as the most widely grown crop by area [111]. However, a major threat to the development of maize and many other cereals is the occurrence of drought. Drought is a natural disaster that is expected to be seen more frequently in the future due to global climate change, causing serious problems for agriculture. Ensuring water resource management in both rainy and dry periods will reduce the possibility of chronic drought problems such as water crises in the future.
This paper analysed the drought occurrence in three provinces (Adana, Mersin, and Osmaniye) in the Çukurova (Turkey) region during the maize growth period. The conducted research demonstrated that the region is prone to droughts, but they are mostly mild. Considering the whole maize growth period in the last 30 years (1990–2020), just one year was classified suffering severe drought in terms of SPI values. Moreover, in only three years was the SPI value greater than 0 for all three provinces. The statistical analysis carried out for the SPI values in 1990–2020 showed no significant differences between the three provinces. Thus, the entire Çukurova region is characterised by similar conditions concerning this index. The calculated average approximate drought recurrence (Tr) periods were Tr ~ 1.036 years for Adana, Tr ~ 1.031 years for Mersin, and Tr ~ 1.052 years for Osmaniye. Moreover, a detailed analysis of the meteorological conditions for the area showed that, except for the germination period, the precipitation occurring could not satisfy the water needs of maize. Furthermore, a decreasing trend in precipitation and an increasing trend in average temperatures were observed for several growth phases. Due to the lack of precipitation during the maize growth periods, an increase in the intensity of meteorological drought has also been noted. As a result, the area is also vulnerable to agricultural and hydrological drought.
In order to reduce the adverse effects of drought in the Çukurova region, several actions should be taken. Agricultural activities could be modernized, a drought prevention plan could be created, training could be given on the correct use of water, water resources could be regulated, and activities such as protection, technological innovations and changing land use could be implemented. As a result, for the studies to be carried out against drought in the study area to gain importance, such activities should be given priority, and attention should be drawn to the issue.
Supplementary Materials
The following supporting information can be downloaded at https://www.mdpi.com/article/10.3390/su14063697/s1: Supplementary S1—Changes in long annual total precipitation (Pt) and average temperature (Tave) during each maize growth period in the three provinces (Adana, Mersin, and Osmaniye).
Author Contributions
Conceptualization, J.K. and A.Y.; methodology, J.K. and A.Y.; software, A.Y. and R.R.; validation, A.A., R.R. and M.M.; formal analysis, J.K. and A.Y.; investigation, A.Y. and A.A.; resources, A.Y. and R.R.; data curation, A.Y. and M.M.; writing—original draft preparation, J.K. and D.L.; writing—review and editing, J.K. and D.L; visualization, J.K.; supervision, A.A.; project administration, A.A.; funding acquisition, R.R., A.A. and D.L. All authors have read and agreed to the published version of the manuscript.
Funding
This research received no external funding.
Institutional Review Board Statement
Not applicable.
Informed Consent Statement
Not applicable.
Data Availability Statement
Not applicable.
Conflicts of Interest
The authors declare no conflict of interest.
References
- Trajkovic, S.; Kolakovic, S. Wind-Adjusted Turc Equation for Estimating Reference Evapotranspiration at Humid European Locations. Hyrdolog. Res. 2009, 40, 45–52. [Google Scholar] [CrossRef]
- Jaiswal, R.K.; Lohani, A.K.; Tiwari, H.L. Statistical Analysis for Change Detection and Trend Assessment in Climatological Parameters. Environ. Process. 2015, 2, 729–749. [Google Scholar] [CrossRef]
- Lesk, C.; Coffel, E.; Winter, J.; Ray, D.; Zscheischler, J.; Seneviratne, S.I.; Horton, R. Stronger temperature–moisture couplings exacerbate the impact of climate warming on global crop yields. Nat. Food 2021, 2, 683–691. [Google Scholar] [CrossRef]
- EEA. Climate Change Threatens Future of Farming in Europe. EEA Newslertter Eur. Environ. Agency 2019, 3. Available online: http://createsend.com/t/d-4095A06AB38B386C2540EF23F30FEDED (accessed on 7 February 2022).
- Türkeş, M. Türkiye’de Gözlenen ve Öngörülen İklim Değişikliği, Kuraklık ve Çölleşme. Ank. Üniv. Çevrebilimleri Derg. 2012, 4, 1–32. [Google Scholar] [CrossRef]
- Türkeş, M. Influence of Geopotential Heights, Cyclone Frequency and Southern Oscillation on Rainfall Variations in Turkey. Int. J. Climatol. 1998, 18, 649–680. [Google Scholar] [CrossRef]
- Türkeş, M. Artan Sera Etkisinin Türkiye Üzerindeki Etkileri. Tübitak Bilim Ve Tek. Derg. 1994, 321, 71. [Google Scholar]
- Jägermeyr, J.; Müller, C.; Ruane, A.C.; Elliott, J.; Balkovic, J.; Castillo, O.; Faye, B.; Foster, I.; Folberth, C.; Franke, J.A.; et al. Climate impacts on global agriculture emerge earlier in new generation of climate and crop models. Nat. Food 2021, 2, 873–885. [Google Scholar] [CrossRef]
- Wang, W.; Ertsen, M.W.; Svoboda, M.D.; Hafeez, M. Propagation of Drought: From Meteorological Drought to Agricultural and Hydrological Drought. Adv. Meteorol. 2016, 2016, 6547209. [Google Scholar] [CrossRef]
- Mishra, A.K.; Singh, V.P. A Review of Drought Concepts. J. Hydrol. 2010, 39, 202–216. [Google Scholar] [CrossRef]
- Apurv, T.; Sivapalan, M.; Cai, X. Understanding the role of climate characteristics in drought propagation. Water Resour. Res. 2017, 53, 9304–9329. [Google Scholar] [CrossRef]
- Mukherjee, S.; Mishra, A.; Trenberth, K.E. Climate Change and Drought: A Perspective on Drought Indices. Curr. Clim. Chang. Rep. 2018, 4, 145–163. [Google Scholar] [CrossRef]
- Eltahir, E.A.B.; Yeh, P.J.-F. On the asymmetric response of aquifer water level to floods and droughts in Illinois. Water Resour. Res. 1999, 35, 1199–1217. [Google Scholar] [CrossRef]
- Mehran, A.; Mazdiyasni, O.; AghaKouchak, A. A hybrid framework for assessing socioeconomic drought: Linking climate variability, local resilience, and demand. J. Geophys. Res. Atmos. 2015, 120, 7520–7533. [Google Scholar] [CrossRef]
- Xu, K.; Yang, D.; Yang, H.; Li, Z.; Qin, Y.; Shen, Y. Spatio-temporal variation of drought in China during 1961–2012: A climatic perspective. J. Hydrol. 2015, 526, 253–264. [Google Scholar] [CrossRef]
- Lionello, P.; Scarascia, L. The relation between climate change in the Mediterranean region and global warming. Reg. Environ. Chang. 2018, 18, 1481–1493. [Google Scholar] [CrossRef]
- Angelidis, P.; Maris, F.; Kotsovinos, N.; Hrissanthou, V. Computation of Drought Index SPI with Alternative Distribution Functions. Water Resour. Manag. 2012, 26, 2453–2473. [Google Scholar] [CrossRef]
- Şarlak, N.; Mahmood Agha, O.M.A. Spatial and temporal variations of aridity indices in Iraq. Appl. Clim. 2018, 133, 89–99. [Google Scholar] [CrossRef]
- Willeke, G.; Hosking, J.R.M.; Wallis, J.R.; Guttman, N.B. The National Drought Atlas; Institute for Water Resources Report 94; U.S. Army Corps of Engineers: Washington, DC, USA, 1994.
- Alley, W.M. The Palmer Drought Severity Index: Limitations and Assumptions. J. Appl. Meteorol. Climatol. 1984, 23, 1100–1109. [Google Scholar] [CrossRef]
- Dai, A. Characteristics and trends in various forms of the Palmer Drought Severity Index during 1900–2008. J. Geophys. Res. Clim. Dyn. 2011, 116, D12115. [Google Scholar] [CrossRef]
- Asadi Zarch, M.A.; Malekinezhad, H.; Mobin, M.H.; Dastorani, M.T.; Kousari, M.R. Drought Monitoring by Reconnaissance Drought Index (RDI) in Iran. Water Resour. Manag. 2011, 25, 3485–3504. [Google Scholar] [CrossRef]
- Guttman, N.B. Comparing the Palmer Drought Index and the Standartized Precipitation Index. J. Am. Water Resour. Assoc. 1998, 34, 113–121. [Google Scholar] [CrossRef]
- Wang, C.; Linderholm, H.W.; Song, Y.; Wang, F.; Liu, Y.; Tian, J.; Xu, J.; Song, Y.; Ren, G. Impacts of Drought on Maize and Soybean Production in Northeast China During the Past Five Decades. Int. J. Environ. Res. Public Health 2020, 17, 2459. [Google Scholar] [CrossRef] [PubMed]
- Aslam, M.; Maqbool, M.A.; Cengiz, R. Drought Stress in Maize (Zea mays L.): Effects, Resistance Mechanisms, Global Achievements and Biological Strategies for Improvement; SpringerBriefs in Agriculture; Springer: Berlin/Heidelberg, Germany, 2015; Volume 8, pp. 5–17. [Google Scholar] [CrossRef]
- Guo, E.; Liu, X.; Zhang, J.; Wang, Y.; Wang, C.; Wang, R.; Li, D. Assessing spatiotemporal variation of drought and its impact on maize yield in Northeast China. J. Hydrol. 2017, 553, 231–247. [Google Scholar] [CrossRef]
- Zhu, X.; Xu, K.; Liu, Y.; Guo, R.; Chen, L. Assessing the vulnerability and risk of maize to drought in China based on the AquaCrop model. Agric. Syst. 2021, 189, 103040. [Google Scholar] [CrossRef]
- Khalili, M.; Naghavi, M.R.; Aboughadareh, A.P.; Rad, H.N. Effects of drought stress on yield and yield components in maize cultivars (Zea mays L.). Int. J. Agron. Plant Prod. 2013, 4, 809–812. [Google Scholar]
- Cai, F.; Zhang, Y.; Mi, N.; Ming, H.; Zhang, S.; Zhang, H.; Zhao, X. Maize (Zea mays L.) physiological responses to drought and rewatering, and the associations with water stress degree. Agric. Water Manag. 2020, 241, 106379. [Google Scholar] [CrossRef]
- Özçağlar, A. Akdeniz Bölgesi, 42 Sayfa, Ankara. 2012. Available online: http://geography.humanity.ankara.edu.tr/wp-content/uploads/sites/277/2015/08/ADANA-B%C3%96LGES%C4%B0-1.pdf (accessed on 10 January 2022).
- Aytaç, A.S.; Semenderoğlu, A. Amanos Dağlarının Orta Kesimi ve Yakın Çevresinin İklim Özellikleri. Turk. Stud. Int. Period. Lang. Lit. Hist. Turk. Or Turk. 2014, 9, 251–289. [Google Scholar]
- Çelik, M.A.; Gülersoy, A.E. Nur Dağları’nın (Amanoslar) Orta Kesiminin Farklı Yamaçlarında Bitki İndeks Değişiminin İzlenmesi. J. Institite Sci. Technol. 2017, 7, 87–97. [Google Scholar] [CrossRef]
- Alphan, H.; Yilmaz, K.T. Monitoring Environmental Changes in the Mediterranean Coastal Landscape: The Case of Cukurova, Turkey. Environ. Manag. 2005, 35, 607–619. [Google Scholar] [CrossRef]
- Akça, M.O.; Hisatomi, S.; Takemura, M.; Harada, N.; Nonaka, M.; Sakakibara, F.; Takagi, K.; Turgay, O.C. 4,4′-DDE and Endosulfan Levels in Agricultural Soils of the Çukurova Region, Mediterranean Turkey. Bull. Environ. Contam. Toxicol. 2005, 96, 376–382. [Google Scholar] [CrossRef]
- Çakan, H.; Yilmaz, K.; Düzenli, A. First comprehensive assessment of the conservation status of the flora of the Çukurova Deltas, southern Turkey. Oryx 2005, 39, 17–21. [Google Scholar] [CrossRef][Green Version]
- Fujihara, Y.; Tanaka, K.; Watanabe, T.; Nagano, T.; Kojiri, T. Assessing the impacts of climate change on the water resources of the Seyhan River Basin in Turkey: Use of dynamically downscaled data for hydrologic simulations. J. Hydrol. 2008, 353, 33–48. [Google Scholar] [CrossRef]
- Tanaka, K.; Yoichi, F.; Tsugihiro, W.; Toshiharu, K.; Shuichi, I. Projection of the impact of climate change on the surface energy and water balance in the Seyhan River Basin Turkey. In The Final Report of ICCAP; Research Institute for Humanity and Nature, The Scientific and Technological Research Council of Turkey: Ankara, Turkey, 2007; pp. 87–90. [Google Scholar]
- Satir, O.; Berberoglu, S. Crop yield prediction under soil salinity using satellite derived vegetation indices. Field Crops Res. 2016, 192, 134–143. [Google Scholar] [CrossRef]
- Cilek, A.; Berberoglu, S. Object-Based Crop Mapping Using Multi-Temporal Landsat 8 Imagery. Ahmet Cilek Int. J. Eng. Res. Appl. 2018, 8, 34–37. [Google Scholar] [CrossRef]
- Doorenbos, J.; Kassam, A.H.; Bentvelsen, C.I.M.; Branscheld, V.; Pıusjé, J.M.A.G.; Smith, M.; Ulttenbogaard, G.O.; van der Wal, H.K. Yield Response to Water, Food and Agriculture Organization of the United Nations. FAO Irrig. Drain. Pap. 1979, 33, 203. [Google Scholar]
- Allen, R.G.; Pereira, L.S.; Raes, D.; Smith, M. Crop Evapotranspiration-Guidelines for Computing Crop Water Requirements. FAO Irrig. Drain. Pap. 1998, 56, 300. [Google Scholar]
- Kranz, W.L.; Irmak, S.; van Donk, S.; Yonts, C.D.; Martin, D.L. Irrigation Management for Corn, NebGuide; University of Nebraska, Lincoln Extension, Institute of Agriculture and Natural Resources: Lincoln, NE, USA, 2008; p. 4. [Google Scholar]
- McKee, T.B.; Doesken, N.J.; Kleist, J. The Relationship of Drought Frequency and Duration to Times Scales. In Proceedings of the 8th Conference on Applied Climatology, Boston, MA, USA, 17–22 January 1993; pp. 179–183. [Google Scholar]
- Agnew, C.T. Using the SPI to Identify Drought. Drought Netw. News 2000, 12, 6–11. Available online: https://digitalcommons.unl.edu/droughtnetnews/1 (accessed on 7 February 2022).
- Rossi, G.; Bonaccorso, B.; Vega, T. Methods and Tools for Drought Analysis and Management; Springer Science & Business Media: Berlin/Heidelberg, Germany, 2007; Volume 62, p. 415. [Google Scholar]
- AghaKouchak, A.; Farahmand, A.; Melton, F.S.; Teixeira, J.; Anderson, M.C.; Wardlow, B.D.; Hain, C.R. Remote Sensing of Drought: Progress, Challenges and Opportunities. Rev. Geophys. 2015, 53, 452–480. [Google Scholar] [CrossRef]
- Pereira, V.R.; Blain, G.C.; de Avila, A.M.H.; Pires, R.C.M.; Pinto, H.S. Impacts of Climate Change on Drought: Changes to Drier Conditions at the Beginning of the Crop Growing Season in Southern Brazil. Agrometeorol. Bragantina 2018, 77, 201–211. [Google Scholar] [CrossRef]
- Ganguli, P.; Reddy, M.J. Evaluation of Trends and Multivariate Frequency Analysis of Droughts in Three Meteorological Subdivisions of Western India. Int. J. Climatol. 2014, 34, 911–928. [Google Scholar] [CrossRef]
- Bonaccorso, B.; Bordi, I.; Cancelliere, A.; Rossi, G.; Sutera, A. Spatial Variability of Drought: An Analysis of the SPI in Sicily. Water Resour. Manag. 2003, 17, 273–296. [Google Scholar] [CrossRef]
- Yevjevich, V.M. An Objective Approach to Definitions and Investigations of Continental Hydrologic Droughts. Hydrology Papers; Colorado State University: Fort Collins, CO, USA, 1967; p. 25. [Google Scholar]
- Şen, Z. Applied Drought Modeling, Prediction, and Mitigation; Elsevier Inc.: Boston, MA, USA, 2015; p. 474. [Google Scholar]
- European Commission. Standardized Precipitation Index (SPI), Copernicus European Drought Observatory (EDO), EDO Indicator Factsheep-Standardized Precipitation Index (SPI). 2020. Available online: https://edo.jrc.ec.europa.eu/documents/factsheets/factsheet_spi.pdf (accessed on 10 January 2022).
- Gidey, E.; Dikinya, O.; Sebego, R.; Segosebe, E.; Zenebe, A. Modeling the Spatio-Temporal Meteorological Drought Characteristics Using the Standardized Precipitation Index (SPI) in Raya and Its Environs, Northern Ethiopia. Earth Syst. Environ. 2018, 2, 292–303. [Google Scholar] [CrossRef]
- Vogt, J.V.; Naumann, G.; Masante, D.; Spinoni, J.; Cammalleri, C.; Erian, W.; Pischke, F.; Pulwarty, R.; Barbosa, P. Drought Risk Assessment and Management. A Conceptual Framework; EUR 29464 EN; Publications Office of the European Union: Luxembourg, 2018. [Google Scholar] [CrossRef]
- Spinoni, J.; Naumann, G.; Carrao, H.; Barbosa, P.; Vogt, J. World Drought Frequency, Duration, and Severity for 1951–2010. Int. J. Climatol. 2014, 34, 2792–2804. [Google Scholar] [CrossRef]
- Li, Y.J.; Zhang, X.D.; Lu, F.; Ma, J. Analysis of Drought Evolvement Characteristics Based on Standardized Precipitation Index in the Huaihe River Basin. Procedia Eng. 2012, 28, 434–437. [Google Scholar] [CrossRef]
- Haan, C.T. Statistical Methods in Hydrolgy; Iowa State University Press: Ames, ID, USA, 1979; 197p. [Google Scholar]
- Thom, H.C.S. Some Methods of Climatological Analysis, World Meteorological Organization; Technical Note No. 81; WMO. No. 199. TP. 103; WMO: Geneva, Switzerland, 1966; 69p. [Google Scholar]
- Graybill, F.A.; Lyer, H.K. Regression Analysis: Concept and Applications; Duxbury Press: Duxbury, MA, USA, 1994. [Google Scholar]
- Gupta, S.C.; Kapoor, V.K. Fundamentals of Mathematical Statistics (A Modern Approach), Tenth Revised Edition, Sultan; Chand&Sons. Educational Publishers: New Delhi, India, 2000; p. 1303. [Google Scholar]
- Yan, X.; Su, X.G. Linear Regression Analysis Theory and Computing; World Scientific Publishing Co. Pte. Ltd.: Singapore, 2009; p. 349. [Google Scholar]
- Sene, K. Hydrometeorology Forecasting and Applications; Springer Science + Business: London, UK, 2010; p. 356. [Google Scholar] [CrossRef]
- Ramesh, S.; Teegavarapu, V.; Salas, J.D.; Stedinger, J.R. Statistical Analysis of Hydrologic Variables Methods and Applications; The American Society of Civil Engineers (ASCE): Reston, VA, USA, 2019; p. 552. [Google Scholar]
- Brown, C.E. Coefficient of Variation. In Applied Multivariate Statistics in Geohydrology and Related Sciences; Springer: Berlin/Heidelberg, Germany, 1998. [Google Scholar] [CrossRef]
- Bahadır, M. Türkiye’de İklim Değişikliğinin İklim Bölgelerine Yansımasında Kuzey-Güney Yönlü Sıcaklık ve Yağış Değişim Öngörüleri. Uluslararası Hakemli Sos. Bilimler E-Derg. Akad. Bakış Derg. 2011, 26, 1–18. [Google Scholar]
- Yücel, A.; Atılgan, A.; Hasan Öz, H. Trend Analysis in Temperature, Precipitation and Humidity: The Case of Mediterranean Region. In Scientific Papers. Series E. Land Reclamation, Earth Observation & Surveying, Environmental Engineering; Sustainable Development of Rural Area: Bucharest, Romania, 2019; pp. 90–98. [Google Scholar]
- Daryanto, S.; Wang, L.; Jacinthe, P.A. Global Synthesis of Drought Effects on Maize and Wheat Production. PLoS ONE 2016, 11, e0156362. [Google Scholar] [CrossRef]
- Dai, A. Increasing drought under global warming in observations and models. Nat. Clim. Chang. 2013, 3, 52–58. [Google Scholar] [CrossRef]
- Schlenker, W.; Roberts, M.J. Estimating the Impact of Climate Change on Crop Yields: The Importance of Nonlinear Temperature Effects; National Bureau of Economic Research: Cambridge, MA, USA, 2008; pp. 1–35. [Google Scholar] [CrossRef]
- Wheeler, T.; von Braun, J. Climate change impacts on global food security. Science 2013, 341, 508–513. [Google Scholar] [CrossRef]
- Efeoğlu, B.; Ekmekçi, Y.; Çiçek, N. Erratum to “Physiological responses of three maize cultivars to drought stress and recovery”. S. Afr. J. Bot. 2009, 75, 34–42. [Google Scholar] [CrossRef]
- Porter, J.R.; Challinor, A.J.; Henriksen, C.B.; Howden, S.M.; Martre, P.; Smith, P. Invited review: Intergovernmental Panel on Climate Change, agriculture, and food–A case of shifting cultivation and history. Glob. Chang. Biol. 2019, 25, 2518–2529. [Google Scholar] [CrossRef] [PubMed]
- Altin, T.B.; Barak, B.; Altın, B.N. Change in precipitation and temperature amounts over three decades in Central Anatolia, Turkey. Atmos. Clim. Sci. 2012, 2, 107–125. [Google Scholar] [CrossRef]
- Altin, T.B.; Barak, B. Trends and changes in tropical and summer days at the Adana Sub-Region of the Mediterranean Region, Southern Turkey. Atmos. Res. 2017, 196, 182–199. [Google Scholar] [CrossRef]
- Şahin, Ü.; Kurnaz, L. Climate Change and Drought (İklim Değişikliği ve Kuraklık), 1st ed.; Kuraklık Raporu; İstanbul Politikalar Merkezi: Istanbul, Turkey, 2014; pp. 1–38. [Google Scholar]
- Altin, T.B.; Altin, B.N. Response of hydrological drought to meteorological drought in the eastern Mediterranean Basin of Turkey. J. Arid Land 2021, 13, 470–486. [Google Scholar] [CrossRef]
- Zargar, A.; Sadiq, R.; Naser, B.; Khan, F.I. A review of drought indices. Environ. Rev. 2011, 19, 333–349. [Google Scholar] [CrossRef]
- Haied, N.; Foufou, A.; Chaab, S.; Azlaoui, M.; Khadri, S.; Benzahia, K.; Benzahia, I. Drought assessment and monitoring using meteorological indices in a semi-arid region. Energy Procedia 2017, 119, 518–529. [Google Scholar] [CrossRef]
- Shah, R.; Bharadiya, N.; Manekar, V. Drought Index Computation Using Standardized Precipitation Index (SPI) Method For Surat District, Gujarat. Aquat. Procedia 2015, 4, 1243–1249. [Google Scholar] [CrossRef]
- Heiniger, W.R. The Impact of Early Drought on Corn Yield. 2019. Available online: https://corn.ces.ncsu.edu/corn-production-information/the-impact-of-early-drought-on-corn-yield/ (accessed on 25 January 2022).
- Ge, T.; Sui, F.; Bai, L.; Tong, C.; Sun, N. Effects of water stress on growth, biomass partitioning, and water-use efficiency in summer maize (Zea mays L.) throughout the growth cycle. Acta Physiol. Plant. 2012, 34, 1043–1053. [Google Scholar] [CrossRef]
- Çakir, R. Effect of water stress at different development stages on vegetative and reproductive growth of corn. Field Crops Res. 2004, 89, 1–16. [Google Scholar] [CrossRef]
- Kirda, C. Deficit Irrigation Scheduling Based on Plant Growth Stages Showing Water Stress Tolerance; Water Reports; Food and Agricultural Organization of the United Nations, Deficit Irrigation Practices: Rome, Italy, 2002; Volume 22, Available online: https://www.fao.org/3/y3655e/y3655e03.htm (accessed on 8 February 2022).
- Liberacki, D.; Kocięcka, J.; Stachowski, P.; Rolbiecki, R.; Rolbiecki, S.; Sadan, H.A.; Figas, A.; Jagosz, B.; Wichrowska, D.; Ptach, W.; et al. Water Needs of Willow (Salix L.) in Western Poland. Energies 2022, 15, 484. [Google Scholar] [CrossRef]
- Kasperska-Wołowicz, W.; Rolbiecki, S.; Sadan, H.A.; Rolbiecki, R.; Jagosz, B.; Stachowski, P.; Liberacki, D.; Bolewski, T.; Prus, P.; Pal-Fam, F. Impact of the projected climate change on soybean water needs in the Kuyavia region in Poland. J. Water Land Dev. 2021, 51, 199–207. [Google Scholar] [CrossRef]
- Ewaid, S.H.; Abed, S.A.; Al-Ansari, N. Crop Water Requirements and Irrigation Schedules for Some Major Crops in Southern Iraq. Water 2019, 11, 756. [Google Scholar] [CrossRef]
- Beyazgül, M.; Kayam, Y.; Engelsman, F. Estimation methods for crop water requirements in the Gediz Basin of western Turkey. J. Hydrol. 2000, 229, 19–26. [Google Scholar] [CrossRef]
- Senyigit, U.; Rolbiecki, S.; Rolbiecki, R.; Figas, A.; Jagosz, B.; Ptach, W.; Treder, W. Comparison of Sweet Cherry Prunus avium L. Tree Water Requirements in the Regions of Isparta (Turkey) and Bydgoszcz (Poland). In Infrastructure and Environment; Springer: Berlin/Heidelberg, Germany, 2019; pp. 217–224. [Google Scholar] [CrossRef]
- Gönençgil, B.; İçel, G. Türkiye’nin Doğu Akdeniz Kıyılarında Yıllık Toplam Yağışlarda Görülen Değişimler (1975–2006). Türk Coğrafya Derg. 2010, 55, 1–12. [Google Scholar]
- Sen, B.; Topcu, S.; Türkeș, M.; Sen, B.; Warner, J.F. Projecting climate change, drought conditions and crop productivity in Turkey. Clim. Res. 2012, 52, 175–191. [Google Scholar] [CrossRef]
- Barutçular, C.; Dizlek, H.; El-Sabagh, A.; Sahin, T.; EL-Sabagh, M.; Islam, M.S. Nutritional quality of maize in response to drought stress during grain-filling stages in Mediterranean climate condition. J. Exp. Biol. Agric. Sci. 2016, 4, 644–652. [Google Scholar] [CrossRef]
- Chaves, M.M.; Pereira, J.S.; Maroco, J.; Rodrigues, M.L.; Ricardo, C.P.P.; Osório, M.L.; Carvalho, I.; Faria, T.; Pinheiro, C. How Plants Cope with Water Stress in the Field. Photosynth. Growth. Ann. Bot. 2002, 89, 907–916. [Google Scholar] [CrossRef]
- Mi, N.; Cai, F.; Zhang, Y.; Ji, R.; Zhang, S.; Wang, Y. Differential responses of maize yield to drought at vegetative and reproductive stages. Plant Soil Environ. 2018, 64, 260–267. [Google Scholar] [CrossRef]
- Song, H.; Li, Y.; Zhou, L.; Xu, Z.; Zhou, G. Maize leaf functional responses to drought episode and rewatering. Agric. For. Meteorol. 2018, 249, 57–70. [Google Scholar] [CrossRef]
- Hanjra, M.; Qureshi, E. Global water crisis and future food security in an era of climate change. Food Policy 2010, 35, 365–377. [Google Scholar] [CrossRef]
- Igbadun, H.E.; Tarimo, A.K.; Salim, B.A.; Mahoo, H.F. Evaluation of selected crop water production functions for an irrigated maize crop. Agric. Water Manag. 2007, 94, 1–10. [Google Scholar] [CrossRef]
- Żarski, J.; Dudek, S.; Grzelak, B.; Kuśmierek-Tomaszewska, R.; Rolbiecki, R.; Rolbiecki, S. Wpływ nawadniania i fertygacji kroplowej azotem na plonowanie kukurydzy na obszarze szczególnie deficytowym w wodę. Infrastruct. Ecol. Rural Areas 2015, 11, 279–289. [Google Scholar] [CrossRef]
- Maazou, A.R.S.; Tu, J.; Qiu, J.; Liu, Z. Breeding for drought tolerance in maize (Zea mays L.). Am. J. Plant Sci. 2016, 7, 1858. [Google Scholar] [CrossRef]
- Kamara, A.; Menkir, A.; Badu-Apraku, B.; Ibikunle, O. The influence of drought stress on growth, yield and yield components of selected maize genotypes. J. Agric. Sci. 2003, 141, 43–50. [Google Scholar] [CrossRef]
- Campos, H.; Cooper, M.; Habben, J.E.; Edmeades, G.O.; Schussler, J.R. Improving drought tolerance in maize: A view from industry. Field Crops Res. 2004, 90, 19–34. [Google Scholar] [CrossRef]
- Zhao, J.; Xue, Q.; Jessup, K.E.; Hao, B.; Hou, X.; Marek, T.H.; Xu, W.; Evett, S.; O’Shaughnessy, S.A.; Brauer, D.K. Yield and water use of drought-tolerant maize hybrids in a semiarid environment. Field Crops Res. 2018, 216, 1–9. [Google Scholar] [CrossRef]
- Goodarzian Ghahfarokhi, M.; Mansurifar, S.; Taghizadeh-Mehrjardi, R.; Saeidi, M.; Jamshidi, A.M.; Ghasemi, E. Effects of drought stress and rewatering on antioxidant systems and relative water content in different growth stages of maize (Zea mays L.) hybrids. Arch. Agron. Soil Sci. 2015, 61, 493–506. [Google Scholar] [CrossRef]
- An, J.; Li, W.; Li, M.; Cui, S.; Yue, H. Identification and Classification of Maize Drought Stress Using Deep Convolutional Neural Network. Symmetry 2019, 11, 256. [Google Scholar] [CrossRef]
- Shiferaw, B.; Prasanna, B.M.; Hellin, J. Crops that feed the world 6. Past successes and future challenges to the role played by maize in global food security. Food Secur. 2011, 3, 307. [Google Scholar] [CrossRef]
- Kocięcka, J.; Liberacki, D. The Potential of Using Chitosan on Cereal Crops in the Face of Climate Change. Plants 2021, 10, 1160. [Google Scholar] [CrossRef]
- Çakmak, B.; Ucar, Y.; Akuzum, T. Water resources management, problems and solutions for Turkey. Int. Congr. River Basin Manag. 2007, 1, 867–880. [Google Scholar]
- Ucar, Y.; Senyigit, U.; Kadayifci, A.; Tuylu, G.I. Evaluation of water use efficiency at parcel and scheme levels: A case study of Sarkikaraagac irrigation scheme in Turkey. J. Food Agric. Environ. 2010, 8, 1046–1053. [Google Scholar]
- Sah, R.P.; Chakraborty, M.; Prasad, K. Impact of water deficit stress in maize: Phenology and yield components. Sci Rep. 2020, 10, 2944. [Google Scholar] [CrossRef]
- Chakraborty, M.; Ghosh, J.; Sah, R.P. Combining ability studies for yield and other traits in maize (Zea mays L.). Plant Arch. 2012, 12, 235–238. [Google Scholar]
- Sah, R.P.; Ahmed, S.; Malaviya, D.R.; Saxena, P. Identification of consistence performing dual purpose maize (Zea mays L.) genotypes under semi-arid condition. Range Manag. Agrofor. 2016, 37, 162–166. [Google Scholar]
- Erenstein, O.; Chamberlin, J.; Sonder, K. Estimating the global number and distribution of maize and wheat farms. Glob. Food Secur. 2021, 30, 100558. [Google Scholar] [CrossRef]
Publisher’s Note: MDPI stays neutral with regard to jurisdictional claims in published maps and institutional affiliations. |
© 2022 by the authors. Licensee MDPI, Basel, Switzerland. This article is an open access article distributed under the terms and conditions of the Creative Commons Attribution (CC BY) license (https://creativecommons.org/licenses/by/4.0/).