1. Introduction
Upland cotton (
Gossypium hirsutum L.) is an important fiber and oilseed crop grown in many areas worldwide [
1]. The United States is the third-largest producer of cotton after India and China [
2]. In 2020, the United States produced over twenty million bales of cotton representing USD 7 billion in total value [
2]. Demand for cotton-based products has grown with the global population and economy. Global competition, costs associated with water, pesticides, and fertilizers used in cotton production, and diminished prices are among the major challenges of cotton producers [
2,
3,
4,
5,
6].
Nitrogen fertilizer (N) is one of the major inputs of cotton production. Under- or over-application of N can adversely affect the environment, reduce lint yields, and incur monetary costs to cotton producers through wasted fertilizer and/or reduced product quality and quantity [
7,
8,
9,
10,
11,
12,
13]. Application of N beyond cotton needs negatively impacts the environment, which contributes to the destruction of the stratospheric ozone layer, stresses ecosystems, acidifies rain, and contaminates drinking water [
11,
14,
15,
16]. The risks of environmental N loss are problematic, especially in the U.S. Southeastern Coastal Plain (SCP) region, where sandy soils with low nutrient holding capacity are prevalent [
14,
17].
Soil texture variability in the SCP complicates the management of N because varying soil textures differ in their ability to hold nutrients [
18]. This means a uniform application rate of N may not address the needs of cotton plants in a field with varying soil types. Clemson University (CU) Extension recommends applying 112 kg/ha (100 lb/ac) of N for irrigated cotton production and 78 kg/ha (70 lb/ac) for dryland cotton production over the growing season, with approximately 70% of the N applied during side-dress application in the SCP region [
19]. Multiple factors, such as crop growth stage, soil moisture content, soil texture, and yield potential, could cause sufficient N rates to vary above or below the CU Extension recommendations [
12,
20,
21]. Nitrogen application based on the plant’s needs reduces the risks associated with N management of cotton [
22].
The Normalized Difference Vegetation Index (NDVI) can be used to quantify the N requirements of cotton [
23]. NDVI value is obtained from the measured magnitude of reflectance of visible red (Red) and near infrared (NIR) using Equation (1) [
21]:
Chlorophyll is the primary pigment responsible for a plant’s leaf color. Nitrogen is a significant component of the molecules in chlorophyll; thus, N is directly correlated with leaf chlorophyll content. NDVI has been used to determine the plant relative N content [
24]. A plant with higher N content absorbs more red light and reflects more infrared light than a plant with lower N content [
12]. Consequently, cotton with adequate N will have higher NDVI values than N-deficient cotton [
24]. In addition to the N content of the plant, other factors, such as plant stage of development, canopy structure and water deficiency, can affect the optical properties of plants. The use of reference N-rich strips helps mitigate the effects of these factors other than N in crops and increases the sensitivity of NDVI measurements [
25].
Site-specific N recommendations based on cotton response to N are critical for SCP due to the inherent soil variability in the region [
12]. Sensor-based N rate algorithms have been developed to increase the precision of N application [
12]. The Clemson N application rate model is based on a sensor-based N rate algorithm that was initially developed for wheat (
Triticum aestivum L.) and was modified for use in cotton [
12,
26]. The Clemson sensor-based cotton N rate algorithm is based on a prediction of the potential response, or response index (RI), to additional N. This is done by comparing NDVI data from sections of the field with high N content, called N rich strips, to NDVI data from parts of the field that have not received N fertilizer [
12]. The N rich strip NDVI sensor values (NRSSV) and field NDVI sensor values (FSV) are then correlated with soil electrical conductivity to account for differing soil types [
12]. Previous research has shown that the Clemson sensor-based cotton N rate algorithm reduced the total N applied by 40% compared to traditional growers’ applications of 101 kg/ha (90 lb/ac) with similar yields [
12]. This side-dress N rate estimation method successfully applied liquid N using different application methods in cotton and corn [
12,
18,
27].
The cost associated with N fertilizer application increases the necessity for reducing over- and under-application [
28]. These costs could potentially be reduced by applying N using variable rate applications to meet site-specific crop requirements [
29]. Commercial variable-rate applicator systems, such as the Raven RCM, John Deere Rate Controller 2000, and Trimble Field IQ, utilize both map-based and on-the-go decision making systems. These systems are available to producers and integrated with band applicators, sprayers, and spreaders; however, on-the-go decision making methods for variable rate N fertigation have not been integrated with lateral move irrigation systems to our knowledge. A map-based variable-rate N fertigation system for a lateral move irrigation system was developed at Clemson University in 2018 [
14]. This map-based N fertigation system allowed different N rates to be applied across the field simultaneously by injecting liquid N fertilizer directly into the lateral move irrigation system [
14]. A manually operated flow control valve was used to control the flow rate of the main N line, and pulsing solenoid values were used to apply the variable N rates in different sections of the lateral. The N rates for the map-based system were predetermined using the Clemson sensor-based cotton N rate algorithm, which required the user to collect NDVI plant data from the field before application. In addition, the manually controlled flow control valve required the user to be present as the lateral moved through the field.
In this project, the manual aspects of the system developed by Williams (2018) are replaced by (1) mounting NDVI sensors on the applicator to generate on-the-go, site-specific N rate prescriptions, and (2) automating the flow control bypass system to implement on-the-go rate variation in the absence of an operator. Producers could employ an automated variable-rate N application system to meet the unique nutrient needs of their field. Furthermore, an automated system would benefit producers by increasing efficiency and crop yields, reducing labor and input costs, and protecting the environment.
The overall goal of this study was to develop a fertigation system that automated N fertigation based on real-time NDVI measurements using a lateral move irrigation system. The specific objectives to accomplish this goal were to (a) integrate the required individual components including an NDVI crop sensor and flow meter with an Arduino microcontroller, and (b) construct the automated fertigation system and develop the software to automatically apply site-specific variable N rates based on real-time NDVI sensor data.
2. Materials and Methods
2.1. Site Description
A 76-m lateral-move irrigation system (Reinke Manufacturing, Deshler, Nebraska) located at the Clemson University Edisto Research and Education Center in Blackville, South Carolina (33° 21.530′ N, 81° 19.949′ W) was used to develop the variable-rate N fertigation system. According to the Web Soil Survey [
30], the experimental field had an area of around 2.0 ha with 2 soil types, including an Orangeburg Loamy Sand (VaA) and Barnwell Loamy Sand (VaB), representing 43% and 57% of the area, respectively. The VaA soil had a 0–2% slope, a typical profile that included a Loamy Sand Ap layer (0–15 cm depth), a Sandy Clay Loam Bt layer (15–135 cm), and a Sandy Clay Loam BCt layer (135–200 cm). The VaA soil was well-drained, with a depth to the water table of more than 200 cm. The VaB soil had a 2–6% slope, a typical profile that included a Loamy Sand Ap layer (0–20 cm), a Sandy Clay Loam Bt layer (20–127 cm), and a Sandy Clay Loam BC layer (127–200 cm). The VaB soil was well-drained, with a depth to the water table of 100–200 cm. The field had a pH of 6.7 measured in 2018. Between May and October 2021, the average precipitation was 107 mm, and the average high and low temperatures were 31.0 °C and 16.7 °C in Blackville, SC [
31]. The lateral-move system was used to irrigate 1.59 ha of the experimental field that was split into 110 field plots measuring 7.8 m by 15.2 m. The irrigation system was equipped with low energy precision application (LEPA) drops spaced at 1.8 m along the length of the lateral. A Veris 3100 soil electrical conductivity (EC) meter (Veris Technologies, Inc., Salina, KS, USA) was used to classify the field plots into two soil EC classification groups. Cotton was planted in May of 2021 with a row spacing of 97 cm to test the system functions under field conditions.
2.2. Hardware Integration with Microcontrollers
A microcontroller was integrated with NDVI sensors, a flow meter, a flow control valve, and a rotary encoder. These components were integrated before the full assembly of the fertigation system in the laboratory, and their functions were tested.
2.2.1. Clemson N Application Rate Model and NDVI Sensors
The automated variable-rate N fertigation system automatically determined the N application rates based on the Clemson sensor-based N recommendation algorithm shown in Equations (2)–(5). This algorithm predicts the potential response to additional N with a response index (RI) value, which is the ratio between the NDVI data from N rich strips and NDVI data obtained from the fields that have not received N fertilizer. The N rich strip NDVI sensor values (NRSSV) and field NDVI sensor values (FSV) are then correlated with soil electrical conductivity to account for differing soil types.
where RI, response index; NRSSV, nitrogen rich strip sensor (NDVI) value; FSV, field sensor (NDVI) value; INSEY, in-season estimated yield; DAE, number of days after emergence; YP
0, yield potential (kg/ha); k, conversion factor for lb/ac to kg/ha = 1.121; NR, N rate (kg/ha); FNCS, fraction of N in cotton seeds after harvest (4/100), entered into this equation as 0.04; NUEF, N use efficiency fraction for cotton (50/100), entered into this equation as 0.50.
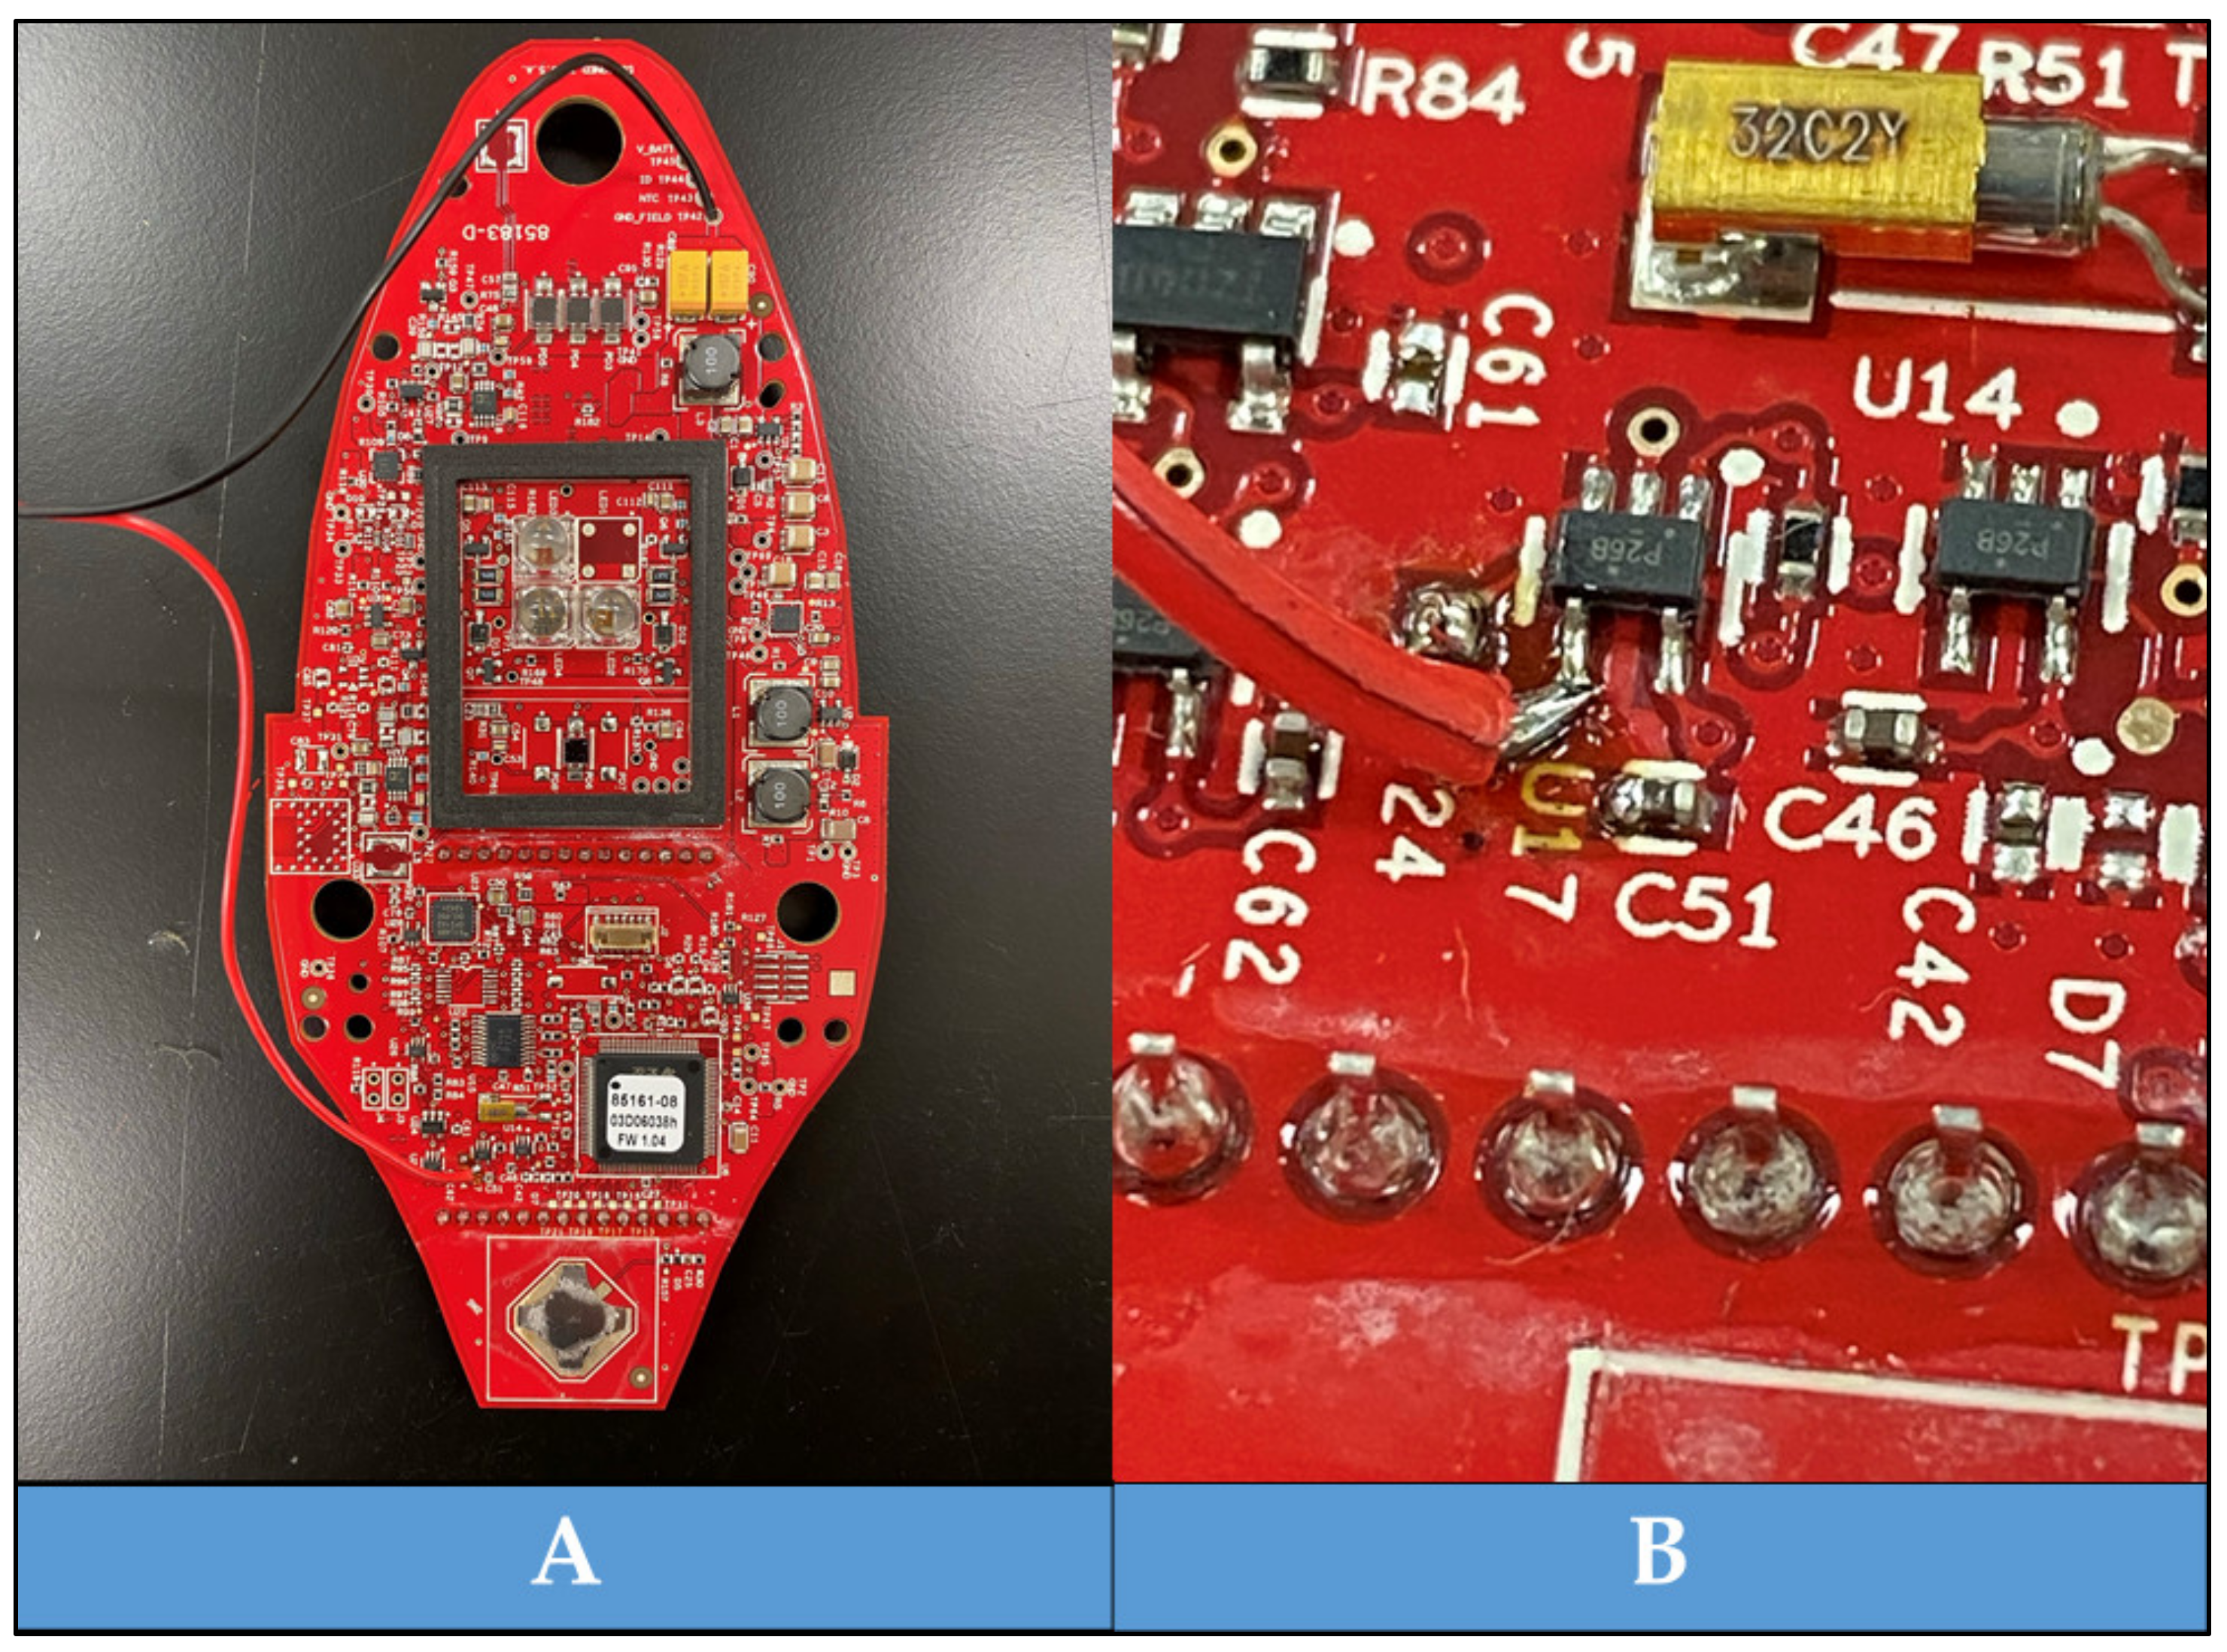
For this system, the NDVI sensor data needed to be collected on the go as the irrigation system moved along the field. The GreenSeeker handheld optical active sensor (Trimble Inc., Sunnyvale, CA, USA) was selected to measure NDVI. In order for the system to calculate the N rates using the handheld GreenSeekers, the GreenSeekers were integrated with an Arduino (Mega 2560 Rev 3, Arduino, Scarmangno, TO, Italy). Initially, data from each GreenSeeker were collected from the USB output of the sensor and converted into serial data format using a USB to serial interface module; however, these modules required external computer drivers for data translation. Therefore, a workaround solution was implemented in which the serial data output was extracted directly from the Greenseeker’s UART interface chip on the printed circuit board (PCB). The leads were soldered to the Transistor-Transistor Logic (TTL) signal lines, and the output data from the GreenSeeker were parsed on an Arduino microcontroller (
Figure 1).
2.2.2. Flow Meter
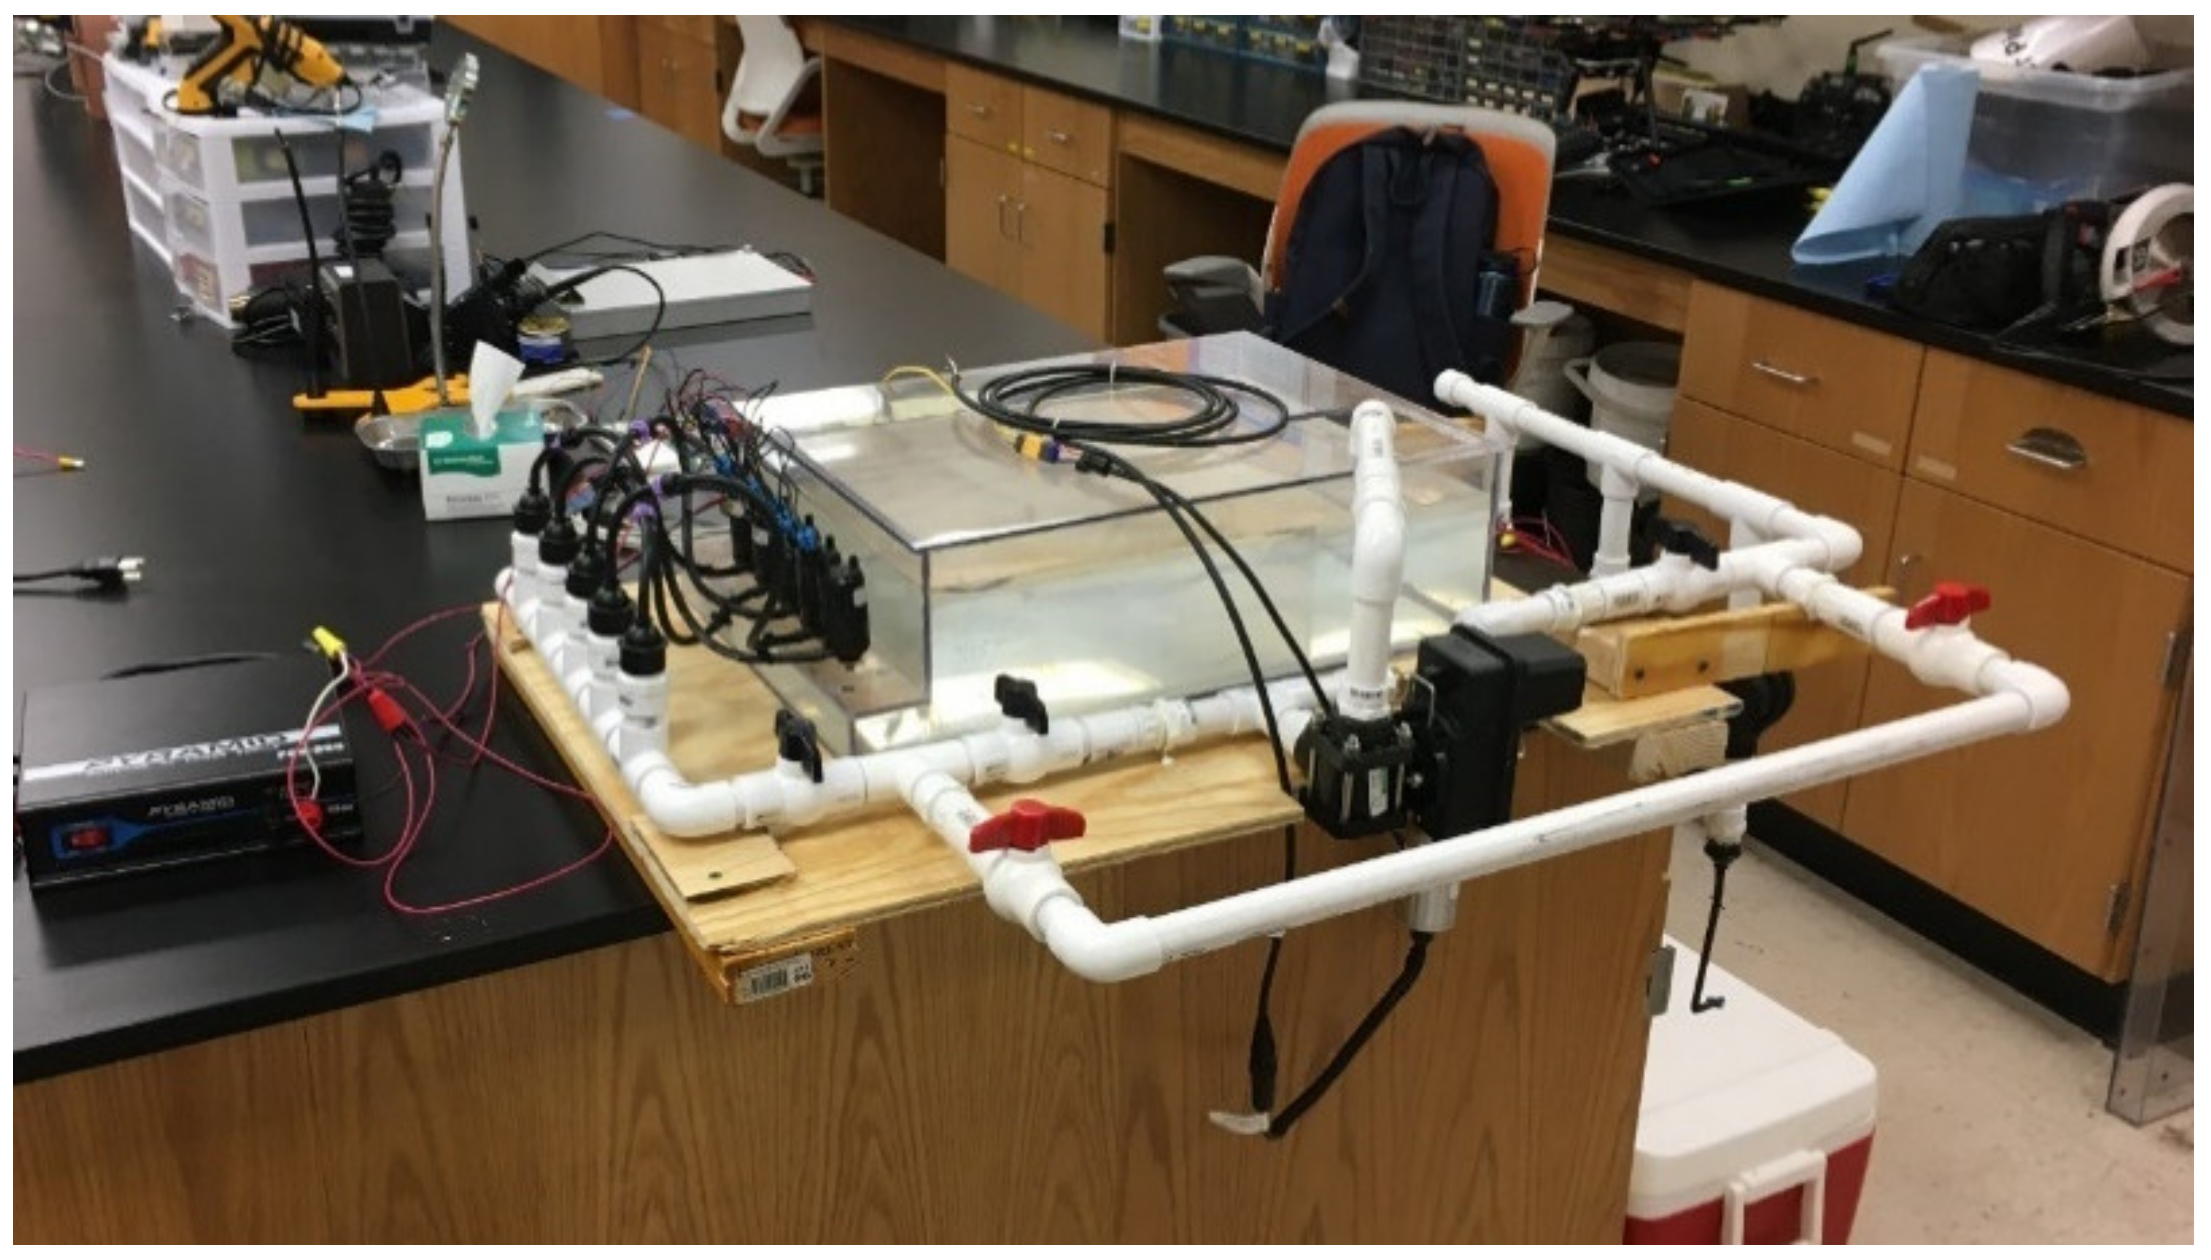
The second piece of equipment that needed to be integrated with an Arduino for the system was the Raven flow meter (RFM-5, Raven Industries, Sioux Falls, SD, USA). This flow meter was used to monitor the flow of N coming from a supply tank for the fertigation system. A scaled simulator was developed in a laboratory setting to investigate the output signals from the flow meter (
Figure 2). The Raven flow meter communicated flow rate through a variable frequency output signal which was recorded by an Arduino Mega microcontroller and converted into a corresponding flow rate value using Equation (6) which was derived from the flow meter’s documentation:
where FR, flow rate (L/s); f, output frequency of the flow meter (Hz); p, 136.8 (pulses/L).
2.2.3. Flow Control Valve
The simulator shown in
Figure 2 was also used to develop the software control of the TeeJet flow control valve (344BPR-2, TeeJet Technologies, Wheaton, IL, USA). The TeeJet flow control valve regulated the flow rate of N being supplied to the fertigation system. A four-channel relay controlled by an Arduino microcontroller supplied 12 VDC power for the flow control valve.
2.2.4. Rotary Encoder
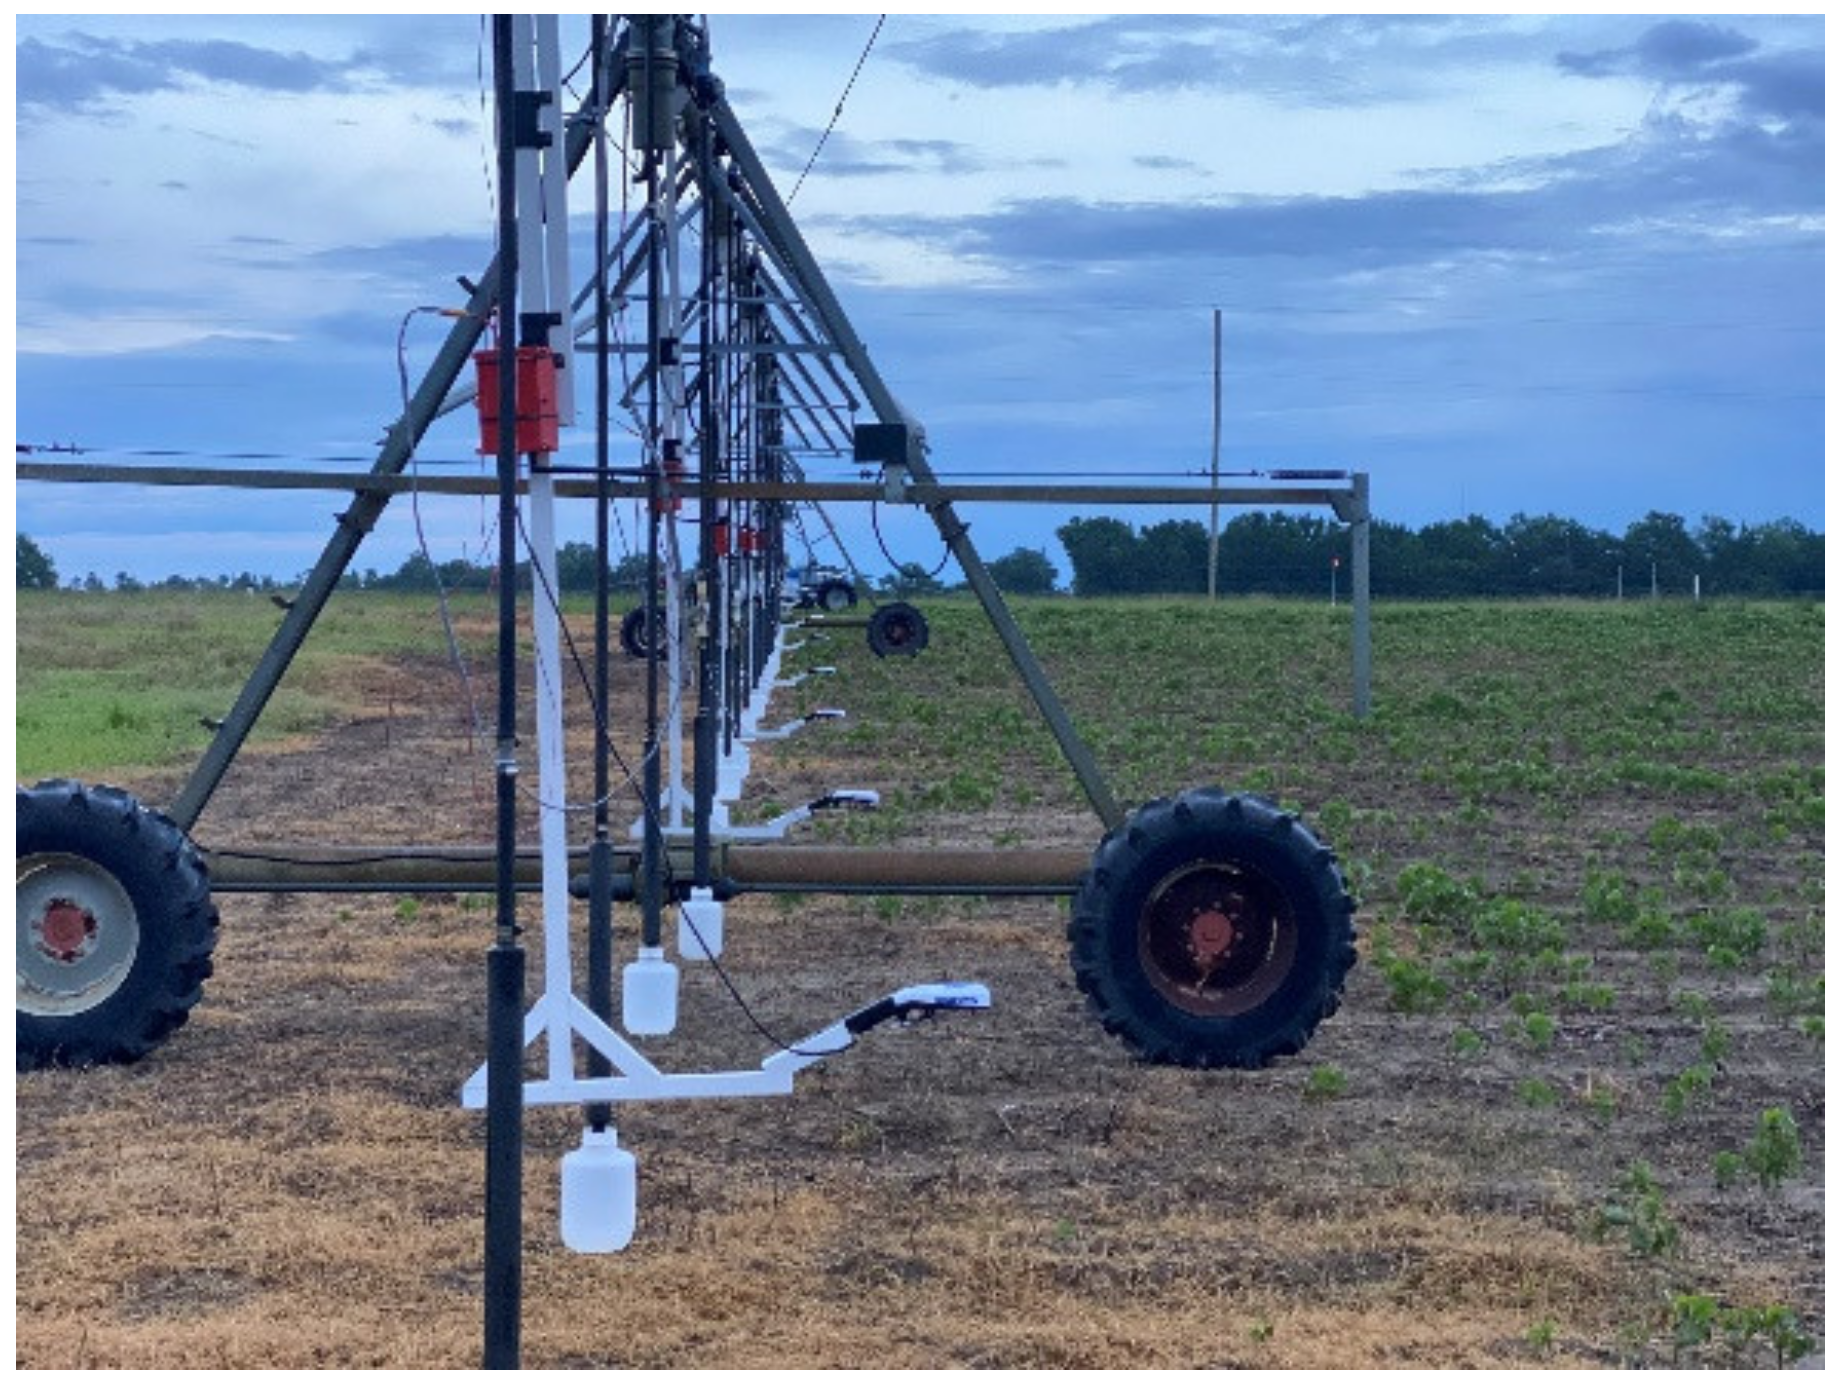
For the system to apply site-specific N rates throughout the field, the applicator system needed to locate its position accurately. Because of inherent inaccuracies associated with off the shelf GPS receivers, a rotary encoder with a non-slip roller wheel (GHW38, CALT, Beijing, China) was installed on one of the wheels of the irrigation system to measure its travel distance (
Figure 3D) more accurately. The rotary encoder produced 2400 pulses per revolution. An Arduino microcontroller was used to count the pulses and calculate the distance traveled using a simple conversion factor shown in Equation (7). With the encoder mounted against the lateral’s wheel, one full rotation of the encoder’s nonstick wheel equals 0.41 m of travel.
where d, distance traveled (m); e, output of the encoder (pulses); f, calibration factor to convert the output of the encoder to distance in meter = 1.7 × 10
−4.
2.3. Development of the Microcontroller Software and Construction of the Fertigation System
The integrated components were used to construct the fertigation system on the lateral, and custom software was developed to control the automated N management decision making and application process.
2.3.1. N Fertigation System Components
The N Fertigation system was constructed first to aid in developing the electronic control components. The N supply system used in the previous iteration of the fertigation system was used for this project [
14]. This system consisted of a roller pump driven by an electric motor that pumped N from a 1250 L tank mounted on the side of the lateral into a bladder tank shown in
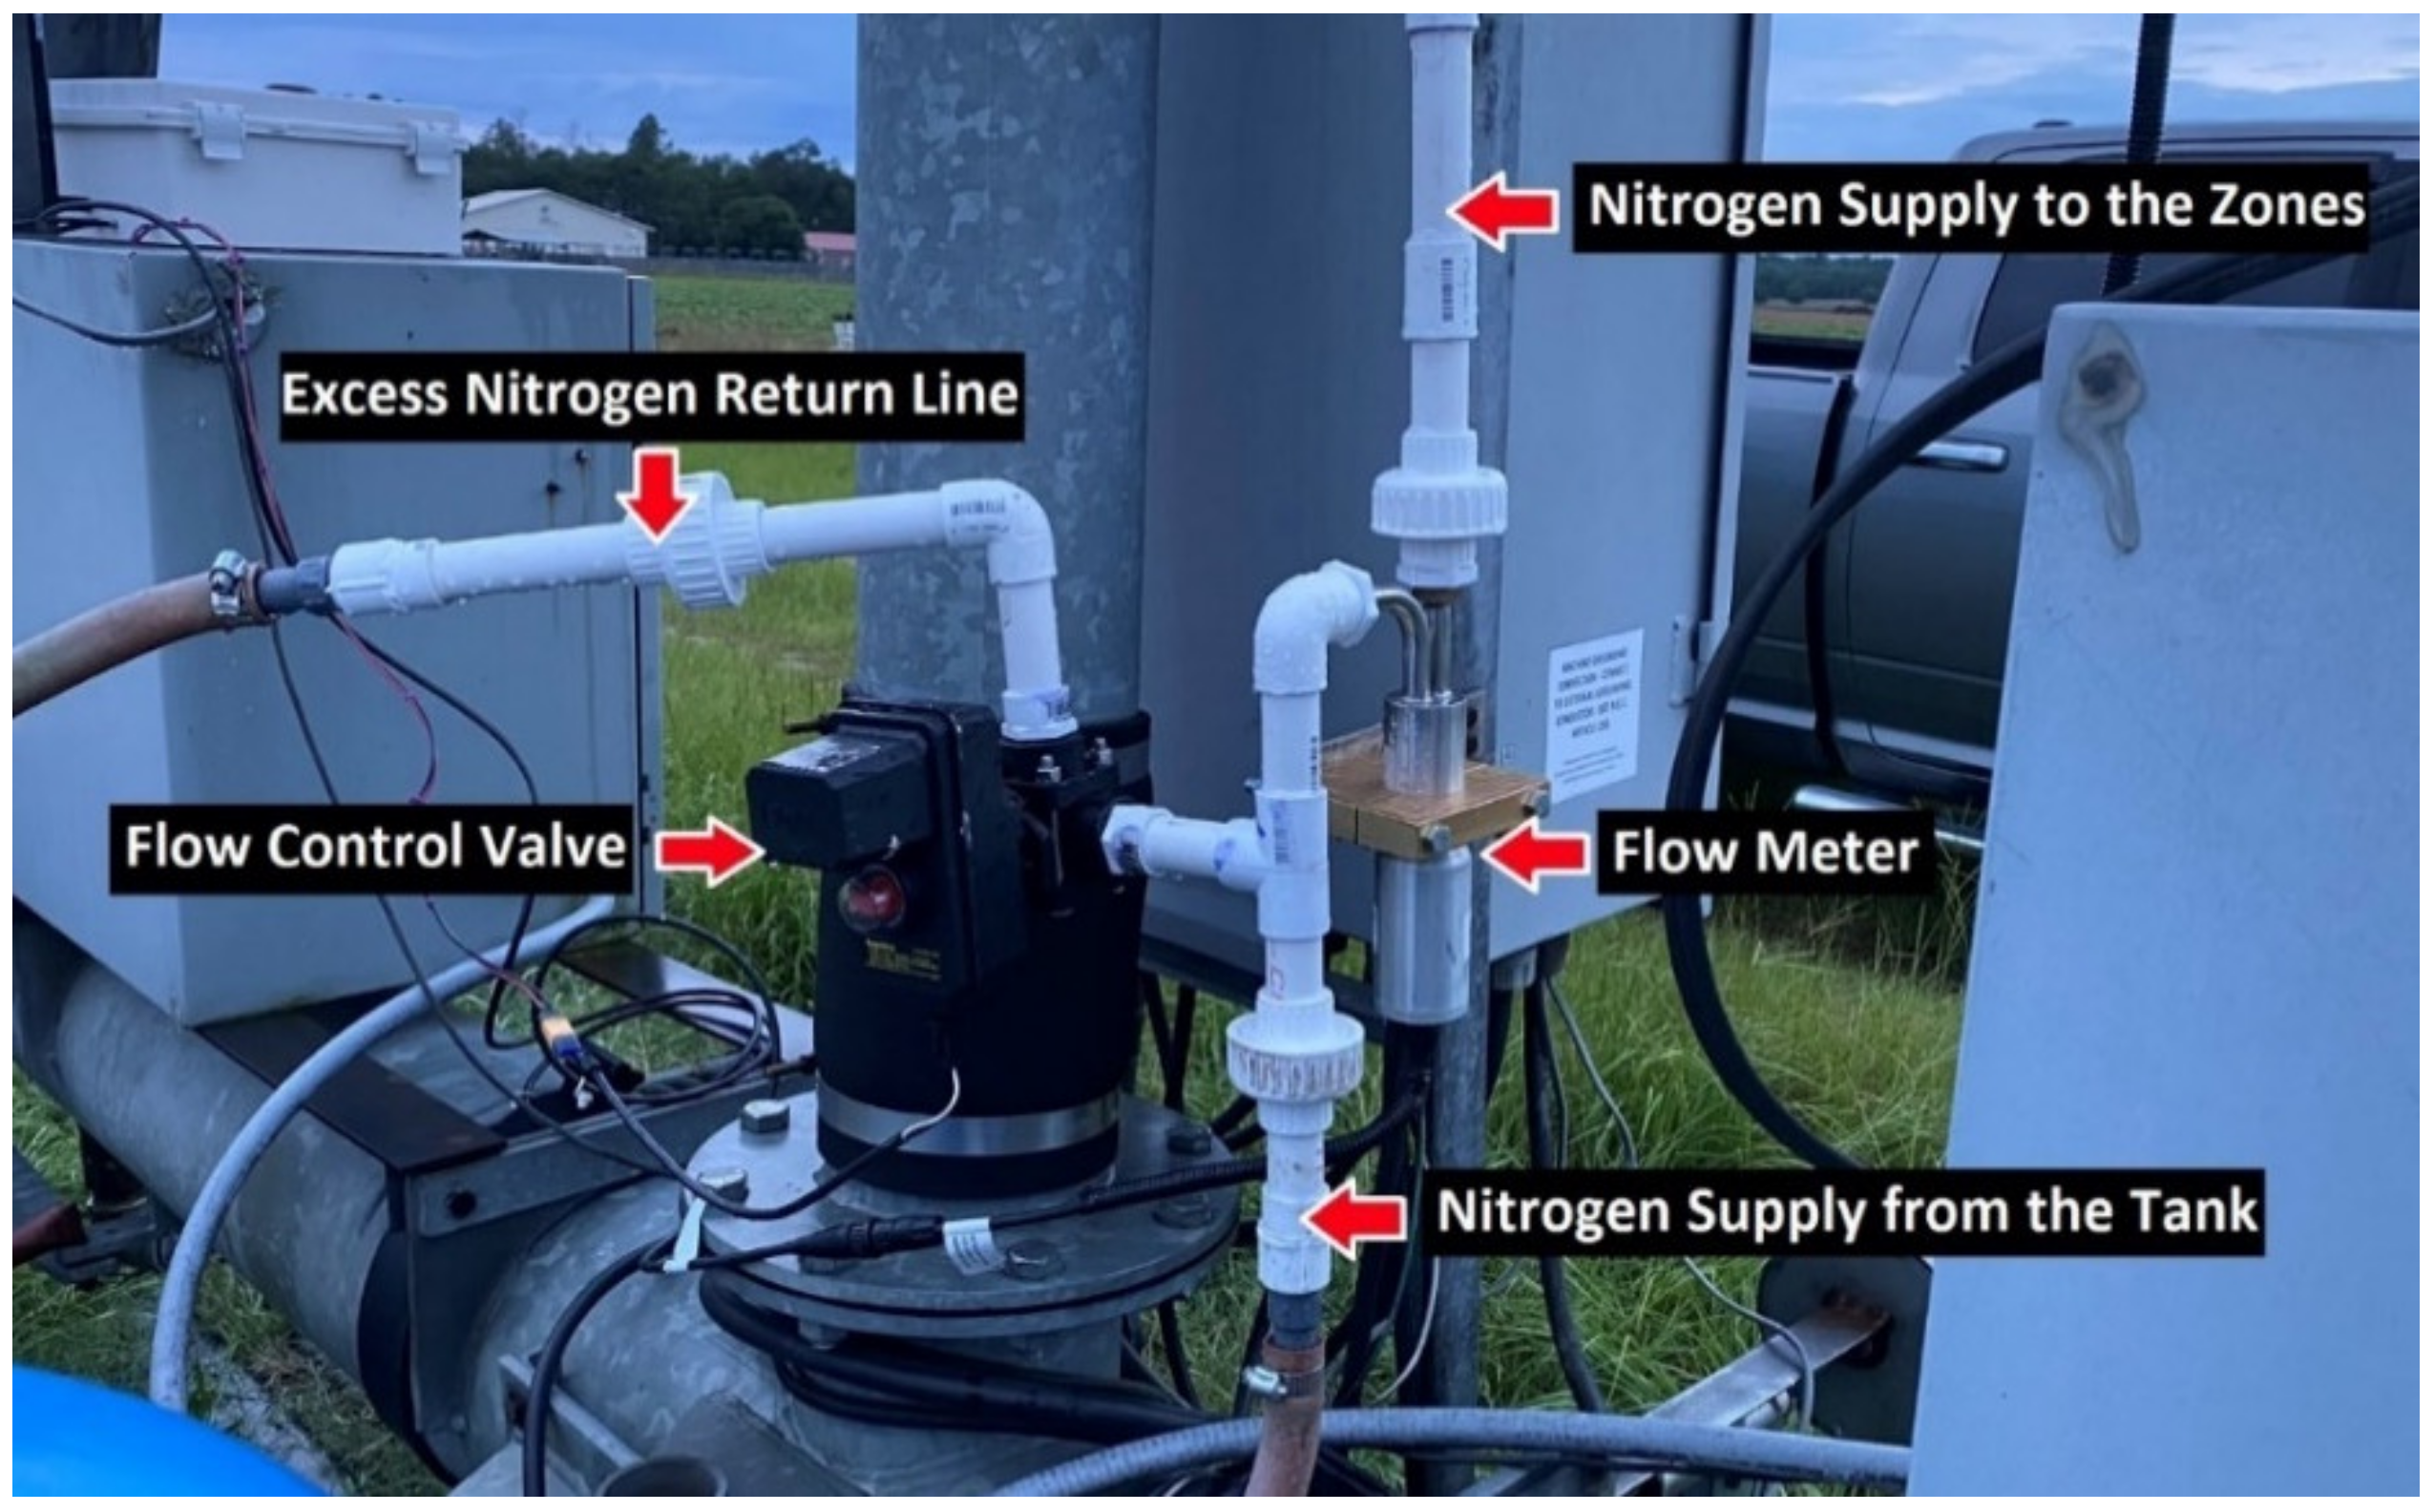
Figure 3F. The bladder tank was used to provide a steady pressurized supply of N to a flow control bypass system that consisted of a TeeJet flow control valve and Raven RFM5 flow meter (
Figure 4). A 12V DC power supply was used to power the flow control valve. The flow control bypass system was regulated by a custom controller that read the N mainline’s flow rate and adjusted the flow rate using the flow control valve.
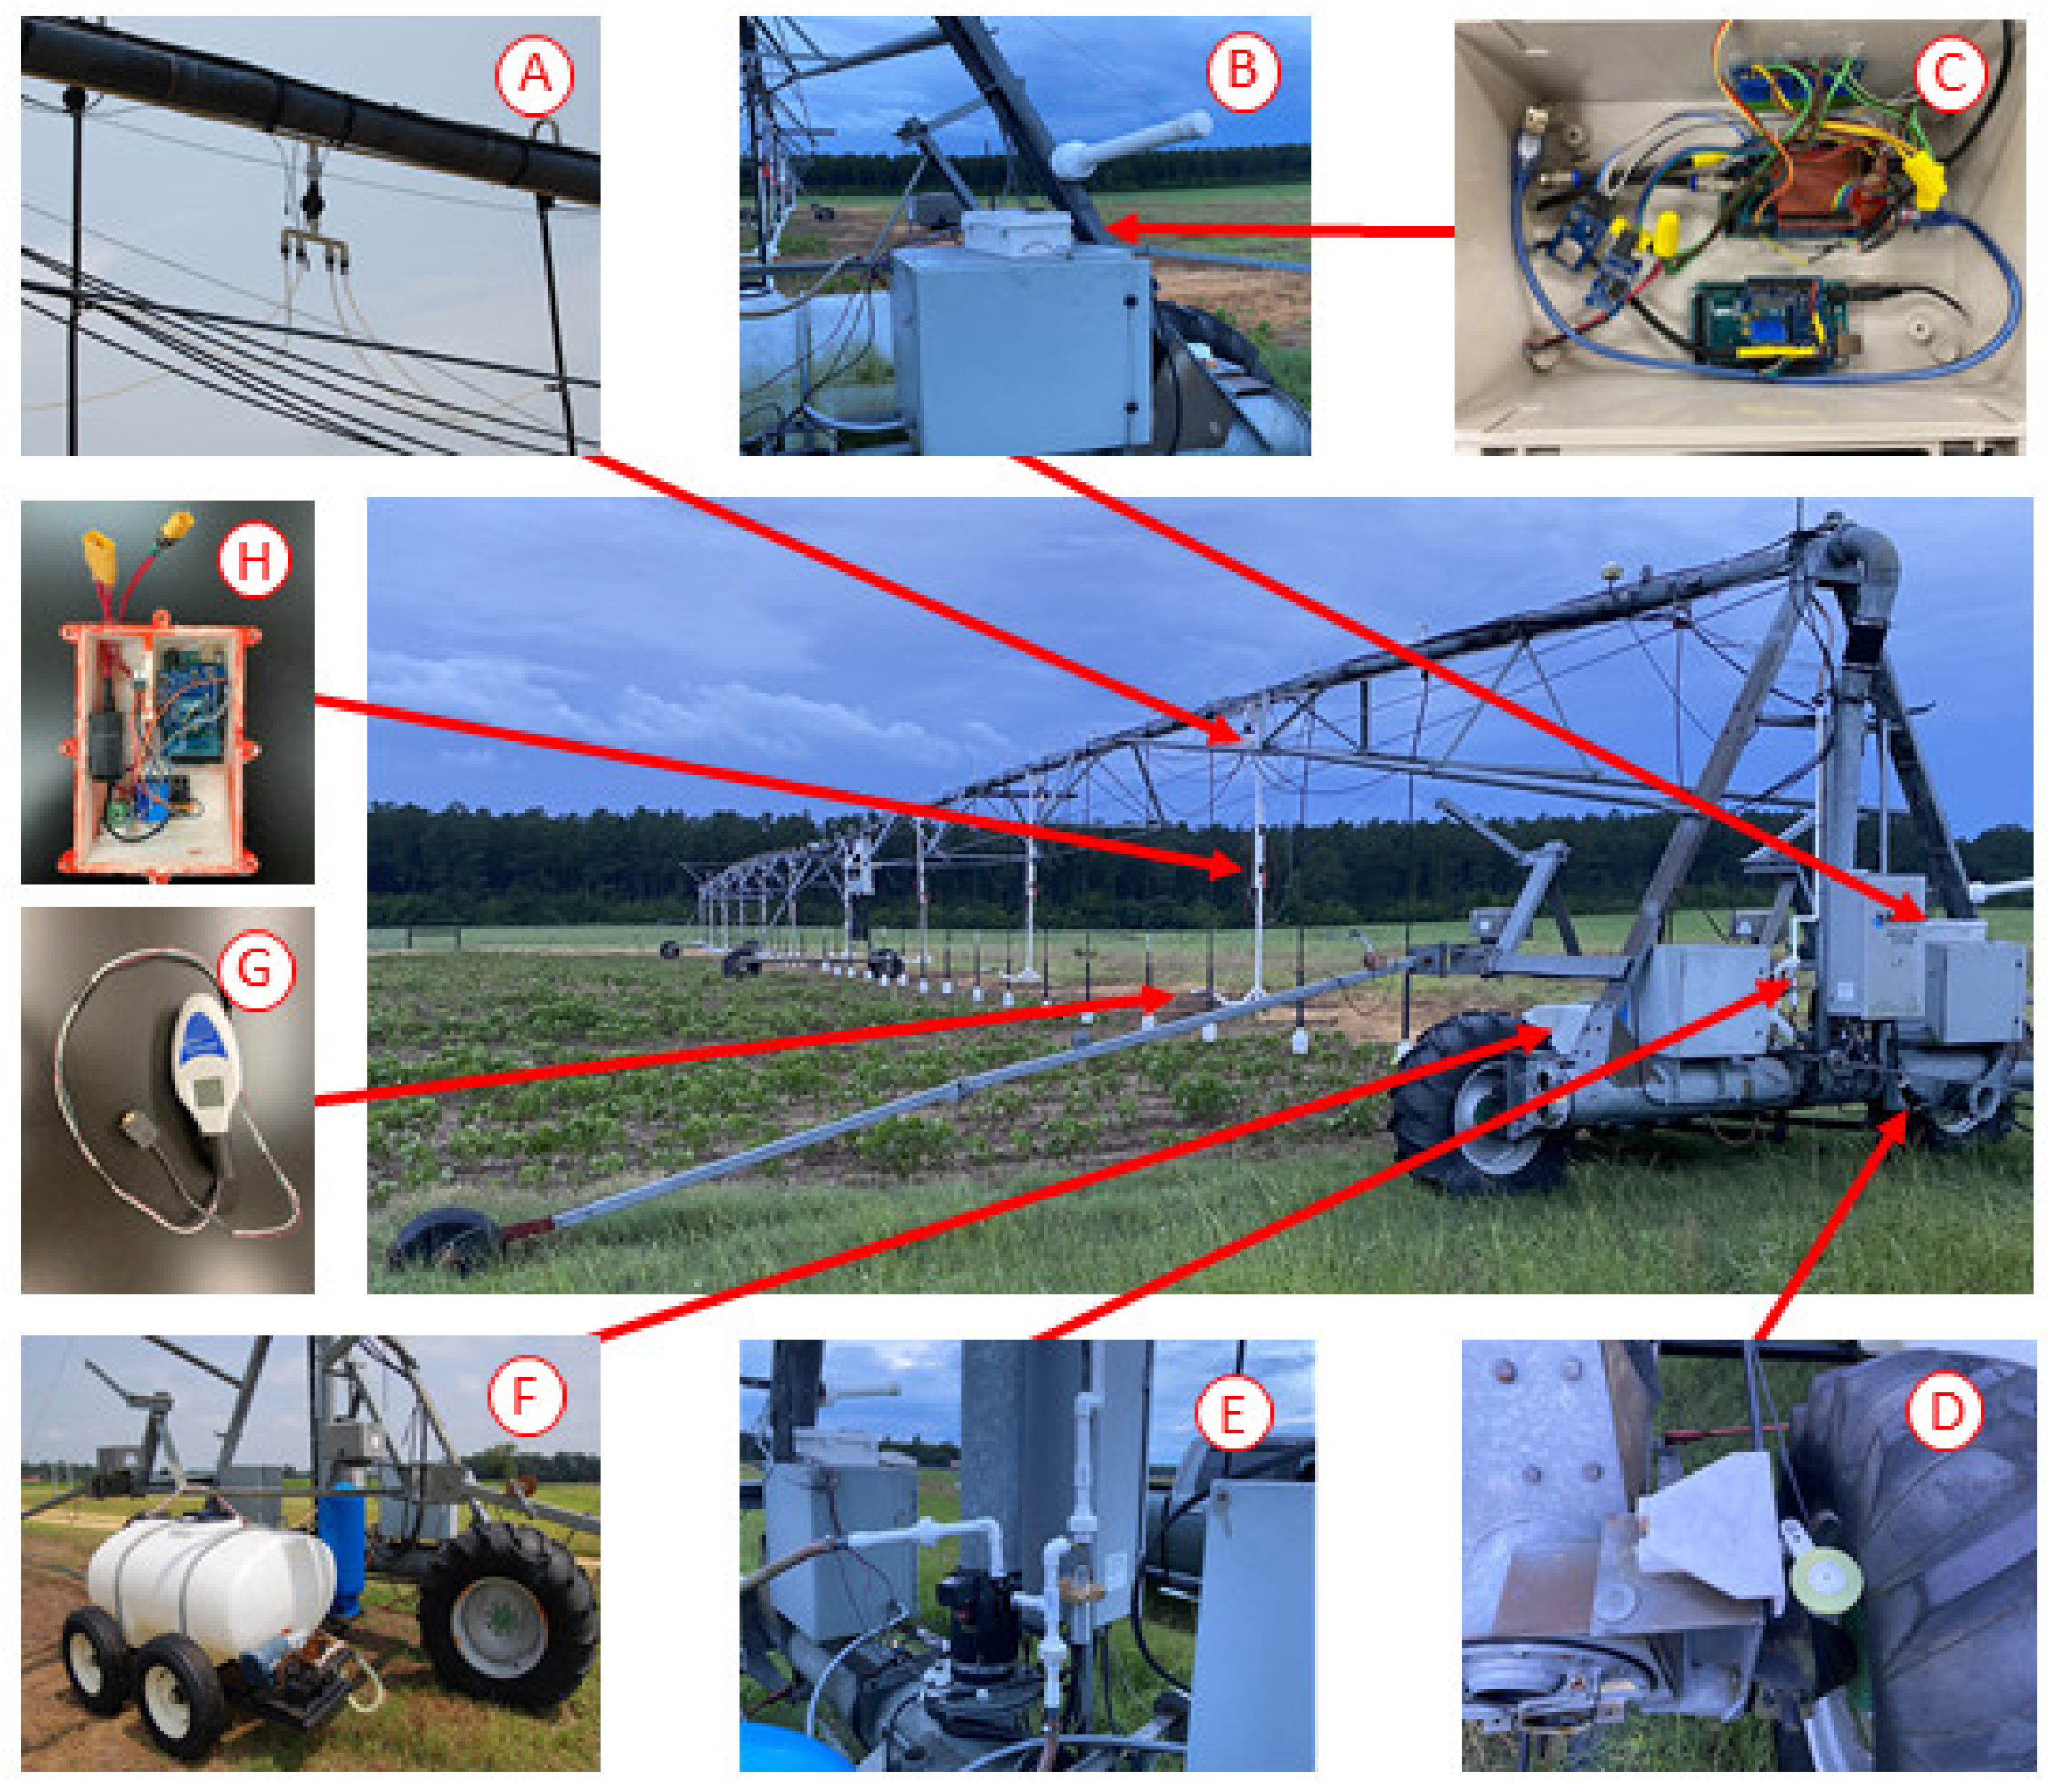
The N mainline supplied N to ten application zones across the length of the lateral using a 19.05 mm (3/4 in) CPVC mainline pipe. A pressure gauge was fitted to the mainline pipe after the bypass system to monitor the mainline pressure. In each zone, N was pumped through a 19.05 mm (3/4 in) check valve (18341, United States Plastic Corp., Lima, OH, USA) to prevent water from entering the application system if the pressure dropped below the irrigation system pressure. N application rates to each zone were controlled by pulsing 2-way, 24 VAC electric solenoid valves (USS-LSV00005, Joyfay International LLC, Cleveland, OH, USA). Each solenoid valve supplied N to four hoses fitted to the irrigation drop lines using a t-fitting (
Figure 3A). A CP4916-15 orifice disk (TeeJet Technologies, Springfield, IL, USA) was placed at each t-fitting to regulate flow and pressure.
2.3.2. N Fertigation Electronic Control Components
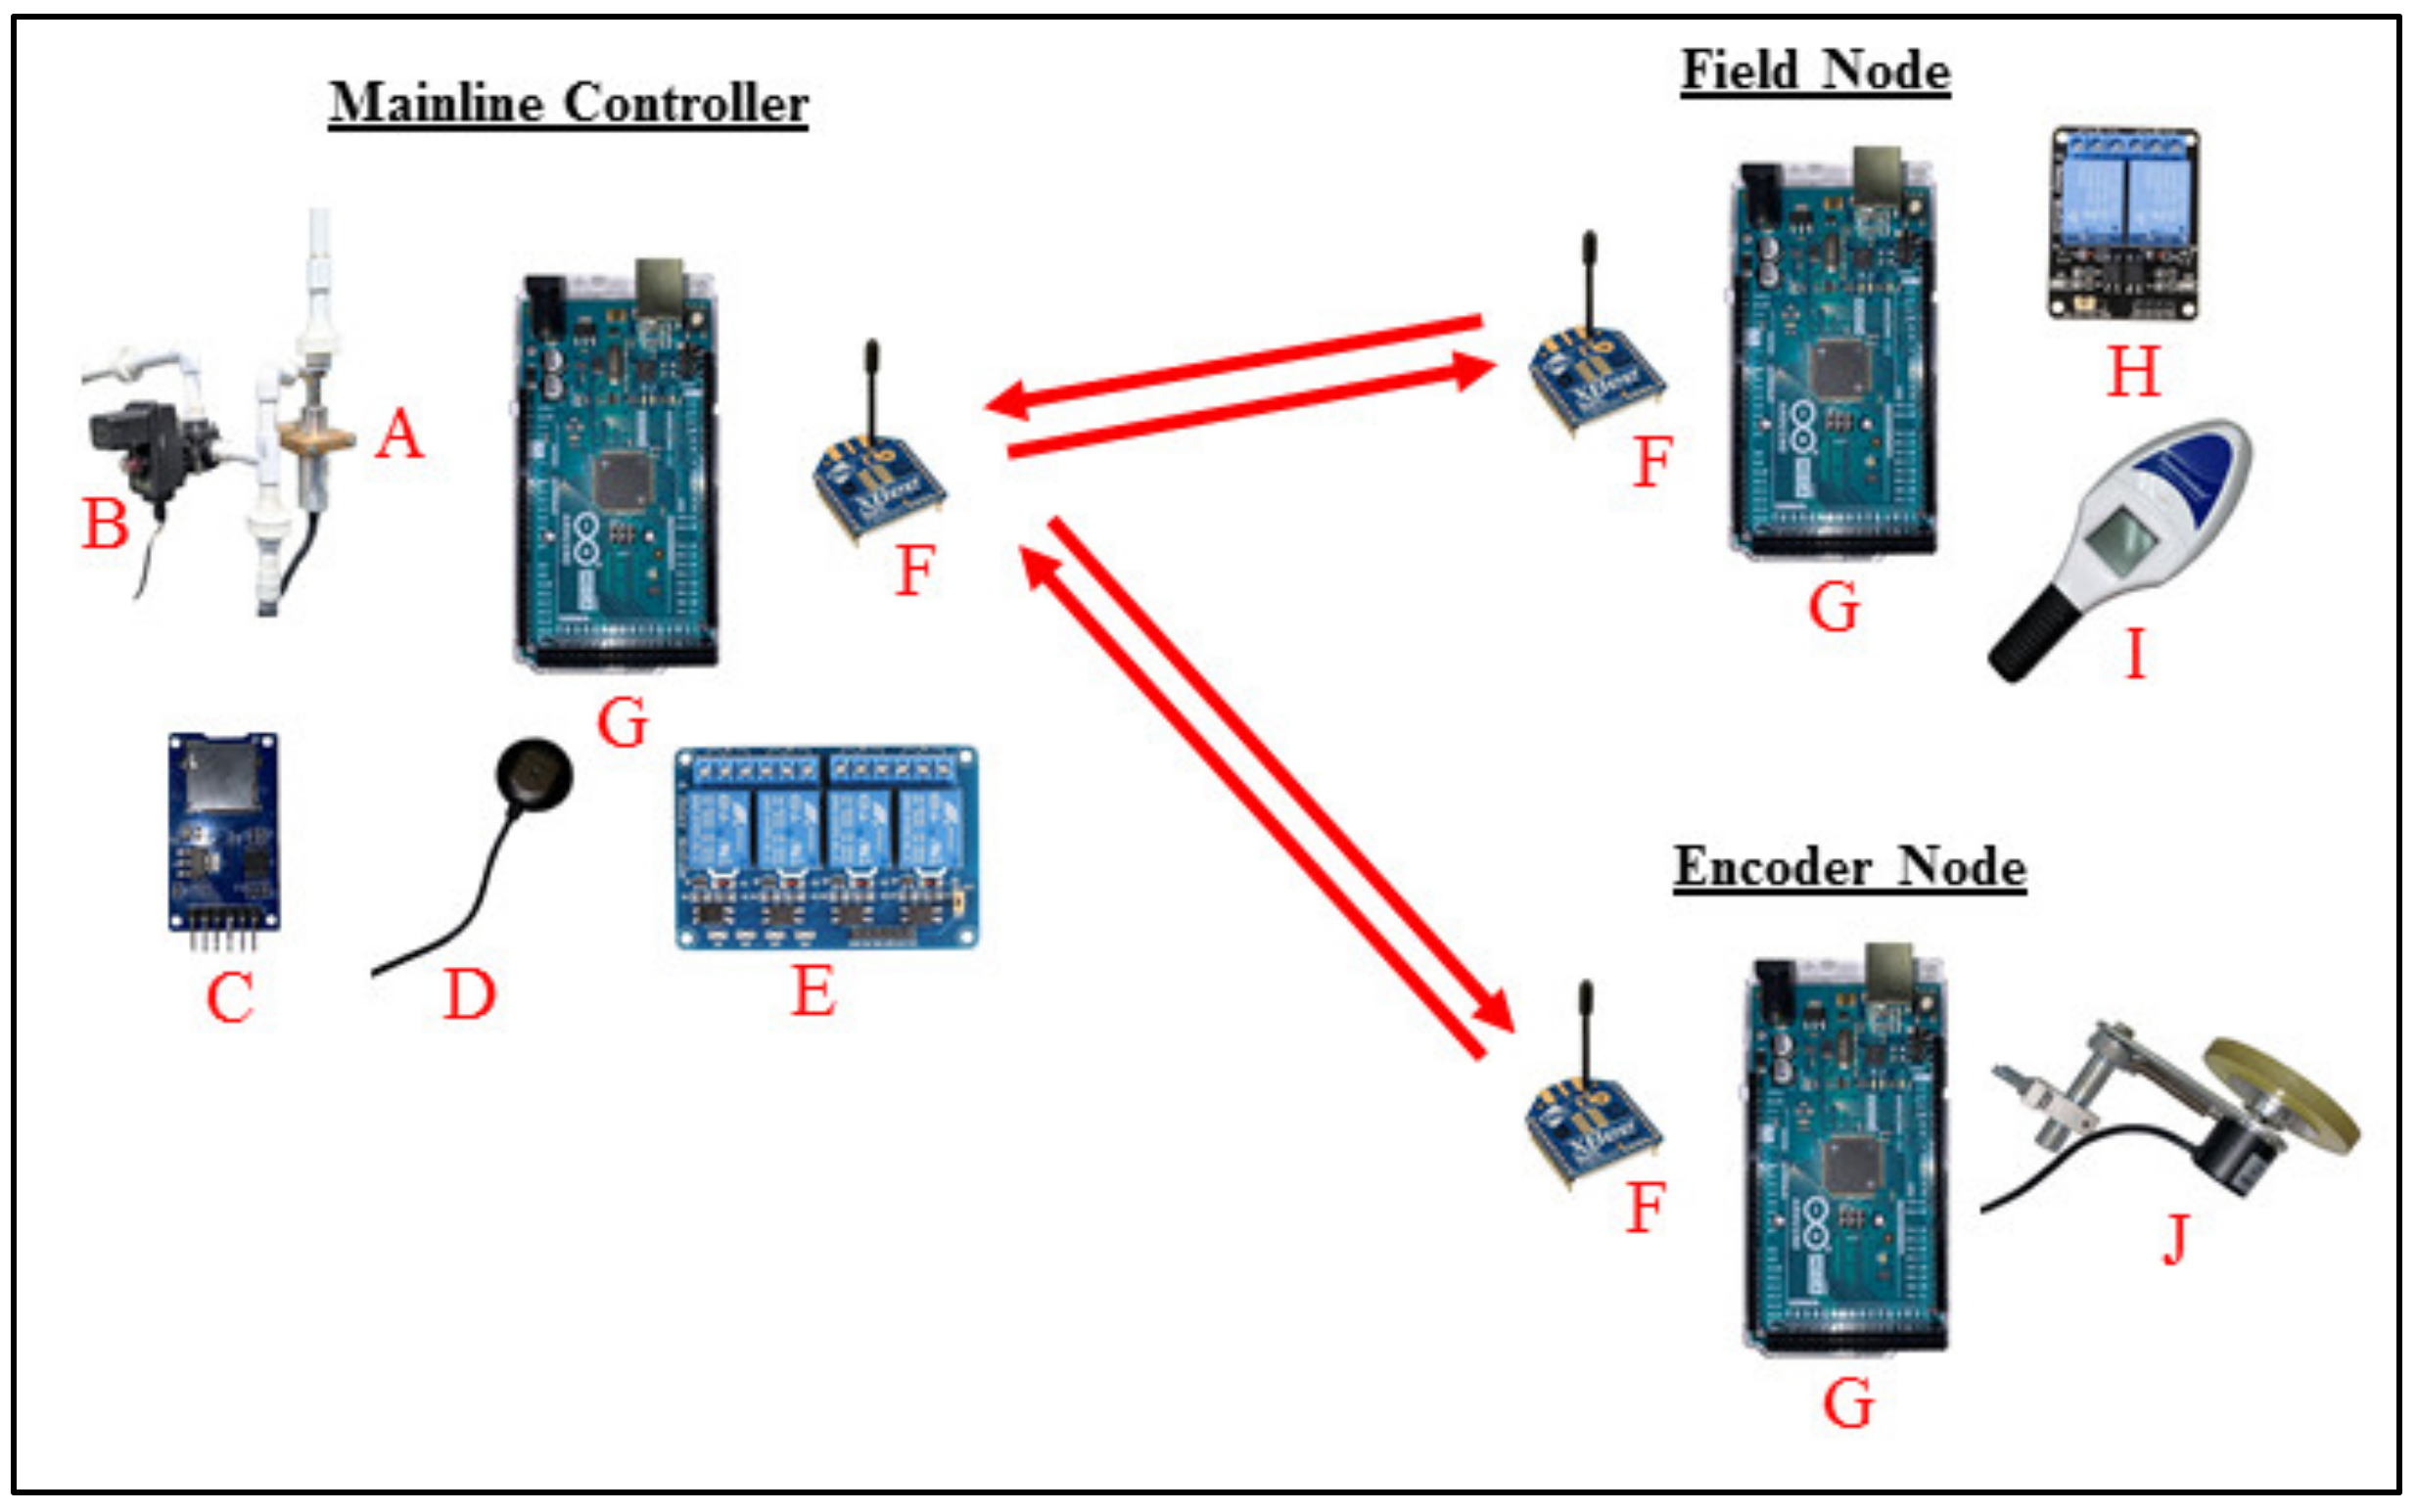
The applicator consisted of three main electronic controlling components: a mainline controller, field nodes, and an encoder node (
Figure 5). The mainline controller, field nodes, and encoder node all communicated wirelessly using XBee radios (XBS2C, Digi, Hopkins, MN, USA) mounted to an Arduino Mega using XBee shields (EK1185, Gikfun, Dongguan, GD, China). The mainline controller communicated with the field and encoder nodes through a custom call and response protocol using the Arduino serial ports to ensure no data were lost.
A 5V DC 4-channel relay module (4450182, Jbtek, Karol Bagh, ND, India) was used to open or close the flow control valve. For post-application analysis, a GPS module (MC035BK, GoGoRC, Kwun Tong, Hong Kong) was added to the controller to locate the system and denote what time the NDVI samples were taken during application. A real-time clock (RTC) module (DS3231, Maxim Integrated, San Jose, CA, USA) was added in case the GPS was not accessible. Lastly, a Micro SD card module (Shenzhen Haihongli Technology CO., LTD., Shenzhen, GD, China) was added to the controller to save the application data for post analysis (
Figure 5C).
Field nodes were developed for each of the ten application zones to collect NDVI data and regulate the individual zones’ application rate through pulsing a solenoid valve. The field nodes and GreenSeeker sensors were fixed in the center of each application zone along the length of the lateral using custom-made mounting brackets (
Figure 6). The sampling height of the GreenSeekers could be adjusted by sliding the mounting brackets in vertical direction, and a bolt was used to secure the sliding mount in place.
The field nodes were controlled using Arduino Mega microcontrollers. A 5V 1A linear voltage regulator (LM7805CT, onsemi, Phoenix, AZ, USA) was added to charge the GreenSeeker’s battery during application. A 5V DC 2-channel relay module (4332716883, Shenzhen Qunqi E-Commerce Co LTD, Shenzhen, GD, China) was used to control the solenoid valve and trigger the GreenSeeker to take a reading. A solderless RS232 serial adapter (Anmbest Control Technology Co., Ltd., Wuhan, HB, China) was fitted to the GreenSeeker USB power line, serial data wires, and trigger wire so the sensor could easily be secured to the Arduino while also securing a semi-weatherproof connection (
Figure 3G). The field node components were placed inside a 3D printed housing and secured in place using silicon and super glue. A lid was constructed for the box that could be screwed shut and sealed with silicon (
Figure 3H). A step-down transformer 24V AC power line was run along the length of the lateral to power the solenoid valves.
2.3.3. N Fertigation Control Program
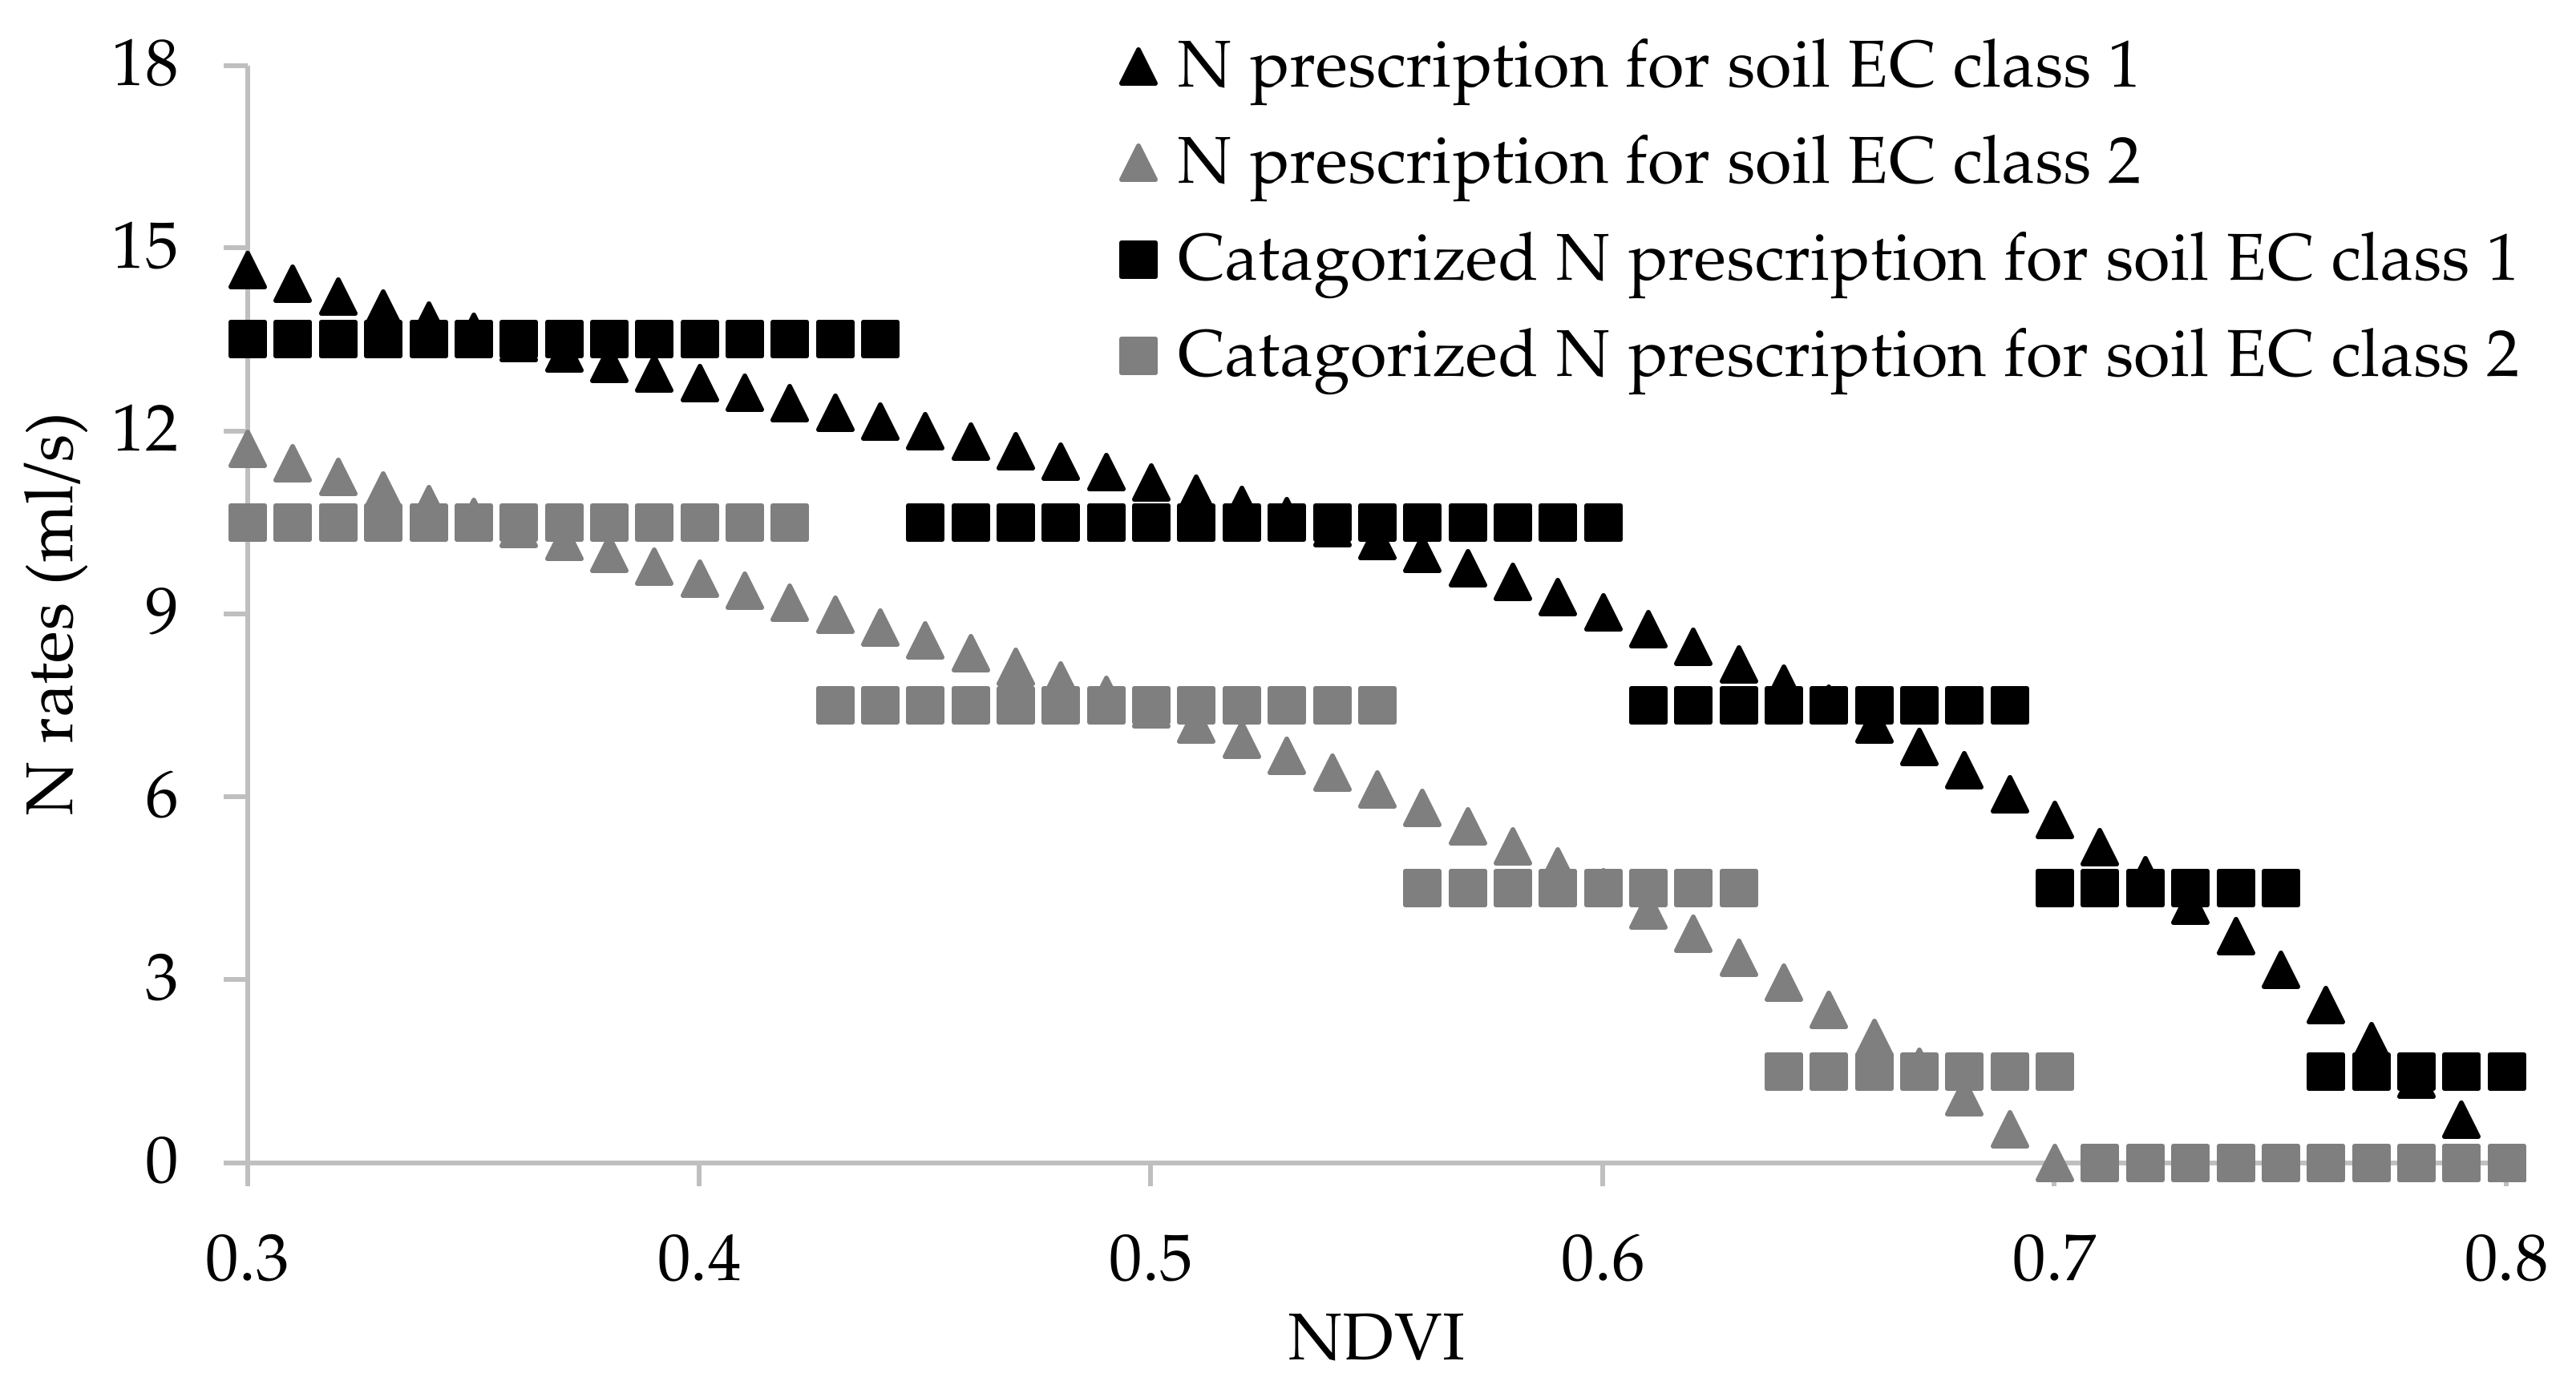
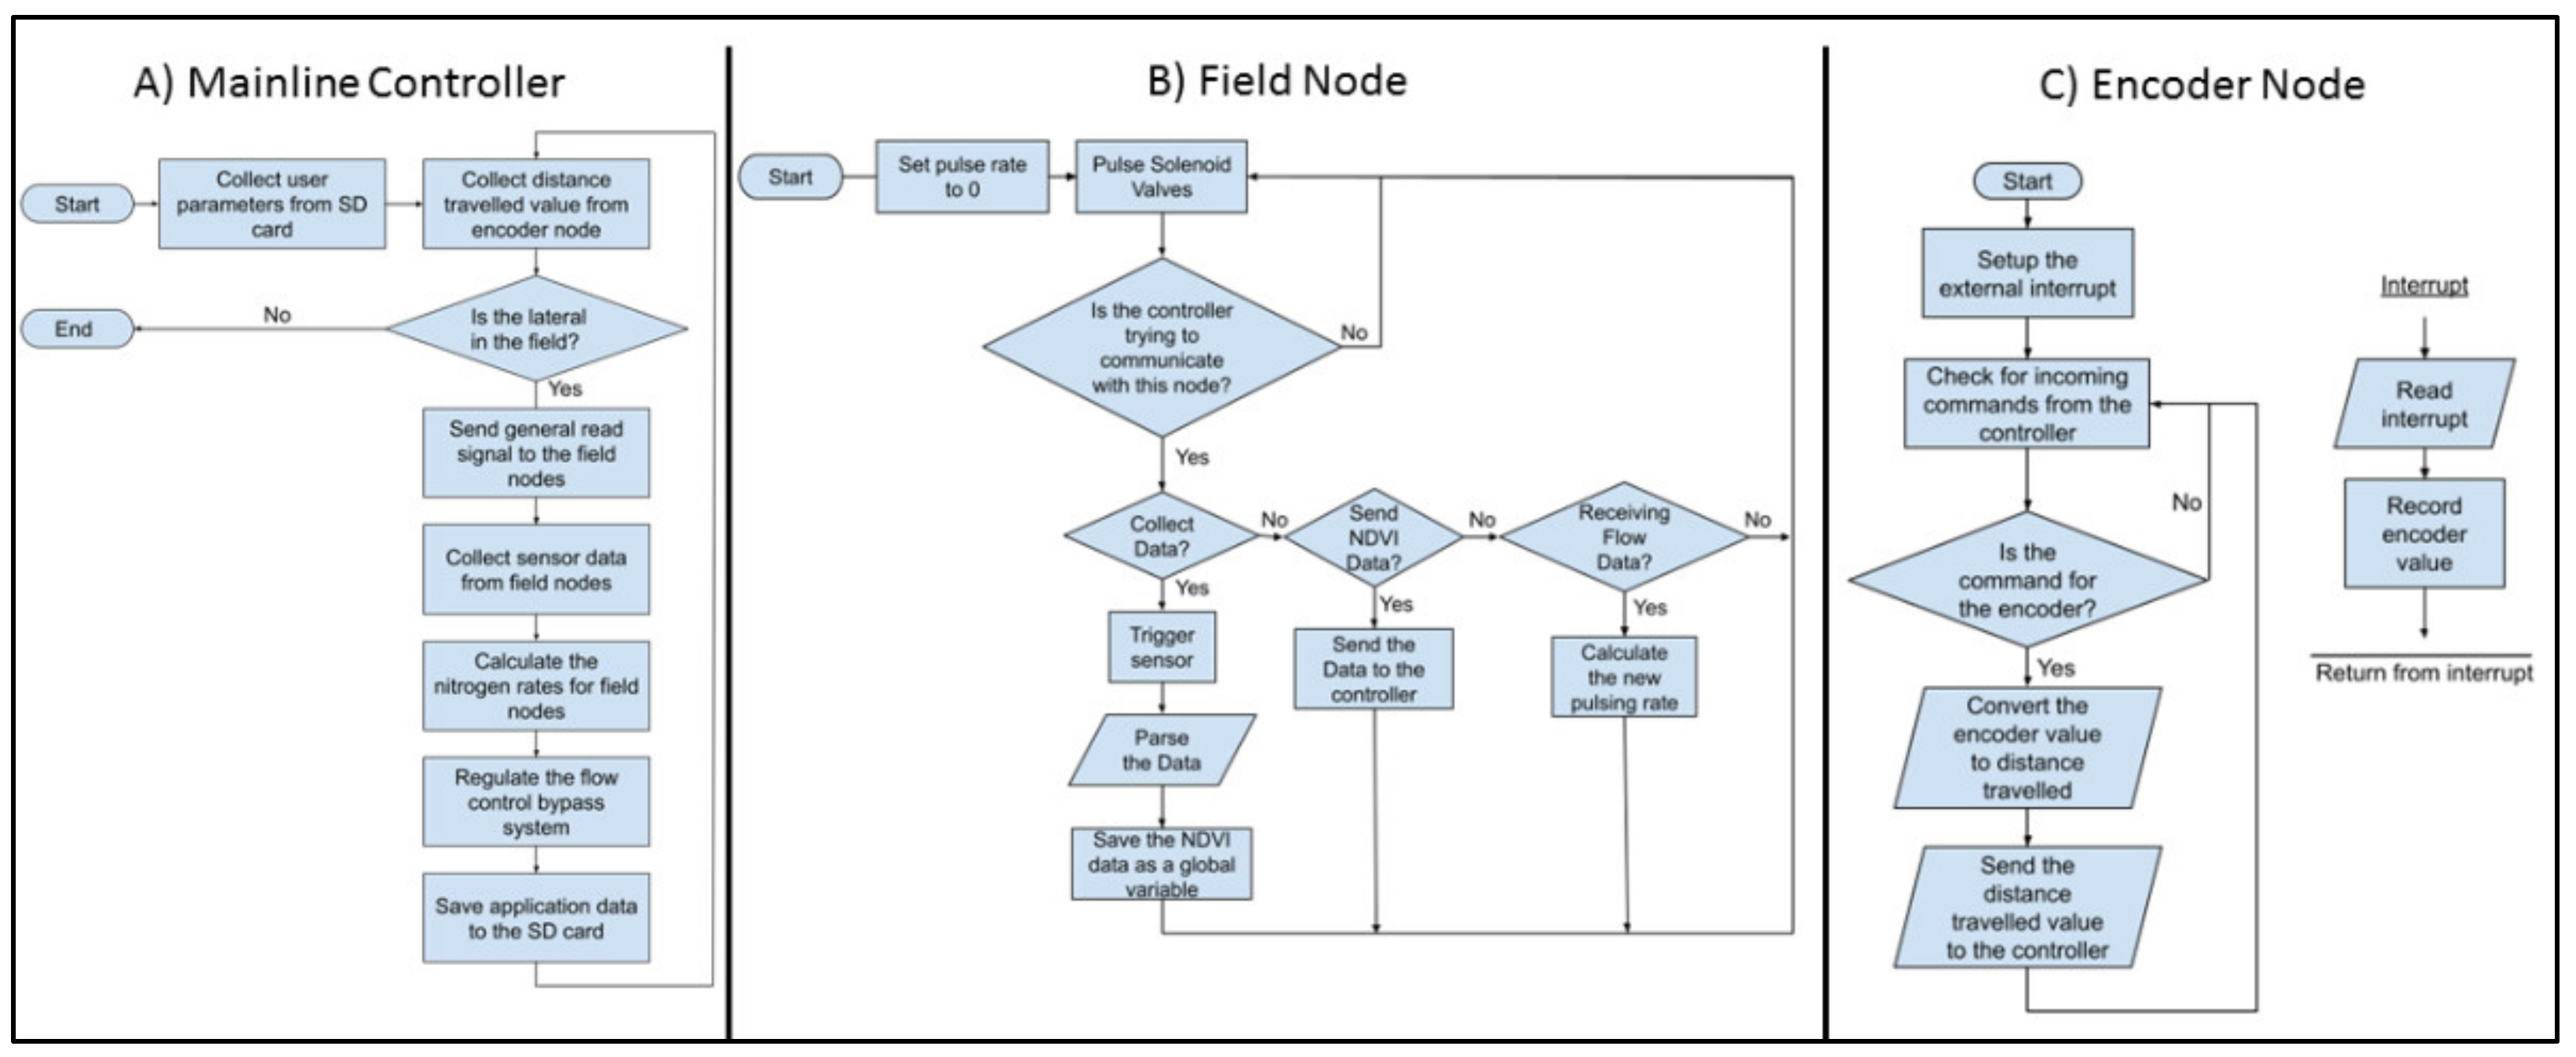
The mainline controller was developed to calculate site-specific N rates and classify them into five flow rate categories (1.5, 4.5, 7.5, 10.5, and 13.5 mL/s) for each zone. The typical maximum N application rate prescribed using the Clemson University cotton N rate algorithm was approximately 15 mL/s, this was divided into five groups of 3 mL/s, and the target application rate was set for the center of each group. This kept minor changes in NDVI values from causing the system to constantly change application rates. Additionally, the controller would send the N rate data to the field nodes, automatically regulate the flow control bypass system, and save the application data to an SD card. These functions were accomplished with an Arduino microcontroller using a custom program developed for this study (
Figure 7A).
User parameters were uploaded to the controller using an SD card that was also used to save the application data. The user parameter file contained a soil EC classification plot map generated using the Veris 3100 soil EC meter, the N rich strip values for the soil EC classifications, the lateral ground speed, and the number of days after emergence. This allowed the user to apply different irrigation rates and to apply the side-dress N on a day of their choosing.
The NDVI sensor data were collected by sending a general “read” signal to ensure readings were collected simultaneously. The NDVI data were collected from each node individually by sending a special character set (e.g., S1, S2, S3…S10) that corresponded to each specific node. Because each element of the system works independently, the controller was equipped to receive error codes and determine if a node was “offline”. Field nodes that were unresponsive would timeout after 700 ms, and an offline error code (e.g., 7) would be recorded instead of an NDVI value. If a field node was responsive but unable to collect NDVI data, an error code (e.g., 9) indicating such would be recorded. Lastly, if a field node was able to trigger an NDVI sample but the GreenSeeker displayed a proximity error, the field node could relay a proximity error code (e.g., 8) to the controller.
Once NDVI data were collected from each node, the controller would refer to the plot map of the field with the user parameters on the SD card to establish what soil EC classification each zone fell into and then calculate the N rate for each zone, respectively. The controller would then send a signal to all the nodes containing the mainline required flow rate and the prescribed flow rate for each zone. The controller would then apply N to the field by running a function to regulate the flow control bypass system to read the flow meter output frequency to calculate the mainline flow rate. The controller adjusts the mainline flow rate by relieving the system’s pressure through the flow control bypass system using the flow control valve. After the controller finished its application process, the program would start over; collecting NDVI data, prescribing and categorizing N rates, and applying N until the lateral moved to the end of the field.
The rotary encoder located the lateral as it travelled through the field and used an interrupt service routine to signal lateral movements that would frequently freeze the controller’s main program due to the interrupts coming during functions that could not be interrupted. For this reason, a rotary encoder node was developed using a separate Arduino Mega placed in the controller housing (
Figure 3C). Upon request from the controller, the encoder node wirelessly transmitted the locational data to the controller, thus reducing the risk of the controller freezing during testing and application. Before the controller collected data from the field nodes, it would collect the distance traveled data from the encoder node, ensuring the N rate calculations for each node were associated with the soil EC data in each plot area. Once the encoder node received the controller’s signal, it converted the encoder value to distance traveled and reported the value. Otherwise, the encoder node would record the number of pulses sent from the rotary encoder using an interrupt function (
Figure 7C).
A custom program was written for each field node to collect and send the field NDVI data upon request from the controller, calculate the percentage of flow needed to take from the mainline, and regulate the zone application rate using the solenoid valve (
Figure 7B). The field node stayed in the pulsing solenoid function unless the controller commanded it to do something else. At the start of the program, the field node did not apply anything but was technically in the pulsing function. This was done by initializing the pulsing rate to zero.
2.4. N Fertigation System Testing
The ability of the system to collect GreenSeeker data, make application rate decisions, utilize the flow meter, and locate itself using the encoder was examined through a series of tests. The first evaluated element of the system was the ability to collect and use NDVI data to make management decisions; two methods were used. The first method for testing the system’s capacity to make accurate application rate decisions was by having the field nodes send simulated NDVI data to the controller in the laboratory. This allowed the controller to calculate N rates for a wide range of NDVI values (0.1–0.99), ensuring the system could properly use the Clemson sensor-based cotton N rate algorithm to prescribe N rates. The system calculated application rates for two soil EC classifications using simulated N- rich strip data uploaded using the SD card. The encoder value was set to be midway through the field, allowing the system to calculate N rates based on a soil EC classification plot map. This was done to verify that the system could determine the soil zone and prescribe different rates between zones. Application rates were calculated in MS Excel using the same NDVI data and compared to the controller calculated rates using a two-sample t-test. The fertigation system was also used to collect GreenSeeker data throughout the field to ensure that the system was capable of collecting NDVI data in a field environment. A single soil EC classification was uploaded to the controller for this test.
The Raven flow meter accuracy in the system was verified using the applicator system constructed on the experimental field’s lateral move irrigation system. Water was used to test the system in place of N. The five application rates (1.5, 4.5, 7.5, 10.5, and 13.5 mL/s) were uniformly applied in each zone for six minutes and collected using bottles attached to the irrigation drop hoses. The collected water volumes were totaled and converted into an application rate for the entire system. Application data saved by the system were compared to the measured data using linear regression and absolute mean error in MS Excel.
A series of tests were conducted to investigate its ability to locate itself, apply the correct N rate, and use the flow meter. The system’s ability to use the rotary encoder to estimate its distance travelled through the field was tested by moving the lateral through the field for 62 m while the controller saved the distance travelled values sent by the encoder node to the SD card. The accuracy of this method was determined by comparing the distance the lateral would have travelled based on its known speed compared to the distance travelled values recorded by the controller using linear regression analysis in MS Excel.
3. Results
The first element of the system that was evaluated was the system’s ability to collect and use the sensor data to automate the N management decision-making process and was assessed using two tests. Results for the two-sample t-test show that there was no significant difference (p > 0.05) between the controller and hand calculations for the kg/ha N application rate prescription (p = 0.99), the mL/s N application rate prescription (p = 0.99), or the mL/s N application rate classification (p = 1). The average application rates calculated by the mainline controller and by hand were 179.7494 kg/ha and 179.7491 kg/ha, respectively. The average flow rates calculated by the mainline controller and by hand for 25-S Urea were 13.82717 and 13.8273, respectively. The average classified application flow rate was 8.72 for both the mainline controller’s calculations and the hand calculations.
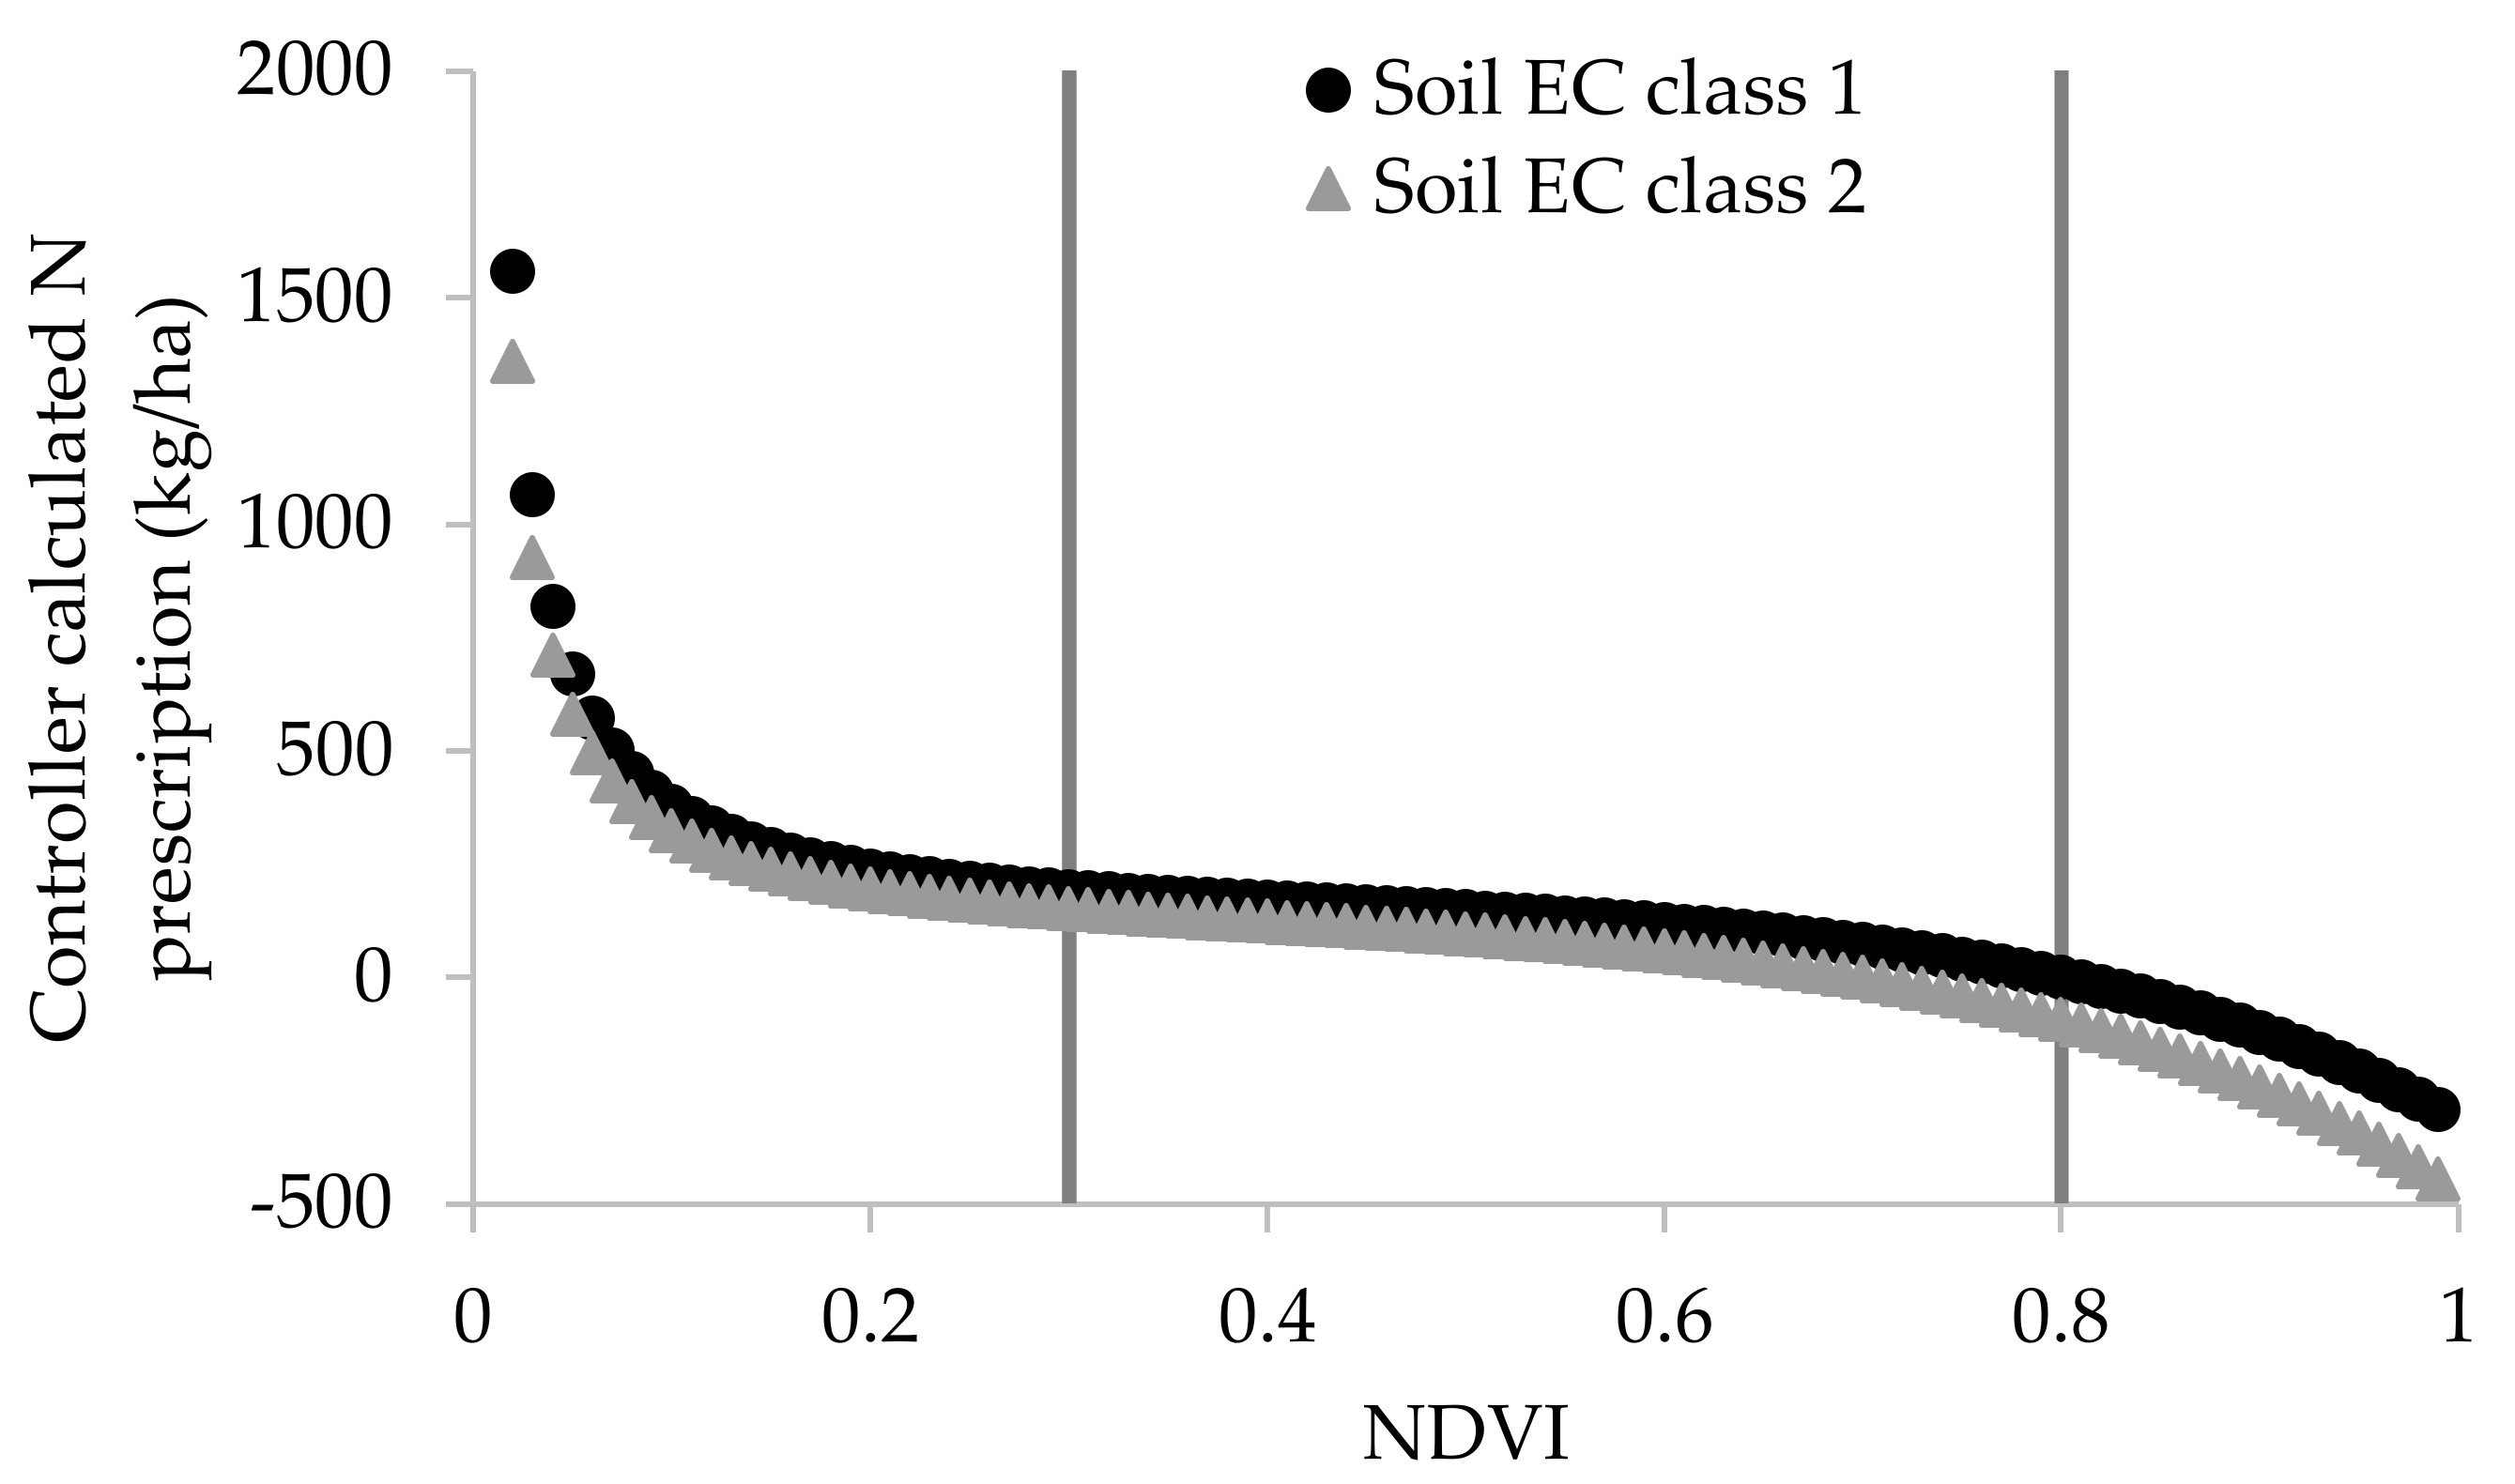
Figure 8 shows the full range of N application rate prescriptions (kg/ha) produced by the controller for two soil EC classifications. The typical range of NDVI values observed in the field is between 0.30 and 0.80.
Figure 9 shows the controller’s N application rate prescription (mL/s) and the controller’s application rate classification (mL/s) for this range.
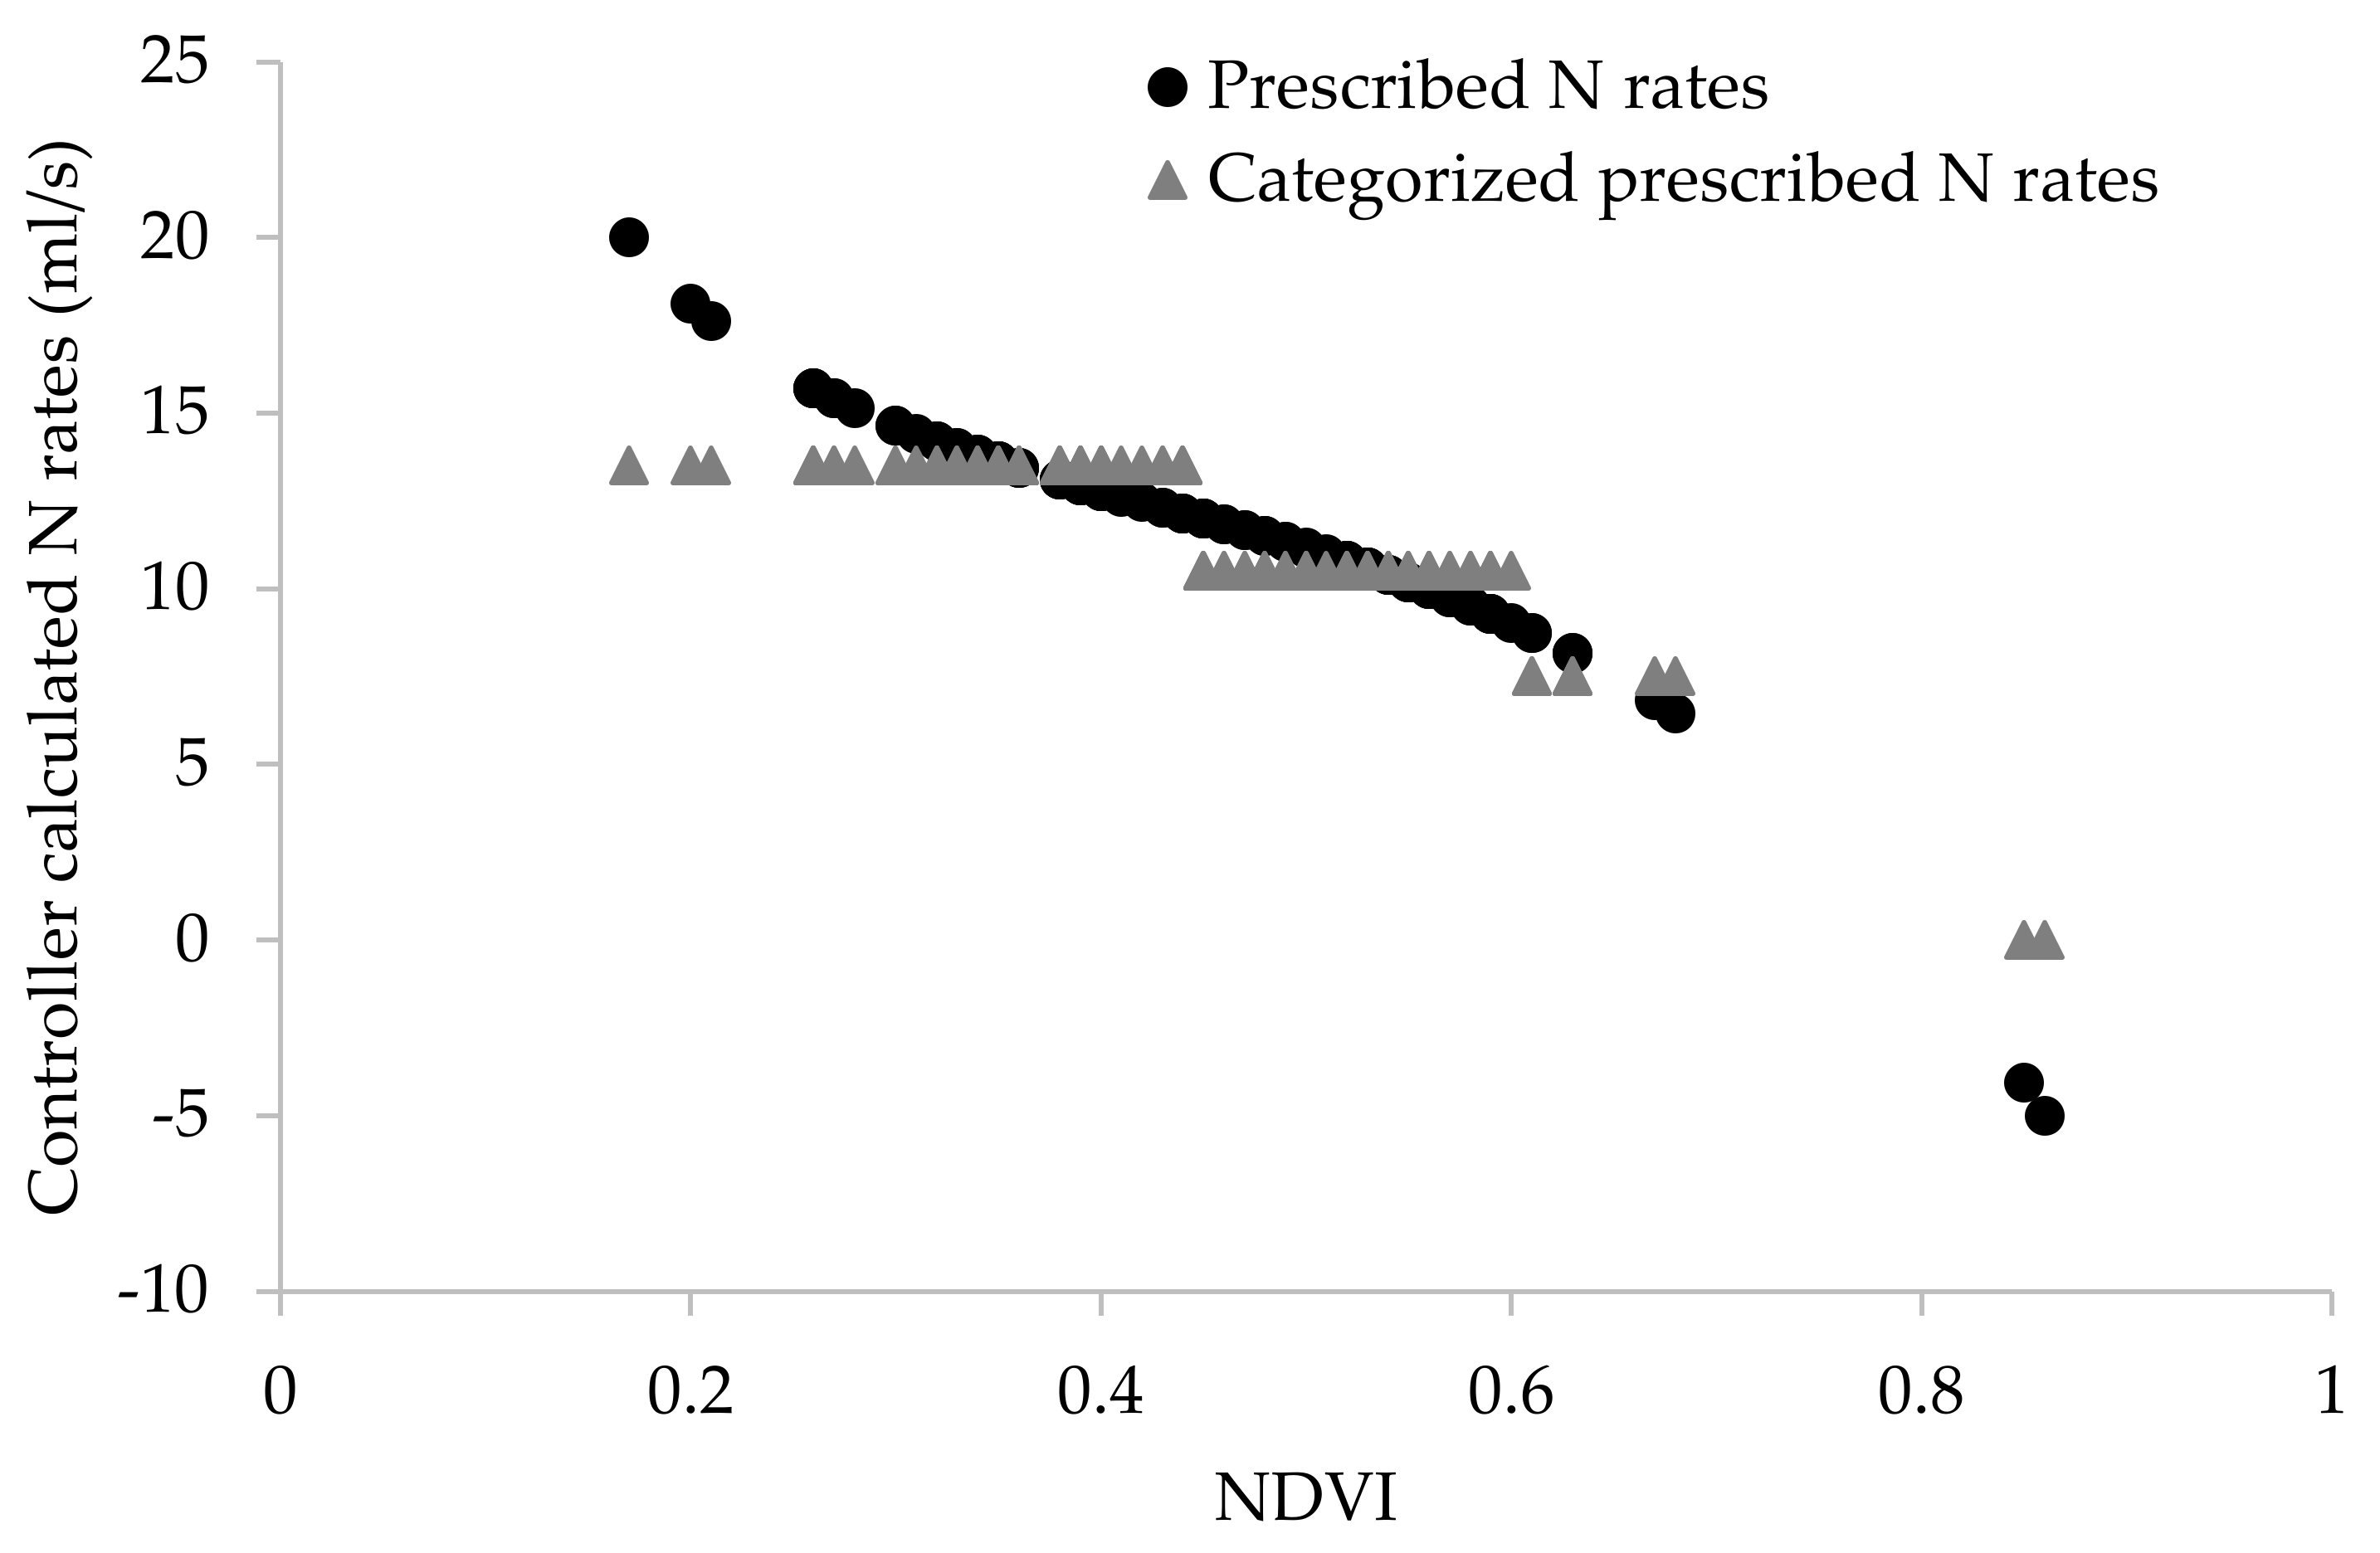
The second test used GreenSeeker data collected by the lateral over the entire length of the field to analyze the system estimation of N rates in a more practical environment while also testing if the system could collect GreenSeeker data in the field.
Figure 10 shows the full range of NDVI values collected using the application system, as well as the prescribed and categorized N application rates for a single soil EC classification.
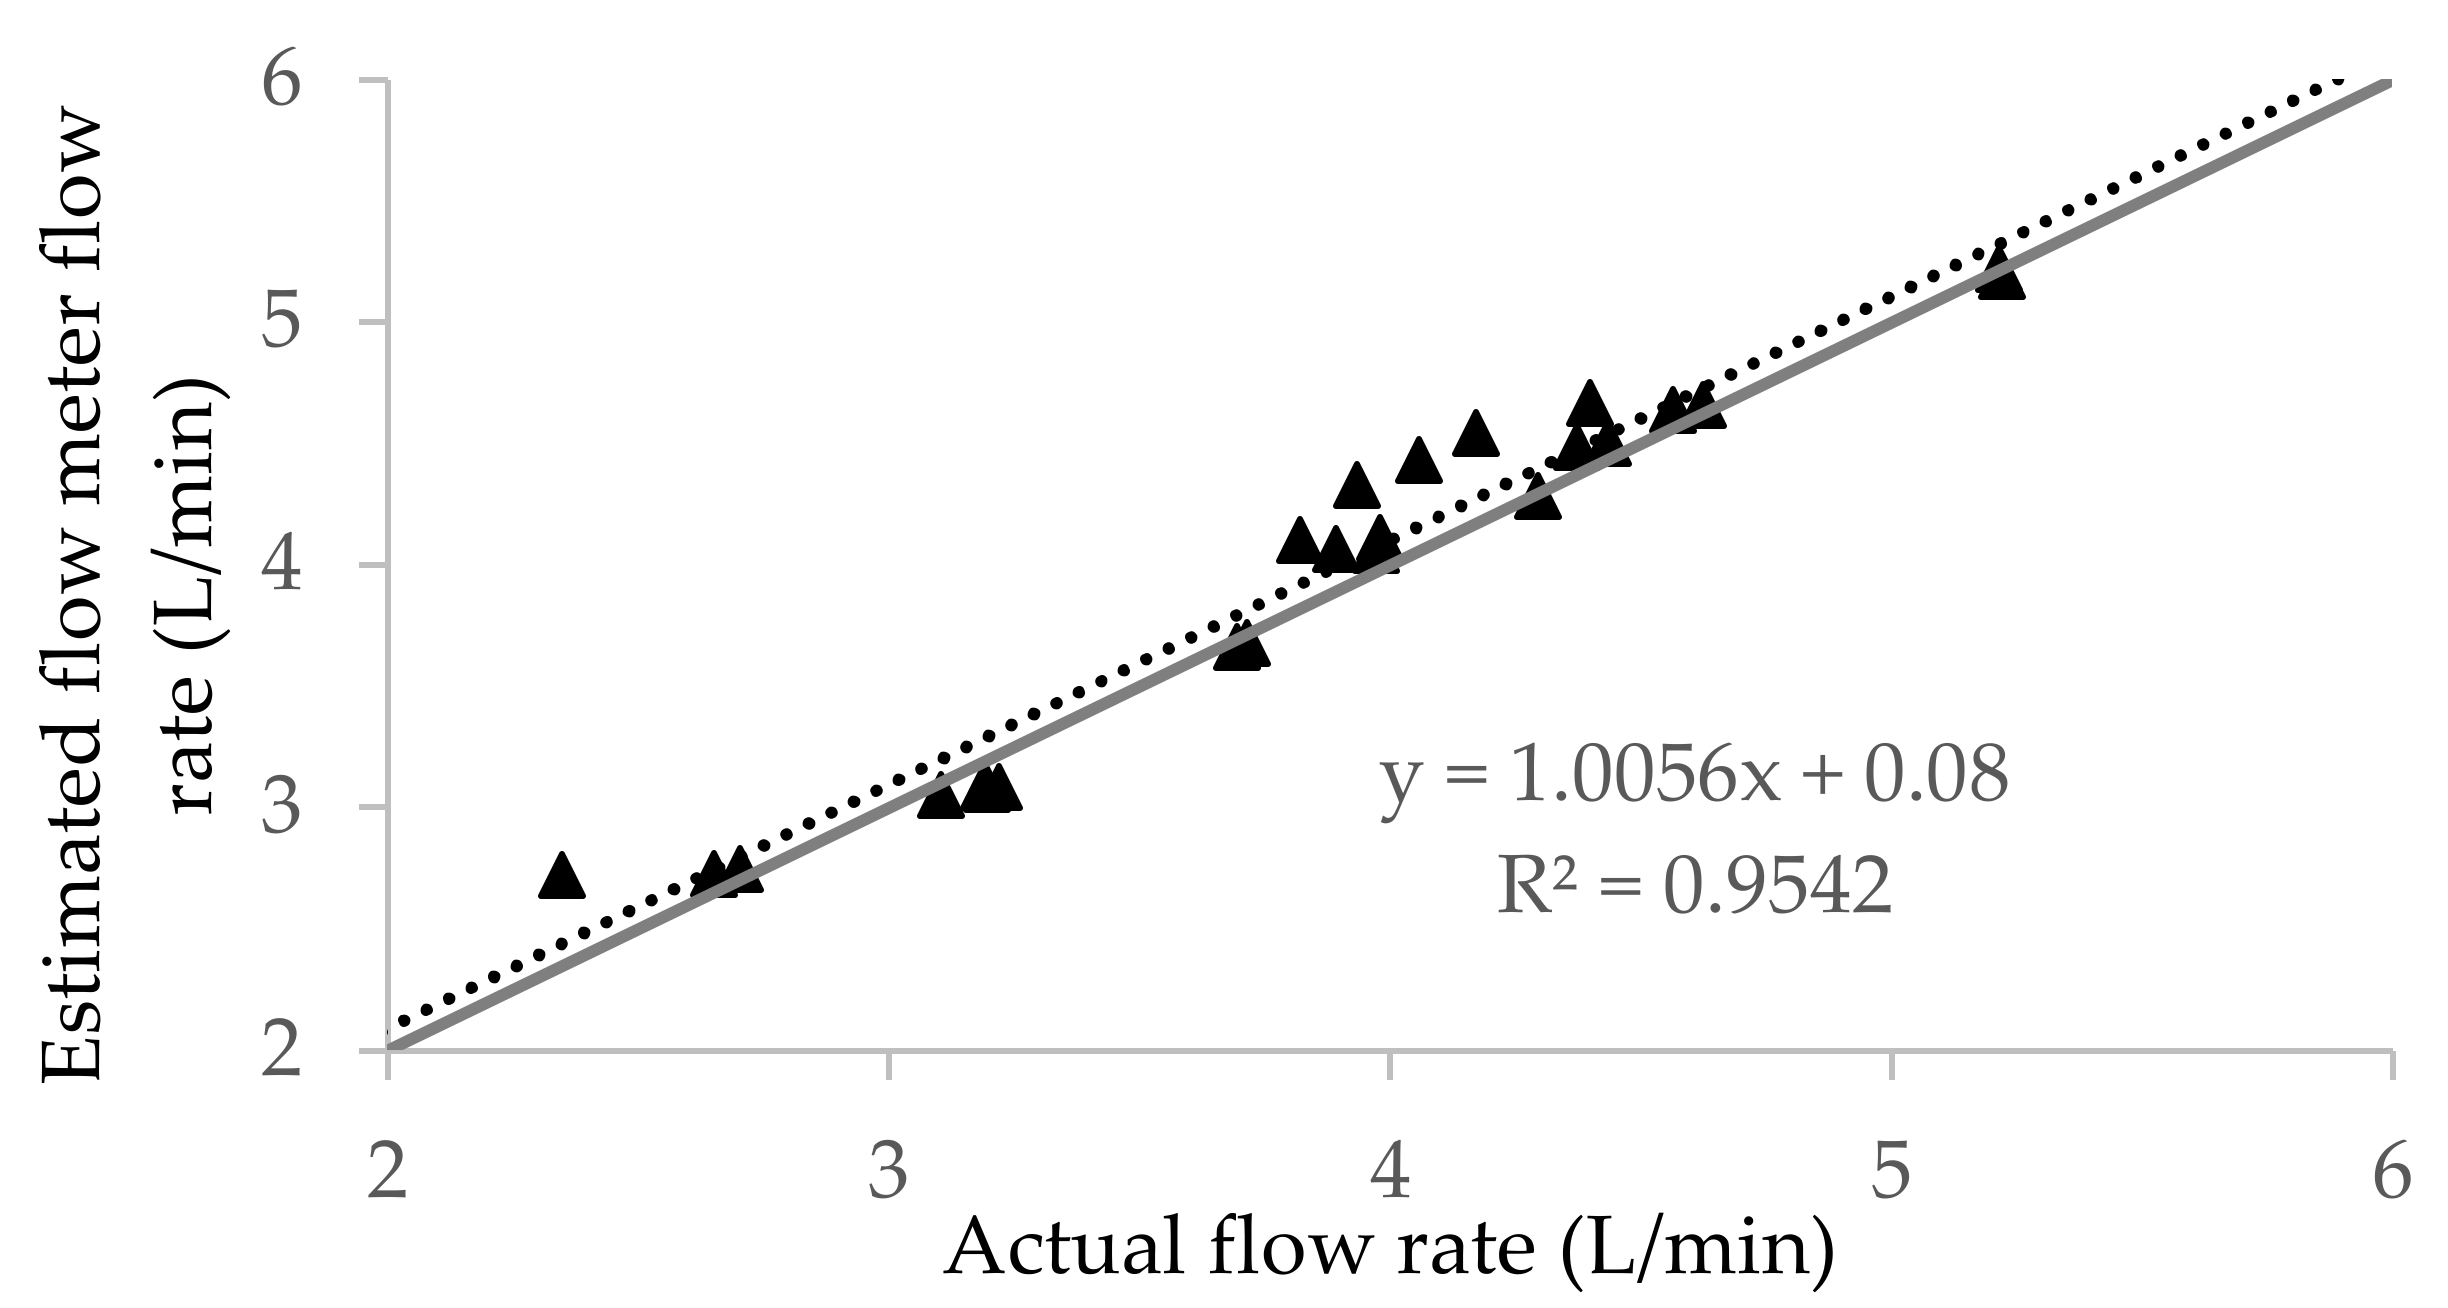
Another component of the system that was tested was the system’s ability to use the Raven flow meter to measure flow rates. Five application rates were applied uniformly across the lateral, and water volumes were collected for six minutes. The collected volumes for all zones were added together and converted into an actual flow rate to be compared to the data recorded from the controller. Absolute mean error and linear regression analysis were used to analyze the relationship between the measured flow rate of the system and the controller estimation of the flow rate using the flow meter. An absolute mean error of 7.12% was observed between the two sample populations.
Figure 11 displays the linear regression analysis, which shows a slope of 1.0056 and an R
2 of 0.95.
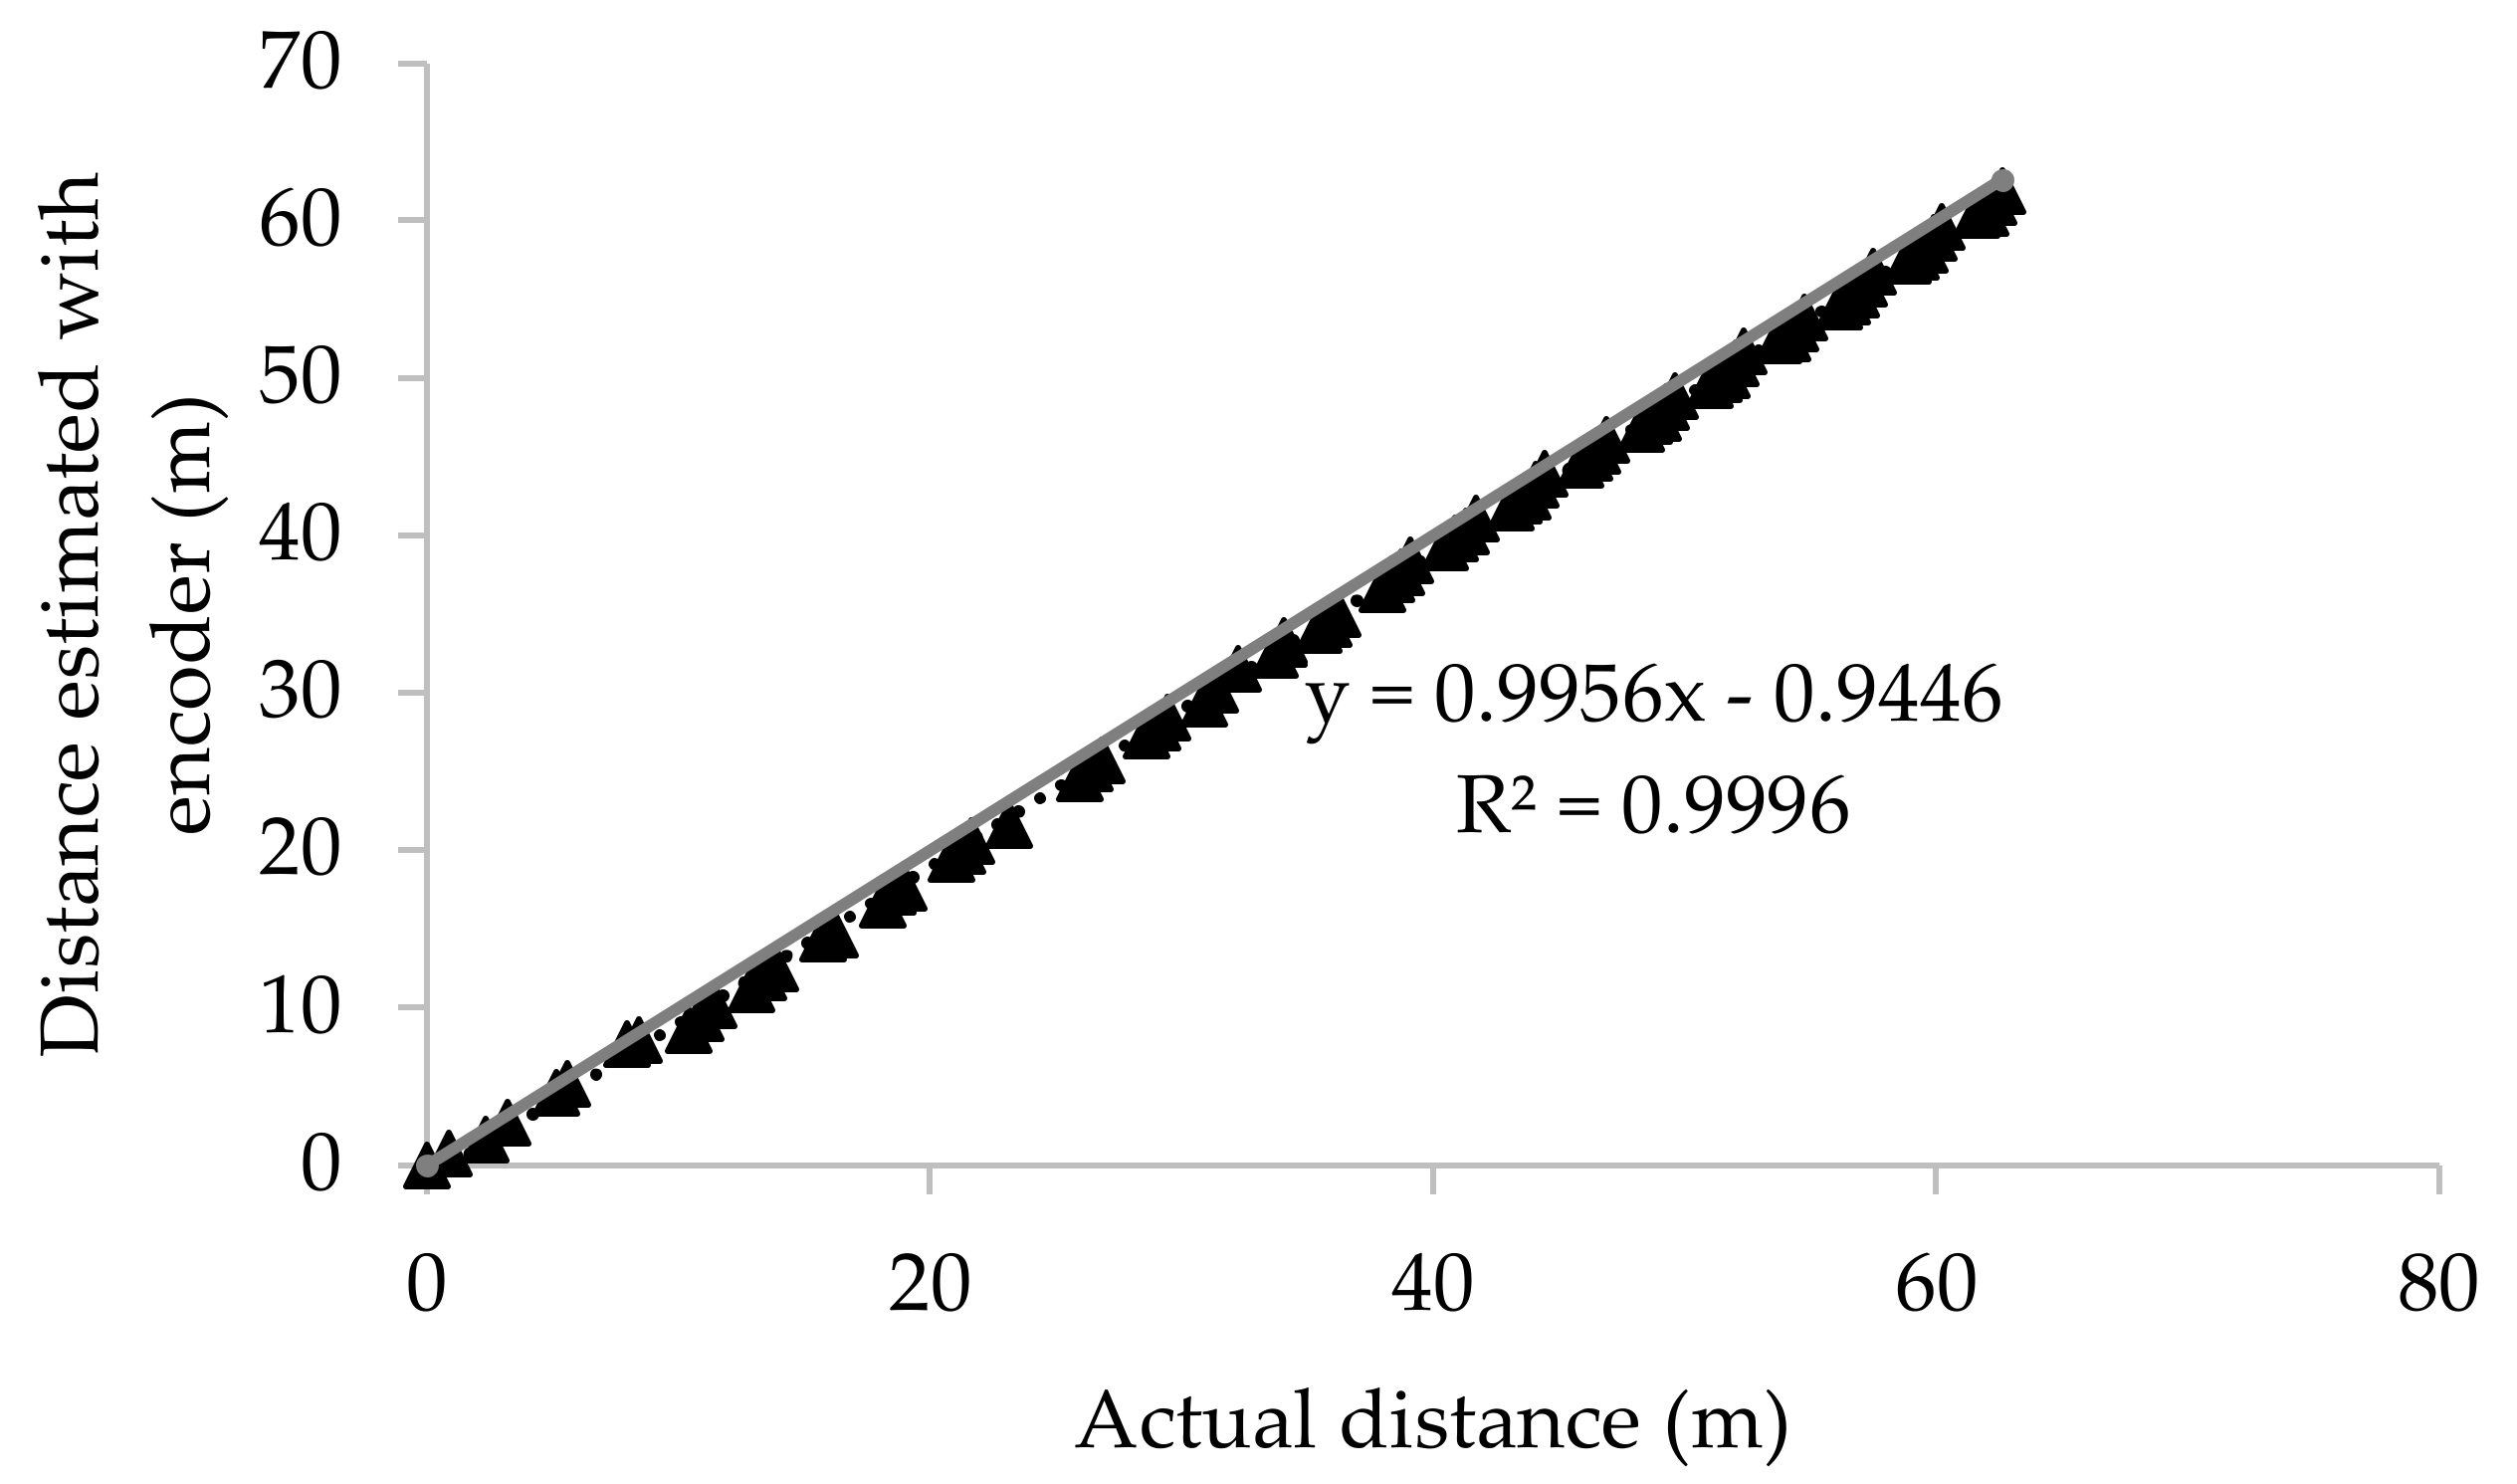
The third component of the system tested was the system’s ability to use the rotary encoder to estimate the distance travelled while the lateral moved through the field. This was tested by running the system through the field for 62 m and allowing the system to record the encoder values. Linear regression was used to compare the system’s estimation of the distance travelled to the distance the lateral should have moved over time.
Figure 12 shows the linear regression analysis results, which show a slope of 0.9956 and an R
2 of 0.99.
4. Discussion
The developed fertigation system was fully capable of using Arduino microcontrollers to collect NDVI sensor values from the GreenSeekers and automate the N management decision-making process. Additionally, the fertigation system was capable of using high precision flow metering and regulating equipment to monitor and regulate the N being supplied to the system using open-source components. These are useful tools for farmers and researchers working to develop nutrient management systems at a reduced budget and increase the availability of systems such as these to producers worldwide.
There are changes that could be made to improve the functionality of the system for a farmer’s use, and these could be done while continuing to use open-source, off-the-shelf components. The current code is limited to performing one task at a time. This means that the controller cannot monitor the system’s flow rate or pressure and collect NDVI data or calculate application rates at the same time. The same problem exists in the field nodes. For instance, when the field nodes are applying N, they cannot collect NDVI data simultaneously. A new version of multi-task Arduino code or Raspberry Pi can be used to enable multiple functions to run simultaneously, thus enabling the system to monitor the flow control bypass system while also collecting NDVI data and making decisions. This would also enable the addition of on-the-go error tracking for this system, which would be greatly beneficial for the operator as well. A dashboard or live visual interface could be added to a Raspberry Pi because of its preexisting visual interface capabilities. Displaying the errors live would also allow for an operator to pause an application and fix any problem on the go without having to find issues with an application in post-analysis.
The application system currently uses Application Transparent (AT) mode for the XBee radios, which means that the radios do not build a network. The radio module transmits the received serial data to a remote destination wirelessly. This also means that all the data sent throughout the system need to be managed very carefully to avoid losing data or locking up the system with incomplete messages. If the system was converted into Application Programming Interface (API) mode, communication could be conducted more quickly, using a data exchange protocol. It would also allow the system to build a sensor network, effectively eliminating any issues related to radio range and allowing the implementation of this system on a lateral of any length.
While the system performed well in these tests, the accuracy of the system needs to be further investigated. The system’s ability to vary rates across zones and the accuracy of the GreenSeekers data collected by the application system should be tested. These questions were not addressed in this study because the focus was on the development of the application system.


 ,
, 
