
Vegetation Indices Applied to Suborbital Multispectral Images of Healthy Coffee and Coffee Infested with Coffee Leaf Miner

 ,
,  ,
,  , , and
Abstract
:1. Introduction
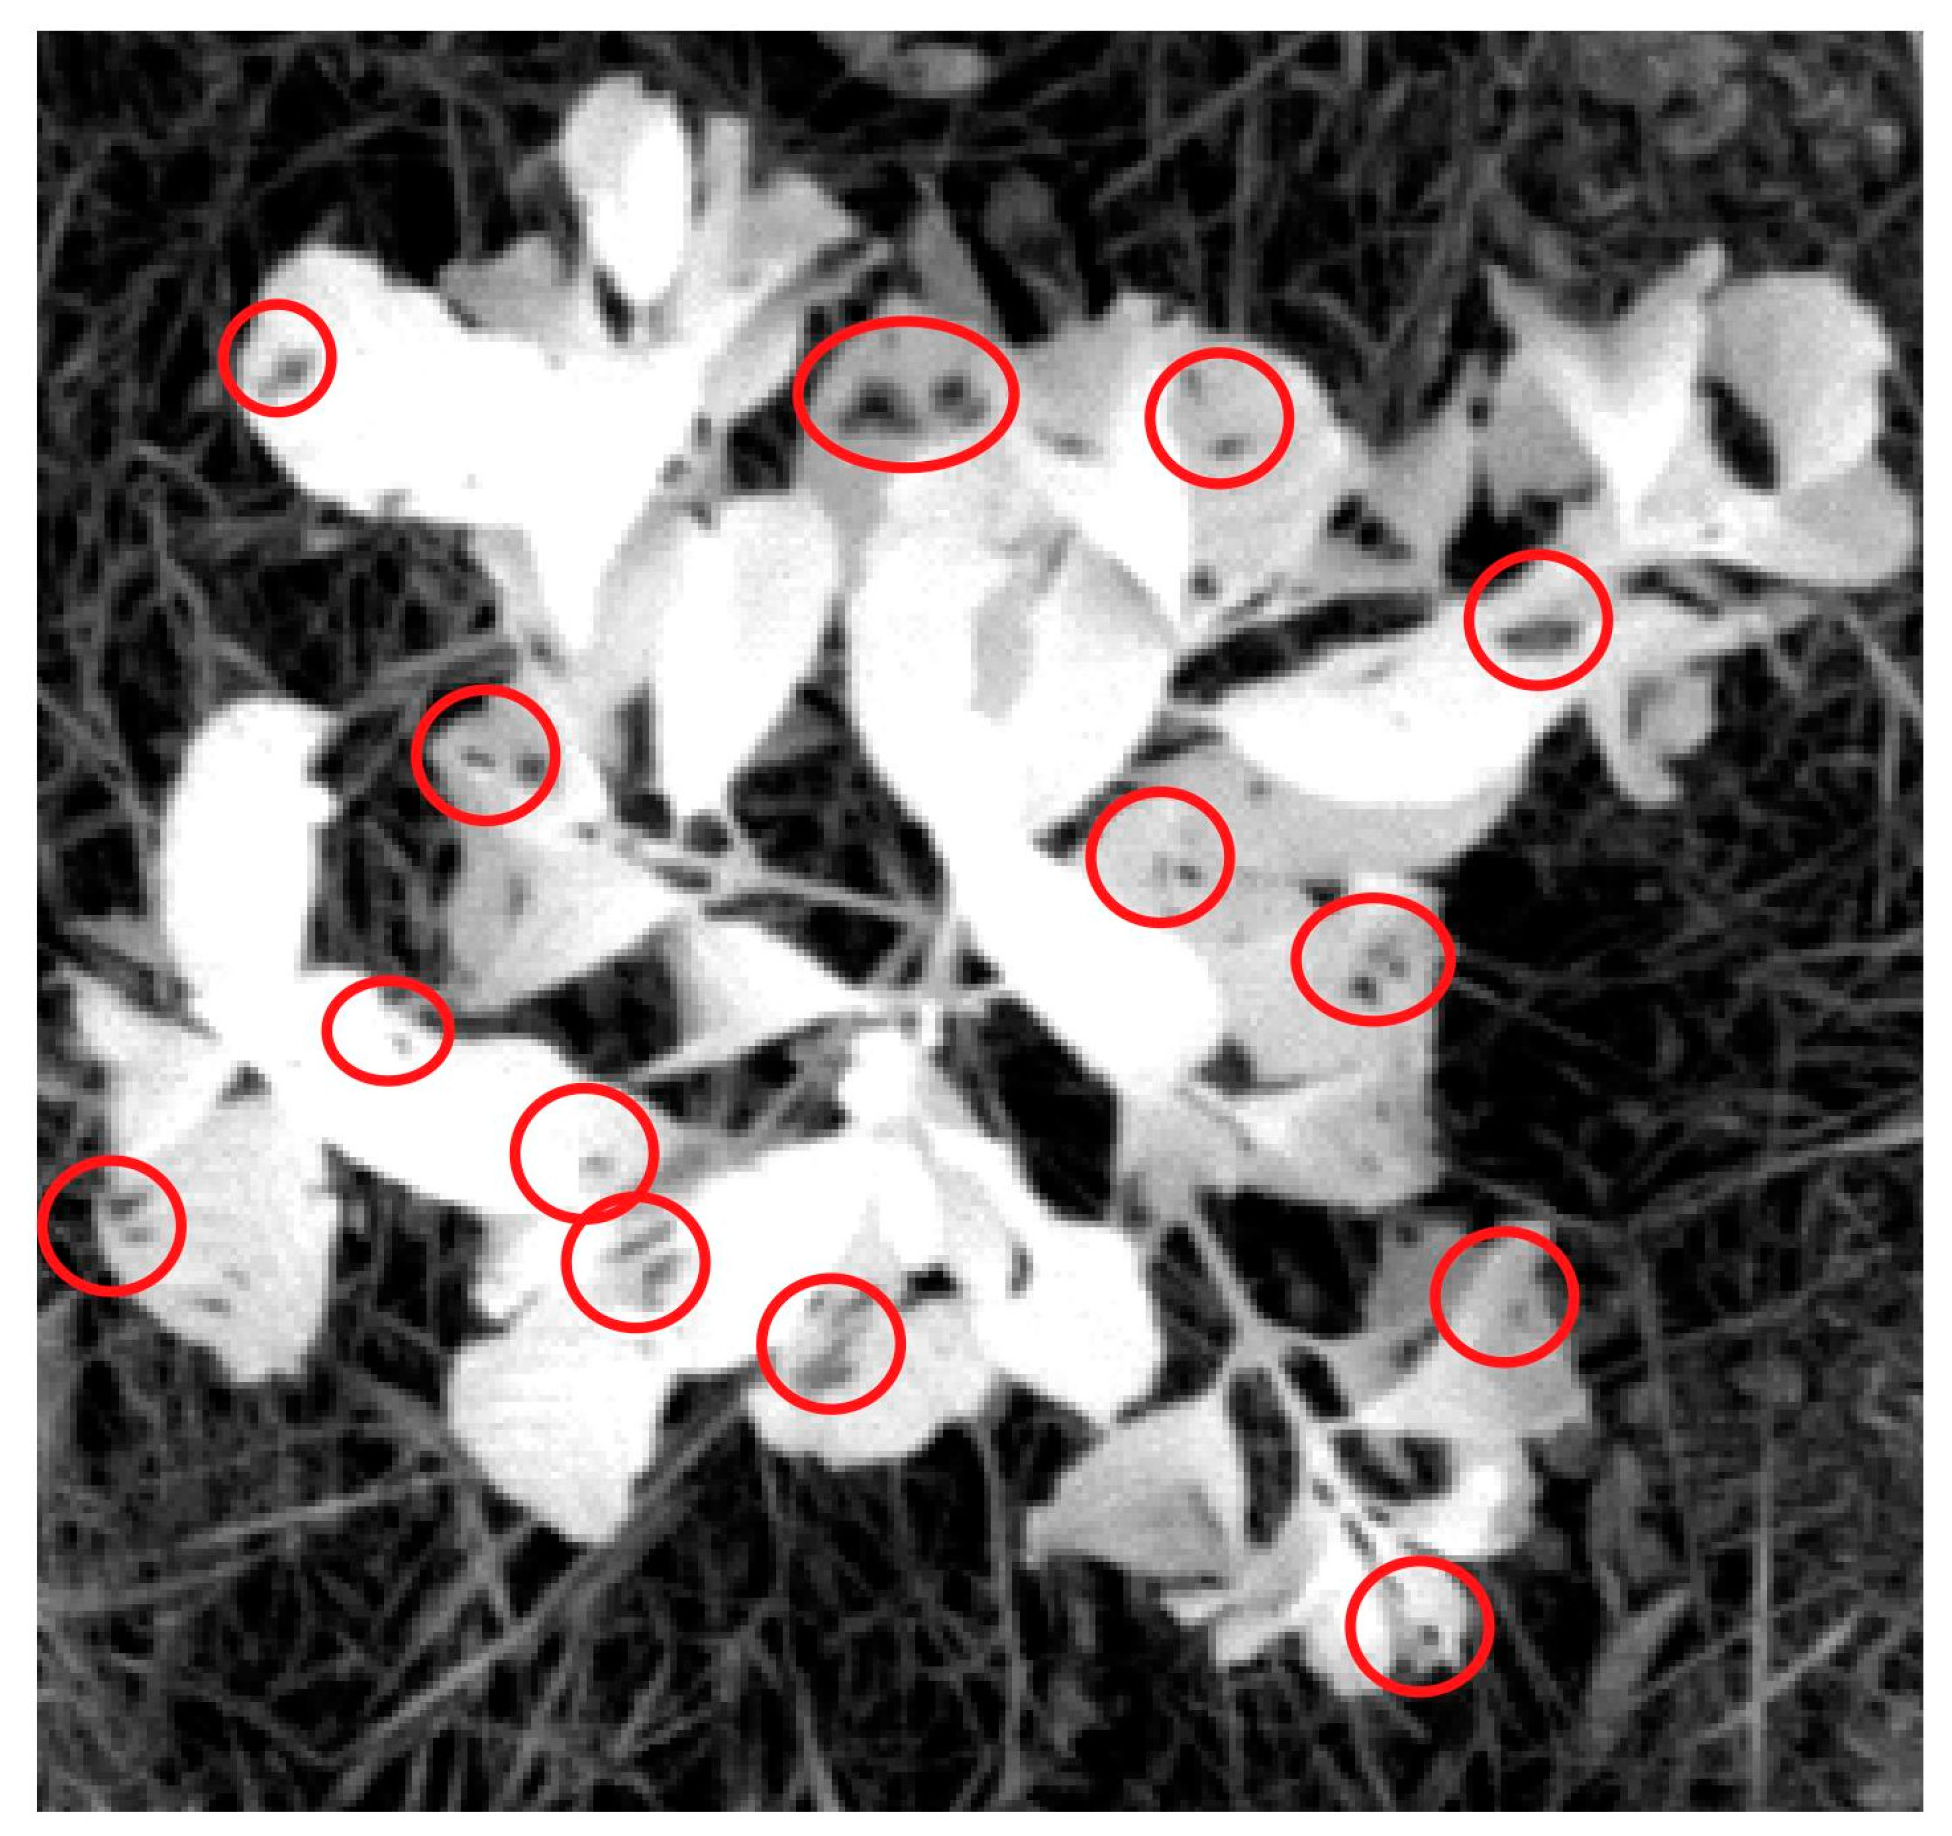
2. Materials and Methods
3. Results and Discussion
4. Conclusions
Author Contributions
Funding
Institutional Review Board Statement
Informed Consent Statement
Data Availability Statement
Acknowledgments
Conflicts of Interest
References
- United States Department of Agriculture (USDA). Available online: http://usda.mannlib.cornell.edu/MannUsda/viewDocumentInfo.do?documentID=1801 (accessed on 10 February 2021).
- Conab-Companhia Nacional de Abastecimento. Acompanhamento da Safra Brasileira de Café; Conab-Companhia Nacional de Abastecimento: Brasília, Brazil, 2021; v.8, n.3.
- Castellana, F.; De Nucci, S.; De Pergola, G.; Di Chito, M.; Lisco, G.; Triggiani, V.; Sardone, R.; Zupo, R. Trends in Coffee and Tea Consumption during the COVID-19 Pandemic. Foods 2021, 10, 2458. [Google Scholar] [CrossRef] [PubMed]
- Mojtahedzadeh, N.; Neumann, F.A.; Rohwer, E.; Nienhaus, A.; Augustin, M.; Harth, V.; Zyriax, B.-C.; Mache, S. The Health Behaviour of German Outpatient Caregivers in Relation to the COVID-19 Pandemic: A Mixed-Methods Study. Int. J. Environ. Res. Public Health 2021, 18, 8213. [Google Scholar] [CrossRef] [PubMed]
- Sidor, A.; Rzymski, P. Dietary Choices and Habits during COVID-19 Lockdown: Experience from Poland. Nutrients 2020, 12, 1657. [Google Scholar] [CrossRef] [PubMed]
- Franklin, A.M.; Martins, F.K.; Costa, E.S.; Nunes, J.F. Comunidade de parasitóides associados ao Bicho-mineiro (Leucoptera coffeella Guérin-Mèneville) em folhas de café (Coffea arábica L.) cultivadas no Sudoeste de Minas Gerais. Ciência ET Prax. 2017, 10, 25–30. [Google Scholar]
- Liska, G.R.; Silveira, E.C.D.; Reis, P.R.; Cirillo, M.Â.; Gonzalez, G.G.H. Seleção de um modelo de regressão binomial para taxa de predação de Euseius concordis (Chant, 1959). Coffee Sci. 2015, 10, 113–121. [Google Scholar]
- Bento, N.L.; Ferraz, G.A.E.S.; Barata, R.A.P.; Soares, D.V.; Santos, L.M.D.; Santana, L.S.; Ferraz, P.F.P.; Conti, L.; Palchetti, E. Characterization of Recently Planted Coffee Cultivars from Vegetation Indices Obtained by a Remotely Piloted Aircraft System. Sustainability 2022, 14, 1446. [Google Scholar] [CrossRef]
- Barbosa, B.D.S.; Araújo e Silva Ferraz, G.; Mendes dos Santos, L.; Santana, L.; Bedin Marin, D.; Rossi, G.; Conti, L. Aplicação de Imagens RGB Obtidas por VANT na Cafeicultura. Remote Sens. 2021, 13, 2397. [Google Scholar] [CrossRef]
- Marin, D.B.; Santana, L.S.; Barbosa, B.D.S.; Barata, R.A.P.; Osco, L.P.; Ramos, A.P.M.; Guimarães, P.H.S. Detecting coffee leaf rust with UAV-based vegetation indices and decision tree machine learning models. Comput. Electron. Agric. 2021, 190, 106476. [Google Scholar] [CrossRef]
- Wójtowicz, M.; Wójtowicz, A.; Piekarczyk, J. Application of remote sensing methods in agriculture. Commun. Biometry Crop Sci. 2016, 11, 31–50. [Google Scholar]
- Martins, R.N.; Pinto, F.D.A.D.C.; de Queiroz, D.M.; Valente, D.S.M.; Rosas, J.T.F. Um novo índice de vegetação para monitoramento da maturação do café usando imagens aéreas. Sens. Remote 2021, 13, 263. [Google Scholar]
- Velásquez, D.; Sánchez, A.; Sarmiento, S.; Toro, M.; Maiza, M.; Sierra, B. Um método para detectar a ferrugem do café através de redes de sensores sem fio, sensoriamento remoto e aprendizado profundo: Estudo de caso da variedade caturra na Colômbia. Ciências Apl. 2020, 10, 697. [Google Scholar]
- Oliveira, A.J.; Assis, G.A.; Guizilini, V.; Faria, E.R.; Souza, J.R. Segmenting and Detecting Nematode in Coffee Crops Using Aerial Images. In Transactions on Petri Nets and Other Models of Concurrency XV; Springer Science and Business Media LLC.: Berlin/Heidelberg, Germany, 2019; pp. 274–283. [Google Scholar]
- Alvares, C.A.; Stape, J.L.; Sentelhas, P.C.; Gonçalves, J.L.M.; Sparovek, G. Köppen’s climate classification map for Brazil. Meteorol. Z. 2013, 22, 711–728. [Google Scholar] [CrossRef]
- Olsson, P.O.; Vivekar, A.; Adler, K.; Garcia Millan, V.E.; Koc, A.; Alamrani, M.; Eklundh, L. Evaluating the accuracy of the parrot sequoia camera and sunshine sensor. Remote Sens. 2021, 13, 577. [Google Scholar] [CrossRef]
- Qgis. Qgis Geographic Information System. Open Source Geospat. Found. Proj. 2016. Available online: http://qgis.osgeo.org (accessed on 10 June 2020).
- Rouse, J.W.; Haas, R.H.; Schell, J.A.; Deering, D.W. Monitoring vegetation systems in the great plains with ERTS. In Earth Resources Technology Satellite (ERTS) Symposium; NASA: Greenbelt, MD, USA, 1974. [Google Scholar]
- Gitelson, A.A.; Kaufman, Y.J.; Merzlyak, M.N. Use of a green channel in remote sensing of global vegetation from EOSMODIS. Remote Sens. Environ. 1996, 58, 289–298. [Google Scholar] [CrossRef]
- Sripada, R.P.; Heiniger, R.W.; White, J.G.; Meijer, A.D. Aerial color infrared photography for determining early in-season nitrogen requirements in corn. Agron. J. 2006, 98, 968–977. [Google Scholar] [CrossRef]
- Wang, F.M.; Huang, J.F.; Tang, Y.L.; Wang, X.Z. New vegetation index and its application in estimating leaf area index of rice. Rice Sci. 2007, 14, 195–203. [Google Scholar] [CrossRef]
- Nestel, D.; Dickschen, F.; Altieri, M.A. Seasonal and spatial population loads of a tropical insect: The case of the coffee leaf-miner in Mexico. Ecol. Entomol. 1994, 19, 159–167. [Google Scholar] [CrossRef]
- Ahamed, T.; Tian, L.; Zhang, Y.; Ting, K.C. A review of remote sensing methods for biomass feedstock production. Biomass Bioenergy 2011, 35, 2455–2469. [Google Scholar] [CrossRef]
- Souza, J.C.; Reis, P.R. Bicho Mineiro: Biologia, Danos e Manejo Integrado; Epamig 37; Júlio César de Souza: Belo Horizonte, Brasil, 1992. [Google Scholar]
- Fragoso, D.B.; Jusselino-Filho, P.; Guedes, R.N.; Proque, R. Seletividade de inseticidas a vespas predadoras de Leucoptera coffeella (Guér.-Mènev.) (Lepidoptera: Lyonetiidae). Neotrop. Entomol. 2001, 30, 139–143. [Google Scholar] [CrossRef]
- Marin, D.B.; Ferraz, G.A.E.S.; Guimaraes, P.H.S.; Schwerz, F.; Santana, L.S.; Barbosa, B.D.S.; Barata, R.A.P.; Faria, R.D.O.; Dias, J.E.L.; Conti, L.; et al. Remotely Piloted Aircraft and Random Forest in the Evaluation of the Spatial Variability of Foliar Nitrogen in Coffee Crop. Remote Sens. 2021, 13, 1471. [Google Scholar] [CrossRef]
- Kagan, D.; Alpert, G.F.; Fire, M. Automatic large scale detection of red palm weevil infestation using street view images. ISPRS J. Photogramm. Remote Sens. 2021, 182, 122–133. [Google Scholar] [CrossRef]

| Band | Initial λ (nm) | Final λ (nm) |
|---|---|---|
| Green (G) | 530 | 570 |
| Red (R) | 640 | 680 |
| Red Edge (RE) | 730 | 740 |
| Near Infrared (NIR) | 770 | 810 |
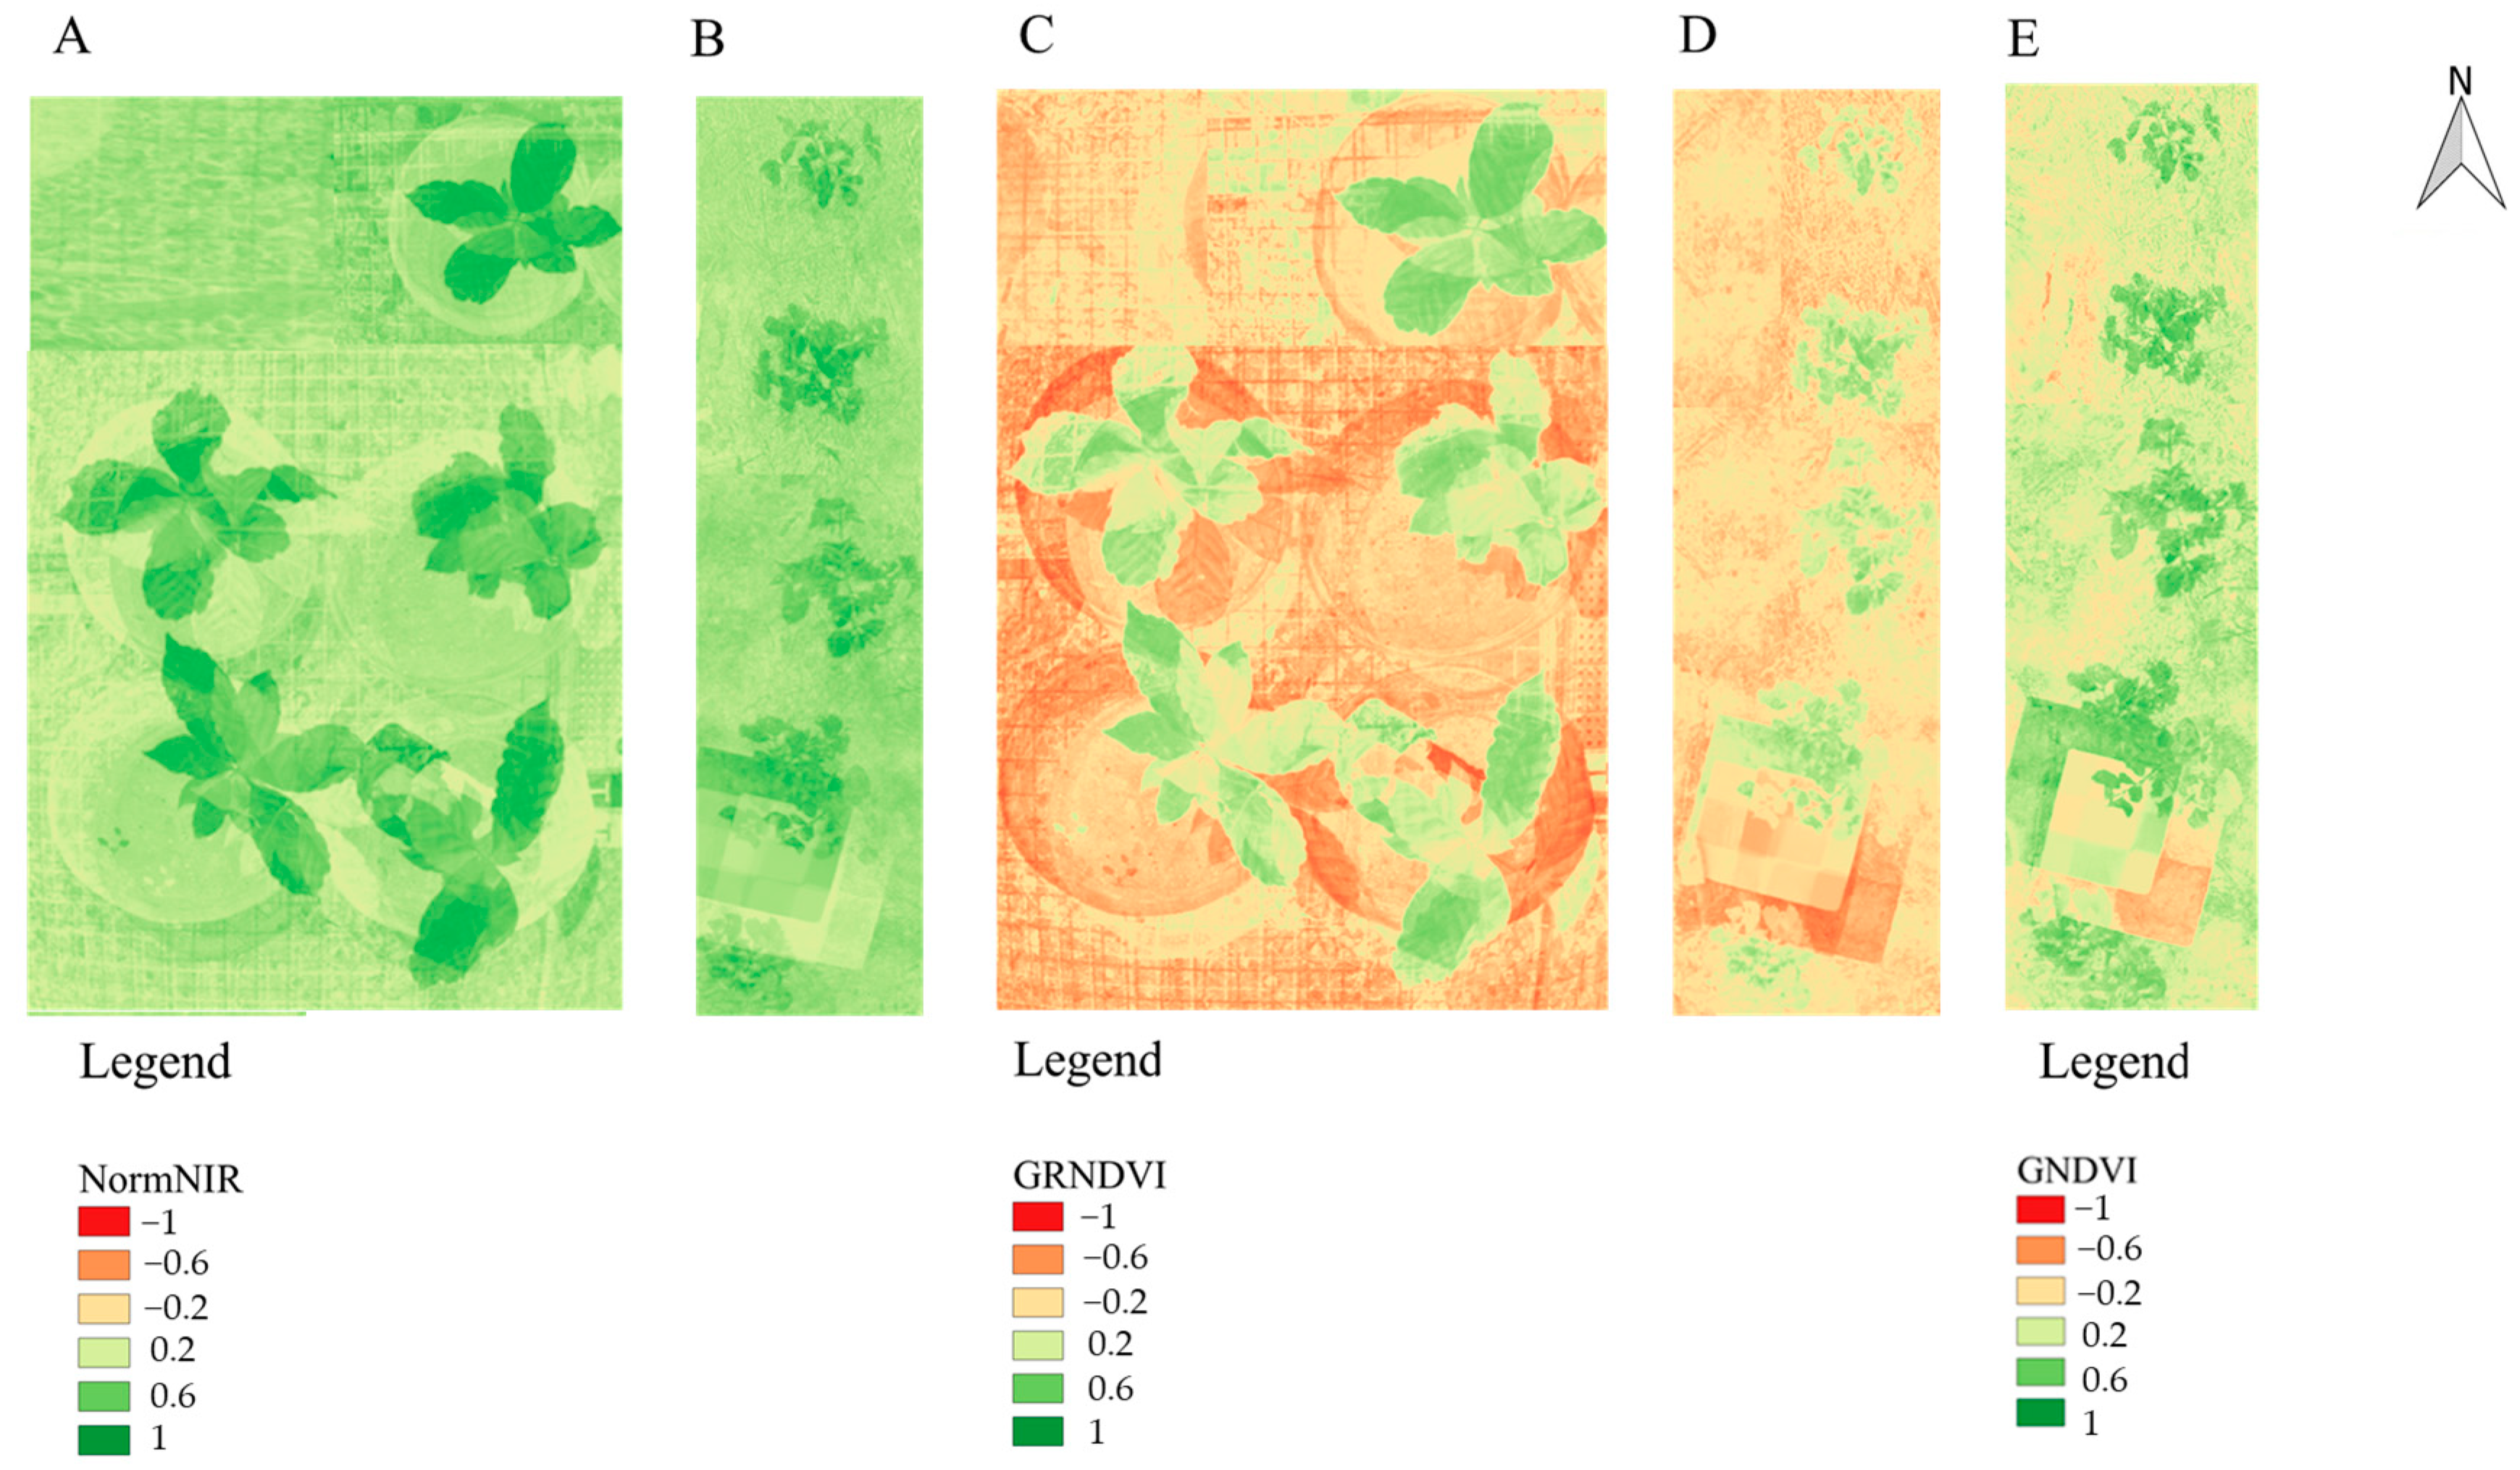
| Vegetation Indices (VI) | Equation | Reference |
|---|---|---|
| Normalized Difference Vegetation Index (NDVI) | [18] | |
| Green Normalized Difference Vegetation Index (GNDVI) | [19] | |
| Norm NIR | [20] | |
| Green-Red NDVI | [21] |
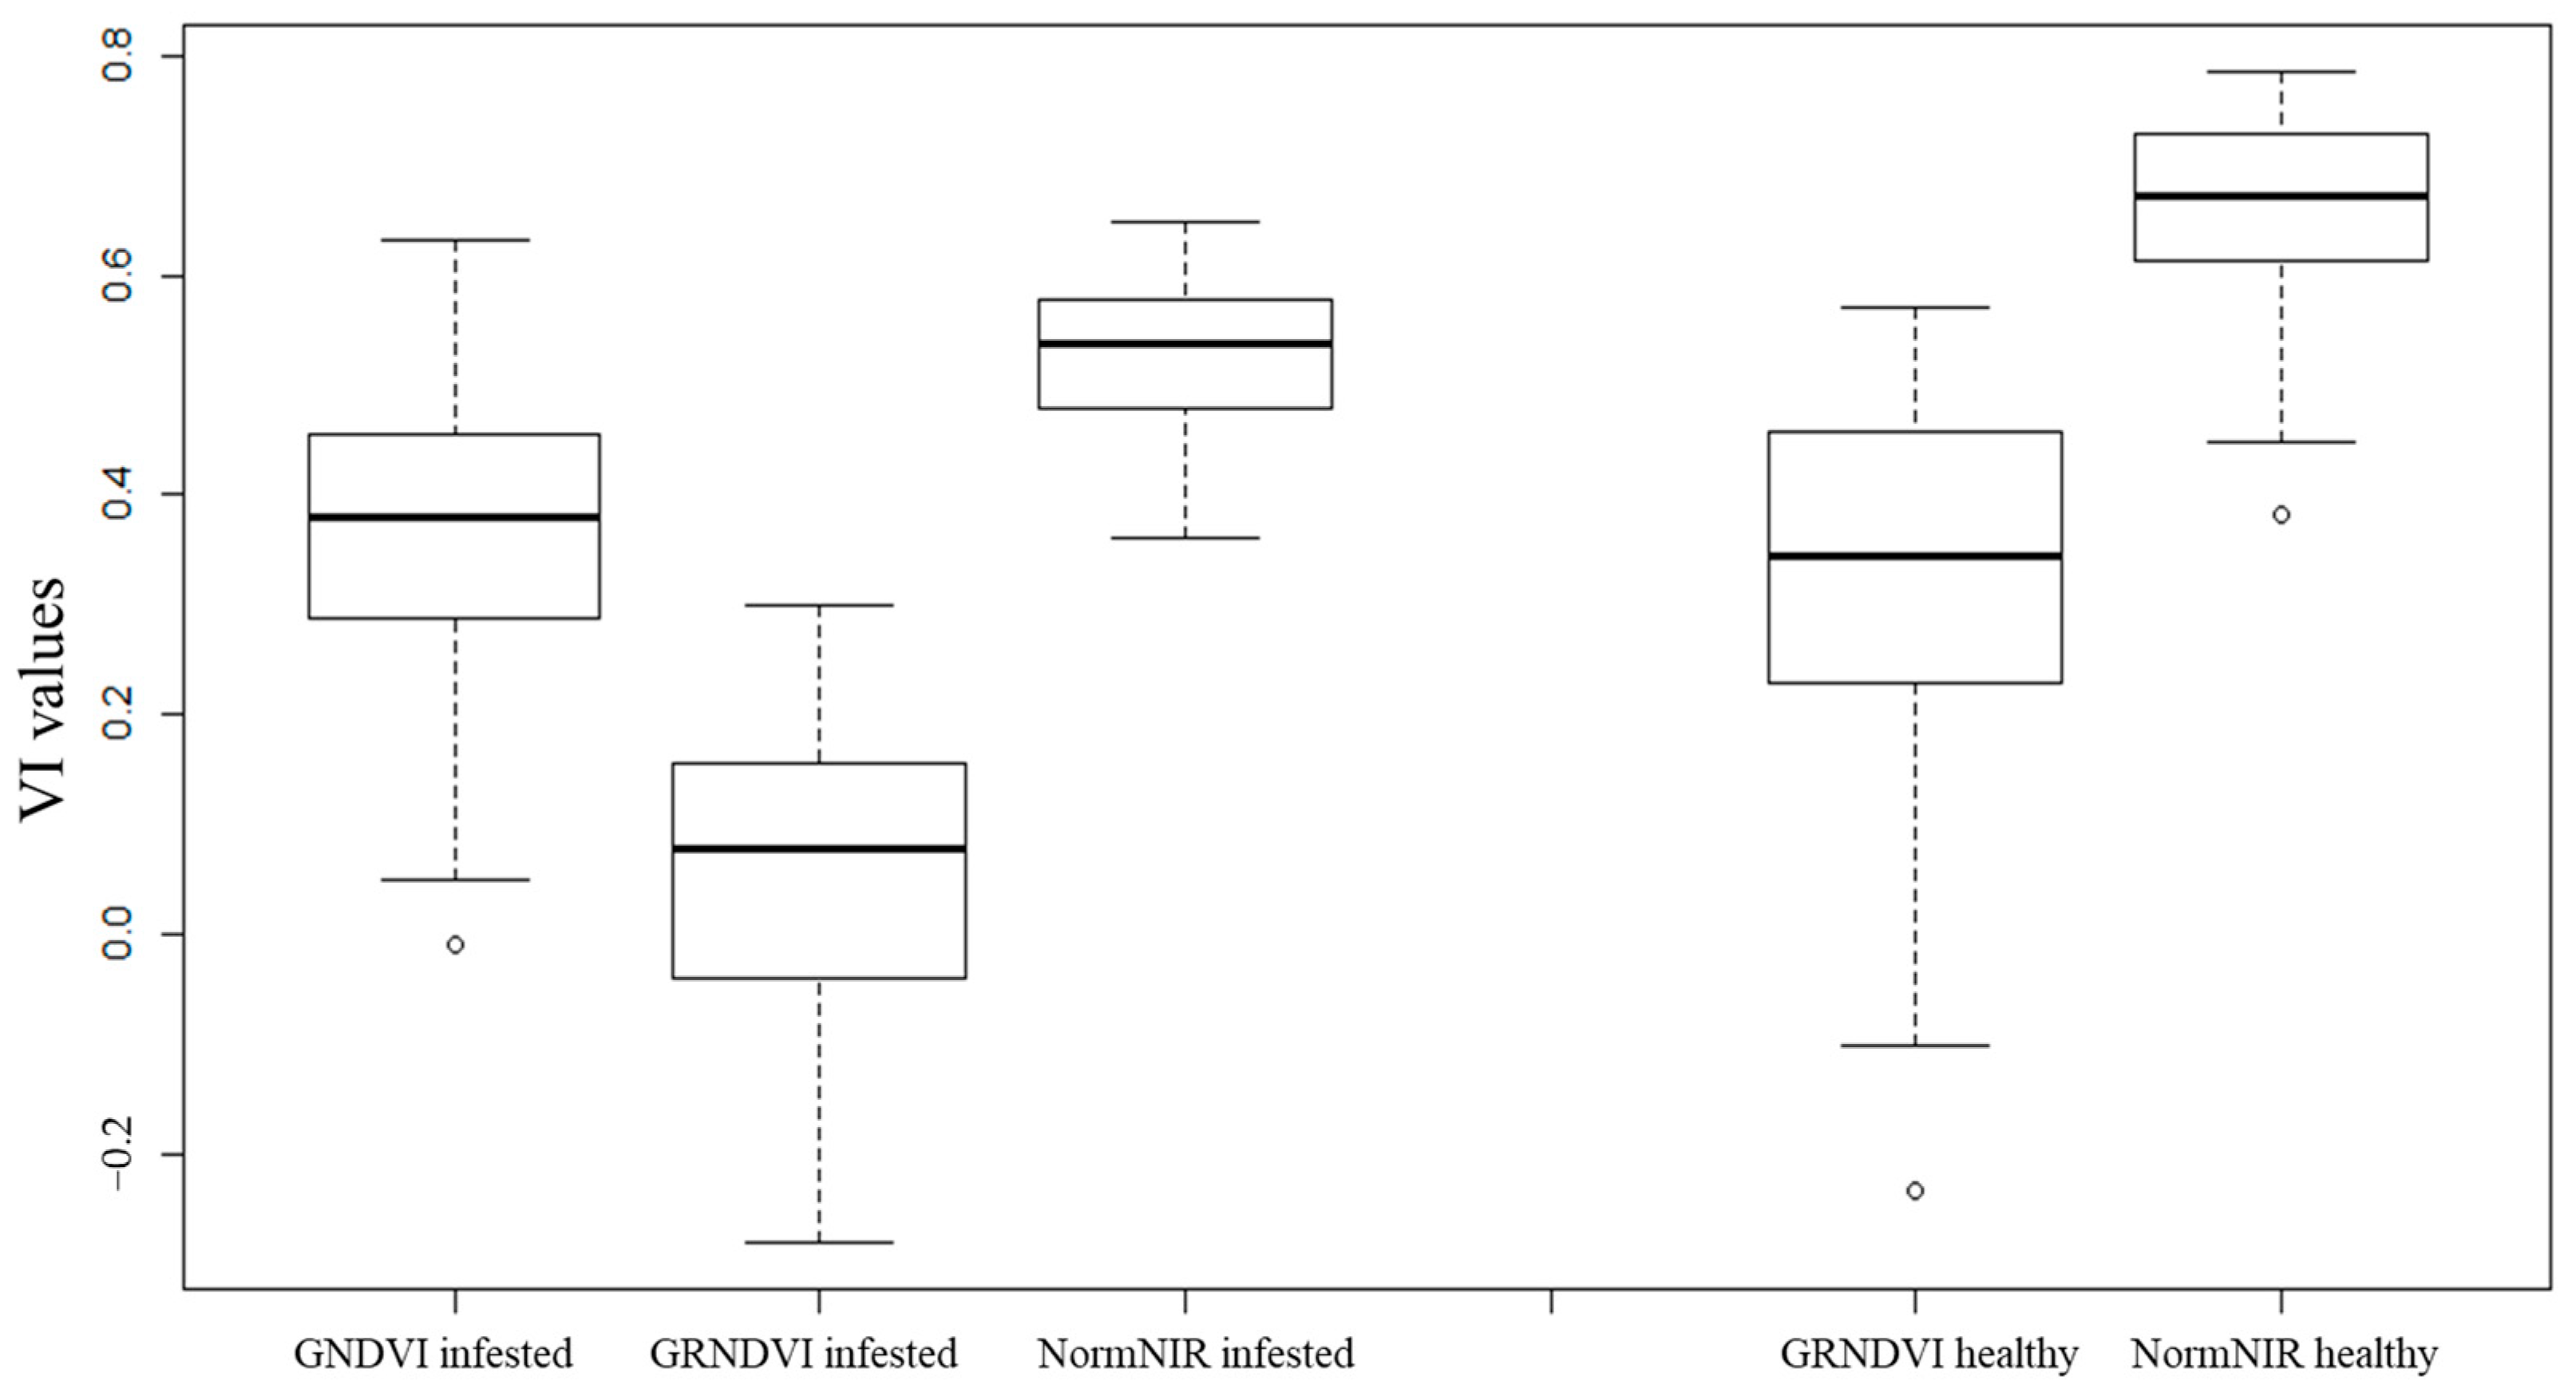
| VI | State of the Leaf | n | Average | SD | Min | Max | W | p-Value |
|---|---|---|---|---|---|---|---|---|
| NDVI | Infested | 41 | 0.41 | 0.15 | −0.04 | 0.64 | 0.90 | 0.00 |
| Healthy | 50 | 0.64 | 0.15 | −0.01 | 0.79 | 0.89 | 0.00 | |
| GNDVI | Infested | 41 | 0.37 | 0.15 | −0.01 | 0.63 | 0.97 | 0.27 |
| Healthy | 50 | 0.55 | 0.16 | 0.17 | 0.77 | 0.97 | 0.05 | |
| NormNIR | Infested | 41 | 0.53 | 0.07 | 0.36 | 0.65 | 0.96 | 0.20 |
| Healthy | 50 | 0.66 | 0.08 | 0.38 | 0.79 | 0.98 | 0.17 | |
| GRNDVI | Infested | 41 | 0.06 | 0.15 | −0.28 | 0.3 | 0.96 | 0.20 |
| Healthy | 50 | 0.32 | 0.17 | −0.23 | 0.57 | 0.98 | 0.17 |
Publisher’s Note: MDPI stays neutral with regard to jurisdictional claims in published maps and institutional affiliations. |
© 2022 by the authors. Licensee MDPI, Basel, Switzerland. This article is an open access article distributed under the terms and conditions of the Creative Commons Attribution (CC BY) license (https://creativecommons.org/licenses/by/4.0/).
Share and Cite
Santos, L.M.d.; Ferraz, G.A.e.S.; Marin, D.B.; Carvalho, M.A.d.F.; Dias, J.E.L.; Alecrim, A.d.O.; Silva, M.d.L.O.e. Vegetation Indices Applied to Suborbital Multispectral Images of Healthy Coffee and Coffee Infested with Coffee Leaf Miner. AgriEngineering 2022, 4, 311-319. https://doi.org/10.3390/agriengineering4010021
Santos LMd, Ferraz GAeS, Marin DB, Carvalho MAdF, Dias JEL, Alecrim AdO, Silva MdLOe. Vegetation Indices Applied to Suborbital Multispectral Images of Healthy Coffee and Coffee Infested with Coffee Leaf Miner. AgriEngineering. 2022; 4(1):311-319. https://doi.org/10.3390/agriengineering4010021
Chicago/Turabian StyleSantos, Luana Mendes dos, Gabriel Araújo e Silva Ferraz, Diego Bedin Marin, Milene Alves de Figueiredo Carvalho, Jessica Ellen Lima Dias, Ademilson de Oliveira Alecrim, and Mirian de Lourdes Oliveira e Silva. 2022. "Vegetation Indices Applied to Suborbital Multispectral Images of Healthy Coffee and Coffee Infested with Coffee Leaf Miner" AgriEngineering 4, no. 1: 311-319. https://doi.org/10.3390/agriengineering4010021
APA StyleSantos, L. M. d., Ferraz, G. A. e. S., Marin, D. B., Carvalho, M. A. d. F., Dias, J. E. L., Alecrim, A. d. O., & Silva, M. d. L. O. e. (2022). Vegetation Indices Applied to Suborbital Multispectral Images of Healthy Coffee and Coffee Infested with Coffee Leaf Miner. AgriEngineering, 4(1), 311-319. https://doi.org/10.3390/agriengineering4010021