Article

Automated Detection of Sudden Cardiac Death by Discrete Wavelet Transform of Electrocardiogram Signal

College of Information and Network Engineering, Anhui Science and Technology University, Chuzhou 233100, China
*
Author to whom correspondence should be addressed.
Symmetry 2022, 14(3), 571; https://doi.org/10.3390/sym14030571
Submission received: 30 December 2021 / Revised: 11 March 2022 / Accepted: 12 March 2022 / Published: 14 March 2022
(This article belongs to the Special Issue Biological Network and Its Symmetric Applications in Biomedicine)

Abstract

:
Sudden cardiac death (SCD) results in millions of deaths annually; as it is a fatal heart abnormality, early prediction of SCD could save peoples’ lives to the greatest extent. Symmetry and asymmetry play an important role in many fields. Electrocardiograms (ECG) as a noninvasive process for acquiring the electrical activity of the heart, has both asymmetric and non-stationary characteristics; it is frequently employed to diagnose and evaluate the heart’s condition. In this work, we have detected SCD 14 min (separately for each one-minute interval) prior to its occurrence by analyzing ECG signals using discrete wavelet transform (DWT) and locality preserving projection (LPP). In the experiment, we have performed DWT on ECG signals to obtain coefficients, then LPP as a reduction methodology was used to cut down these obtained coefficients. Then, the acquired LPP features were ranked using various methods, including the T-test, Bhattacharyya, Wilcoxon, and entropy. At last, the highly ranked LPP features were subjected to decision tree, k-nearest neighbor (KNN), and support vector machine classifiers for distinguishing normal from SCD ECG signals. Our proposed technique has achieved a highest accuracy of 97.6% for the detection of SCD 14 min prior using the KNN classifier, compared to the existing works. Our proposed method is capable of predicting the people at risk of developing SCD 14 min before its onset, and, hence, clinicians would have enough time to provide treatment in intensive care units (ICU) for a subject at risk of SCD. Thus, this proposed technique as a useful tool can increase the survival rate of many cardiac patients.

1. Introduction

Sudden cardiac death (SCD) describes an unanticipated sudden death of a person who had or not had primary cardiovascular abnormalities, and known or even unknown history of cardiac diseases [1]. A number of 250,000 to 300,000 US lives per year have died from SCD [2]. For the past two decades, despite declines in death caused by cardiac disease [3], about 20% of all unexpected and sudden deaths are still reported to happen from SCD, most commonly resulted from asystole or ventricular fibrillation (VF) [4]; VF can result in the heart’s failure to effectively pump blood and hence can lead to death within a few minutes [5]. There are only 1–2% of out-of-hospital heart disease patients that survive when SCD happens, as most of subjects at the risk of SCD cannot receive timely care [6]. Therefore, early identification of an unanticipated SCD risk in a subject experiencing VF is very important for timely treatment and reducing mortality.
Ordinarily, symmetry represents a correspondence or balance between different parts of an object [3]. Symmetry and asymmetry are the fundamental aspects of life [7]. Electrocardiogram (ECG) signals demonstrate the cardiac electrical activity, and the morphology of the ECG signal varies with respect to time [8], it contains substantial vital information about the human body. The asymmetry of ECG signals is extremely significant to capture alarming features for the early identification of SCD. The morphological variations of the ECG signal are found when the heart undergoes episode of ischemia or arrhythmias [9]. Researchers worldwide have captured the subtle variation residing in the ECG signal to discern the unique characteristics which can early predict the risk of SCD occurrence. QT interval and heart rate variability (HRV) extracted from the ECG signal are proven to be an independent risk indicator to identify SCD caused by cardiac arrest [10]. However, it is time consuming and tedious to manually examine and identify these minute morphological variations in long continuous ECG signals, and this process is easy to result in errors because of fatigue. Therefore, an automated diagnostic technique for predicting SCD early is indispensable; it can overcome these shortcomings of manual estimation of ECG signals.
Three major methodologies, including classical linear, time-frequency (TF), and nonlinear methodologies, have been frequently used to analyze ECG or HRV signals. Mean of standard deviation (SD) and SD of the mean sinus R-R intervals as a time domain feature of the classical linear features, computed from HRV signals in normal groups, was higher than those in people at risk of SCD [11]. Various frequency domain features, such as low frequency, high frequency, and very low frequency, obtained from the analysis of HRV signals using the fast Fourier transformation method, were used to identify SCD [6]. Smoothed pseudo Wigner-Ville distribution and Wigner-Ville transform were subjected to the HRV signals to acquire the time-frequency features for SCD detection [2,12]. Additionally, the nonlinear methods such as symbolic dynamic [13], Fractal dimension, correlation dimension, approximate entropy, sample entropy, and so on, were employed to quantify complexities residing in ECG or HRV signals due to the nonlinear, non-stationary, and asymmetrical characteristics of these signals [14].
Automated diagnostic techniques for the early prediction of SCD using ECG or HRV signals have been put forward and are summarized in Table 1; it can be seen from the literature review (Table 1) that most researchers employed the HRV signals with a 1 min interval of a prediction time resolution, and linear (time, frequency domain), TF domain, and nonlinear methods including poincaré plot, detrended fluctuation analysis, sample entropy (SamEn), approximate entropy (ApEn), etc., were used for the analysis of HRV, but the recommended duration of HRV for the frequency domain and nonlinear (SamEn, ApEn, etc.) methods is 5 min; employing more short-term intervals (1 min interval) can cause unreliability of the frequency domain method and the undefined values of the classical entropy algorithm (SamEn, ApEn, etc.) [15], thereby resulting in the instability of these automated diagnostic techniques.
Therefore, we proposed an automated diagnostic technique using ECG beats with 651 data points for automated identification of subjects at risk of SCD one to fourteen minutes before its occurrence. Figure 1 shows the block diagram of the proposed method. Initially, discrete wavelet transform (DWT) is performed on normal and SCD ECG beats to obtain coefficients. The locality preserving projection (LPP) reduction method is then applied to the coefficients obtained from DWT, to extract the LPP features with significant information. Later, the reduced LPP features are ranked using various methods, including the T-test, Bhattacharyya, Wilcoxon, and entropy. Finally, the ranked LPP features are subjected to decision tree (DT), k-nearest neighbor (KNN), and support vector machine (SVM) classifiers for classification of SCD risk and normal groups. The proposed system yielded a highest accuracy of 97.6% for predicting if the person is susceptible to SCD or not 14 min earlier, using only five LPP features.

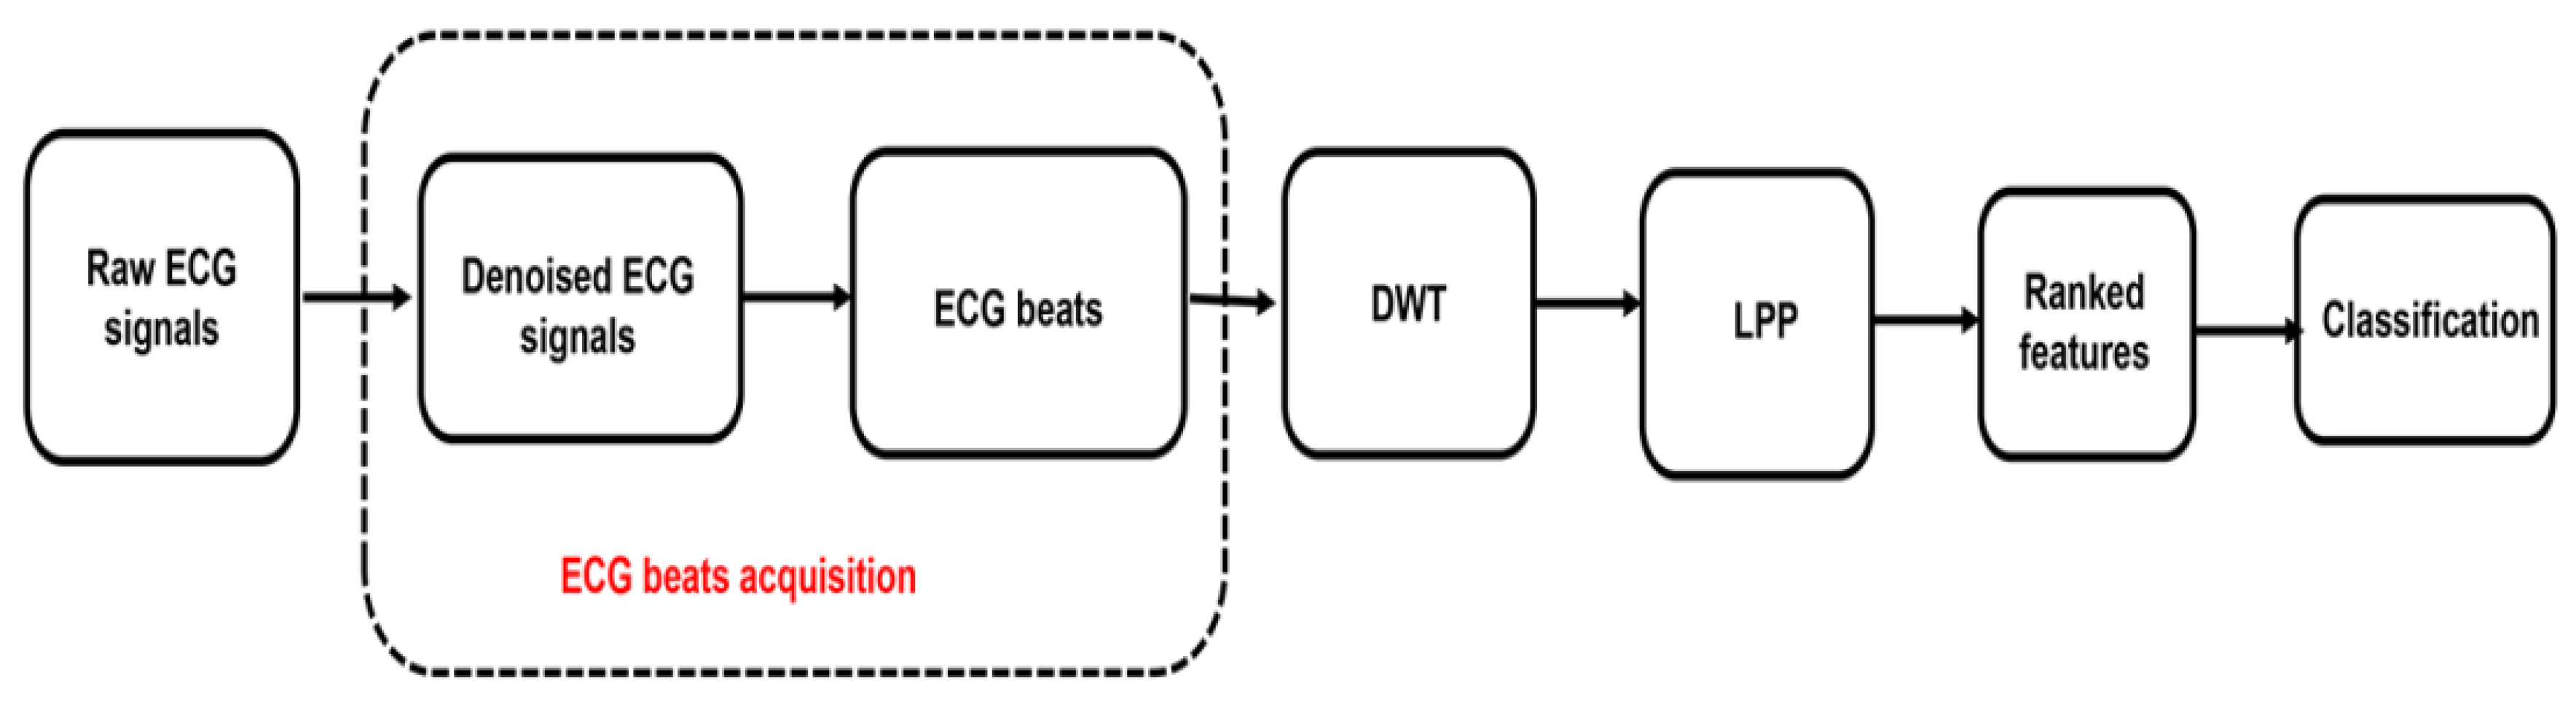
2. Materials and Methods

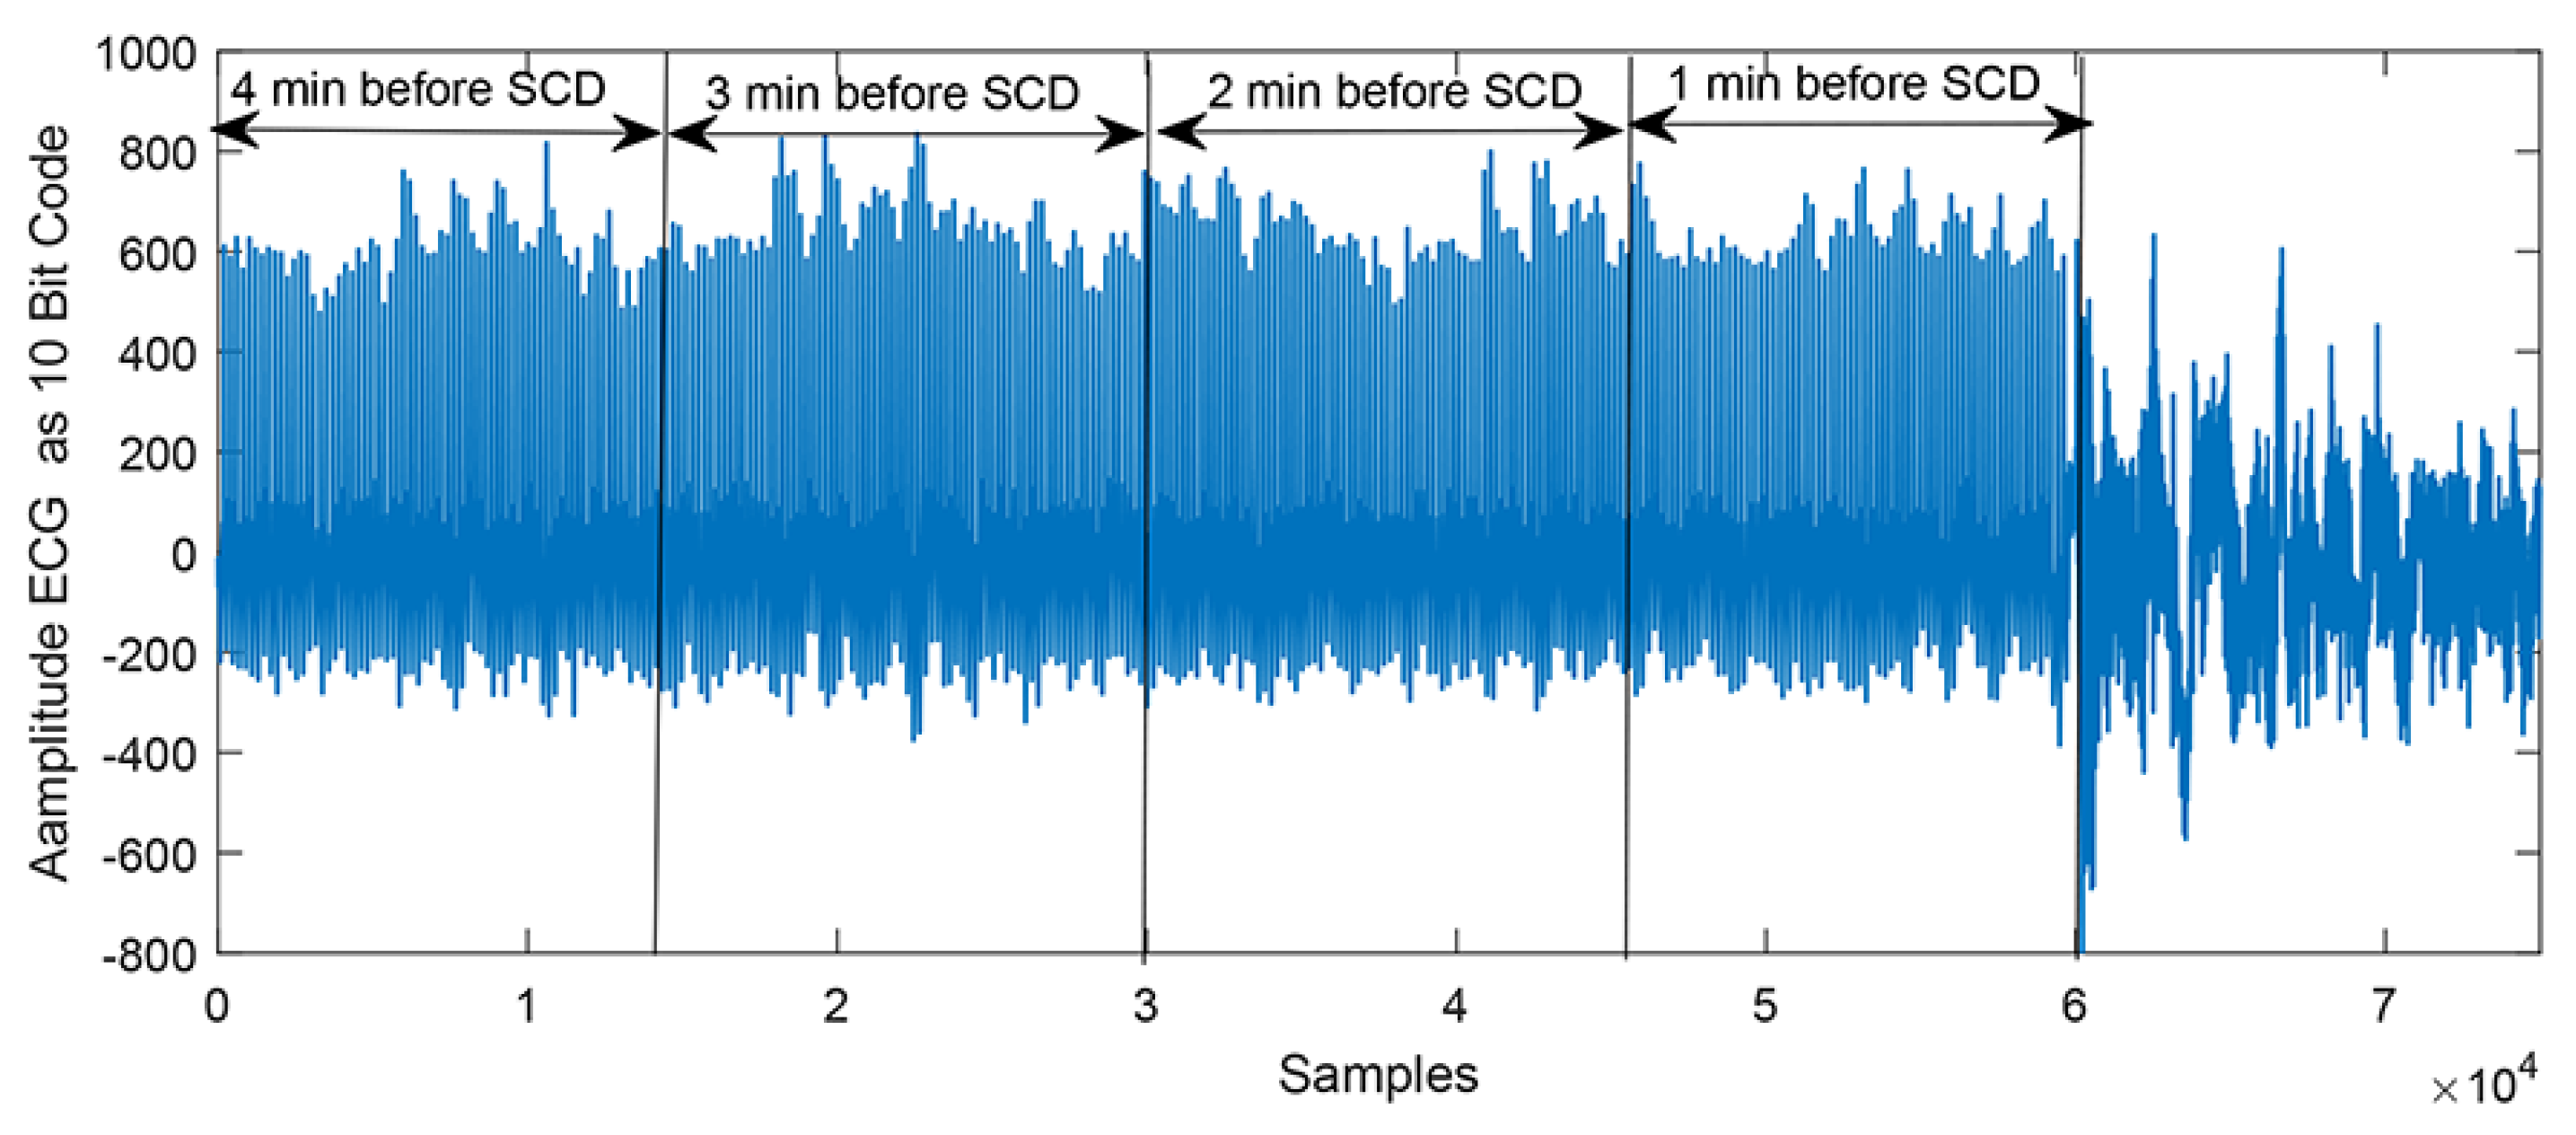
2.1. Data Acquisition

The SCD and normal ECG signal data used for our experiment were downloaded from two open access databases, namely the MIT/BIH SCD and PhysioBank MIT-BIH Normal Sinus Rhythm (NSR) databases [22]. The SCD database contains 23 patients, including 8 females, 13 males and 2 of unknown sex (age: 18–89). Among the 23 SCD patients, 18 patients had underlying sinus rhythm, 1 was continuously paced, and 4 had atrial fibrillation. Most of these patients had an actual cardiac arrest, and all patients had a sustained ventricular tachyarrhythmia. Moreover, only 20 subjects were employed for further analysis in the current study, due to the ECG signals of the other 3 SCD patients did not exhibit any VF episodes. The normal database contains 18 subjects, including 13 females (age: 20–50) and 5 males (age: 26–45). Each SCD record contains leads Ⅱ and Ⅲ, and each normal record contains leads Ⅰ and Ⅱ ECG signals. Therefore, a total of 36 ECG records obtained from the MIT-BIH NSR database and 40 SCD ECG records obtained from the MIT/BIH SCD database were used.

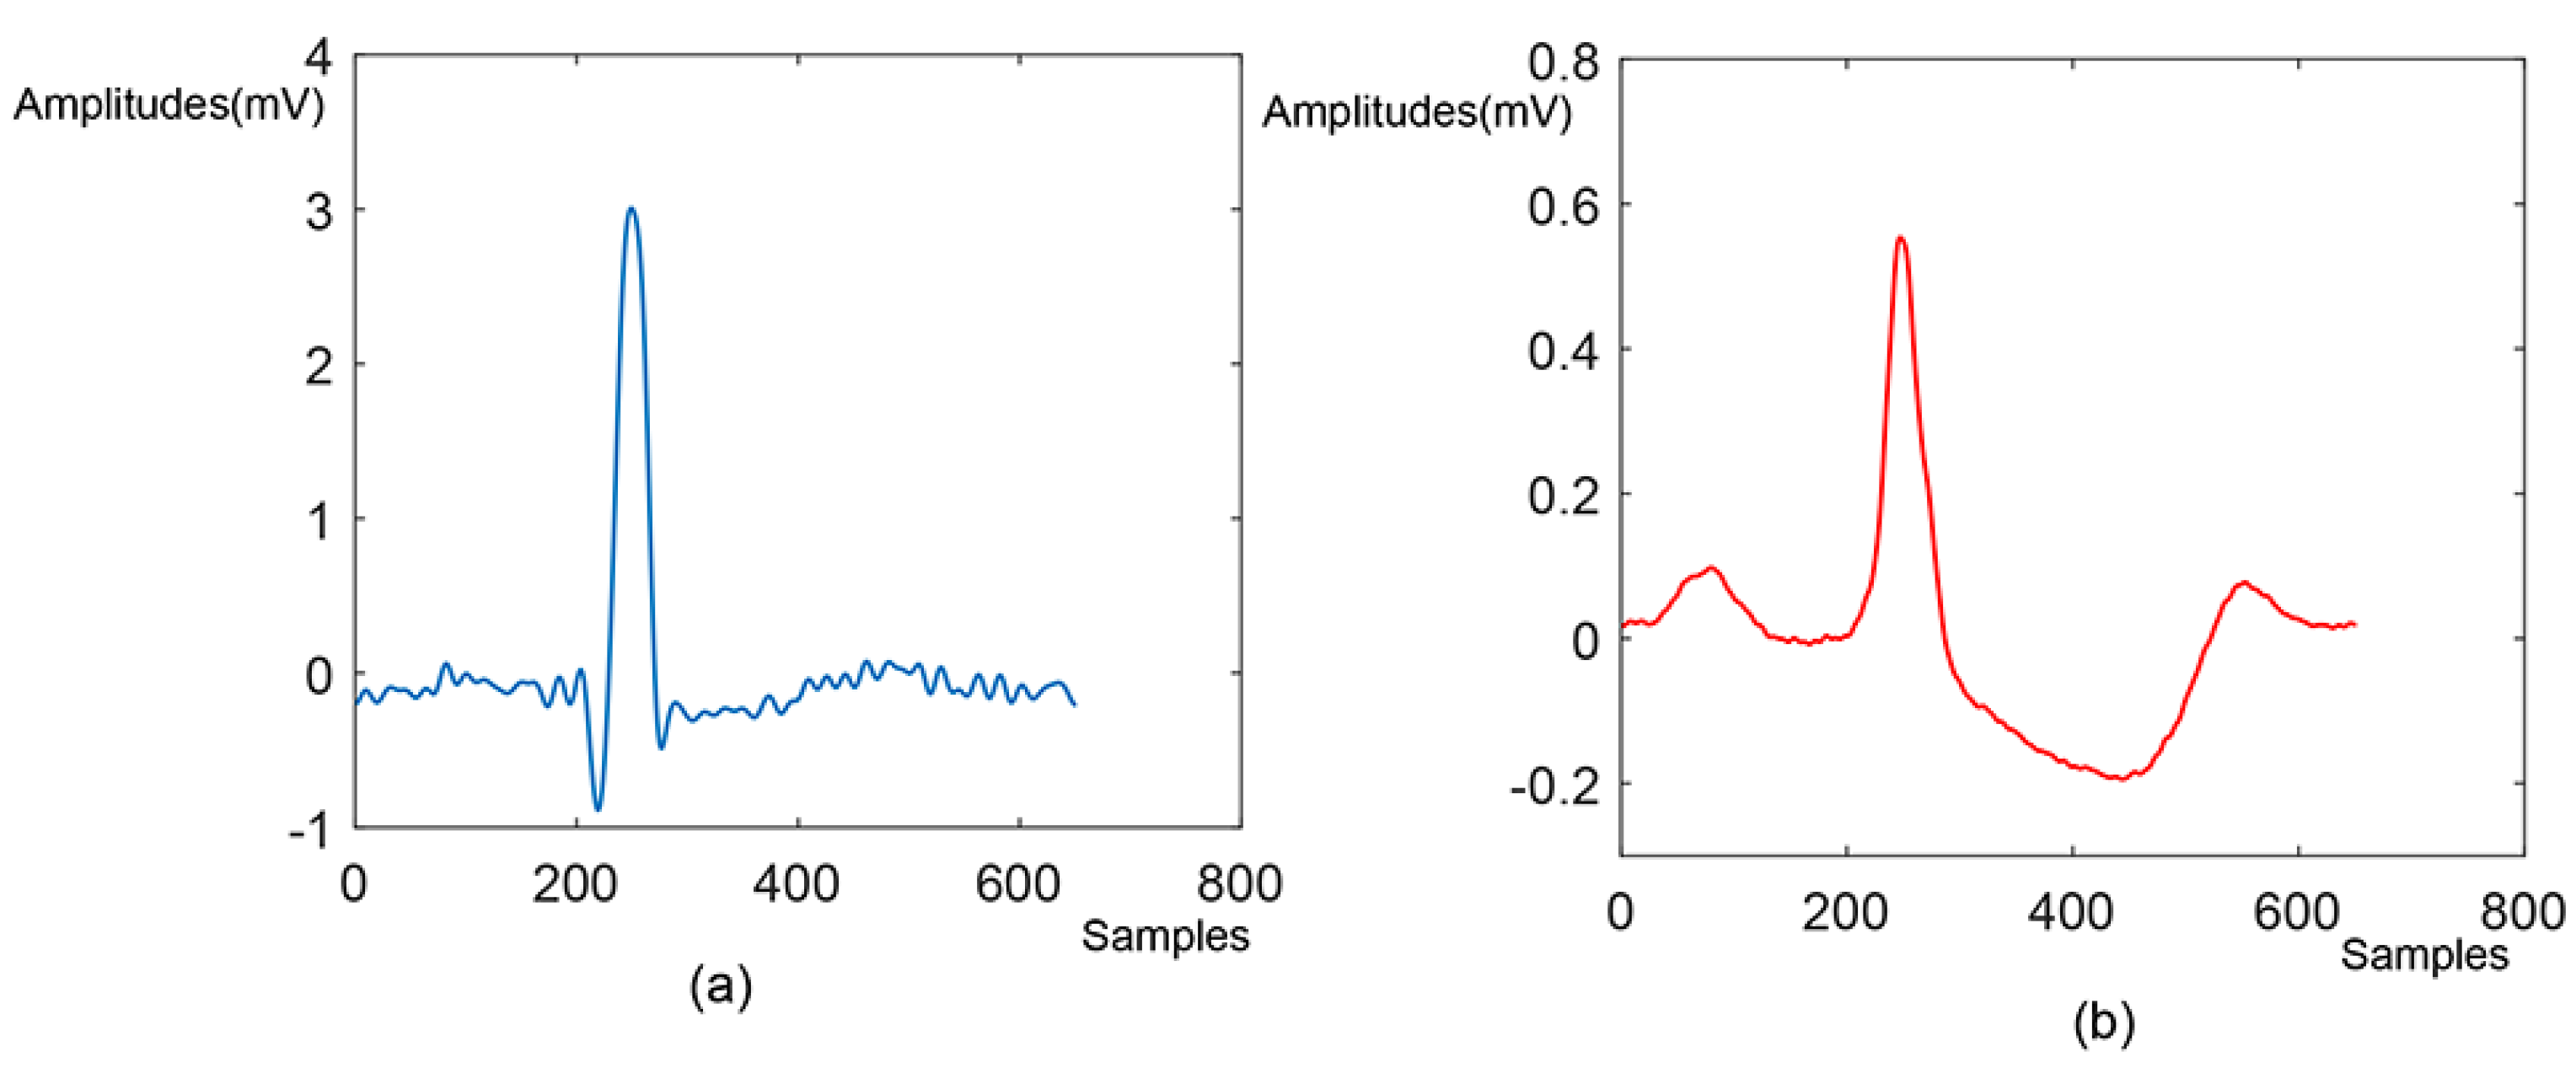
2.2. Pre-Processing and Beats Segmentation

For 24 h of ECG records of the SCD subjects, only the ECG records 14 min prior to VF onset were utilized, for simulating 14 min before SCD occurrence. As for the normal subjects, 14 min of the ECG records were selected arbitrarily. The ECG records from the two databases were sampled at 250 Hz for SCD and 128 Hz for normal classes [22]. The ECG records of the two databases were sampled up to 1000 Hz using the cubic interpolation method, for the purpose of maintaining uniformity between the two databases. Because there are various noises, such as power line interference (>50 Hz) and baseline wander (<0.5 HZ) in the ECG records, DWT with Daubechies wavelet 6 (db6) was performed on the ECG records with the ECG records decomposed to 11 levels, in order to denoise the noises [9]. The highest-level approximation coefficients and the first three detail coefficients were set to zero, and the inverse wavelet transform was calculated from the fourth to the eleventh level detail sub-bands to acquire the denoised ECG records.
These 14 min ECG segments were uniformly divided into five 1 min intervals (i.e., the 1st 1 min, 2nd 1 min, 3rd 1 min, 4th 1 min, etc.); the 1st 1 min prior to SCD onset was referred to as the first 1 min interval, the 2nd 1-min prior to SCD onset was referred to as the second 1 min interval, and so on. Figure 2 displays a typical SCD ECG signal 1 to 4 min intervals before its onset.
Additionally, the Pan-Tompkins method was performed on the preprocessed 1 min ECG intervals in order to detect R-peak for the ECG beat segmentation [23]. The R-peak was selected as the unusual point due to its high amplitude. In this experiment, all the 1 min ECG intervals were segmented into the ECG beats, using the selected R-peaks, without including the first and last beats. Numbers of 250 and 400 samples before and after the R-peak were taken to perform the segmentation of ECG beats. The overview of the number of ECG beats used in each group and case is demonstrated in Table 2. Figure 3 shows the SCD and normal beats segmented from the continuous ECG intervals.

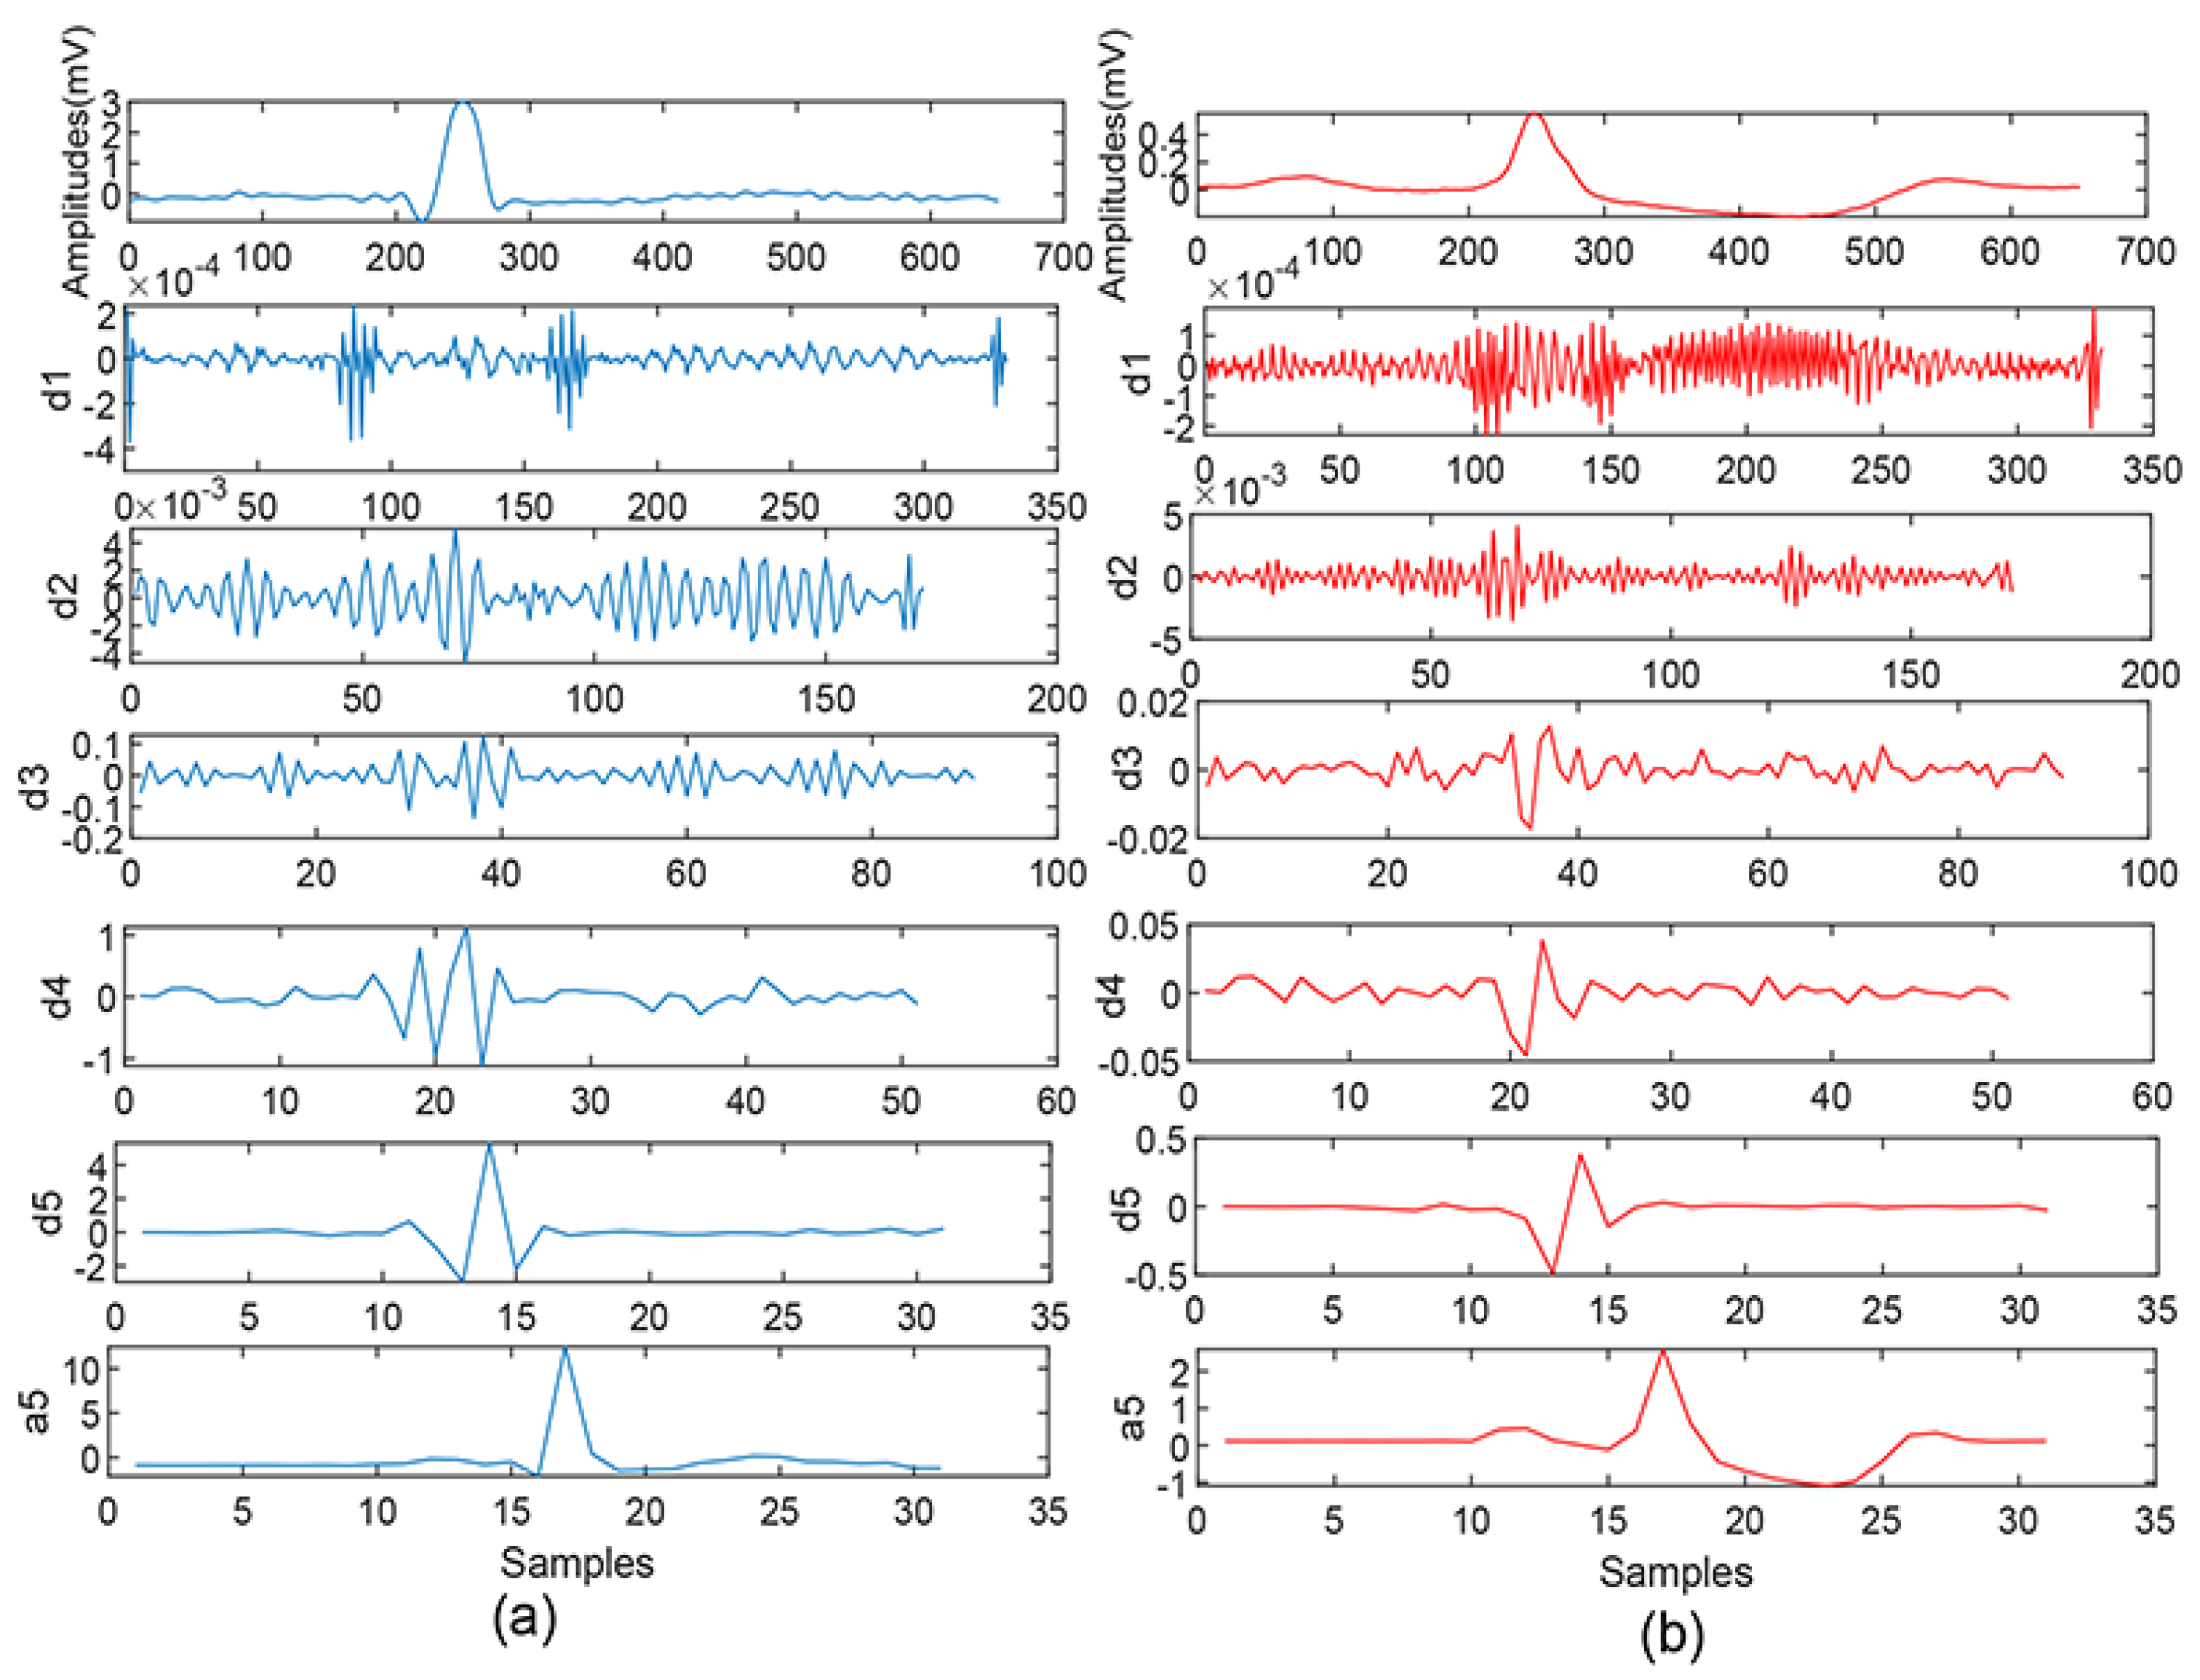
2.3. Feature Extraction-Discrete Wavelet Transformation

Wavelet transformation is a signal processing technique, employing mathematical models to uncover the characteristic of the analyzed signal [24]. The assumption of this technique is that the analyzed signal consists of a set of analogously small functions, namely ‘mother wavelet’, composed of shifting and scaling. Detailed explanation of the discrete wavelet transformation method is stated below.
ψ a , b ( t ) = 1 a ψ ( t b a )
where ψ ( t ) is function of mother wavelet, t is the time, a and b are the scale and shifting parameters, respectively. The discrete wavelet transforms (DWT) are obtained by the scale and shifting position of mother wavelet and can be computed using
D W T ( m , n ) = 1 a 0 m k f ( k ) ψ [ n k b 0 a 0 m a 0 m ]
where m and k are the coefficients of the scaling and shifting, n is number of points [24]. The Mallat algorithm was proposed in 1988 and uses a filter to perform DWT; it is an effective method. The low-pass and high-pass filters adopted in the Mallat algorithm filter out the high-frequency and low-frequency components of a signal analyzed, respectively, in order to acquire the detail (high-frequency) and the approximation (low-frequency) coefficients; the detail and approximation coefficients obtained from the wavelet decomposition procedure are denoted by a i and d i , where i represents the level of the decomposition. Figure 4 shows a five-level decomposition of DWT for the ECG beats, extracted from normal and patients at the risk of SCD, respectively. Therefore, each SCD ECG and normal beat obtained from the four cases were subjected to five levels of DWT with Daubechies 6 (db6) mother wavelet to obtain their coefficients, respectively. A total of 31 detail coefficients at the fifth level from each ECG beat were extracted for feature extraction [25]. The acquired subband coefficients were connected with the kind of wavelet basis, so DWT with Daubechies (orders 1–5), Coiflets (orders 1–3), and Harr wavelet functions with 5-level decomposition were also were explored for a better classification accuracy on SCD prediction.

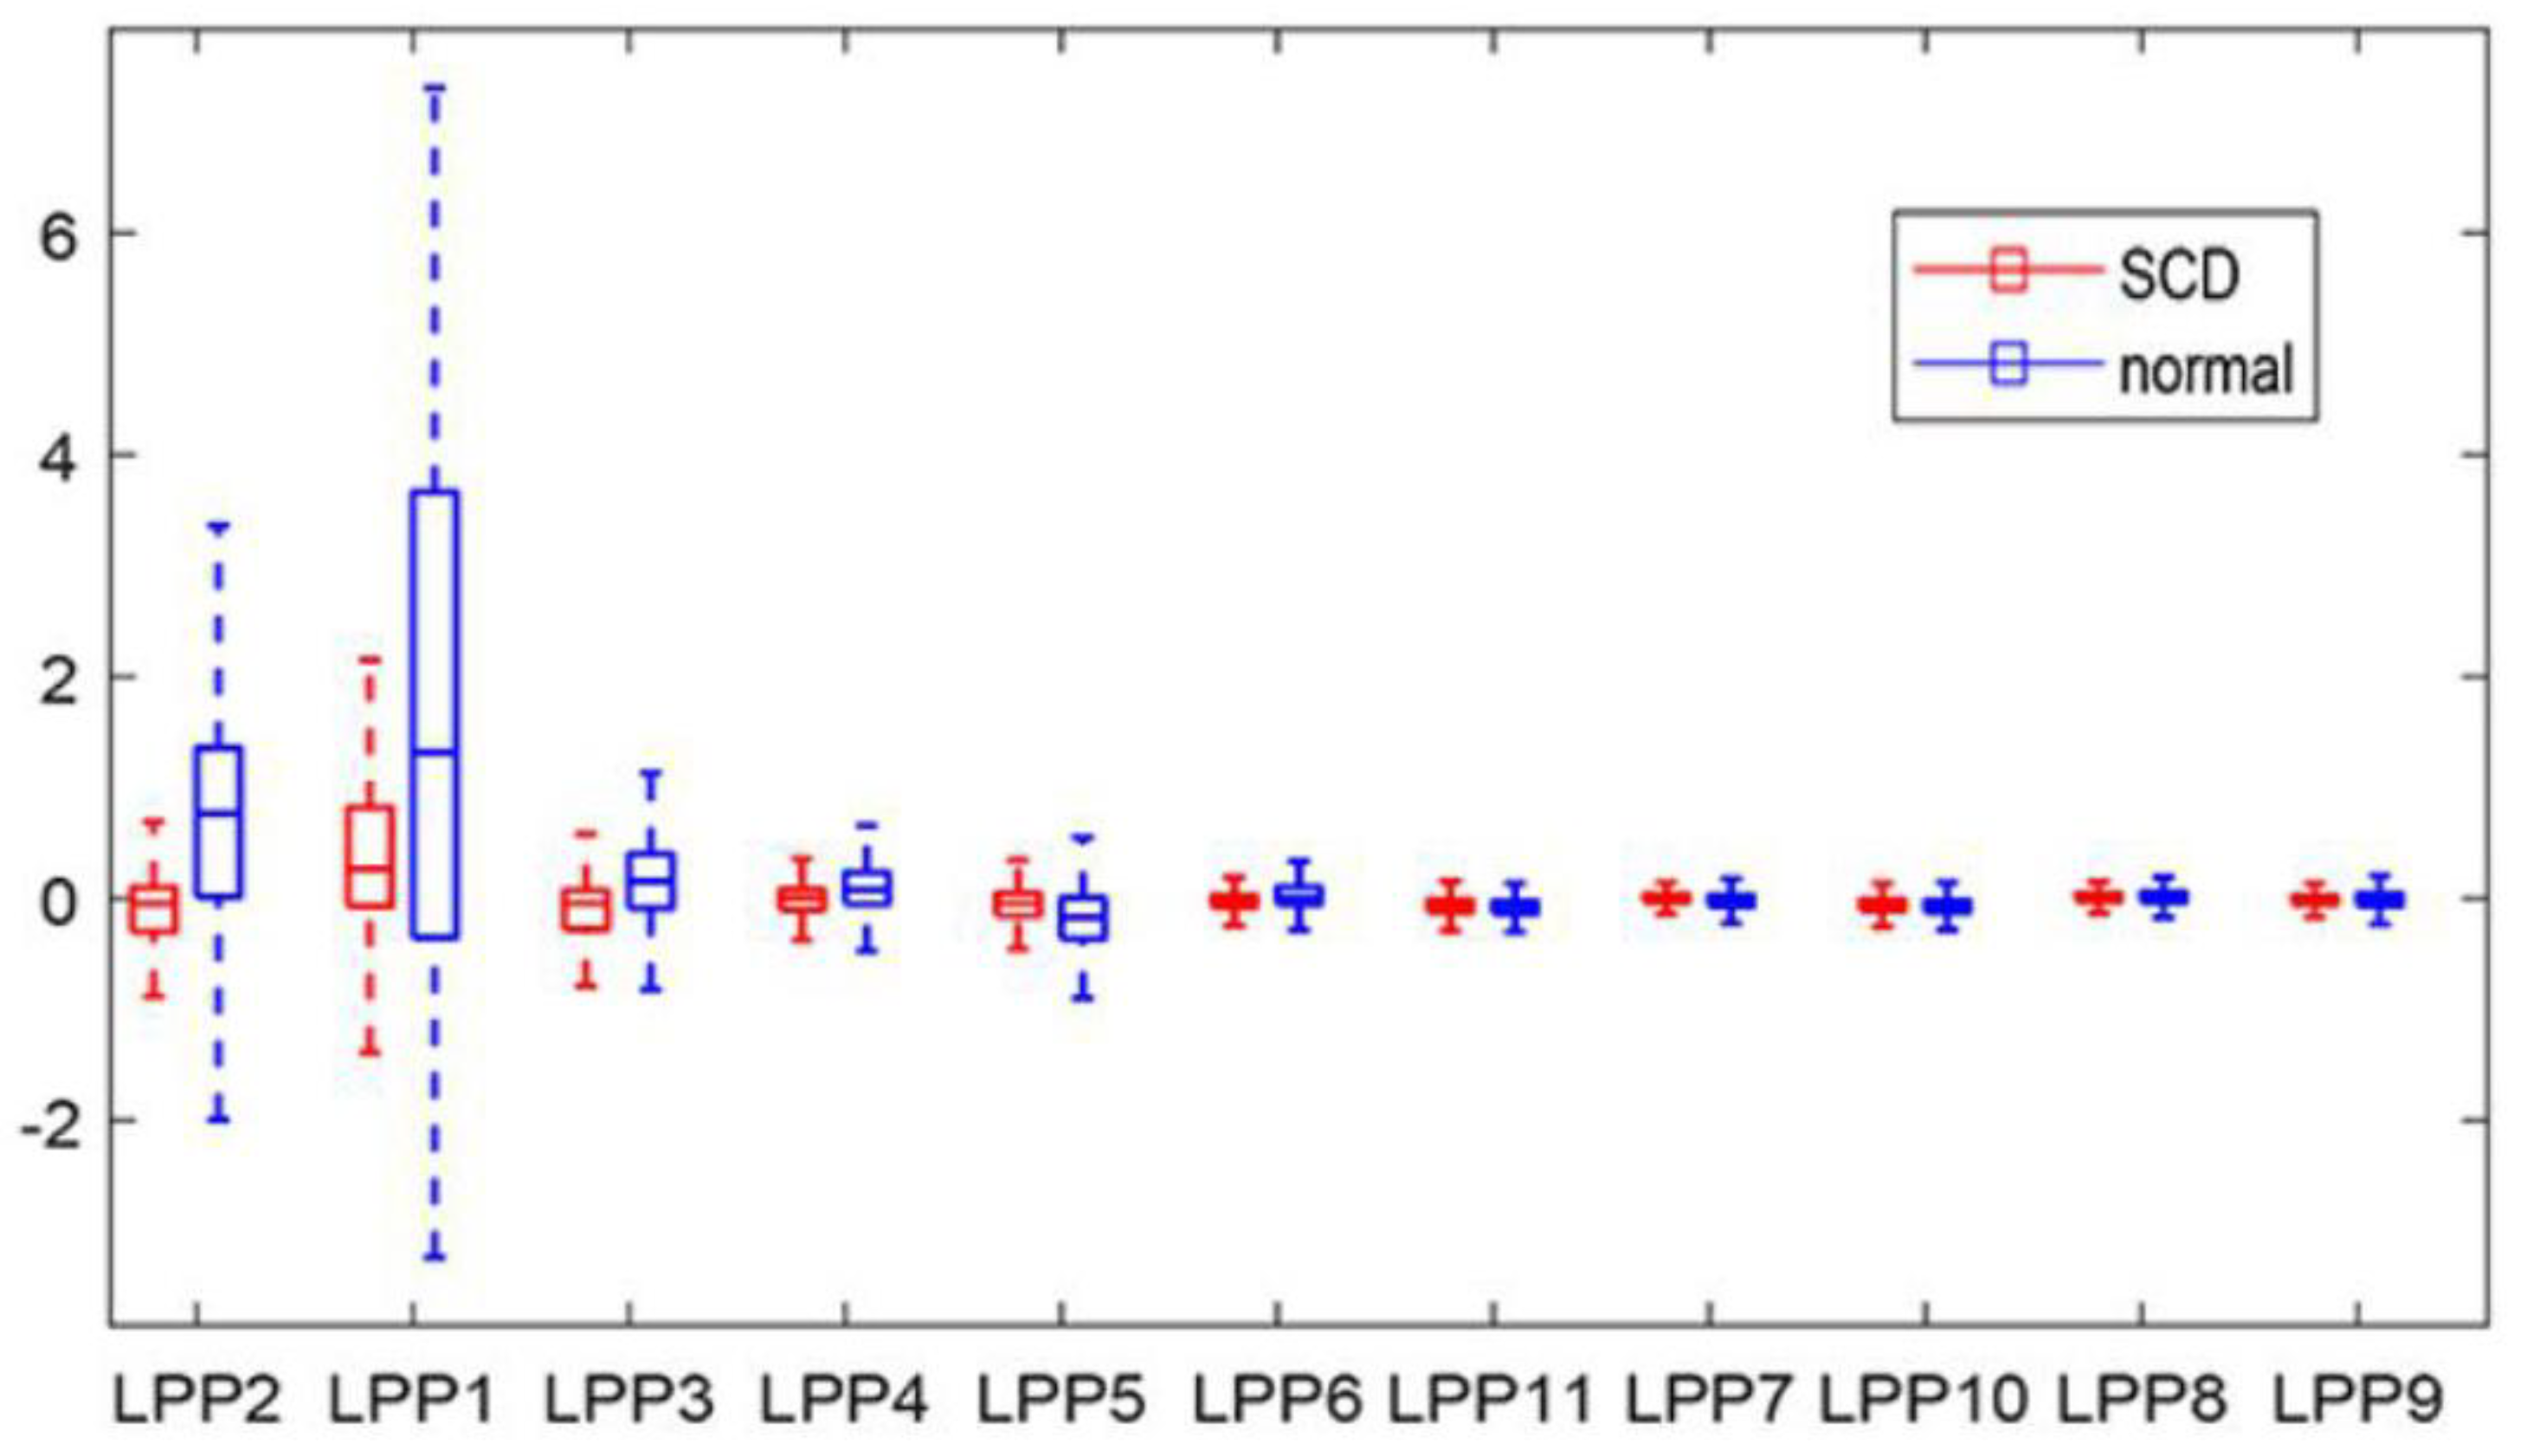
2.4. Features Reduction—Locality Preserving Projections (LPP)

LPP is a dimensionality reduction methodology. It constructs an adjacency map using data maps, the data points analyzed are mapped to the subspace in order to acquire the transformation matrix, employing the Laplace transform of the graph, which attains the goal of reducing dimensions [26]. The data set X = { x 1 , x 2 , , x n } with high-dimensional space R n is mapped to the data set Y = { y 1 , y 2 , , y n } with low-dimensional space R m ( m < < n ) , after the transformation matrix W
y i = W T x i ,   i = 1 , 2 , , k
as x i is the k nearest neighbor of x j , similarity matrix S i j is computed by S i j = e x i x j 2 t , otherwise S i j = 0. The LPP can be obtained by working out the minimum problem:
o p t = arg   min   α T X L X T α
where   α T X D X T α = 1 , D i i is the diagonal weight matrix and its element is calculated by the summation of the row element of S i j , the Laplacian matrix L is computed by D i i S i j . Transformation matrix W is the following formula:
min ( i , j ( W T x i W T x j ) 2 S i j )
Furthermore, it can be used to solve the eigenvalue problem
X L X T W = λ X D X T W
where λ is the eigenvalue [26].
The feature extraction procedure generally causes high-dimensional features, and thus results in many difficulties to machine learning tasks; LPP as the dimensionality reduction methodology was used in this paper, aiming to find few low-dimensional features that are representative for the high-dimensional features. It can effectively improve learning speed and save memory space [27].

2.5. Feature Ranking
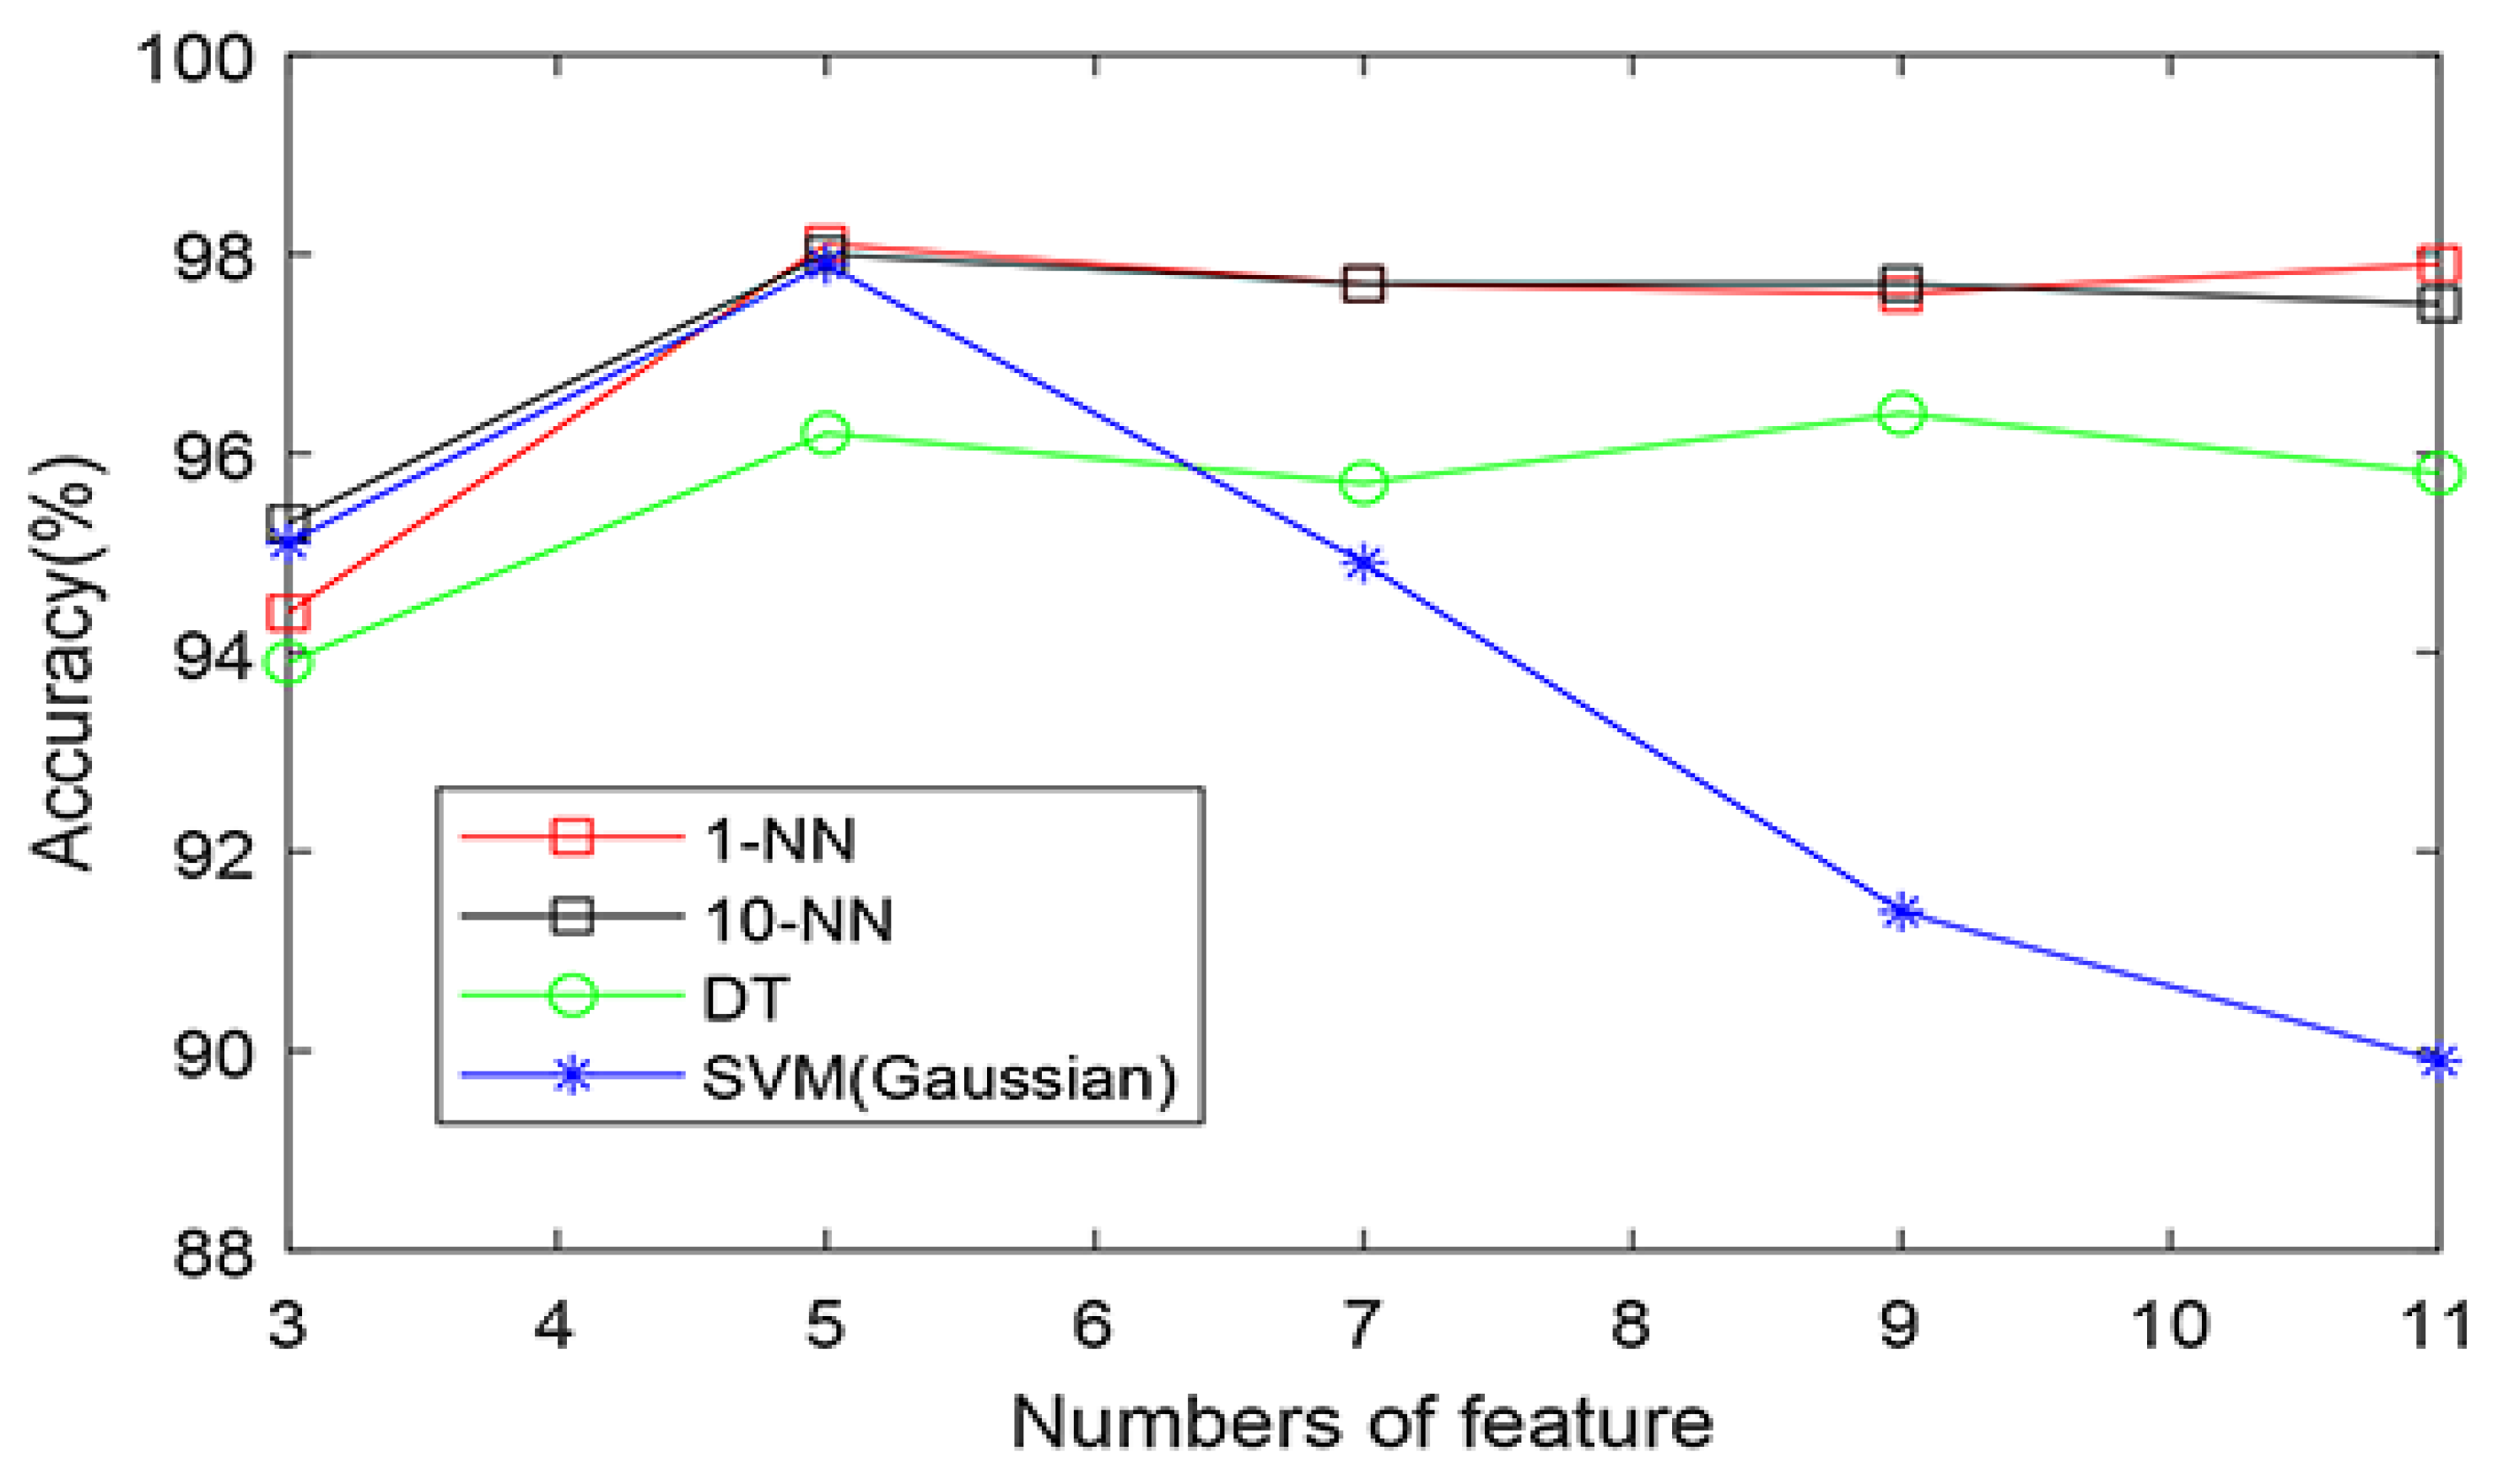
Not all LPP features obtained from the feature reduction procedure have important information to effectively discriminate the patients with SCD from unaffected people. In current work, we used the T-test to rank the LPP features obtained, in order to reserve features with important clinical information. The T-test algorithm can determine whether the LPP features obtained have statistical significance, and the features are ranked according to their p-values, generated by the T-test algorithm; the p-value less than 0.05 is considered as statistically significant and lower p-values demonstrate better ranking. Additionally, the other three ranking methods such as Bhattacharyya, Wilcoxon, and entropy were explored for a better separability between the two groups [21].

2.6. Classification

The ranked LPP features were input to the classifiers one by one to acquire the classification accuracy with minimum number of features. In this work, KNN, SVM with Gaussian kernel function, and DT were used for the sake of exploring the best classifier to differentiate unaffected from SCD-affected ECG beats; two kinds of KNN (k = 1.10 denoted by 1-NN and 10-NN) were employed in current work. We adopted accuracy, specificity, and sensitivity for purpose of assessment of the classifiers. Furthermore, 10-fold cross-validation methodology was employed to assess the performance of the classifiers. These normal from SCD affected ECG beats in each case, were divided into ten parts, and each part had the same samples from the two groups. One part was employed for testing the classifier and the rest of the 9 parts were employed for training the classifier. The performance indicators such as accuracy, sensitivity, and specificity, based on the results of testing data, were then computed [21]. This process was repeated 10 times, utilizing a different testing data each time, and the average of performance indicators from all the 10 test results were computed

3. Results

In current work, a total of 83,701 ECG beats including 41,039 SCD and 42,662 normal, were segmented from normal and SCD groups. All ECG segments were obtained from 14 cases, such as (1) 2934 normal and 2975 SCD segments from normal and SCD 1 min before its onset, (2) 2938 normal and 2849 SCD segments from normal and SCD 2 min before its onset, (3) 3036 normal and 2925 SCD segments from normal and SCD 3 min before its onset, (4) 3021 normal and 3112 SCD segments from normal and SCD 4 min before its onset, (5) 3100 normal and 3013 SCD segments from normal and SCD 5 min before its onset, (6) 3052 normal and 2923 SCD segments from normal and SCD 6 min before its onset, (7) 3043 normal and 3001 SCD segments from normal and SCD 7 min before its onset, (8) 2961 normal and 3038 SCD segments from normal and SCD 8 min before its onset, (9) 3032 normal and 2908 SCD segments from normal and SCD 9 min before its onset, (10) 3135 normal and 2904 SCD segments from normal and SCD 10 min before its onset, (11) 3175 normal and 2907 SCD segments from normal and SCD 11 min before its onset, (12) 3147 normal and 2758 SCD segments from normal and SCD 12 min before its onset, (13) 3062 normal and 2865 SCD segments from normal and SCD 13 min before its onset, (14) 3026 normal and 2861 SCD segments from normal and SCD 14 min before its onset (Table 2).
Take the fourth case as an example; the five levels DWT with db6 wavelet basis was performed on each ECG beat to acquire 31 detailed coefficients on the fifth. Amounts of 31 × 3021 and 31 × 3112 DWT coefficients were obtained from the two groups. Furthermore, the LPP methodology was used to reduce the obtained DWT coefficients. Subsequently these LPP features were ranked by their p-values, acquired from the T-test, in descending order, and there exists significant differences for these ranked LPP features between the two classes, as shown in Figure 5. Table 3 tabulates the mean and standard deviation (SD) of LPP features computed from normal and SCD ECG beats 4 min before the SCD occurrence. Ranked LPP features were subjected to various classifiers, such as KNN(1-NN, 10-NN), SVM, and DT, one by one, to achieve the highest classification accuracy, and the classification results are shown in Table 4. Figure 6 illustrates the plot of accuracy (percentage) versus the number of LPP features employed for the classification of normal and SCD ECG beats. It is evident from Figure 6 that the 1-NN classifier achieves the highest accuracy of 98.5% using only seven LPP features, and outperforms other classifiers. In order to explore the influence of different wavelet basis, such as Daubechies (orders 1–6), Coiflets (orders 1–3), and Harr, various ranking methods were used, such as the T-test, Bhattacharyya, Wilcoxon, and entropy, for the best classification results. Table 5 and Table 6 summarize the performance of different wavelet basis and ranking methods, using the 1-NN classifier for the categorization of normal and 4 min before SCD ECG beats. Obviously, the highest classification accuracy was achieved using db6 wavelet basis and the T-test ranking method. Therefore, we adopted the db6 wavelet basis and T-test ranking method for the rest of the thirteen cases for SCD identification. Table 7 tabulates the confusion matrix for all 14 cases using the 1-NN classifier, with different numbers of the LPP features ranked by the T-test method. The technique proposed in this paper achieved an accuracy of 97.6% for 14 min prior to SCD occurrence. Only 61 SCD ECG beats were wrongly categorized into normal in the fourteenth case. This obviously demonstrates that number of false positive is very low and our technique is robust.

4. Discussion

Symmetry and asymmetry coexist as fundamental forms among mathematical structures; asymmetry drives evolution and the generation of complexity [28]. ECG as an asymmetrical signal is most frequently used for reflecting the cardiac electrical activity, it provides significant information to detect heart’s condition for clinicians. DWT is a multiresolution methodology, and has capability of breaking down the ECG signal being analyzed into several frequency sub-bands at various resolutions. This decomposition technique generates fewer coefficients without losing the information contained in the signal during both wavelet and inverse transformation [29]. In this work, A novel method for the early detection of SCD using DWT of the ECG signal is proposed. However, the performance of the DWT methodology is closely correlated with selection of the basis function and its similarity to the signal analyzed. Therefore, we explored the performance of several of the wavelet basis functions (Daubechies (orders 1–6), Coiflets (orders 1–3), and Harr) on prediction of developing SCD. Numerical experiments support the proposed technique; using DWT with db6 can distinguish normal from SCD ECGs 4 min before SCD onset with an accuracy, sensitivity, and specificity of 98.1, 98.1, and 98.0%, respectively, and perform better than the others’ basis function. The results of the studies on the early SCD identification using ECG/HRV analysis is provided in Table 1.
Shen et al. used four HRV indices (heart rate variability mean, very high frequency, low frequency/high frequency, and standard deviation) for analysis of two-minute HRV signal beats and achieved an accuracy of 87.5% [6]. Acharya et al. proposed a technique for SCD detection based on DWT and non-linear analysis, such as Fractal dimension, Hurst’s exponent, detrended fluctuation analysis (DFA), approximate entropy, sample entropy, and correlation dimension of ECG signals with a 1 min interval; they obtained an accuracy of 92.11, 98.68, 93.42, and 92.11% for one to four minutes before SCD occurrence, respectively [21]. They also used recurrence quantification analysis and Kolmogorov complexity features acquired from HRV with 1 min intervals to automatically detect SCD four minutes prior, with an average accuracy of 86.8% employing the KNN classifier [14]. Additionally, Elias et al. proposed several SCD detection methods [2] using time domain features, such as the mean of all NN intervals (MNN), root mean square of successive differences, frequency domain features, such as high frequency, low frequency, and ratio of LF and HF bands’ power, as well as TF features obtained from the Wigner-Ville transformation of the HRV signal and nonlinear features extracted from HRV signals with 1 min interval; their methods can predict SCD four minutes before SCD onset [2].
It can be seen from Table 1 that, 1 min and 2 min intervals of the analyzed signals (ECG or HRV) have been frequently used as a prediction resolution for early SCD identification. It is obvious that the bigger interval, such as over 2 min intervals, will increase the prediction accuracy due to having more samples. However, it will correspondingly result in a decrease of the prediction resolution. In addition to that, it becomes apparent that almost all studies tabulated in Table 1 used the analysis of HRV signals with a 1 min interval, but for time and frequency metrics of HRV analysis, it requires about 5 min of heart beat measurements to get reasonable and reliable results [30]. The number of HRV signals with 1–2 min is no more than 200 data points, but for some nonlinear methods used in SCD detection mentioned above, such as approximate entropy, sample entropy, and correlation dimension, too short of a time series results in a highly unstable results due to their great sensitivity to the length of the signal analyzed, which that discounts the clinical value of these methods [31]. Therefore, in this ongoing study, we developed an automatic SCD identification scheme combining DWT and LPP using ECG beats with 651 points in each interval, instead of HRV signals with 1 min interval, that is to say, this proposed scheme in this paper can be utilized to detect patients at risk of SCD using a single ECG beat. When compared with the prediction time of most research being 4 min at the most, the proposed technique can efficiently predict SCD occurrence risk 14 min earlier and achieved significantly good results, with the highest accuracy of 97.6% when compared with the state-of the-art studies. Furthermore, the 10-fold cross-validation methodology made our developed technique more robust and reliable. The proposed technique is completely automated, economical, and non-invasive, it can be used in the real-time monitoring of heart conditions with the development of cloud computing, smart phones, and wearable sensors [32], and can increase the survival rate of patients at risk of SCD.

5. Conclusions

Providing accurate early warning information for impending likely SCD, can trigger preemptive action for patients at risk of SCD, which would be extremely important and of great clinical meaning. In this study, an efficient technique was developed for an automated prediction of SCD 14 min before its onset using DWT of ECG signals. Our study result showed 98.1% accuracy, 98.1% sensitivity, and 98.0% specificity, as well as 97.6% accuracy, 97.9% sensitivity, and 97.3% specificity by employing the LPP features extracted from the asymmetric ECG signal in the SCD prediction 4 and 14 min earlier, respectively, which outperformed all the reported previous studies. The proposed technique can be tested using huge diverse database in the future.

Author Contributions

M.S. contributed the majority of the writing and conducted major parts of the experiments. H.W. conducted some experiments and contributed to the methodology, H.Y. supervised the work and revised the manuscript. All authors have read and agreed to the published version of the manuscript.

Funding

This research was funded the National Natural Science Foundation of China, grant number 32070671; Anhui Provincial Universities Excellent Topnotch Talents Training Program in 2021, grant number gxyq2021200; Anhui Science and Technology University Stabilization and Introduction of Talents grant number XWWD202101; the University Student Innovation and Entrepreneurship, grant number 202010879032; Scientific research project of Anhui University of Science and Technology, grant number 2021zryb27; Key projects of natural science research in Anhui Universities in 2021, KJ2021A0896, KJ2021A0894.

Institutional Review Board Statement

Not applicable.

Informed Consent Statement

Not applicable.

Data Availability Statement

The data sets used in the study are from the MITBIH Database available online at https://archive.physionet.org/physiobank/database/sddb/ (accessed on 11 February 2021); https://archive.physionet.org/physiobank/database/nsrdb/ (accessed on 11 March 2021).

Conflicts of Interest

The authors declare no competing interest.

References

  1. Fujita, H.; Acharya, U.R.; Sudarshan, V.K.; Ghista, D.N.; Sree, S.V. Sudden cardiac death (SCD) prediction based on nonlinear heart rate variability features and SCD index. Appl. Soft Comput. 2016, 43, 510–519. [Google Scholar] [CrossRef]
  2. Ebrahimzadeh, E.; Pooyan, M.; Bijar, A. A Novel Approach to Predict Sudden Cardiac Death (SCD) Using Nonlinear and Time-Frequency Analyses from HRV Signals. PLoS ONE 2014, 9, e81896. [Google Scholar] [CrossRef]
  3. Nichols, M.; Townsend, N.; Scarborough, P.; Rayner, M. Cardiovascular disease in Europe: Epidemiological update. Eur. Heart J. 2013, 34, 3028–3034. [Google Scholar] [CrossRef]
  4. Pagidipati, N.J.; Gaziano, T.A. Estimating Deaths from Cardiovascular Disease: A Review of Global Methodologies of Mortality Measurement. Circulation 2013, 127, 749–756. [Google Scholar] [CrossRef]
  5. Passman, R.; Goldberger, J.J. Predicting the future: Risk stratification for sudden cardiac death in patients with left ventricular dysfunction. Circulation 2012, 125, 3031–3037. [Google Scholar] [CrossRef] [PubMed] [Green Version]
  6. Shen, T.W.; Shen, H.P.; Lin, C.; Ou, Y.L. Detection and Prediction of Sudden Cardiac Death (SCD) For Personal Healthcare. In Proceedings of the 29th Annual International Conference of the IEEE, Lyon, France, 26–29 March 2007; Volume 21, pp. 2575–2578. [Google Scholar]
  7. Kahney, E.W.; Ranjan, R.; Gleason, R.J.; Chen, X. Symmetry from Asymmetry or Asymmetry from Symmetry? Cold Spring Harb. Symp. Quant. Biol. 2018, 82, 305–318. [Google Scholar] [CrossRef] [Green Version]
  8. Acharya, U.R.; Fujita, H.; Shu, L.O.; Hagiwara, Y.; Adam, M. Application of Deep Convolutional Neural Network for Automated Detection of Myocardial Infarction Using ECG Signals. Inf. Sci. 2017, 415, 190–198. [Google Scholar] [CrossRef]
  9. Acharya, U.R.; Fujita, H.; Adam, M.; Lih, O.S.; Tan, R.S. Automated characterization and classification of coronary artery disease and myocardial infarction by decomposition of ECG signals: A comparative study. Inf. Sci. 2017, 377, 17–29. [Google Scholar] [CrossRef]
  10. Huikuri, H.V.; Makikallio, T.H.; Raatikainen, M.J.; Perkiomaki, J. Prediction of sudden cardiac death: Appraisal of the studies and methods assessing the risk of sudden arrhythmic death. Circulation 2003, 108, 110–115. [Google Scholar] [CrossRef]
  11. VanHoogenhuyze, D.; Martin, G.; Weiss, J.; Schaad, J.; Singer, D. Spectrum of heart rate variability. Proc. Comput. Cardiol 1989. [Google Scholar]
  12. Ebrahimzadeh, E.; Pooyan, M. Early detection of sudden cardiac death by using classical linear techniques and time-frequency methods on electrocardiogram signals. Biomed. Sci. Eng. 2011, 11, 699–706. [Google Scholar] [CrossRef] [Green Version]
  13. Voss, A.; Kurths, J.; Kleiner, H.J.; Witt, A. The application of methods of non-linear dynamics for the improved and predictive recognition of patients threatened by sudden cardiac death. Cardiovasc. Res. 1996, 31, 419–433. [Google Scholar] [CrossRef]
  14. Acharya, U.R.; Fujita, H.; Vidya, K.S.; Ghista, D.N.; Lim, W.J.E.; Koh, J.E.W. Automated prediction of sudden cardiac death risk using kolmogorov complexity and recurrence quantification analysis features extracted from HRV signals. In Proceedings of the 2015 IEEE International Conference on Systems, Man, and Cybernetics, Hongkong, China, 9–12 October 2015. [Google Scholar]
  15. Shi, M.; Zhan, C.; He, H.; Jin, Y.; Wu, R.; Sun, Y.; Shen, B. Renyi distribution entropy analysis of short-term heart rate variability signals and its application in coronary artery disease detection. Front. Physiol. 2019, 10, 809. [Google Scholar] [CrossRef] [PubMed] [Green Version]
  16. Murukesan, L.; Murugappan, M.; Iqbal, M.; Saravanan, K. Machine Learning Approach for Sudden Cardiac Arrest Prediction Based on Optimal Heart Rate Variability Features. J. Med. Imaging Health Inform. 2014, 4, 521–532. [Google Scholar] [CrossRef]
  17. Mirhoseini, S.R.; Jahedmotlagh, M.R.; Pooyan, M. Improve Accuracy of Early Detection Sudden Cardiac Deaths (SCD) Using Decision Forest and SVM. In Proceedings of the International Conference on Robotics and Artificial Intelligence (ICRAI2016), Los Angeles, CA, USA, 20–22 April 2016. [Google Scholar]
  18. Ebrahimzadeh, E.; Manuchehri, M.S.; Amoozegar, S. A time local subset feature selection for prediction of sudden cardiac death from ECG signal. Med. Biol. Eng. Comput. 2018, 56, 1253–1270. [Google Scholar] [CrossRef] [PubMed]
  19. Ebrahimzadeh, E.; Foroutan, A.; Shams, M.; Baradaran, R.; Rajabion, L.; Joulani, M.; Fayaz, F. An optimal strategy for prediction of sudden cardiac death through a pioneering feature-selection approach from HRV signal. Comput. Methods Programs Biomed. 2019, 169, 19–36. [Google Scholar] [CrossRef]
  20. Shi, M.; He, H.; Geng, W.; Wu, R.; Zhan, C.; Jin, Y.; Zhu, F.; Ren, S.; Shen, B. Early Detection of Sudden Cardiac Death by Using Ensemble Empirical Mode Decomposition-Based Entropy and Classical Linear Features From Heart Rate Variability Signals. Front. Physiol. 2020, 11, 118. [Google Scholar] [CrossRef] [PubMed]
  21. Acharya, U.R.; Fujita, H.; Sudarshan, V.K.; Sree, V.S.; Eugene, L.W.J.; Ghista, D.N.; Tan, R.S. An integrated index for detection of Sudden Cardiac Death using Discrete Wavelet Transform and nonlinear features. Knowl.-Based Syst. 2015, 83, 149–158. [Google Scholar] [CrossRef]
  22. Goldberger, A.L.; Amaral, L.A.; Glass, L.; Hausdorff, J.M.; Ivanov, P.C.; Mark, R.G.; Mietus, J.E.; Moody, G.B.; Peng, C.K.; Stanley, H.E. PhysioBank, PhysioToolkit, and PhysioNet: Components of a New Research Resource for Complex Physiologic Signals. Circulation 2000, 101, e215–e220. [Google Scholar] [CrossRef] [PubMed] [Green Version]
  23. Pan, J.; Tompkins, W.J. A Real-Time QRS Detection Algorithm. IEEE Trans. Biomed. Eng. 2007, 3, 230–236. [Google Scholar] [CrossRef] [PubMed]
  24. Chiradeja, P.; Ngaopitakkul, A. Classification of Lightning and Faults in Transmission Line Systems Using Discrete Wavelet Transform. Math. Probl. Eng. 2018, 2018, 1847968. [Google Scholar] [CrossRef]
  25. Yan, L.; Liu, Y.; Liu, Y. Application of Discrete Wavelet Transform in Shapelet-Based Classification. Math. Probl. Eng. 2020, 1, 6523872. [Google Scholar] [CrossRef]
  26. Liu, X.; Lin, S.; Fan, H. Face recognition algorithm based on Gabor wavelet and locality preserving projections. Mod. Phys. Lett. B 2017, 31, 1740041. [Google Scholar] [CrossRef] [Green Version]
  27. Yu, W.; Wang, R.; Nie, F.; Wang, F.; Yu, Q.; Yang, X. An improved locality preserving projection with l(1)-norm minimization for dimensionality reduction. Neurocomputing 2018, 316, 322–331. [Google Scholar] [CrossRef]
  28. Kopra, A.R.; Lawandow, A.; Sabelli, H. Asymmetry, Symmetry and Beauty. Symmetry 2010, 2, 1591–1624. [Google Scholar]
  29. Desai, K.D.; Sankhe, M.S. A real-time fetal ECG feature extraction using multiscale discrete wavelet transform. In Proceedings of the International Conference on Biomedical Engineering & Informatics, Chongqing, China, 16–18 October 2012. [Google Scholar]
  30. Guzzetti, S.; Rovere, M.; Pinna, G.D.; Maestri, R.; Malliani, A. Different spectral components of 24 h heart rate variability are related to different modes of death in chronic heart failure. Eur. Heart J. 2005, 26, 357–362. [Google Scholar] [CrossRef] [PubMed]
  31. Li, P.; Liu, C.; Li, K. Assessing the complexity of short-term heartbeat interval series by distribution entropy. Med. Biol. Eng. Comput. 2015, 53, 77–87. [Google Scholar] [CrossRef] [PubMed]
  32. Bai, J.; Shen, L.; Sun, H.; Shen, B. Physiological Informatics: Collection and Analyses of Data from Wearable Sensors and Smartphone for Healthcare. Adv. Exp. Med. Biol. 2017, 1028, 17–37. [Google Scholar]
Figure 1. The block diagram of the proposed method.
Symmetry 14 00571 g001
Figure 2. A typical SCD ECG signal 1 to 4 min intervals before its onset.
Symmetry 14 00571 g002
Figure 3. The (a) SCD and (b) normal beat segmented from the continuous ECG signals.
Symmetry 14 00571 g003
Figure 4. ECG beat and its decomposition using DWT: (a) normal and (b) SCD.
Symmetry 14 00571 g004
Figure 5. Boxplot of ranked LPP features acquired using DWT.
Symmetry 14 00571 g005
Figure 6. The plot of accuracy (percentage) versus the number of LPP features using various classifiers.
Symmetry 14 00571 g006
Table 1. Overview of study using ECG/HRV signals for early SCD detection.
Ref. DataMethodClassificationCross Validation Accuracy
Early SCD Detection Using HRV Signals
[6]No. of data: 23 SCD, 20 normal
Source: the MIT/BIH SCD ans Normal Sinus Rhythm (NSR) databases
Prediction time resolution: 2 min interval
Wavelet analysis
and TF domain method
Artificial neural networks (ANN);
Back propagation (BP)
Not mentioned87.5%
(2 min before)
[12]No. of data: 35 SCD, 35 normal
Source: the MIT/BIH SCD ans NSR databases
Prediction time resolution: 1 min interval
Linear (time, frequency domain), TF domain, and nonlinear methods (poincaré plot (PP), Detrended fluctuation analysis (DFA))KNN; Multilayer perceptron (MLP)Not mentioned91.23%
(2 min before)
[2]No. of data: 35 SCD, 35 normal
Source: the MIT/BIH SCD ans NSR databases
Prediction time resolution: 1 min interval
Linear (time, frequency domain), TF domain, and nonlinear methods (PP, DFA)KNN; Multilayer Perceptron Neural Network (PNN)Leave one out cross-validation83.93%
(4 min before)
[16]No. of data: 23 SCD, 18 normal
Source: the MIT/BIH SCD ans NSR databases
Prediction time resolution: 1 min interval
Linear (time, frequency domain), TF domain, and nonlinear methods (PP, DFA)SVM, PNN10-fold cross-validation96.36%
(2 min before)
[14]No. of data: 40 SCD, 36 normal
Source: the MIT/BIH SCD ans NSR databases
Prediction time resolution: 1 min interval
Recurrence Quantification Analysis (RQA), and Kolmogorov, complexity parametersSVM, KNN, PNN, DT10-fold cross-validation86.8%
(4 min before)
[17]No. of data: 19 SCD and18 normal
Source: the MIT/BIH SCD ans NSR databases
Prediction time resolution: 1 min interval
Linear (time, frequency domain), TF domain, and nonlinear methods (PP)SVM10-fold cross-validation83.24%
(1 min before)
[1]No. of data:20 SCD and18 normal
Source: the MIT/BIH SCD ans NSR databases
Prediction time resolution: 1 min interval
Wavelet transform, nonlinear methods
(Renyi entropy (REn), fuzzy
entropy (FuEn), Hjorth’s parameters, Tsallis entropy)
DT, KNN, SVM10-fold cross-validation94.7%
(4 min before)
[18]No. of data: 35 SCD, 35 normal
Source: the MIT/BIH SCD ans NSR databases
Prediction time resolution: 1 min interval
Linear (time, frequency domain), TF domain and, nonlinear methods (PP, DFA)MLPLeave one out cross-validation95.23%
(4 min before)
83.88%
(12 min before)
[19]No. of data: 35 SCD, 35 normal
Source: the MIT/BIH SCD ans NSR databases
Prediction time resolution: 1 min interval
Linear (time, frequency domain), TF domain, and nonlinear methods (PP, DFA)MLP, SVM, KNNNot mentioned95.24%
(4 min before)
84.28%
(13 min before)
[20]No. of data: 40 SCD, 36 normal
Source: the MIT/BIH SCD ans NSR databases
Prediction time resolution: 1 min interval
EEMD, linear (time, frequency domain), TF domain, and nonlinear methods (REn, FuEn, dispersion entropy, Renyi distribution entropy (RdisEn), and improved multiscale permutation entropyKNN10-fold cross-validation94.7%
(4 min before)
96.1%
(14 min before)
Early SCD detection using ECG signals
[21]No. of data: 40 SCD, 36 normal
Source: the MIT/BIH SCD ans NSR databases
Prediction time resolution: 1 min interval
DWT, Nonlinear methods
(Fractal Dimension (FD), DFA
Hurst’s exponent (H), Sample Entropy, Approximate Entropy, and Correlation Dimension (CD))
KNN, SVM, DT10-fold cross-validation92.11%
(4 min before)
Current studyNo. of data: 40 SCD, 36 normal
Source: the MIT/BIH SCD ans NSR databases
Prediction time resolution: 1 min interval
DWT and LPPKNN, SVM, DT10-fold cross-validation98.1%
(4 min before)
97.6%
(14 min before)
Note: Sen = sensitivity, Spe = specificity, Acc = accuracy, No. of data = number of data.
Table 2. Summary of the ECG beats used in fifth cases.
CaseNumber of Beats
SCDNormal
1st 1-min29752934
2nd 1-min28492938
3rd 1-min29253036
4th 1-min31123021
5th 1-min30133100
6th 1-min29233052
7th 1-min30013043
8th 1-min30382961
9th 1-min29083032
10th 1-min29043135
11th 1-min29073175
12th 1-min27583147
13th 1-min28653062
14th 1-min28613026
Table 3. The mean ± SD of LPP features from normal and SCD ECG signals 4th 1 min before SCD onset.
FeatureNormalSCDp-Value
MeanSDMeanSD
LPP2−0.032 0.475 0.749 1.307 5.52 × 10−199
LPP10.443 0.843 1.567 2.457 1.05 × 10−122
LPP3−0.118 0.294 0.104 0.539 4.04 × 10−87
LPP4−0.072 0.444 0.082 0.257 3.33 × 10−60
LPP5−0.070 0.330 −0.164 0.321 3.57 × 10⁻²⁹
LPP6−0.010 0.179 0.043 0.259 2.00 × 10⁻²⁰
LPP11−0.060 0.172 −0.085 0.127 4.88 × 10⁻¹⁰
LPP70.011 0.379 −0.020 0.146 2.32 × 10⁻⁵
LPP10−0.061 0.216 −0.071 0.119 0.032
LPP80.019 0.350 0.012 0.115 0.293
LPP9−0.011 0.236 −0.011 0.149 0.934
Table 4. Performance measures for normal and SCD HRV signals four minutes before SCD onset using various classifiers.
ClassifierFeaturesTPTNFPFNAccuracySensitivitySpecificity
KNN (1) 530542962585998.1%98.1%98.0%
KNN (10) 530502959626298.0%98.0%97.9%
SVM(Gaussian)530432960696197.9%97.8%98.0%
DT83012290410011796.5%96.8%96.1%
Note: TP = True Positive; TN = True Negative; FP = False Positive; FN = False Negative.
Table 5. Performance measures for normal and SCD HRV signals four minutes before SCD onset using various ranking methods and the 1-NN classifier.
Ranking MethodFeaturesTPTNFPFNAccuracySensitivitySpecificity
t-test530542962585998.1%98.1%98.0%
Bhattacharyya530422838708397.5%97.8%97.2%
Wilcoxon830592945537697.9%98.3%97.5%
entropy630502941628097.7%98.0%97.4%
Note: TP = True Positive; TN = True Negative; FP = False Positive; FN = False Negative.
Table 6. Performance measures for normal and SCD HRV signals four minutes before SCD onset using DWT with various wavelet basis and the 1-NN classifier.
Wavelet BasisFeaturesTPTNFPFNAccuracySensitivitySpecificity
db1730622944507797.9%98.4%97.5%
db21230672942457998.0%98.6%97.4%
db31230582954546998.0%98.3%97.7%
db49302029119211096.7%97.0%96.4%
db5730532940598197.7%98.1%97.3%
db6530542962585998.1%98.1%98.0%
haar82976286213615995.2%95.6%94.7%
coif1730582954546998.0%98.3%97.7%
coif2530462955666697.8%97.9%97.8%
coif310304129207110197.2%97.7%96.7%
Note: TP = True Positive; TN = True Negative; FP = False Positive; FN = False Negative.
Table 7. The maximum accuracy obtained for all 14 cases.
CaseFeaturesTPTNFPFNAccuracySensitivitySpecificity
The 1st 1-min92875281610011896.3%96.6%96.0%
The 2nd 1-min7277128147812496.5%97.3%95.8%
The 3rd 1-min7284829157712196.7%97.4%96.0%
The 4th 1-min530542962585998.1%98.1%98.0%
The 5th 1-min629573009569197.6%98.1%97.1%
The 6th 1-min42797287612617694.9%95.7%94.2%
The 7th 1-min4291428868715796.0%97.1%94.8%
The 8th 1-min629732869659297.4%97.9%96.9%
The 9th 1-min6284229186611497.0%97.7%96.2%
The 10th 1-min6284430336010297.3%97.9%96.7%
The 11th 1-min4282830567911996.7%97.3%96.3%
The 12th 1-min626883072707597.5%97.5%97.6%
The 13th 1-min728112997546598.0%98.1%97.9%
The 14th 1-min528002944618297.6%97.9%97.3%
Note: TP = True Positive; TN = True Negative; FP = False Positive; FN = False Negative.
Publisher’s Note: MDPI stays neutral with regard to jurisdictional claims in published maps and institutional affiliations.

