Article

Identification of Novel Drugs Targeting Cell Cycle Regulators for the Treatment of High-Grade Serous Ovarian Cancer via Integrated Bioinformatics Analysis

School of Chemistry and Life Sciences, Suzhou University of Science and Technology, Suzhou 215011, China
*
Author to whom correspondence should be addressed.
Symmetry 2022, 14(7), 1403; https://doi.org/10.3390/sym14071403
Submission received: 9 June 2022 / Revised: 27 June 2022 / Accepted: 3 July 2022 / Published: 8 July 2022
(This article belongs to the Special Issue Biological Network and Its Symmetric Applications in Biomedicine)

Abstract

:
High-grade serous ovarian carcinoma (HGSC), the most common and aggressive histological type of ovarian cancer, remains the leading cause of cancer-related deaths among females. It is important to develop novel drugs to improve the therapeutic outcomes of HGSC patients, thereby reducing their mortality. Symmetry is one of the most important properties of the biological network, which determines the stability of a biological system. As aberrant gene expression is a critical symmetry-breaking event that perturbs the stability of biological networks and triggers tumor progression, we aim in this study to discover new candidate drugs and predict their targets for HGSC therapy based on differentially expressed genes involved in HGSC pathogenesis. Firstly, 98 up-regulated genes and 108 down-regulated genes were identified from three independent transcriptome datasets. Then, the small-molecule compounds PHA-793887, pidorubicine and lestaurtinib, which target cell-cycle-related processes, were identified as novel candidate drugs for HGSC treatment by adopting the connectivity map (CMap)-based drug repositioning approach. Furthermore, through a topological analysis of the protein–protein interaction network, cell cycle regulators CDK1, TOP2A and AURKA were identified as bottleneck nodes, and their expression patterns were validated at the mRNA and protein expression levels. Moreover, the results of molecular docking analysis showed that PHA-793887, pidorubicine and lestaurtinib had a strong binding affinity for CDK1, TOP2A and AURKA, respectively. Therefore, our study repositioned PHA-793887, pidorubicine and lestaurtinib, which can inhibit cell cycle regulators, as novel agents for HGSC treatment, thereby helping to optimize the therapeutic strategy for HGSC.

Graphical Abstract

1. Introduction

Ovarian cancer (OV) is the most lethal gynecologic malignancy, with an estimated 313,959 new cases and 207,252 deaths occurring in 2020 [1]. High-grade serous ovarian carcinoma (HGSC) is the most common and fatal type of OV, accounting for 70–80% of OV deaths [2]. Especially, HGSC is characterized by drug resistance and poor prognosis, posing a serious threat to women’s health. Currently, the standard of care for HGSC patients is to perform surgical debulking, followed by platinum-based and/or taxane-based chemotherapy. Despite the initial response induced by the standard treatment, the majority of HGSC patients are at high risk of relapse due to chemoresistance, with a 5-year survival rate of approximately 30% [3]. Therefore, it is important to discover novel and potent drugs that effectively treat HGSC, thereby improving the prognosis of HGSC patients.
Drug repositioning represents an efficient strategy for discovering new applications of existing drugs, due to its outstanding advantages over de novo drug development methods in terms of saving time and costs and increasing success rates [4]. With recent advances in omics technology and bioinformatics, computational approaches have attracted considerable attention, as they offer opportunities to develop repositioned small-molecule drugs more rapidly and effectively in the era of big data. The connectivity map (CMap) database, which archives large-scale gene expression profiles generated by perturbing cancer cell lines with a variety of bioactive compounds, has become an important public resource for computational drug repositioning [5]. It adopts a rank-based pattern-matching strategy to compute the connectivity score (ranging from −100 to 100), which reflects the connection between query signature and reference expression profiles [5]. In general, a negative connectivity score close to −100 indicates the strong inhibitory effect of the small-molecule drug on the query gene signature, implying its therapeutic potential. Currently, the expanded version of CMap is increasingly being used to identify novel potential therapeutic drugs for a variety of cancers [6]. For example, using CMap analysis, Zhang et al. [7] discovered that lovastatin was a potential drug for treating gastric cancer, and Zou et al. [8] found that piperlongumine may serve as a new promising treatment option for epithelial ovarian cancer. However, it is unclear whether the CMap database can be employed for drug repositioning in HGSC.
In order to treat cancer effectively and precisely, it is necessary not only to develop efficient drugs but also to identify drug targets and understand their mechanism of action. Currently, the rapid development of next-sequencing technology has contributed to the screening and mining of drug targets for various cancer types, including HGSC. For example, De et al. found KLF7 to be a potential therapeutic target for HGSC based on transcriptome datasets [9], and Huang et al. identified CPT1A as a promising therapeutic target for platinum-resistant HGSC through multi-omics analysis [10]. However, due to the intra- and inter-tumor heterogeneity of cancer patients, existing drug targets are still unable to provide effective treatment for HGSC patients. Therefore, it is of great importance to explore new therapeutic targets and improve the accuracy of prognostic prediction for HGSC patients, thus improving therapeutic efficacy.
Symmetry is one of the most critical properties of the biological network to maintain system stability [11]. Notably, symmetry-breaking events, such as abnormal gene expression, can trigger the perturbation of the biological system, leading to cancer development. Therefore, systematic study of symmetry provides an important route for identifying key factors in carcinogenic processes and predicting drug targets. The protein–protein interaction (PPI) network provides a holistic framework of cellular behavior and biological processes, increasing our understanding of the alteration of protein–protein crosstalk under pathological conditions [12]. Importantly, increasing evidence suggests that PPI networks are powerful tools for decoding cancer mechanisms and predicting candidate drug targets at the system level [13]. In PPI networks, bottleneck proteins with high betweenness values are topologically important and functionally essential nodes which can affect network symmetry and which are widely used to identify drug targets [14].
In this study, we focused on discovering small-molecule drugs for the treatment of HGSC by adopting a transcriptome-based computational drug repositioning approach. Firstly, differentially expressed genes (DEGs) between tumor tissues and normal control tissues from HGSC patients were identified and intersected in three public Gene Expression Omnibus (GEO) datasets. Then, the potential therapeutic compounds were searched in the CMap database by uploading those cancer-related genes with differential expression patterns. Meanwhile, bottleneck proteins were screened out through PPI network analysis. Furthermore, molecular docking was performed to investigate the interaction between bottleneck proteins and candidate compounds. The results suggest that PHA-793887, pidorubicine and lestaurtinib, which target cell cycle regulators, are potential therapeutic options for HGSC patients.

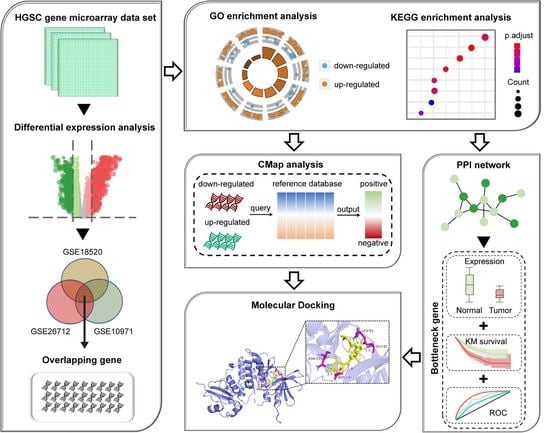
2. Materials and Methods

2.1. Data Collection and DEGs Identification

To identify the genes involved in the pathogenesis of HGSC, three independent transcriptome datasets were downloaded from the GEO resource with the accession number GSE26712 [15], GSE18520 [16] and GSE10971 [17], respectively. Among them, the GSE18520 and GSE10971 datasets were based on the Affymetrix GPL570 platform (HG-U133_Plus_2), and the GSE26712 dataset was based on the Affymetrix GPL96 platform (HG-U133A). The “Limma” R package [18] was then used to identify DEGs between HGSC tumor and normal control samples based on the expression level represented by normalized RMA signal intensity. The genes that met the selection criteria (|log2(fold change)| ≥ 1 and adjusted p-value < 0.05) were considered as DEGs. In addition, the online tool (http://bioinformatics.psb.ugent.be/webtools/Venn/ (accessed on 13 April 2022)) was used for Venn analysis to identify the overlapping DEGs in the three datasets.

2.2. Functional Enrichment Analyses

To explore the function of the identified DEGs in HGSC, Gene Ontology (GO) analysis focusing on the biological process as well as Kyoto Encyclopedia of Genes and Genomes (KEGG) pathway enrichment analysis were carried out on the overlapping DEGs using the “clusterProfiler” R package [19]. Statistically, the Benjamini–Hochberg method was used to adjust the p-values, and those terms with adjusted p-value < 0.05 were considered to be significant GO biological processes or KEGG pathways.

2.3. CMap-Based Screening of Potential Drug Molecules

CMap (https://clue.io/about (accessed on 18 April 2022)) is an online database containing information on the association between small-molecule compounds and gene expression profile, which could be used to reposition therapeutic drugs via querying gene signatures [20]. In brief, up- and down-regulated overlapping DEGs were uploaded into the “query” module of the CMap database. The connectivity score in the results file represents the correlation between the HGSC-related gene signature and the small-molecule compounds collected in CMap. As a negative score indicates the therapeutic potential of drug molecule, −97 was chosen as the maximum score to predict drug candidates for HGSC treatment. In addition, the mechanisms of action of the 46 candidate drugs with negative scores were exhibited using the “cmapR” R package (https://github.com/cmap/cmapR (accessed on 18 April 2022)).

2.4. PPI Network Construction and Analysis

To investigate the interactive relationship among the identified overlapping DEGs, the PPI network was constructed by searching the String database (v 11.5) (https://string-db.org/ (accessed on 20 April 2022)) [21]. PPIs with a confidence score of more than 0.400 were regarded as significant and retained in the network. Next, the Cytoscape software (v 3.6.1) [22] was employed to visualize and analyze the topological characteristics of the PPI network. Bottleneck genes were selected as the nodes with top 10% high betweenness centrality through topology analysis.

2.5. ROC Curve Analysis

To determine the diagnostic potential of bottleneck genes in distinguishing HGSC patients and normal controls, a receiver operating characteristic (ROC) curve analysis was conducted using the “pROC” R package [23]. The diagnostic performance can be evaluated by calculating the area under the curve (AUC) value of the ROC curve. The closer the AUC value is to 1, the better the performance is.

2.6. Kaplan–Meier Survival Analysis

To evaluate the prognostic value of bottleneck genes, OV patients were divided into high- and low-expression groups according to the median expression level of each bottleneck gene. Then, Kaplan–Meier survival analysis was performed using the Kaplan–Meier Plotter online tool (https://kmplot.com/analysis/ (accessed on 29 April 2022)) [24] to determine differences in overall survival and progression-free survival times between the high- and low-expression groups. Statistically, the log-rank test (p-value < 0.05) was used to assess the significant difference in survival curves between the high- and low-expression groups.

2.7. Molecular Docking between Candidate Drug and Bottleneck Protein

Molecular docking analysis was performed to explore the interaction between candidate drugs and the proteins encoded by the bottleneck gene. Briefly, the crystal structures of the bottleneck proteins were retrieved from the publicly available RCSB Protein Data Bank (PDB) database (https://www.rcsb.org/ (accessed on 6 May 2022)) [25], and the three-dimensional structure of candidate drugs was searched and downloaded from PubChem (https://www.ncbi.nlm.nih.gov/pccompound (accessed on 6 May 2022)). Next, after pretreatments of the proteins and ligands, the AutoDock software (v 4.2.6) [26] was utilized to perform molecular docking between candidate drugs and bottleneck proteins. Fifty independent runs were accomplished for each docking ligand. Furthermore, docking files were analyzed to identify binding energy, which represents the docking effect. Finally, the docking results with the best affinity were visualized and analyzed using the Pymol software (v 2.4.0) [27].

2.8. Statistical Analysis

All statistical analyses were performed using the R software (v 3.6.2). If not specified, adjusted p-values less than 0.05 were considered statistically significant.

3. Results

3.1. Identification of the DEGs Involved in HGSC Pathogenesis

To identify the genes involved in HGSC pathogenesis, we performed a differential expression analysis of mRNAs between tumor and normal control samples in three independent microarray datasets GSE26712, GSE18520 and GSE10971 using the “Limma” R package. There were a total of 251 HGSC tumor tissues and 32 normal control tissues (GSE26712: 185T/10N; GSE18520: 53T/10N; GSE10971: 13T/12N). As a result, with the screening criteria of |log2(fold change)| ≥ 1 and adjusted p-value < 0.05, 1543, 2813 and 2791 DEGs were identified in the GSE26712, GSE18520 and GSE10971 datasets, respectively (Figure 1A–C). Notably, 98 up-regulated genes and 108 down-regulated genes overlapped in the three datasets (Figure 1D,E), exhibiting important roles in HGSC.

3.2. Functional Annotation of the Overlapping DEGs

To further investigate the function of the overlapping DEGs identified in the above three HGSC datasets, GO and KEGG pathway enrichment analyses were carried out using the “clusterProfiler” R package. As shown in Figure 2A, the overlapping DEGs were significantly enriched in the cell cycle-related biological processes, such as nuclear division, chromosome segregation and microtubule cytoskeleton organization involved in mitosis. As expected, the KEGG result also showed that the overlapping DEGs mainly participated in the critical pathways, such as cell cycle, p53 signaling pathway, human papillomavirus infection, and platinum drug resistance (Figure 2B), which are closely linked to the initiation and progression of HGSC.

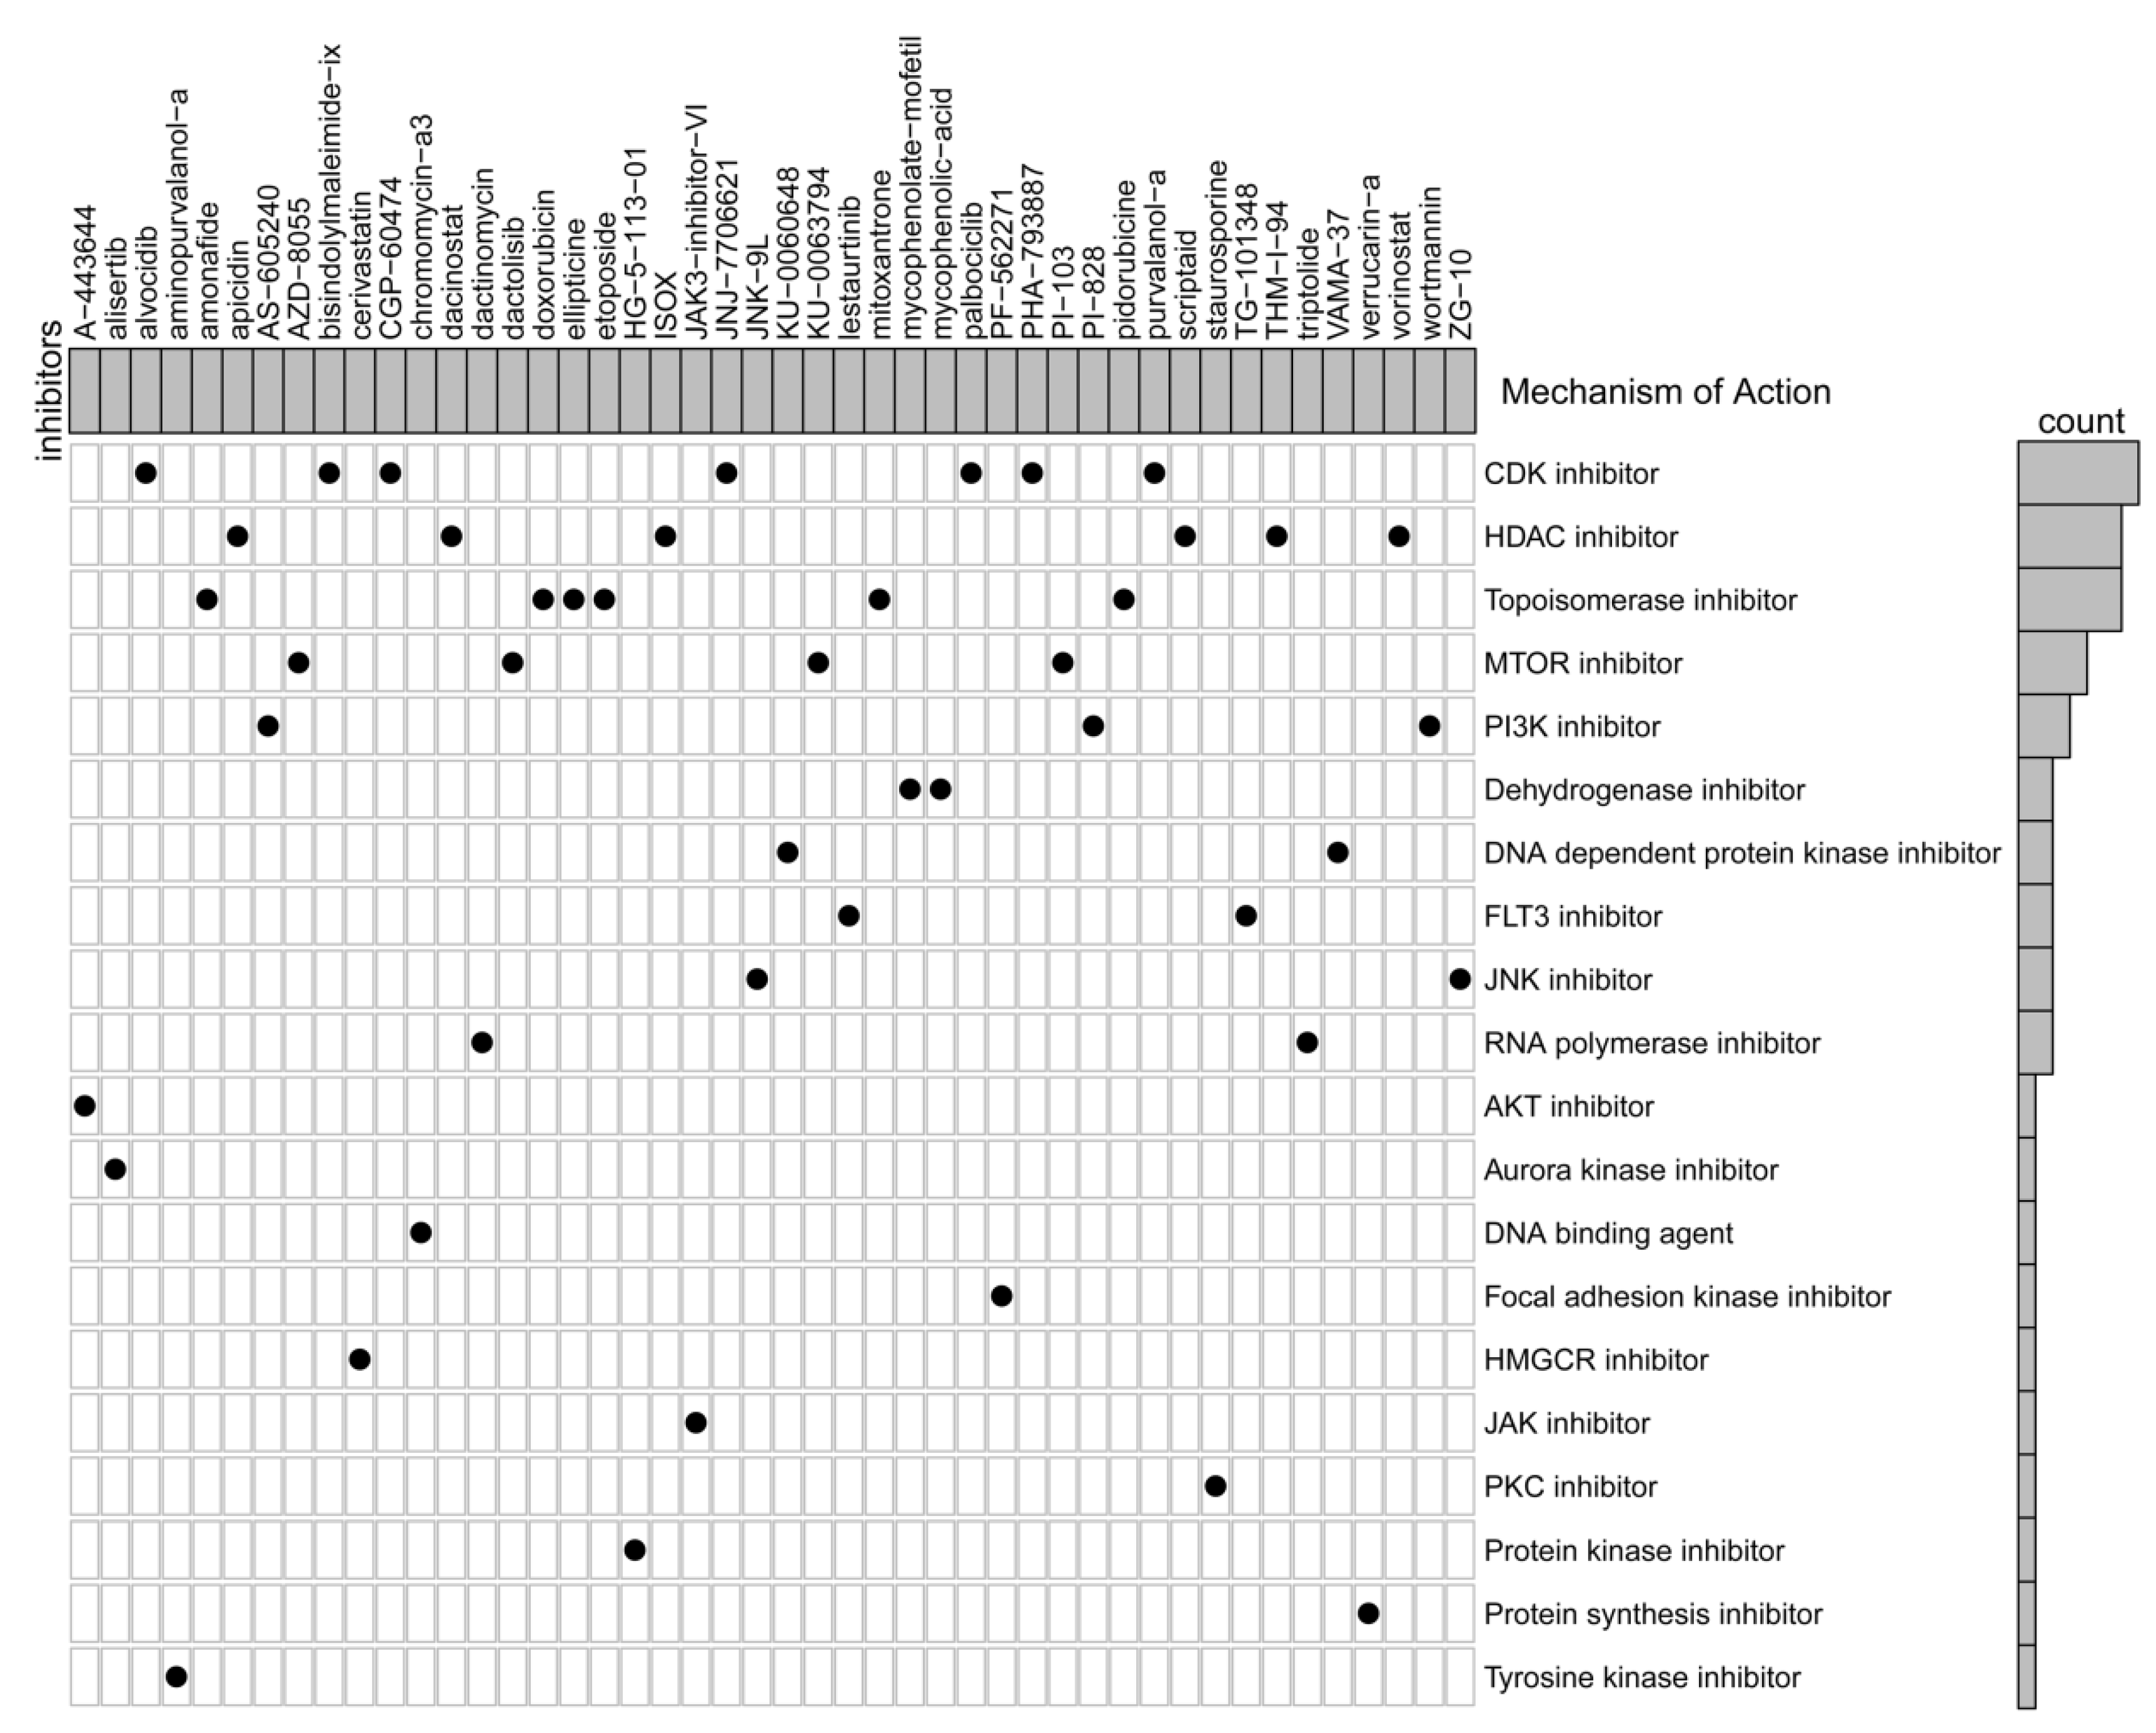
3.3. Screening of Candidate Small-Molecule Drugs

To identify candidate small-molecule drugs for HGSC patients, CMap was employed to discover the functional connections between the cancer-related gene expression signature and small-molecule drugs. By uploading the overlapping 98 up-regulated genes and 108 down-regulated genes into the CMap database, 46 candidate therapeutic compounds for HGSC were identified, based on the connectivity scores below −97 (Table 1). As shown in Figure 3, cyclin-dependent kinase (CDK) inhibitor, topoisomerase inhibitor, histone deacetylase (HDAC) inhibitor, mechanistic target of rapamycin (MTOR) inhibitor and phosphatidylinositol-3-kinase (PI3K) inhibitor are the most common mechanisms of action for the 46 candidate drugs with a negative connectivity score. Notably, PHA-793887, pidorubicine and lestaurtinib, acting as cell cycle-related inhibitors, were firstly identified as candidate therapeutic drugs for HGSC, thereby becoming the focus of the present research.

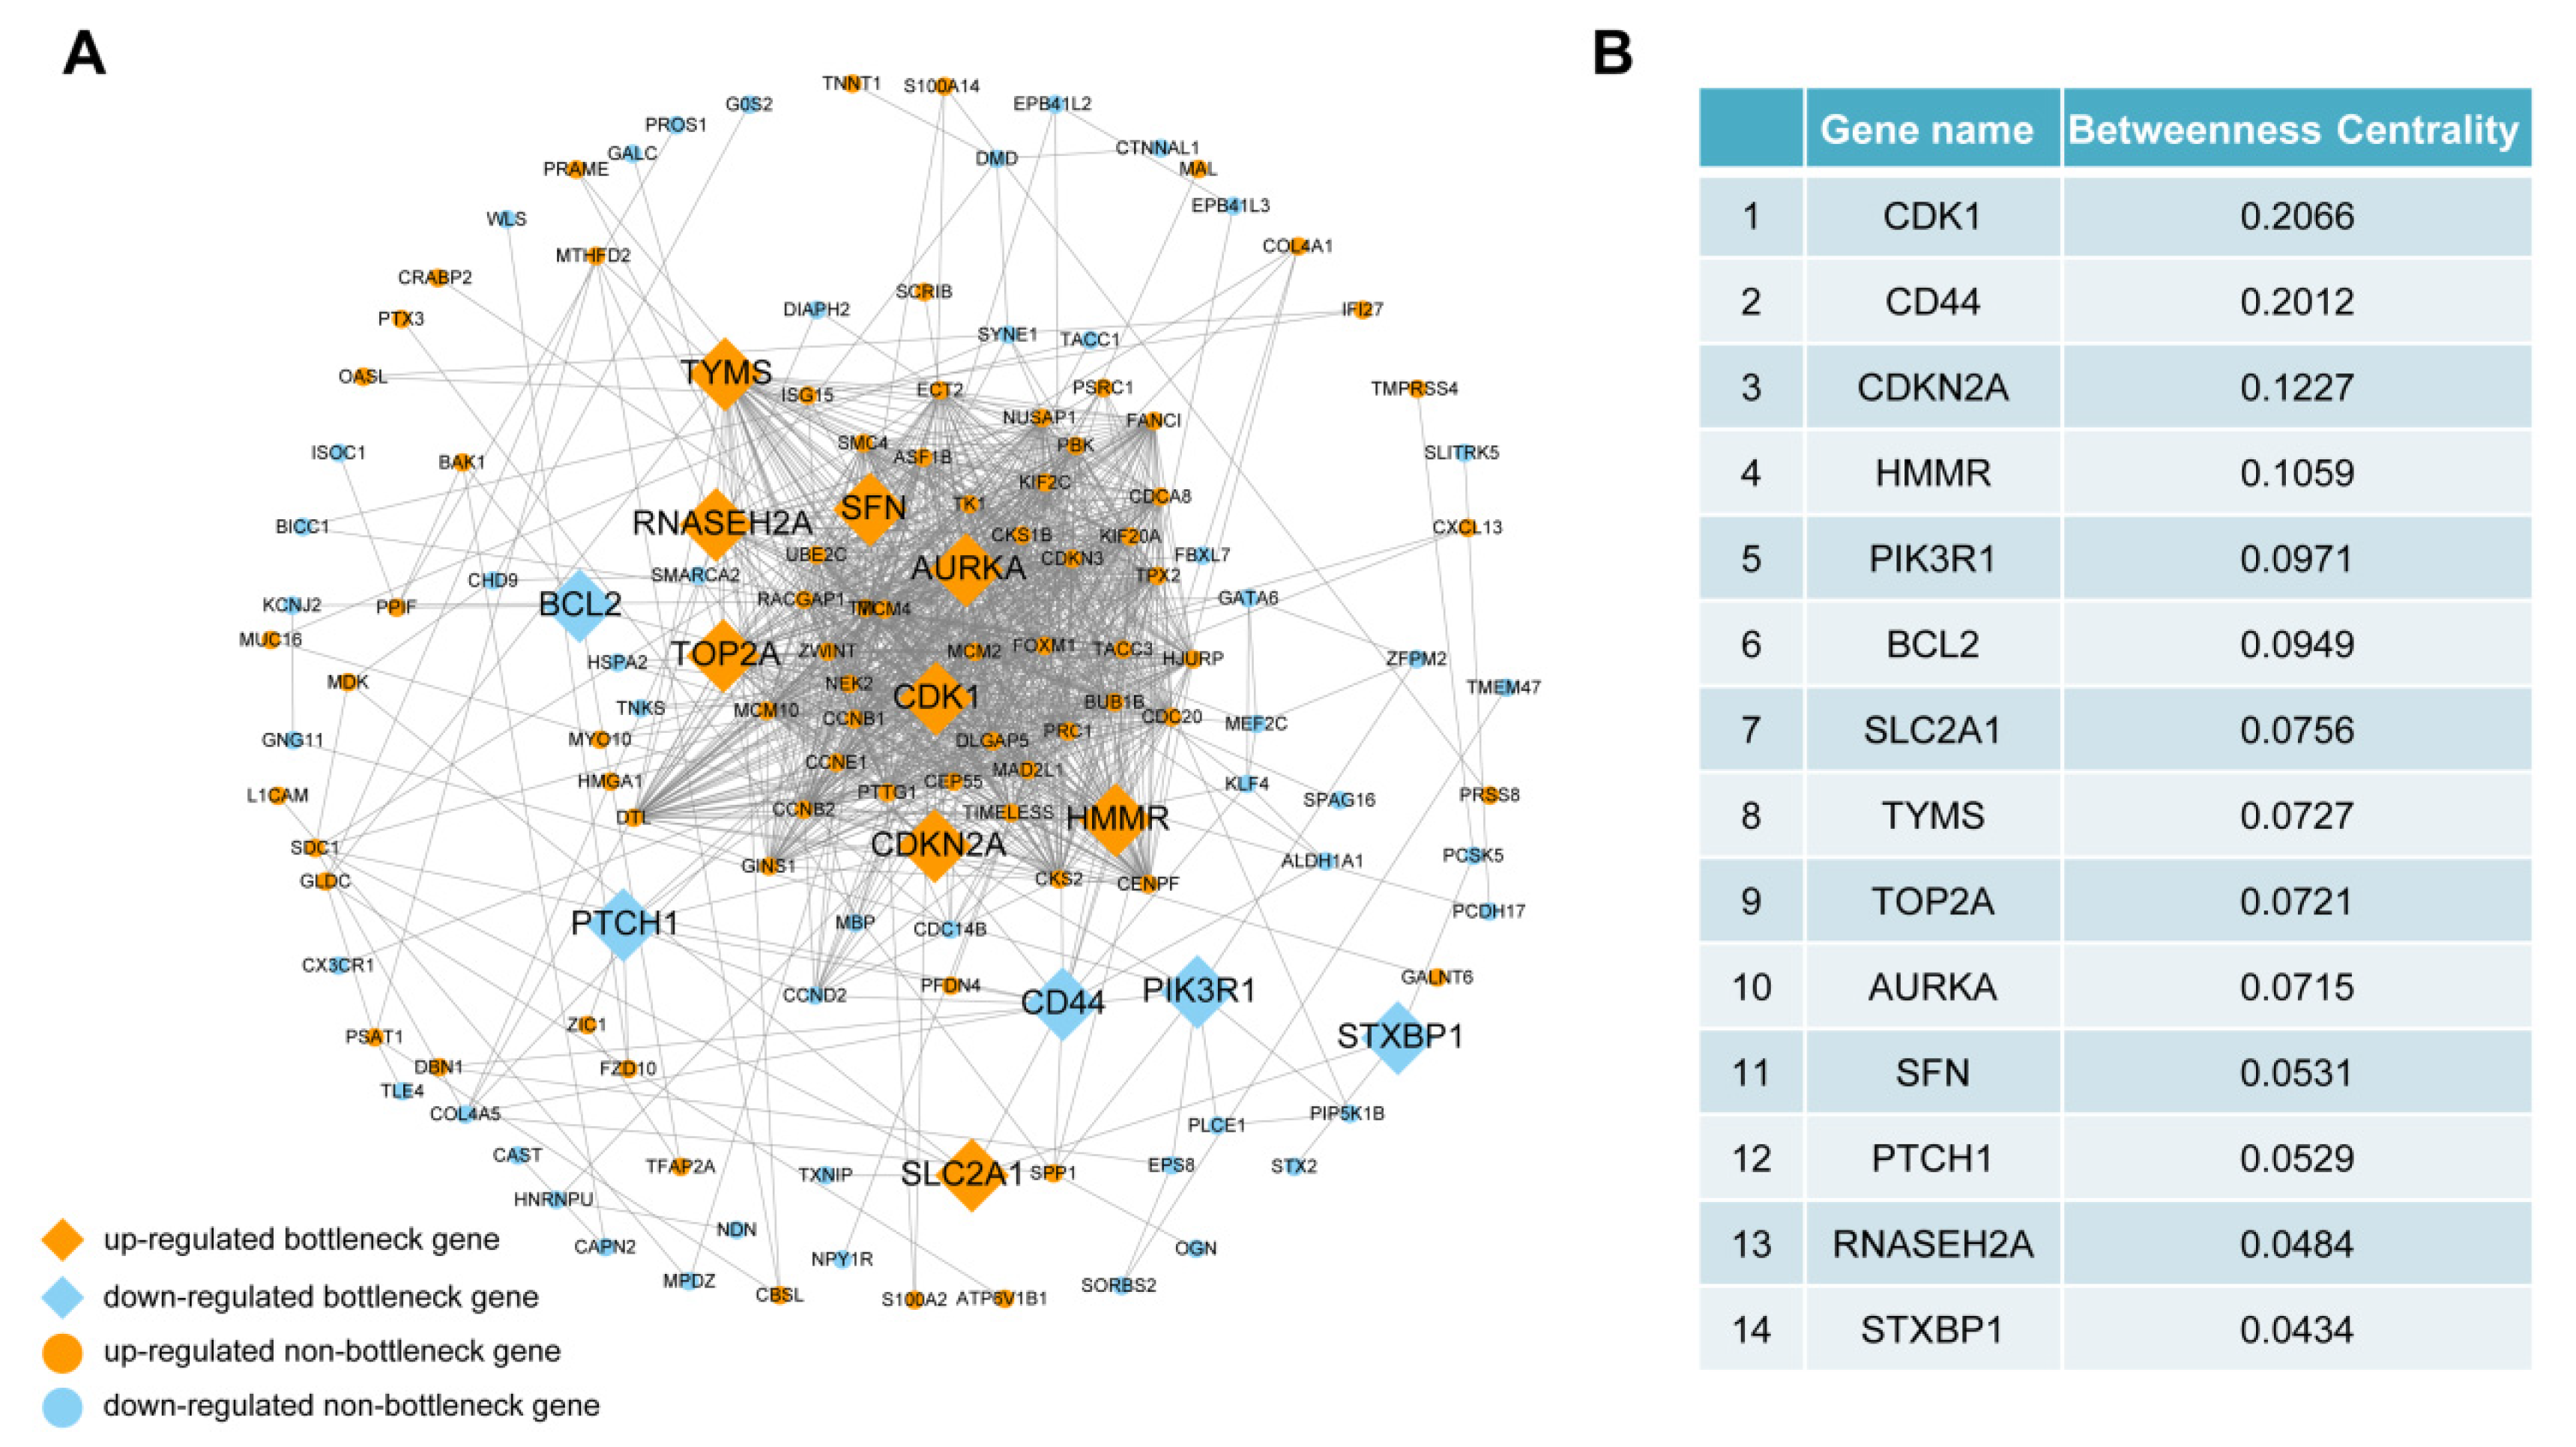
3.4. PPI Network Construction and Bottleneck Gene Identification

Given the powerful role of the PPI network in drug target identification, the PPI network was built based on the 206 overlapping DEGs via the String tool. It contained 147 nodes and 1115 edges. Topologically, betweenness centrality is an important parameter for exploring influential nodes in PPI networks in terms of information transmission and connection. In general, bottleneck nodes with a high betweenness are responsible for controlling communication between other nodes passing through them and have the potential to be candidate drug targets. Accordingly, 14 bottleneck genes with a top 10% high betweenness centrality were identified through topology analysis using the Cytoscape software (Figure 4). Among them, CDK1 had the highest betweenness value, suggesting its critical role in HGSC pathogenesis.

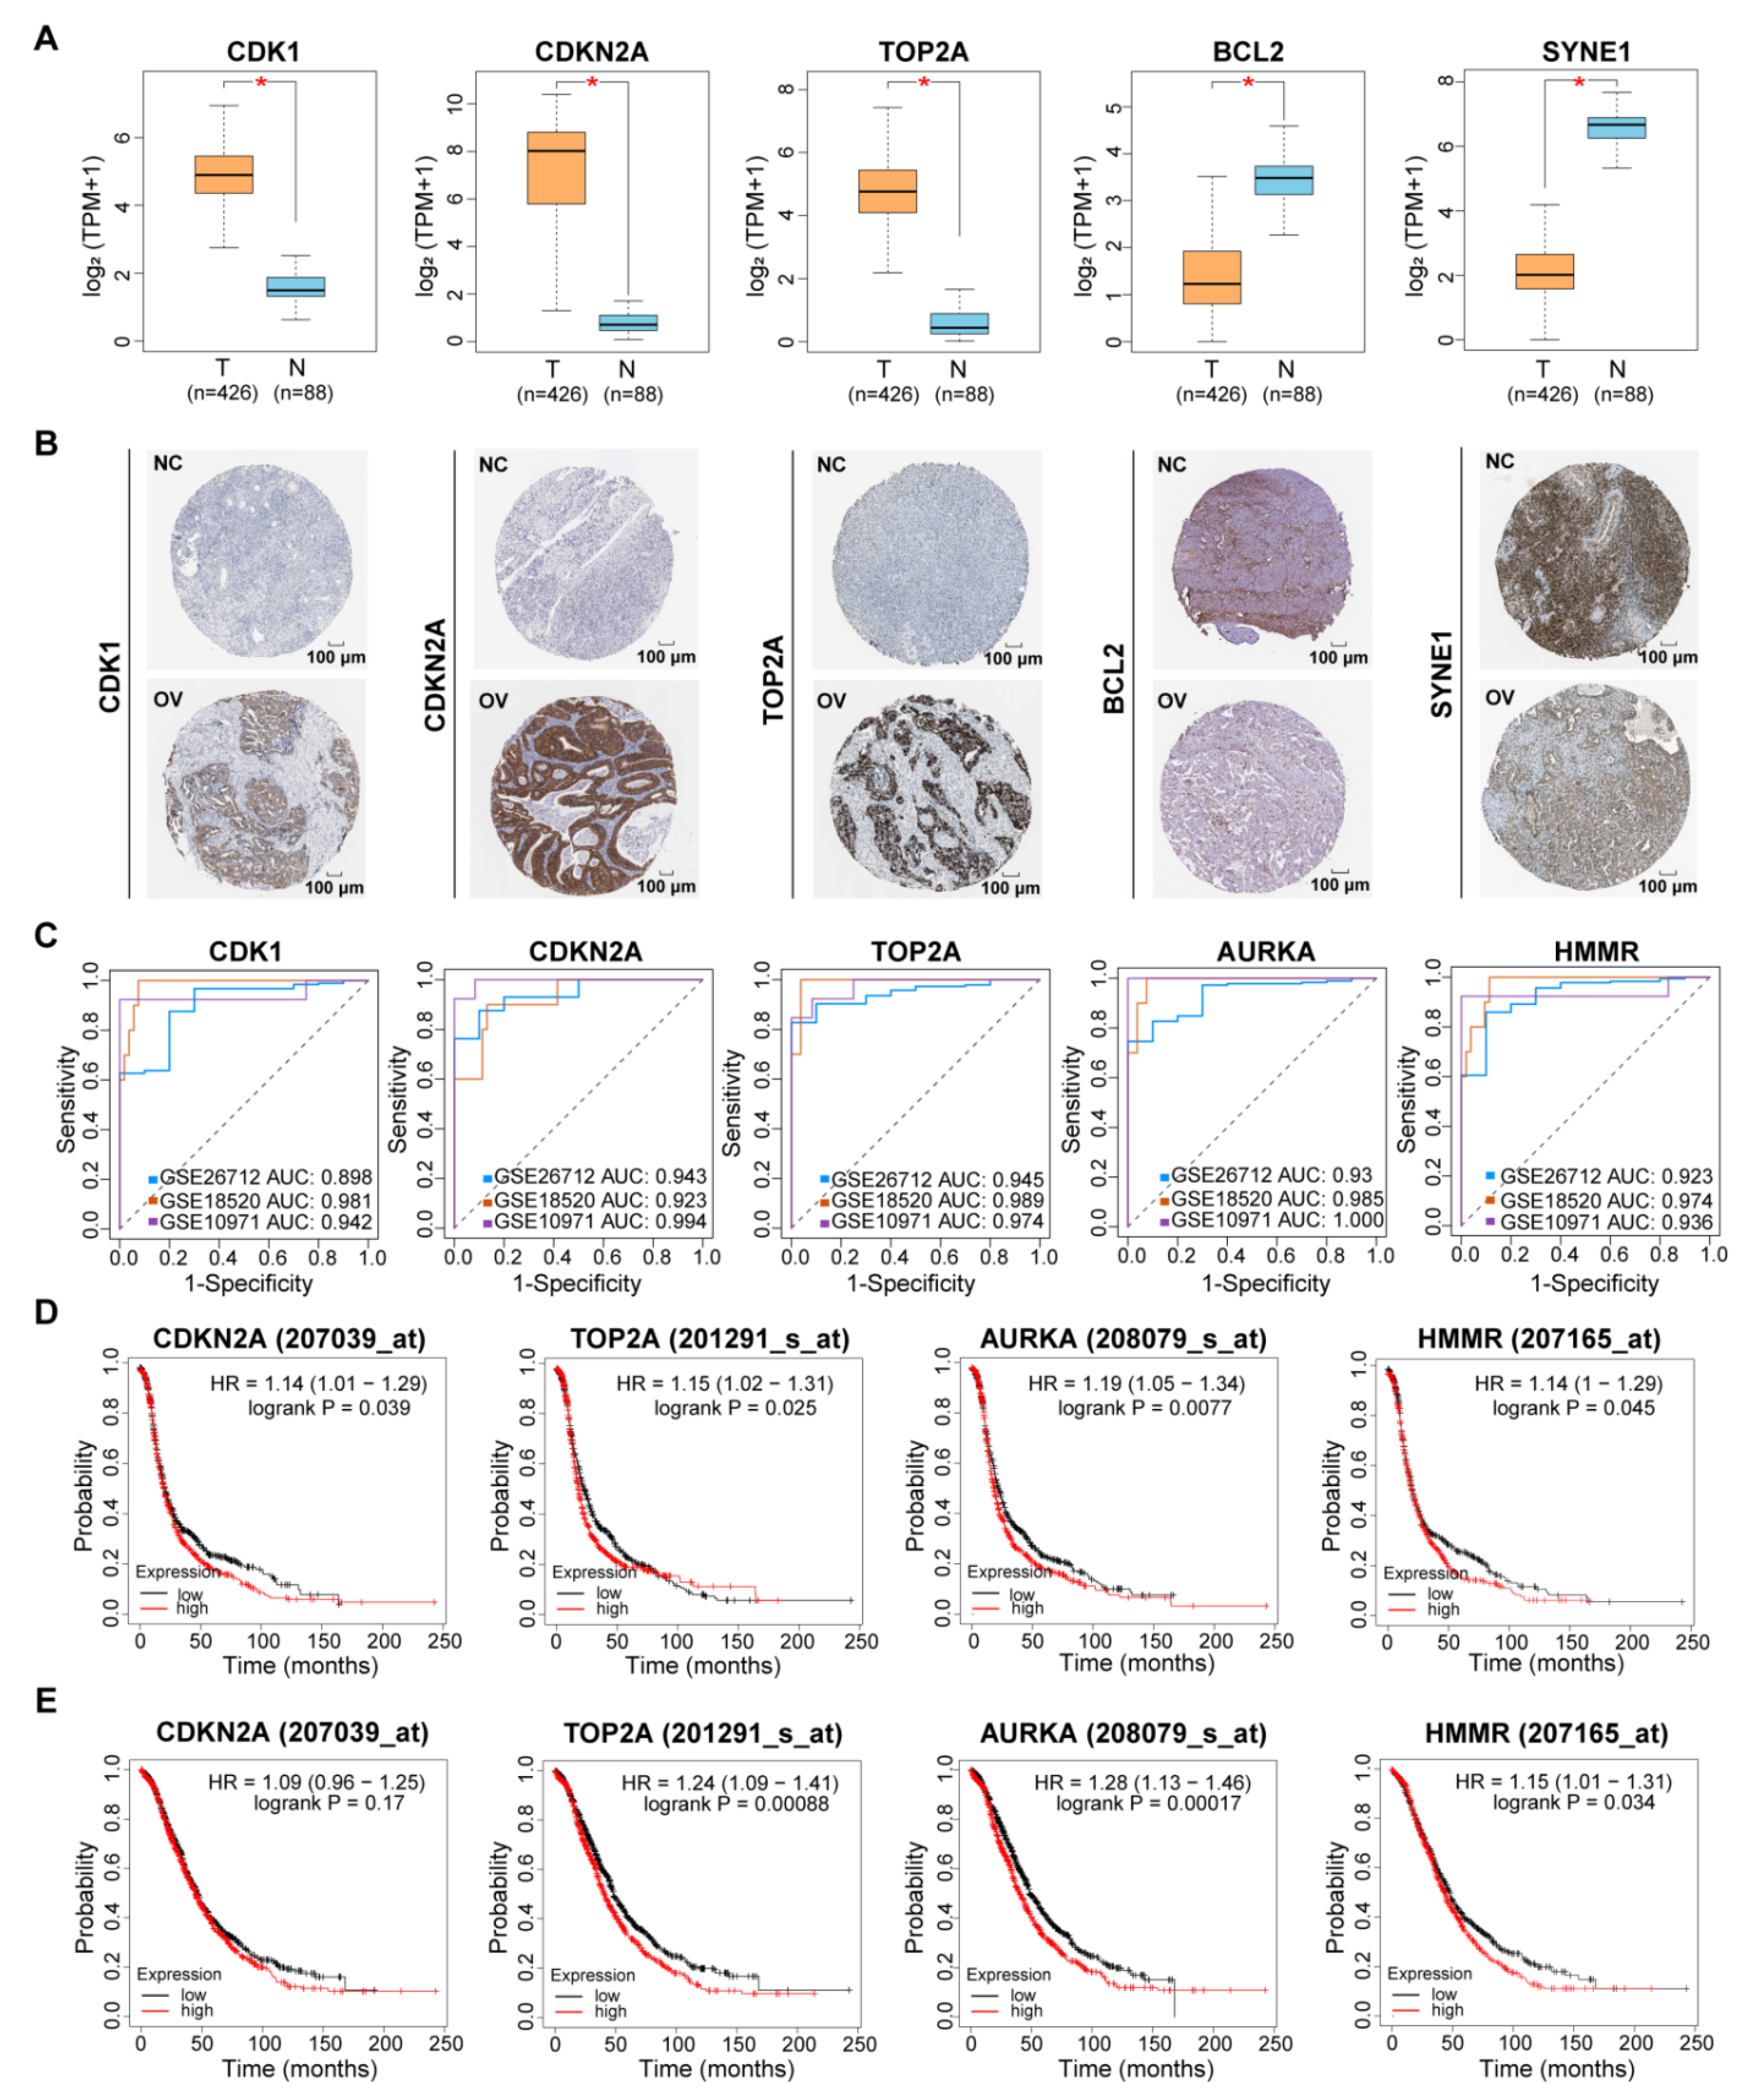
3.5. Functional Characterization of Bottleneck Genes for HGSC Diagnosis and Prognosis

To investigate the diagnostic and prognostic potential of the identified bottleneck genes in HGSC, the expression patterns of the representative bottleneck genes between tumor and normal control tissues were explored at the mRNA and protein levels. As shown in Figure 5A,B, the up-regulation of the representative bottleneck genes CDK1, cyclin-dependent kinase inhibitor 2a (CDKN2A) and topoisomerase II alpha (TOP2A) in OV and normal control tissues was validated using the GEPIA (http://gepia.cancer-pku.cn/ (accessed on 29 April 2022)) [28] and Human Protein Atlas (HPA) (https://www.proteinatlas.org/ (accessed on 29 April 2022)) [29] databases. Similarly, the mRNA and protein abundance of the down-regulated representative bottleneck genes B cell lymphoma 2 (BCL2) and spectrin repeat containing nuclear envelope protein 1 (SYNE1), were also confirmed in OV and normal control tissues by utilizing these two public databases.
Given the potential of up-regulated genes as drug targets, the functional role of up-regulated bottleneck genes was further investigated. Firstly, the sensitivity and specificity of the up-regulated bottleneck genes in distinguishing HGSC patients and normal controls were evaluated in the GSE26712, GSE18520 and GSE10971 datasets by performing ROC curve analyses. As shown in Figure 5C, the AUC values of the up-regulated bottleneck genes CDK1, CDKN2A, TOP2A, aurora kinase A (AURKA) and hyaluronan-mediated motility receptor (HMMR) range from 0.89 to 1.00, indicating their superior diagnostic performance. Furthermore, the prognostic significance of the up-regulated bottleneck genes was explored based on Kaplan–Meier survival analysis. As shown in Figure 5D, the expression levels of the up-regulated bottleneck genes CDKN2A, TOP2A, AURKA and HMMR were closely related to the overall survival of OV patients. In addition, the expression abundances of TOP2A, AURKA and HMMR were also tightly linked to the progression-free survival of OV patients (Figure 5E).

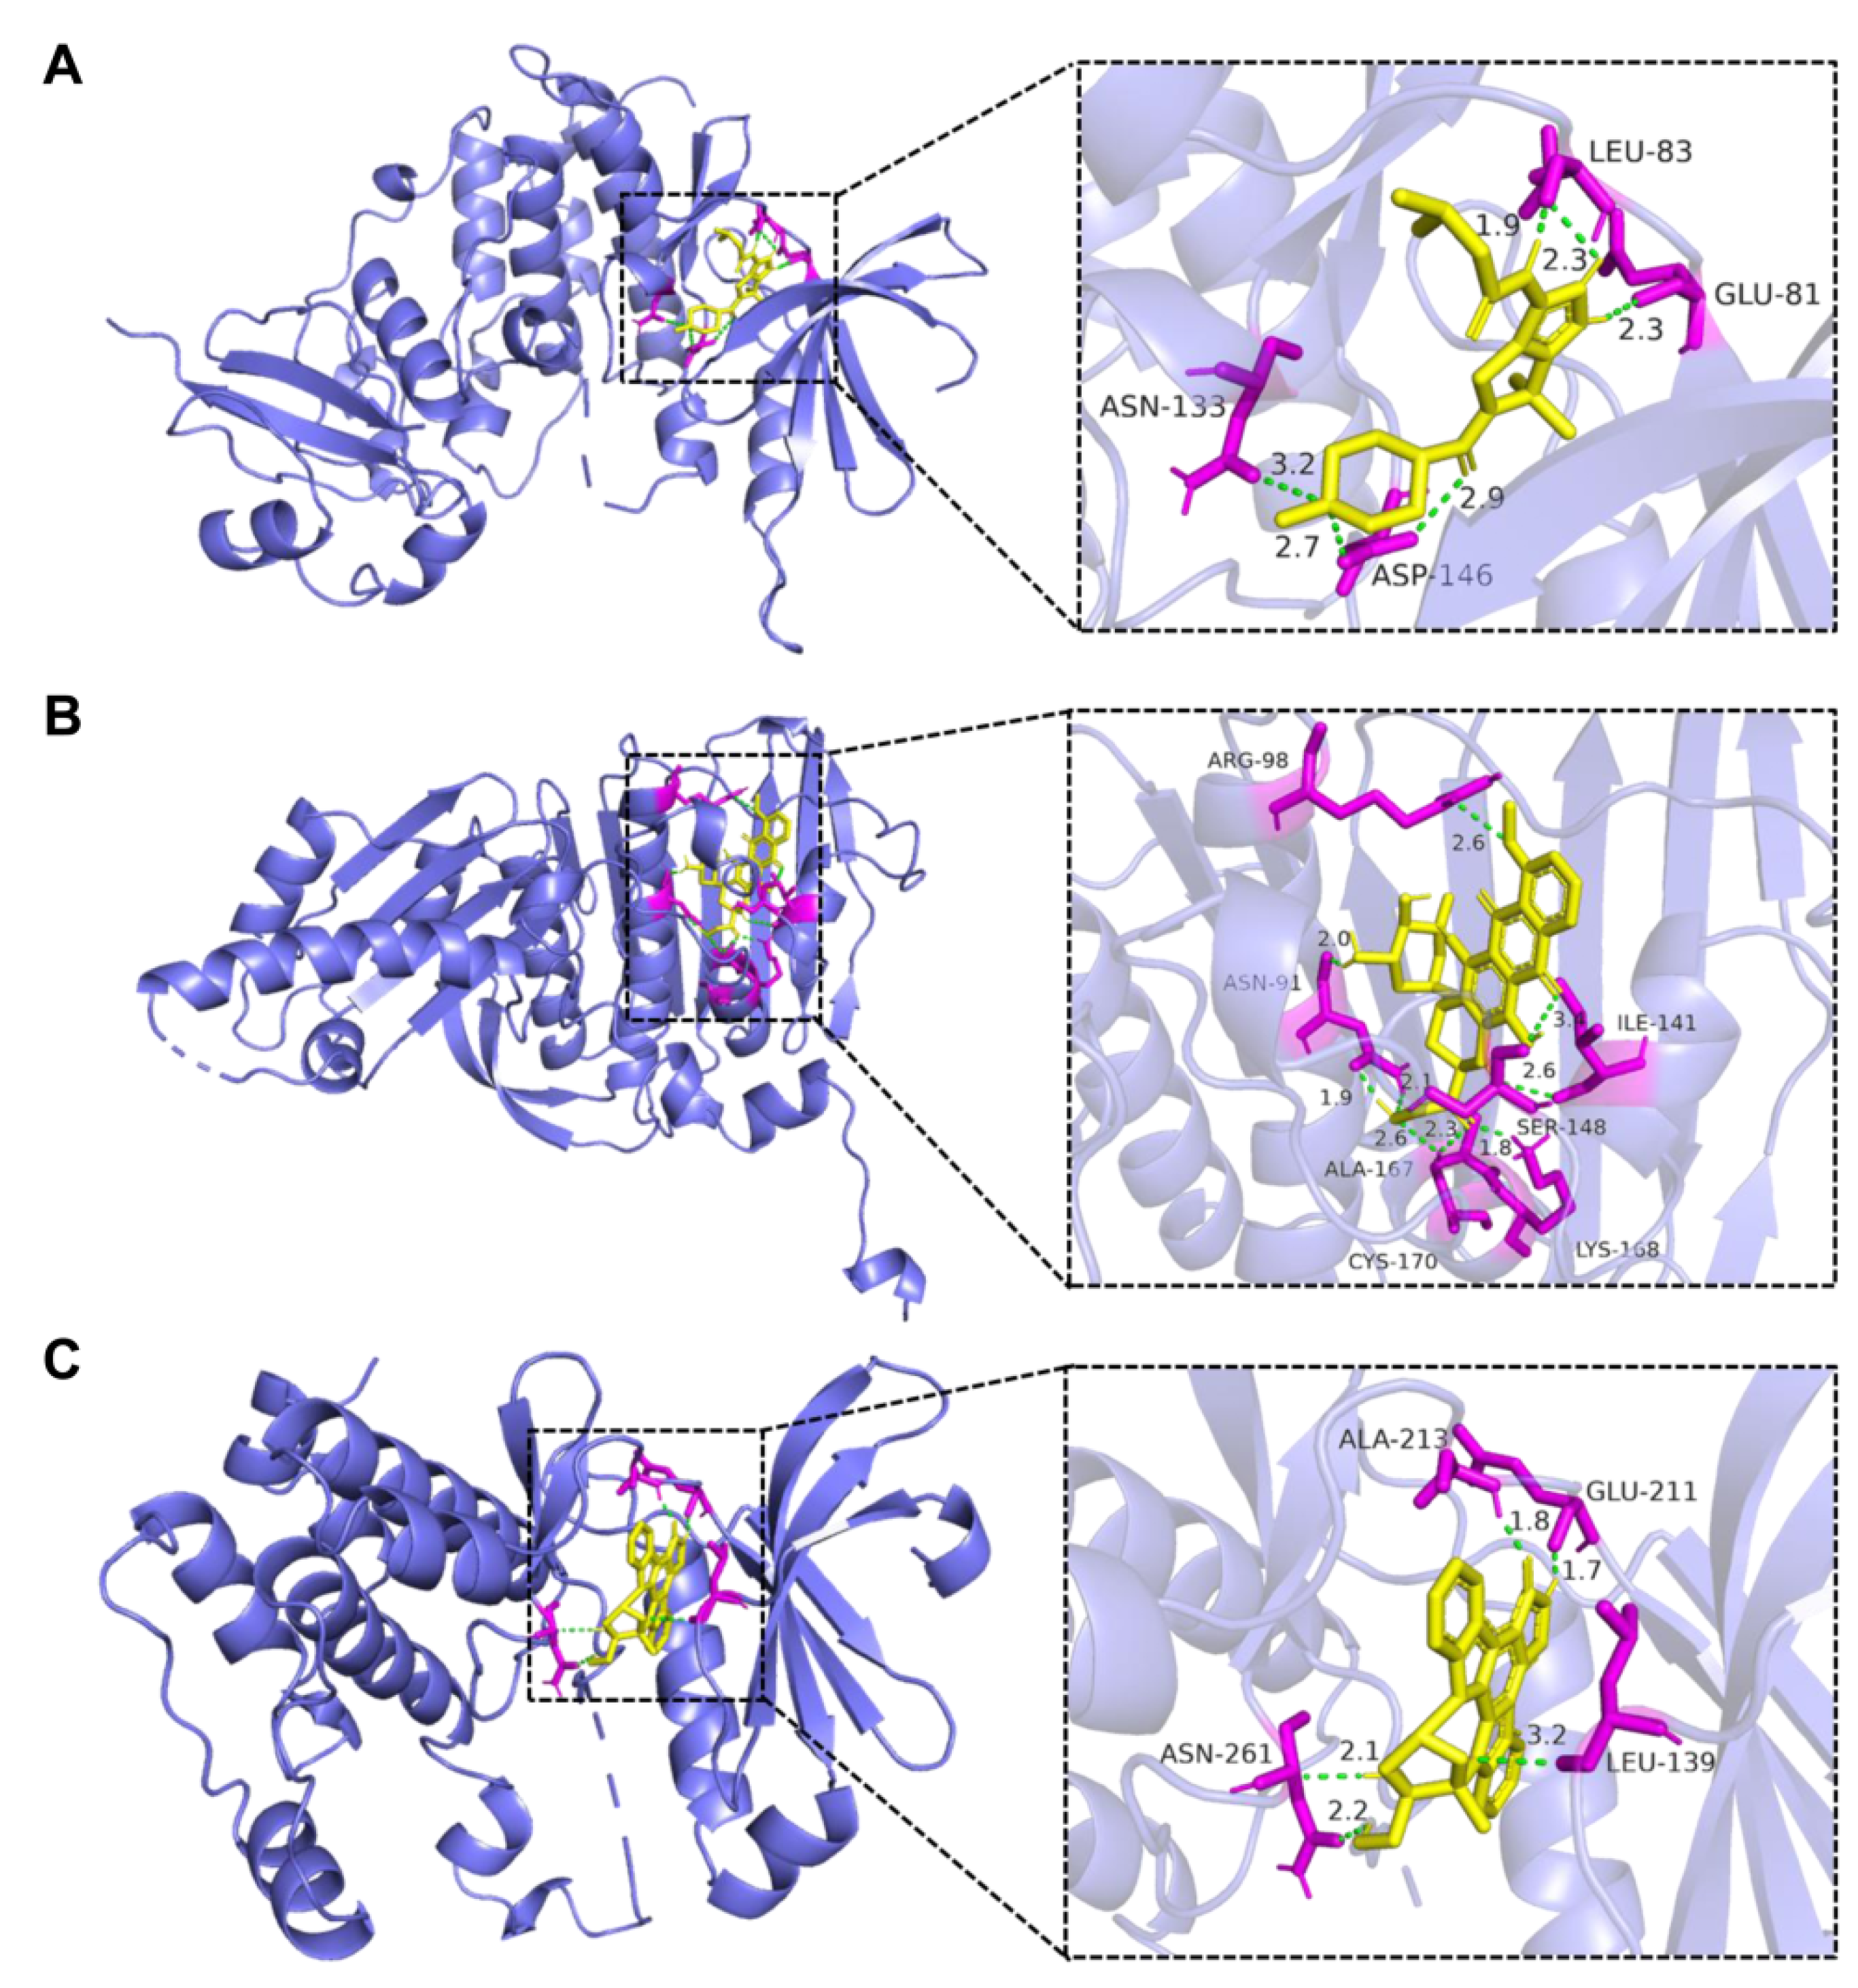
3.6. Interaction between Candidate Drug and Bottleneck Gene through Molecular Docking

The aberrant regulation of cell cycle can trigger uncontrolled cell proliferation, which is a hallmark of various cancer types. Accordingly, multiple cell cycle regulators have emerged as potential targets for cancer therapy. Therefore, in this study we focus on the interaction between cell cycle-related bottleneck proteins (CDK1, TOP2A and AURKA) and candidate drugs with no or little evidence to treat HGSC. Firstly, the crystal structures of CDK1, TOP2A and AURKA were retrieved from the publicly available PDB database using the ID 6GU7, 1ZXM and 6C2T, respectively. Meanwhile, the three-dimensional structure of candidate drugs was searched and downloaded from the PubChem database. Then, molecular docking was performed to investigate the potential interaction between protein receptor and compound ligand. As shown in Figure 6A, PHA-793887 can directly bind to the drug-binding pocket of CDK1 protein with the binding energy of −7.75 kcal/mol, which is consistent with the mechanism of action of PHA-793887 as a CDK inhibitor. Similarly, as a topoisomerase inhibitor, pidorubicine can directly bind to the drug-binding pocket of TOP2A protein with the binding energy of −7.67 kcal/mol (Figure 6B). Besides, lestaurtinib showed a strong binding affinity for AURKA protein with the binding energy of −9.13 kcal/mol (Figure 6C). Taken together, the results indicate that the compounds PHA-793887, pidorubicine and lestaurtinib can bind to the pocket of CDK1, TOP2A and AURKA, respectively, and are promising drugs for the treatment of HGSC patients.

4. Discussion

As the most common and fatal type of OV, HGSC has become a major public health concern [30]. The development of novel therapeutic drugs has always been one of the most important frontier issues in the HGSC field. Notably, with advances in high-throughput sequencing technology, CMap-based computational drug repositioning has emerged as an attractive tool for discovering new applications of existing drugs that can facilitate precision medicine [31]. Moreover, aberrant expression of topologically important genes is a critical symmetry-breaking event that may lead to the perturbation of PPI networks, providing a critical clue for identifying a drug target. Therefore, we aimed in this study to identify novel compounds and predict their targets for the treatment of HGSC based on the CMap database and cancer-specific PPI network.
To screen candidate small-molecule drugs based on the CMap database, the HGSC-associated gene signatures of 98 up-regulated genes and 108 down-regulated genes were firstly selected from three independent datasets, ensuring the reliable identification of genes involved in HGSC pathogenesis. Then, 46 candidate drugs were discovered based on the negative connectivity scores. Among them, multiple drugs, such as amonafide [32], palbociclib [33], vorinostat [34], dactinomycin [35] and apicidin [36], were adopted to treat OV in clinical trials or clinical practice, suggesting the high efficiency of the CMap-based drug discovery approach.
Cancer is characterized by the unrestrained proliferation of tumor cells resulting from the abnormal activity of multiple cell cycle-related proteins [37]. Currently, several inhibitors targeting cell cycle processes are applied in clinical practice as promising treatment strategies for various types of cancer [38], and multiple cell cycle regulators, such as CDK and topoisomerase, are widely considered attractive targets in cancer treatment [39,40]. In the present study, the CDK inhibitor PHA-793887 [41], the topoisomerase inhibitor pidorubicine [42] and the FTL3 inhibitor lestaurtinib [43] were firstly identified as candidate therapeutic drugs for HGSC. Among them, PHA-793887 has shown high efficacy in xenograft models of ovarian, colon and pancreatic cancer [44]; pidorubicine, also known as epirubicin, was identified as a potential agent for breast cancer [45]; lestaurtinib has been demonstrated as a powerful drug for the treatment of acute myeloid leukemia and neuroblastoma [46,47]. In addition, the IC50 value, the half maximal inhibitory concentration, represents the inhibitory activity of certain compounds. Based on the Genomics of Drug Sensitivity in Cancer (GDSC) database (https://www.cancerrxgene.org (accessed on 26 June 2022)), we found that the IC50 values of PHA-793887, pidorubicine (epirubicin) and lestaurtinib on the OV cell line OC-314 were lower than those of the reported OV drugs palbociclib and vorinostat. Therefore, the therapeutic potential of the three drugs in HGSC is a novel discovery worthy of further functional research.
Meanwhile, the up-regulated genes CDK1, TOP2A and AURKA, which play important roles in cell cycle-related processes, were identified as bottleneck nodes with potential as drug targets. Among them, CDK1, as one of the most important CDKs, is a pivotal regulator of cell cycle progression [48]; TOP2A is a critical topoisomerase, responsible for controlling and regulating the topologic changes in DNA during transcription and replication [49]; and AURKA is a mitotic serine/threonine kinase that participates in cell division processes via regulating mitosis [50]. Moreover, based on molecular docking, the newly discovered drugs PHA-793887, pidorubicine and lestaurtinib could directly bind to the reported drug-pockets of CDK1 [51], TOP2A [52] and AURKA [53], respectively, with binding energies lower than −7.6 kcal/mol. It has been demonstrated consistently that PHA-793887 is a promising an-osteosarcoma drug, acting as CDK1 inhibitor [41], and pidorubicine can suppress breast cancer progression by acting as a topoisomerase II inhibitor [42]. Comparatively, there is no evidence that lestaurtinib, a tyrosinse kinase inhibitor, can target the AURKA protein, which is a new finding of this study.
In summary, our study identified 98 up-regulated genes and 108 down-regulated involved in HGSC pathogenesis which were significantly enriched in the cell cycle-related biological process and the cell cycle pathway. By adopting the CMap-based drug repositioning approach, PHA-793887, pidorubicine and lestaurtinib were identified as novel candidate drugs for HGSC treatment. Meanwhile, cell cycle regulators CDK1, TOP2A and AURKA were identified as bottleneck nodes through PPI network analysis, and their expression patterns were validated from the mRNA and protein expression levels. Moreover, the results of molecular docking showed that PHA-793887, pidorubicine and lestaurtinib had a strong binding affinity for CDK1, TOP2A and AURKA, respectively. Therefore, PHA-793887, pidorubicine and lestaurtinib could be used as novel small-molecule drugs to treat HGSC by targeting cell cycle-related processes, for which further experimental validation is needed.

Author Contributions

Writing—Original Draft Preparation, X.Q. and Y.Z.; Writing—Review and Editing, X.Q. and J.C.; Visualization, J.Z. and D.Y.; Supervision, X.Q.; Project Administration, Y.Z. and Y.S. All authors have read and agreed to the published version of the manuscript.

Funding

This work was supported by the National Natural Science Foundation of China (Grant No. 31900490).

Institutional Review Board Statement

Not applicable.

Informed Consent Statement

Not applicable.

Data Availability Statement

The datasets used in this study are from the GEO database, which is publicly available at https://www.ncbi.nlm.nih.gov/geo/ (accessed on 5 January 2022).

Acknowledgments

The authors gratefully thank Weiqiang Guo and Xin Ju from the School of Chemistry and Life Sciences, Suzhou University of Science and Technology, for providing constructive suggestions.

Conflicts of Interest

The authors declare no competing interest.

References

  1. Sung, H.; Ferlay, J.; Siegel, R.L.; Laversanne, M.; Soerjomataram, I.; Jemal, A.; Bray, F. Global Cancer Statistics 2020: GLOBOCAN Estimates of Incidence and Mortality Worldwide for 36 Cancers in 185 Countries. CA Cancer J. Clin. 2021, 71, 209–249. [Google Scholar] [CrossRef]
  2. Sah, S.; Ma, X.; Botros, A.; Gaul, D.A.; Yun, S.R.; Park, E.Y.; Kim, O.; Moore, S.G.; Kim, J.; Fernandez, F.M. Space- and Time-Resolved Metabolomics of a High-Grade Serous Ovarian Cancer Mouse Model. Cancers 2022, 14, 2262. [Google Scholar] [CrossRef] [PubMed]
  3. Hu, Y.W.; Pan, J.B.; Shah, P.; Ao, M.H.; Thomas, S.N.; Liu, Y.; Chen, L.J.; Schnaubelt, M.; Clark, D.J.; Rodriguez, H.; et al. Integrated Proteomic and Glycoproteomic Characterization of Human High-Grade Serous Ovarian Carcinoma. Cell Rep. 2020, 33, 108276. [Google Scholar] [CrossRef] [PubMed]
  4. Li, J.; Zheng, S.; Chen, B.; Butte, A.J.; Swamidass, S.J.; Lu, Z. A survey of current trends in computational drug repositioning. Brief. Bioinform. 2016, 17, 2–12. [Google Scholar] [CrossRef] [PubMed] [Green Version]
  5. Lamb, J.; Crawford, E.D.; Peck, D.; Modell, J.W.; Blat, I.C.; Wrobel, M.J.; Lerner, J.; Brunet, J.-P.; Subramanian, A.; Ross, K.N. The Connectivity Map: Using gene-expression signatures to connect small molecules, genes, and disease. Science 2006, 313, 1929–1935. [Google Scholar] [CrossRef] [Green Version]
  6. Subramanian, A.; Narayan, R.; Corsello, S.M.; Peck, D.D.; Natoli, T.E.; Lu, X.; Gould, J.; Davis, J.F.; Tubelli, A.A.; Asiedu, J.K. A next generation connectivity map: L1000 platform and the first 1,000,000 profiles. Cell 2017, 171, 1437–1452.e17. [Google Scholar] [CrossRef]
  7. Zhang, L.; Kang, W.; Lu, X.; Ma, S.; Dong, L.; Zou, B. Weighted gene co-expression network analysis and connectivity map identifies lovastatin as a treatment option of gastric cancer by inhibiting HDAC2. Gene 2019, 681, 15–25. [Google Scholar] [CrossRef]
  8. Zou, D.; Bai, J.; Lu, E.; Yang, C.; Liu, J.; Wen, Z.; Liu, X.; Jin, Z.; Xu, M.; Jiang, L. Identification of Novel Drug Candidate for Epithelial Ovarian Cancer via In Silico Investigation and In Vitro Validation. Front. Oncol. 2021, 11, 745590. [Google Scholar] [CrossRef]
  9. De Donato, M.; Babini, G.; Mozzetti, S.; Buttarelli, M.; Ciucci, A.; Arduini, G.; De Rosa, M.C.; Scambia, G.; Gallo, D. KLF7: A new candidate biomarker and therapeutic target for high-grade serous ovarian cancer. J. Exp. Clin. Cancer Res. 2020, 39, 1–17. [Google Scholar] [CrossRef]
  10. Huang, D.; Chowdhury, S.; Wang, H.; Savage, S.R.; Ivey, R.G.; Kennedy, J.J.; Whiteaker, J.R.; Lin, C.; Hou, X.; Oberg, A.L. Multiomic analysis identifies CPT1A as a potential therapeutic target in platinum-refractory, high-grade serous ovarian cancer. Cell Rep. Med. 2021, 2, 10047s1. [Google Scholar] [CrossRef]
  11. Robert, A.M.; Robert, C.S.; Robert, L. Symmetry breaking in biological systems. From molecules to tissues. Struct. Chem. 2007, 18, 899–907. [Google Scholar] [CrossRef]
  12. Safari-Alighiarloo, N.; Taghizadeh, M.; Rezaei-Tavirani, M.; Goliaei, B.; Peyvandi, A.A. Protein-protein interaction networks (PPI) and complex diseases. Gastroenterol. Hepatol. Bed Bench 2014, 7, 17. [Google Scholar] [PubMed]
  13. Athanasios, A.; Charalampos, V.; Vasileios, T. Protein-protein interaction (PPI) network: Recent advances in drug discovery. Curr. Drug Metab. 2017, 18, 5–10. [Google Scholar] [CrossRef] [PubMed]
  14. Nithya, C.; Kiran, M.; Nagarajaram, H.A. Comparative analysis of Pure Hubs and Pure Bottlenecks in Human Protein-protein Interaction Networks. bioRxiv 2021. [Google Scholar] [CrossRef]
  15. Bonome, T.; Levine, D.A.; Shih, J.; Randonovich, M.; Pise-Masison, C.A.; Bogomolniy, F.; Ozbun, L.; Brady, J.; Barrett, J.C.; Boyd, J. A gene signature predicting for survival in suboptimally debulked patients with ovarian cancer. Cancer Res. 2008, 68, 5478–5486. [Google Scholar] [CrossRef] [PubMed] [Green Version]
  16. Mok, S.C.; Bonome, T.; Vathipadiekal, V.; Bell, A.; Johnson, M.E.; Park, D.-C.; Hao, K.; Yip, D.K.; Donninger, H.; Ozbun, L. A gene signature predictive for outcome in advanced ovarian cancer identifies a survival factor: Microfibril-associated glycoprotein 2. Cancer Cell 2009, 16, 521–532. [Google Scholar] [CrossRef] [PubMed] [Green Version]
  17. Tone, A.A.; Begley, H.; Sharma, M.; Murphy, J.; Rosen, B.; Brown, T.J.; Shaw, P.A. Gene expression profiles of luteal phase fallopian tube epithelium from BRCA mutation carriers resemble high-grade serous carcinoma. Clin. Cancer Res. 2008, 14, 4067–4078. [Google Scholar] [CrossRef] [Green Version]
  18. Ritchie, M.E.; Phipson, B.; Wu, D.; Hu, Y.; Law, C.W.; Shi, W.; Smyth, G.K. limma powers differential expression analyses for RNA-sequencing and microarray studies. Nucleic Acids Res. 2015, 43, e47. [Google Scholar] [CrossRef]
  19. Wu, T.; Hu, E.; Xu, S.; Chen, M.; Guo, P.; Dai, Z.; Feng, T.; Zhou, L.; Tang, W.; Zhan, L. clusterProfiler 4.0: A universal enrichment tool for interpreting omics data. Innovation 2021, 2, 100141. [Google Scholar] [CrossRef]
  20. Musa, A.; Ghoraie, L.S.; Zhang, S.-D.; Glazko, G.; Yli-Harja, O.; Dehmer, M.; Haibe-Kains, B.; Emmert-Streib, F. A review of connectivity map and computational approaches in pharmacogenomics. Brief. Bioinform. 2018, 19, 506–523. [Google Scholar]
  21. Szklarczyk, D.; Gable, A.L.; Nastou, K.C.; Lyon, D.; Kirsch, R.; Pyysalo, S.; Doncheva, N.T.; Legeay, M.; Fang, T.; Bork, P. The STRING database in 2021: Customizable protein–protein networks, and functional characterization of user-uploaded gene/measurement sets. Nucleic Acids Res. 2021, 49, D605–D612. [Google Scholar] [CrossRef] [PubMed]
  22. Kohl, M.; Wiese, S.; Warscheid, B. Cytoscape: Software for visualization and analysis of biological networks. In Data Mining in Proteomics; Humana Press: Totowa, NJ, USA, 2011; pp. 291–303. [Google Scholar]
  23. Robin, X.; Turck, N.; Hainard, A.; Tiberti, N.; Lisacek, F.; Sanchez, J.-C.; Müller, M. pROC: An open-source package for R and S+ to analyze and compare ROC curves. BMC Bioinform. 2011, 12, 1–8. [Google Scholar] [CrossRef] [PubMed]
  24. Lánczky, A.; Győrffy, B. Web-based survival analysis tool tailored for medical research (KMplot): Development and implementation. J. Med. Internet Res. 2021, 23, e27633. [Google Scholar] [CrossRef] [PubMed]
  25. Rose, P.W.; Prlić, A.; Altunkaya, A.; Bi, C.; Bradley, A.R.; Christie, C.H.; Costanzo, L.D.; Duarte, J.M.; Dutta, S.; Feng, Z.; et al. The RCSB protein data bank: Integrative view of protein, gene and 3D structural information. Nucleic Acids Res. 2017, 45, D271–D281. [Google Scholar] [PubMed]
  26. Norgan, A.P.; Coffman, P.K.; Kocher, J.-P.A.; Katzmann, D.J.; Sosa, C.P. Multilevel parallelization of AutoDock 4.2. J. Cheminform. 2011, 3, 1–9. [Google Scholar] [CrossRef] [PubMed] [Green Version]
  27. DeLano, W.L. Pymol: An open-source molecular graphics tool. CCP4 Newsl. Protein Crystallogr. 2002, 40, 82–92. [Google Scholar]
  28. Tang, Z.; Li, C.; Kang, B.; Gao, G.; Li, C.; Zhang, Z. GEPIA: A web server for cancer and normal gene expression profiling and interactive analyses. Nucleic Acids Res. 2017, 45, W98–W102. [Google Scholar] [CrossRef] [Green Version]
  29. Uhlén, M.; Fagerberg, L.; Hallström, B.M.; Lindskog, C.; Oksvold, P.; Mardinoglu, A.; Sivertsson, Å.; Kampf, C.; Sjöstedt, E.; Asplund, A. Tissue-based map of the human proteome. Science 2015, 347, 1260419. [Google Scholar] [CrossRef]
  30. Labidi-Galy, S.I.; Papp, E.; Hallberg, D.; Niknafs, N.; Adleff, V.; Noe, M.; Bhattacharya, R.; Novak, M.; Jones, S.; Phallen, J. High grade serous ovarian carcinomas originate in the fallopian tube. Nat. Commun. 2017, 8, 1093. [Google Scholar] [CrossRef]
  31. Qu, X.A.; Rajpal, D.K. Applications of Connectivity Map in drug discovery and development. Drug Discov. Today 2012, 17, 1289–1298. [Google Scholar] [CrossRef]
  32. Gallion, H.H.; Liu, P.; Alberts, D.E.; O’Toole, R.V.; O’Sullivan, J.; Mills, G.; Smith, H.O.; Hynes, H.E. Phase II trial of amonafide in previously treated patients with advanced ovarian cancer: A Southwest Oncology Group study. Gynecol. Oncol. 1992, 46, 230–232. [Google Scholar] [CrossRef]
  33. Ho, G.F. Palbociclib in the treatment of recurrent ovarian cancer. Gynecol. Oncol. Rep. 2020, 34, 100626. [Google Scholar]
  34. Modesitt, S.C.; Sill, M.; Hoffman, J.S.; Bender, D.P. A phase II study of vorinostat in the treatment of persistent or recurrent epithelial ovarian or primary peritoneal carcinoma: A Gynecologic Oncology Group study. Gynecol. Oncol. 2008, 109, 182–186. [Google Scholar] [CrossRef]
  35. Gershenson, D.M.; Copeland, L.J.; Kavanagh, J.J.; Cangir, A.; Junco, G.D.; Saul, P.B.; Stringer, C.A.; Freedman, R.S.; Edwards, C.L.; Wharton, J.T. Treatment of malignant nondysgerminomatous germ cell tumors of the ovary with vincristine, dactinomycin, and cyclophosphamide. Cancer 1985, 56, 2756–2761. [Google Scholar] [CrossRef]
  36. Ueda, T.; Takai, N.; Nishida, M.; Nasu, K.; Narahara, H. Apicidin, a novel histone deacetylase inhibitor, has profound anti-growth activity in human endometrial and ovarian cancer cells. Int. J. Mol. Med. 2007, 19, 301–308. [Google Scholar] [CrossRef] [PubMed] [Green Version]
  37. Williams, G.H.; Stoeber, K. The cell cycle and cancer. J. Pathol. 2012, 226, 352–364. [Google Scholar] [CrossRef]
  38. Schwartz, G.K.; Shah, M.A. Targeting the cell cycle: A new approach to cancer therapy. J. Clin. Oncol. 2005, 23, 9408–9421. [Google Scholar] [CrossRef]
  39. Sanchez-Martinez, C.; Gelbert, L.M.; Lallena, M.J.; de Dios, A. Cyclin dependent kinase (CDK) inhibitors as anticancer drugs. Bioorg. Med. Chem. Lett. 2015, 25, 3420–3435. [Google Scholar] [CrossRef]
  40. Kathiravan, M.K.; Khilare, M.M.; Nikoomanesh, K.; Chothe, A.S.; Jain, K.S. Topoisomerase as target for antibacterial and anticancer drug discovery. J. Enzym. Inhib. Med. Chem. 2013, 28, 419–435. [Google Scholar] [CrossRef]
  41. Wu, B.; Yang, W.; Fu, Z.; Xie, H.; Guo, Z.; Liu, D.; Ge, J.; Zhong, S.; Liu, L.; Liu, J. Selected using bioinformatics and molecular docking analyses, PHA-793887 is effective against osteosarcoma. Aging 2021, 13, 16425. [Google Scholar] [CrossRef]
  42. Villanueva, P.J.; Gutierrez, D.A.; Contreras, L.; Parra, K.; Segura-Cabrera, A.; Varela-Ramirez, A.; Aguilera, R.J. The Antimalarial Drug Pyronaridine Inhibits Topoisomerase II in Breast Cancer Cells and Hinders Tumor Progression In Vivo. Clin. Cancer Drugs 2021, 8, 50–56. [Google Scholar] [CrossRef] [PubMed]
  43. Brown, P.A.; Kairalla, J.A.; Hilden, J.M.; Dreyer, Z.E.; Carroll, A.J.; Heerema, N.A.; Wang, C.; Devidas, M.; Gore, L.; Salzer, W.L. FLT3 inhibitor lestaurtinib plus chemotherapy for newly diagnosed KMT2A-rearranged infant acute lymphoblastic leukemia: Children’s Oncology Group trial AALL0631. Leukemia 2021, 35, 1279–1290. [Google Scholar] [CrossRef] [PubMed]
  44. Brasca, M.G.; Albanese, C.; Alzani, R.; Amici, R.; Avanzi, N.; Ballinari, D.; Bischoff, J.; Borghi, D.; Casale, E.; Croci, V. Optimization of 6, 6-dimethyl pyrrolo [3, 4-c] pyrazoles: Identification of PHA-793887, a potent CDK inhibitor suitable for intravenous dosing. Bioorg. Med. Chem. 2010, 18, 1844–1853. [Google Scholar] [CrossRef] [PubMed]
  45. Poole, C.J.; Earl, H.M.; Hiller, L.; Dunn, J.A.; Bathers, S.; Grieve, R.J.; Spooner, D.A.; Agrawal, R.K.; Fernando, I.N.; Brunt, A.M. Epirubicin and cyclophosphamide, methotrexate, and fluorouracil as adjuvant therapy for early breast cancer. N. Engl. J. Med. 2006, 355, 1851–1862. [Google Scholar] [CrossRef] [PubMed] [Green Version]
  46. Shabbir, M.; Stuart, R. Lestaurtinib, a multitargeted tyrosinse kinase inhibitor: From bench to bedside. Expert Opin. Investig. Drugs 2010, 19, 427–436. [Google Scholar] [CrossRef]
  47. Minturn, J.E.; Evans, A.E.; Villablanca, J.G.; Yanik, G.A.; Park, J.R.; Shusterman, S.; Groshen, S.; Hellriegel, E.T.; Bensen-Kennedy, D.; Matthay, K.K. Phase I trial of lestaurtinib for children with refractory neuroblastoma: A new approaches to neuroblastoma therapy consortium study. Cancer Chemother. Pharmacol. 2011, 68, 1057–1065. [Google Scholar] [CrossRef] [Green Version]
  48. Leal-Esteban, L.C.; Fajas, L. Cell cycle regulators in cancer cell metabolism. Biochim. Biophys. Acta (BBA)-Mol. Basis Dis. 2020, 1866, 165715. [Google Scholar]
  49. Gao, Y.; Zhao, H.; Ren, M.; Chen, Q.; Li, J.; Li, Z.; Yin, C.; Yue, W. TOP2A promotes tumorigenesis of high-grade serous ovarian cancer by regulating the TGF-β/Smad pathway. J. Cancer 2020, 11, 4181. [Google Scholar] [CrossRef]
  50. Du, R.; Huang, C.; Liu, K.; Li, X.; Dong, Z. Targeting AURKA in Cancer: Molecular mechanisms and opportunities for Cancer therapy. Mol. Cancer 2021, 20, 15. [Google Scholar] [CrossRef]
  51. Wood, D.J.; Korolchuk, S.; Tatum, N.J.; Wang, L.Z.; Endicott, J.A.; Noble, M.E.M.; Martin, M.P. Differences in the Conformational Energy Landscape of CDK1 and CDK2 Suggest a Mechanism for Achieving Selective CDK Inhibition. Cell Chem. Biol. 2019, 26, 121–130.e5. [Google Scholar] [CrossRef] [Green Version]
  52. Wei, H.; Ruthenburg, A.J.; Bechis, S.K.; Verdine, G.L. Nucleotide-dependent domain movement in the ATPase domain of a human type IIA DNA topoisomerase. J. Biol. Chem. 2005, 280, 37041–37047. [Google Scholar] [CrossRef] [PubMed] [Green Version]
  53. Gong, X.Q.; Du, J.; Parsons, S.H.; Merzoug, F.F.; Webster, Y.; Iversen, P.W.; Chio, L.C.; Van Horn, R.D.; Lin, X.; Blosser, W.; et al. Aurora A Kinase Inhibition Is Synthetic Lethal with Loss of the RB1 Tumor Suppressor Gene. Cancer Discov. 2019, 9, 248–263. [Google Scholar] [CrossRef] [PubMed] [Green Version]
Figure 1. Identification of the overlapping DEGs in three transcriptome datasets of HGSC. (AC) Volcano plot shows the DEGs identified in GSE26712 (A), GSE10971 (B) and GSE18520 (C). (D,E) Venn plot shows the overlapping number of up-regulated DEGs (D) and down-regulated DEGs (E).
Symmetry 14 01403 g001
Figure 2. Functional enrichment analysis of the overlapping DEGs identified in the three HGSC datasets. (A) Top 10 significantly enriched biological process-associated GO terms of the overlapping DEGs identified in the GSE26712, GSE10971 and GSE18520 datasets. (B). Enriched KEGG pathways of the overlapping DEGs identified in the GSE26712, GSE10971 and GSE18520 datasets.
Symmetry 14 01403 g002
Figure 3. Mechanism of action of the 46 candidate drugs for HGSC repositioned based on the CMap database.
Symmetry 14 01403 g003
Figure 4. The PPI network of overlapping DEGs in HGSC. (A) Layout of the PPI network constructed by the overlapping DEGs in the GSE26712, GSE10971 and GSE18520 datasets. Orange diamond represents an up-regulated bottleneck gene; blue diamond represents a down-regulated bottleneck gene; orange circle represents an up-regulated non-bottleneck gene; blue circle represents a down-regulated non-bottleneck gene. (B) List of bottleneck genes identified in the PPI network.
Symmetry 14 01403 g004
Figure 5. Functional characterization of the representative bottleneck genes in the HGSC-related PPI network. (A) Boxplots show the expression patterns of the representative bottleneck genes CDK1, CDKN2A, TOP2A, BCL2 and SYNE1, between OV tumor and normal control samples in TCGA and GTEx datasets, collected with the GEPIA online tool. T, tumor; N, normal control. (B) Immunohistochemical results show the protein expression levels of the representative bottleneck genes CDK1, CDKN2A, TOP2A, BCL2 and SYNE1 in normal control (NC) and OV samples from the Human Protein Atlas database. (C) The diagnostic role of the representative bottleneck gene CDK1, CDKN2A, TOP2A, AURKA and HMMR for HGSC was evaluated by ROC curve analysis in the GSE26712, GSE10971 and GSE18520 datasets. (D,E) Kaplan–Meier survival curves show the prognostic value of representative bottleneck gene CDKN2A, TOP2A, AURKA and HMMR in predicting the overall survival (D) and progression-free survival (E) of OV patients.
Symmetry 14 01403 g005
Figure 6. Molecular docking between novel HGSC candidate drugs and their potential targets. (A) The interaction between PHA-793887 and CDK1 was determined by molecular docking analysis. (B) The interaction between pidorubicine and TOP2A was determined by molecular docking analysis. (C) The interaction between lestaurtinib and AURKA was determined by molecular docking analysis.
Symmetry 14 01403 g006
Table 1. Candidate small molecules for HGSC treatment based on CMap database.
NumberNameScoreDescription
1purvalanol-a−99.75CDK inhibitor
2aminopurvalanol-a−99.72Tyrosine kinase inhibitor
3mycophenolic-acid−99.22Dehydrogenase inhibitor
4Amonafide−99.19Topoisomerase inhibitor
5PI-103−98.87MTOR inhibitor
6PI-828−98.85PI3K inhibitor
7AS-605240−98.63PI3K inhibitor
8AZD-8055−98.52MTOR inhibitor
9Ellipticine−98.48Topoisomerase inhibitor
10Palbociclib−98.41CDK inhibitor
11KU-0060648−98.34DNA dependent protein kinase inhibitor
12JAK3-inhibitor-VI−98.27JAK inhibitor
13VAMA-37−98.27DNA dependent protein kinase inhibitor
14Vorinostat−98.27HDAC inhibitor
15Staurosporine−98.2PKC inhibitor
16CGP-60474−98.17CDK inhibitor
17ZG-10−98.1JNK inhibitor
18TG-101348−98.1FLT3 inhibitor
19ISOX−98.1HDAC inhibitor
20PHA-793887−98.06CDK inhibitor
21bisindolylmaleimide-ix−98.06CDK inhibitor
22Dactinomycin−97.99RNA polymerase inhibitor
23JNJ-7706621−97.96CDK inhibitor
24PF-562271−97.89Focal adhesion kinase inhibitor
25Wortmannin−97.87PI3K inhibitor
26Cerivastatin−97.85HMGCR inhibitor
27mycophenolate-mofetil−97.79Dehydrogenase inhibitor
28chromomycin-a3−97.74DNA binding agent
29HG-5-113-01−97.74Protein kinase inhibitor
30THM-I-94−97.74HDAC inhibitor
31Apicidin−97.64HDAC inhibitor
32Lestaurtinib−97.6FLT3 inhibitor
33Pidorubicine−97.6Topoisomerase inhibitor
34Doxorubicin−97.53Topoisomerase inhibitor
35Dactolisib−97.51MTOR inhibitor
36Etoposide−97.5Topoisomerase inhibitor
37Mitoxantrone−97.5Topoisomerase inhibitor
38Dacinostat−97.46HDAC inhibitor
39Triptolide−97.39RNA polymerase inhibitor
40A-443644−97.32AKT inhibitor
41verrucarin-a−97.25Protein synthesis inhibitor
42Scriptaid−97.22HDAC inhibitor
43Alisertib−97.18Aurora kinase inhibitor
44JNK-9L−97.18JNK inhibitor
45KU-0063794−97.14MTOR inhibitor
46Alvocidib−97.04CDK inhibitor
Publisher’s Note: MDPI stays neutral with regard to jurisdictional claims in published maps and institutional affiliations.

