Article

Defect-Induced Luminescence Quenching of 4H-SiC Single Crystal Grown by PVT Method through a Control of Incorporated Impurity Concentration

1
Semiconductor Materials Center, Korea Institute of Ceramic Engineering & Technology, Jinju 52851, Korea
2
School of Electronic and Electrical Engineering, College of IT Engineering, Kyungpook National University, Daegu 41566, Korea
*
Authors to whom correspondence should be addressed.
These authors contributed equally to this work.
Compounds 2022, 2(1), 68-79; https://doi.org/10.3390/compounds2010006
Submission received: 30 December 2021 / Revised: 17 February 2022 / Accepted: 21 February 2022 / Published: 2 March 2022
(This article belongs to the Special Issue Feature Papers in Compounds)

Abstract

:
The structural defect effect of impurities on silicon carbide (SiC) was studied to determine the luminescence properties with temperature-dependent photoluminescence (PL) measurements. Single 4H-SiC crystals were fabricated using three different 3C-SiC starting materials and the physical vapor transport method at a high temperature and 100 Pa in an argon atmosphere. The correlation between the impurity levels and the optical and fluorescent properties was confirmed using Raman spectroscopy, X-ray diffraction, inductively coupled plasma atomic emission spectroscopy (ICP-OES), UV-Vis-NIR spectrophotometry, and PL measurements. The PL intensity was observed in all three single 4H-SiC crystals, with the highest intensities at low temperatures. Two prominent PL emission peaks at 420 and 580 nm were observed at temperatures below 50 K. These emission peaks originated from the impurity concentration due to the incorporation of N, Al, and B in the single 4H-SiC crystals and were supported by ICP-OES. The emission peaks at 420 and 580 nm occurred due to donor–acceptor-pair recombination through the incorporated concentrations of nitrogen, boron, and aluminum in the single 4H-SiC crystals. The results of the present work provide evidence based on the low-temperature PL that the mechanism of PL emission in single 4H-SiC crystals is mainly related to the transitions due to defect concentration.

1. Introduction

Silicon carbide (SiC) has attracted the attention of many researchers due to its outstanding electrical, mechanical, and thermal properties. SiC has been used in many industries for power devices and optoelectronic applications [1,2,3,4,5,6,7,8]. There are more than 200 polytypes of Si-C, with cubically (3C-SiC) and hexagonally (4H-SiC or 6H-SiC) modified compounds being the most used. The differences come from the stacking sequence of the hexagonal structure bonded in the Si-C bilayers [1,2,3,4,5,6,7,8]. The existence of polytypes implies that many different stable atomic arrangements and symmetries can be obtained, including hexagonal, cubic, and rhombohedral arrangements [6,7].
Si-C absorbs UV light and is transparent to visible light, making it an ideal material for optically based sensors or photodetectors at UV wavelengths [8]. A thorough analysis of the carrier recombination mechanisms in SiC is needed to understand the underlying physics of the luminescence phenomena for industrial applications. Photoluminescence (PL) is a standard method for characterizing the emission properties of semiconductor materials and can provide information about defect-related carrier transport dynamics [8]. Of the few studies reporting the optical properties of SiC, many have looked at the 3C-, 6H-, and 4H-SiC structures [4,5,6,7,8]. The 4H-SiC structure has been shown to have several defects and PL peaks in the band gap. The PL spectra in 4H-SiC originate from a combination of phonon-instigated electronic transitions caused by defects in SiC [9,10,11]. This observation of luminescence quenching is not evidence of electronic doping [12,13]. Therefore, it is necessary to determine the additional factors that affect the PL quenching and luminescence properties of 4H-SiC by characterizing it fully.
In this study, we investigated the structural and optical properties of the luminescence quenching of 4H-SiC crystals grown with the physical vapor transport (PVT) method. Control of the structure was achieved by using differently treated starting materials of 3C-SiC and by controlling the boron, aluminum, and nitrogen concentrations. The structural defects of the 4H-SiC crystals were analyzed to correlate them with the impurity concentration and optical properties. The 4H-SiC prepared with the PVT method was characterized using Raman spectroscopy, X-ray diffraction (XRD), inductively coupled plasma optical emission spectrometry (ICP-OES), UV-Vis-NIR spectrophotometry, and PL to compare the changes in impurities and structural properties.

2. Materials and Methods

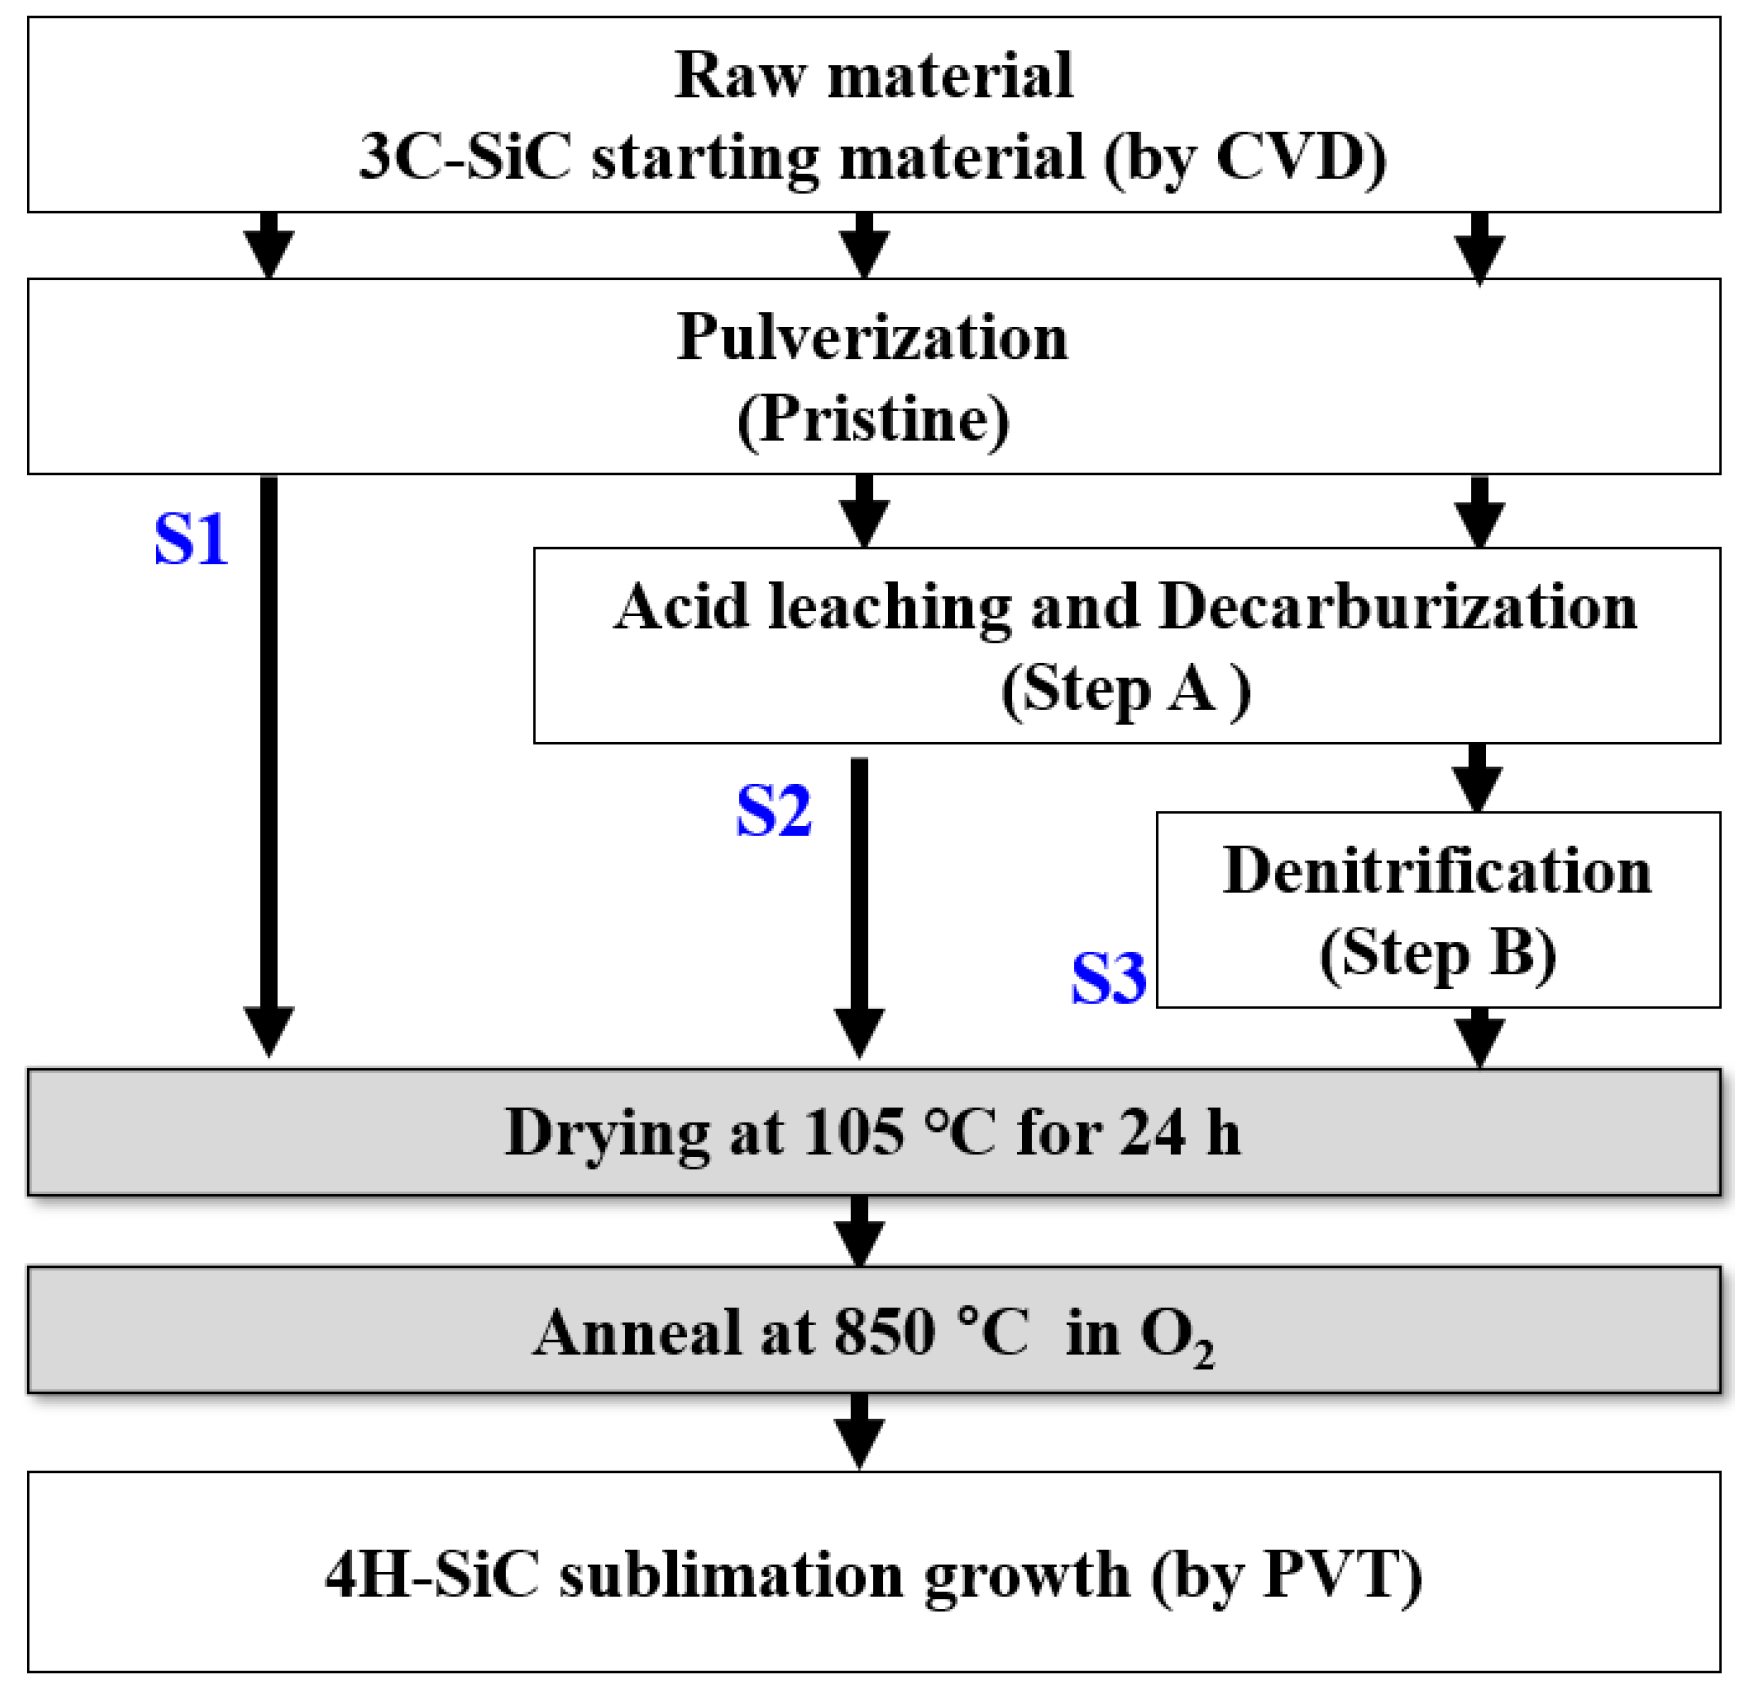
2.1. Preparation of Starting Material

The 3C-SiC structure was synthesized using chemical vapor deposition involving vaporization, pyrolysis, nucleation, oxidation–reduction, and substitution [14]. The precursor gas consisted of commercial methyltrichlorosilane (MTS), ammonia (NH3), and carbon dioxide (CO2). MTS was the silicon precursor, and ethylene (C2H4) and propane (C3H8) were used as the hydrocarbon precursors. A mixture of H2 and Ar was used as a carrier gas. The 3C-SiC synthesized was black, indicating the presence of impurities.
The free carbon and silica present in the synthesized 3C-SiC were removed through pulverization (pristine), acid leaching and decarburization (step A), and denitrification treatment (step B), as shown in Figure 1 and Table 1. In the pristine sample, the synthesized 3C-SiC was pulverized. A mixed acid solution dissolved the metal; nitric acid acted as a powerful oxidizer that dissolved to form metal ions ( M 3 + ), which reacted with hydrochloric acid to produce chorine anions in the solution. Then, the addition of HF allowed the free silica and free silicon in the mixed acid solution to react and generate the SiF6 gas and SiCl6 in a soluble solution. To decarbonize the powder, oxygen gas was passed through it to react with the free carbon, thus forming CO2 vapor.
Volatile chloride compounds and chlorine gas were produced in step A. The residual acid salt was purified through volatilization, thus removing the excess oxygen present in SiC through a denitrification treatment. This was done by heating at 105 °C in a reduced-pressure evaporation in an argon environment. Other byproduct impurities present in the synthesized SiC were removed through heat treatment at 850 °C for 1 h in an oxygen environment. The dried and purified 3C-SiC powder obtained was green in color and had a purity greater than 90%. As shown in Figure 1 and Table 1, these purification processes were performed using the three purification processes of S1, S2, and S3 [15].

2.2. Growth of 4H-SiC Crystals

The 4H-SiC crystals were fabricated by using the generalized PVT method with three differently treated 3C-SiC powders (S1, S2, and S3) as starting materials. This PVT method has already been explained in detail by other researchers [16,17]. Briefly, the 3C-SiC powder was placed at the bottom of the crucible in a PVT chamber. In this process, the growth process was carried out in an argon environment. The growth of the 4H-SiC crystals took place at a growth temperature in the range of 1900–2100 °C and a pressure of 10−2 to 10−3 mbar in an argon atmosphere. The grown crystal sample was detached from the crucible and ground to two-inch diameter by slicing and then polishing to prepare the SiC wafers. A detailed flowchart for the fabrication of the 4H-SiC crystals with a commercialized PVT process with three differently treated 3C-SiC starting materials is shown in Figure 1 and Table 1.

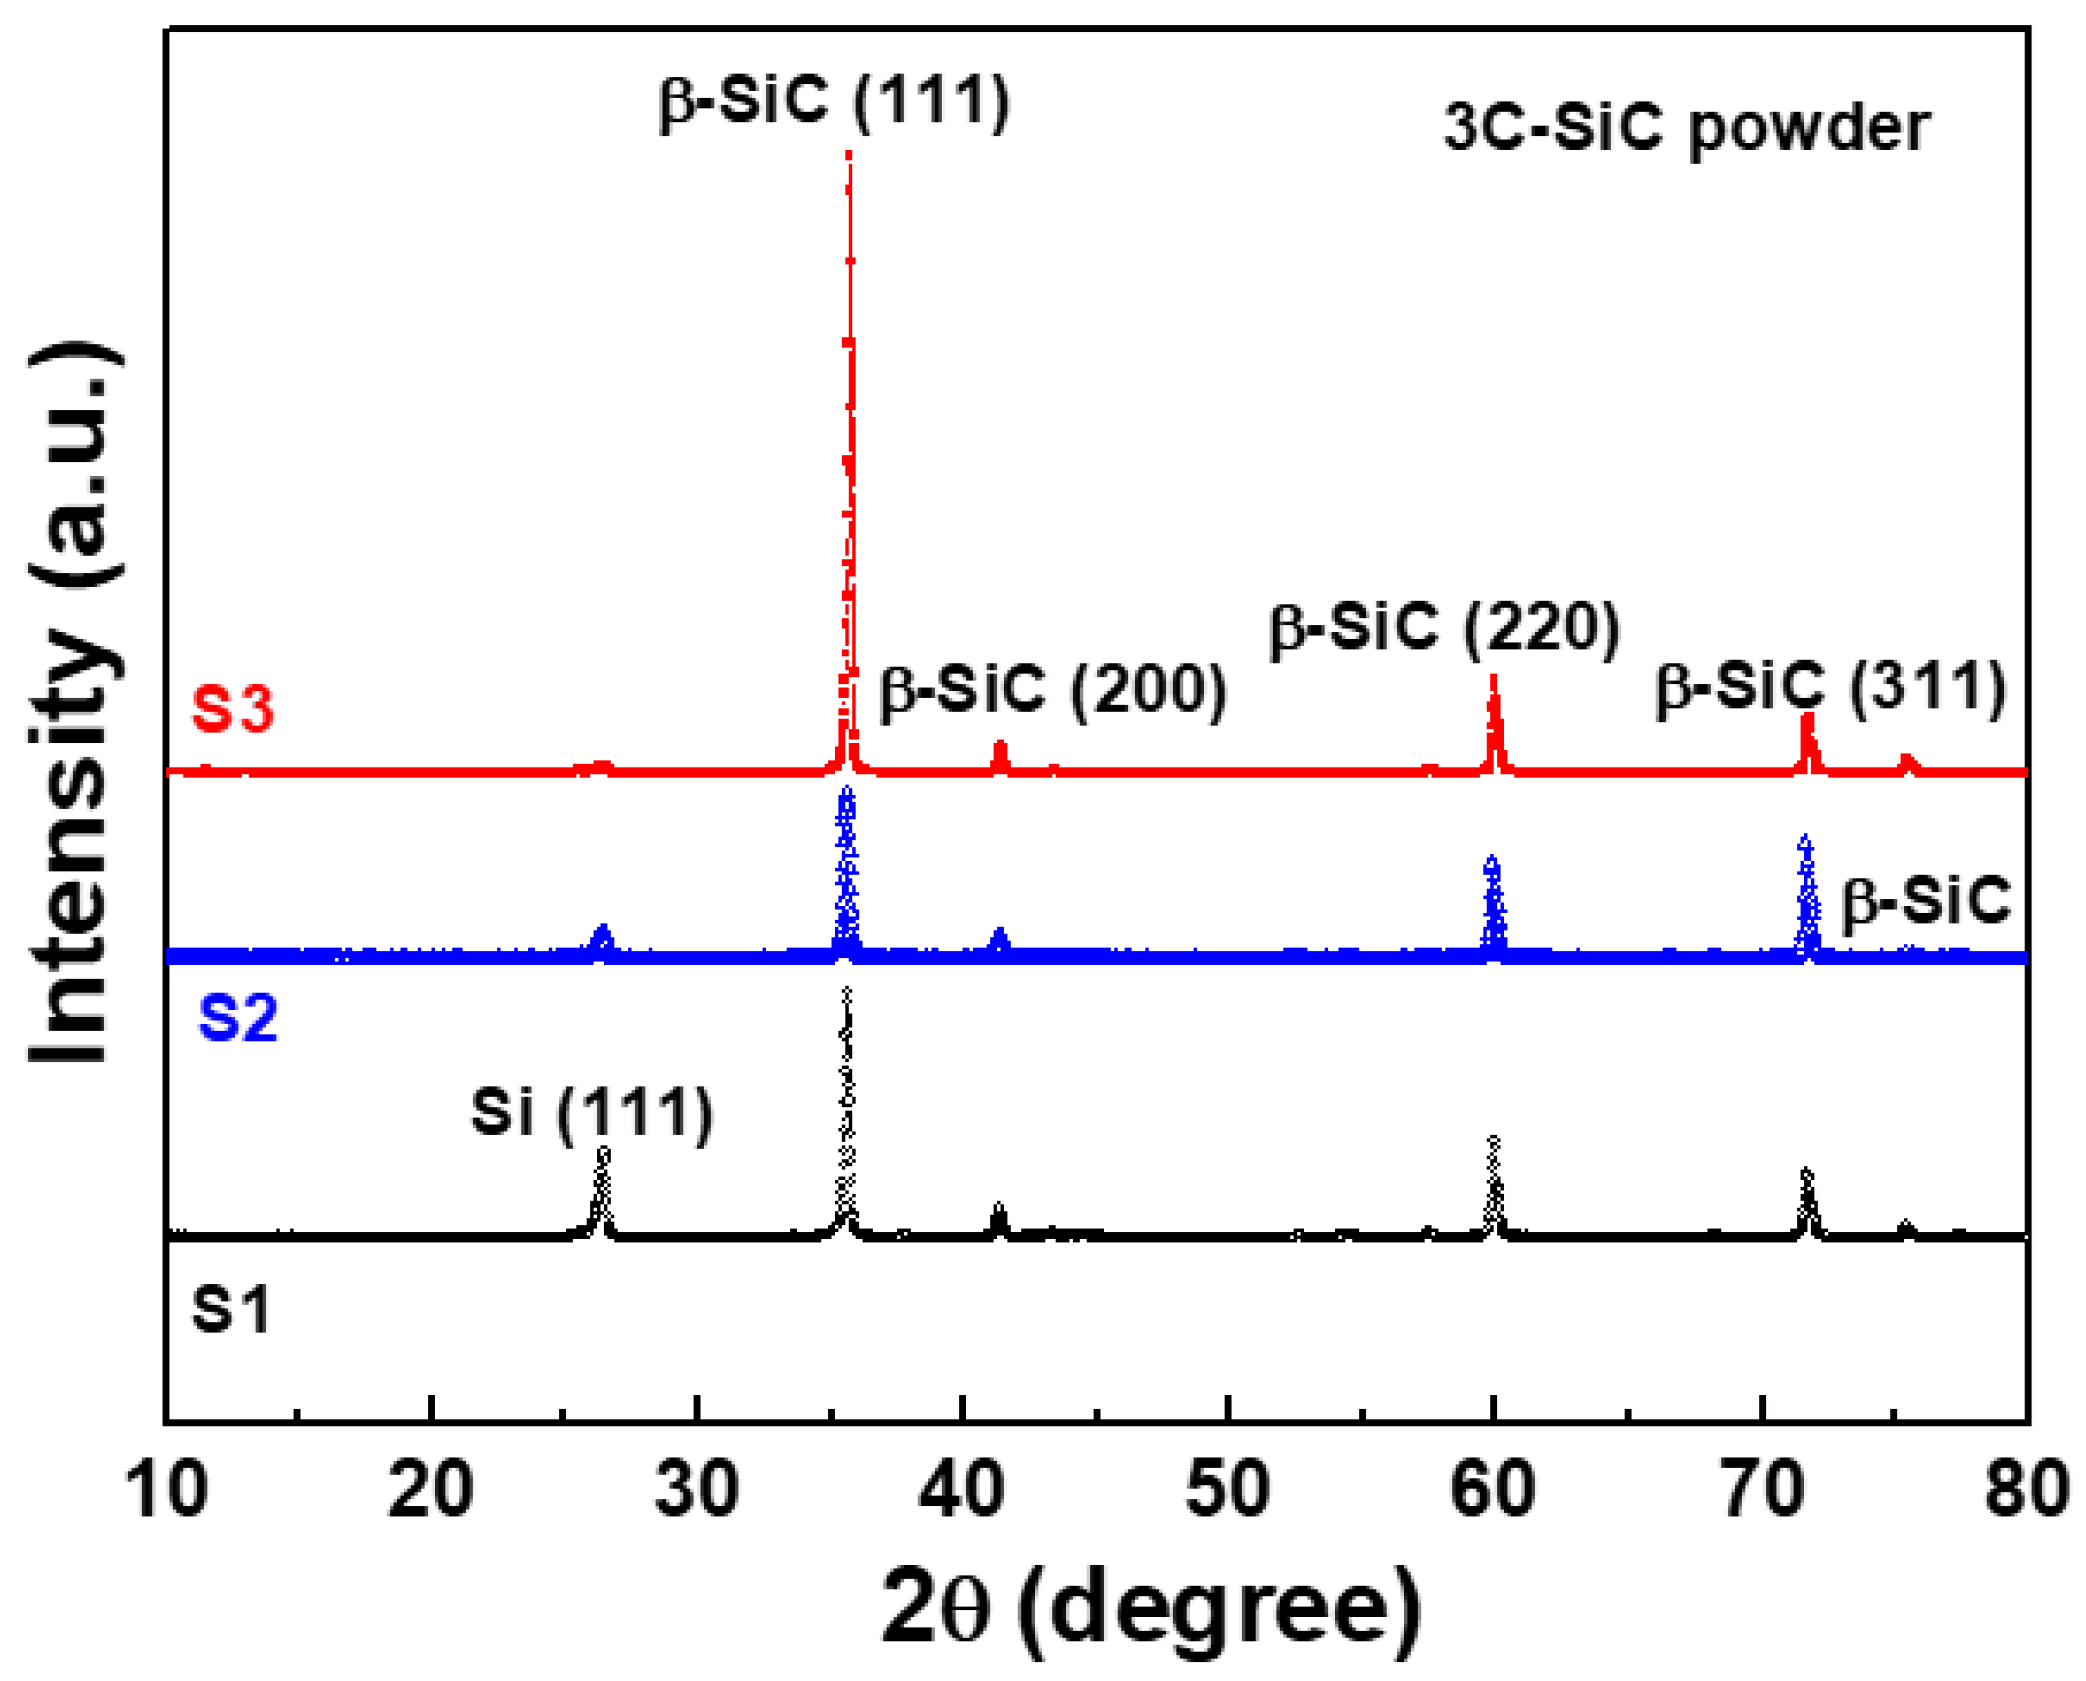
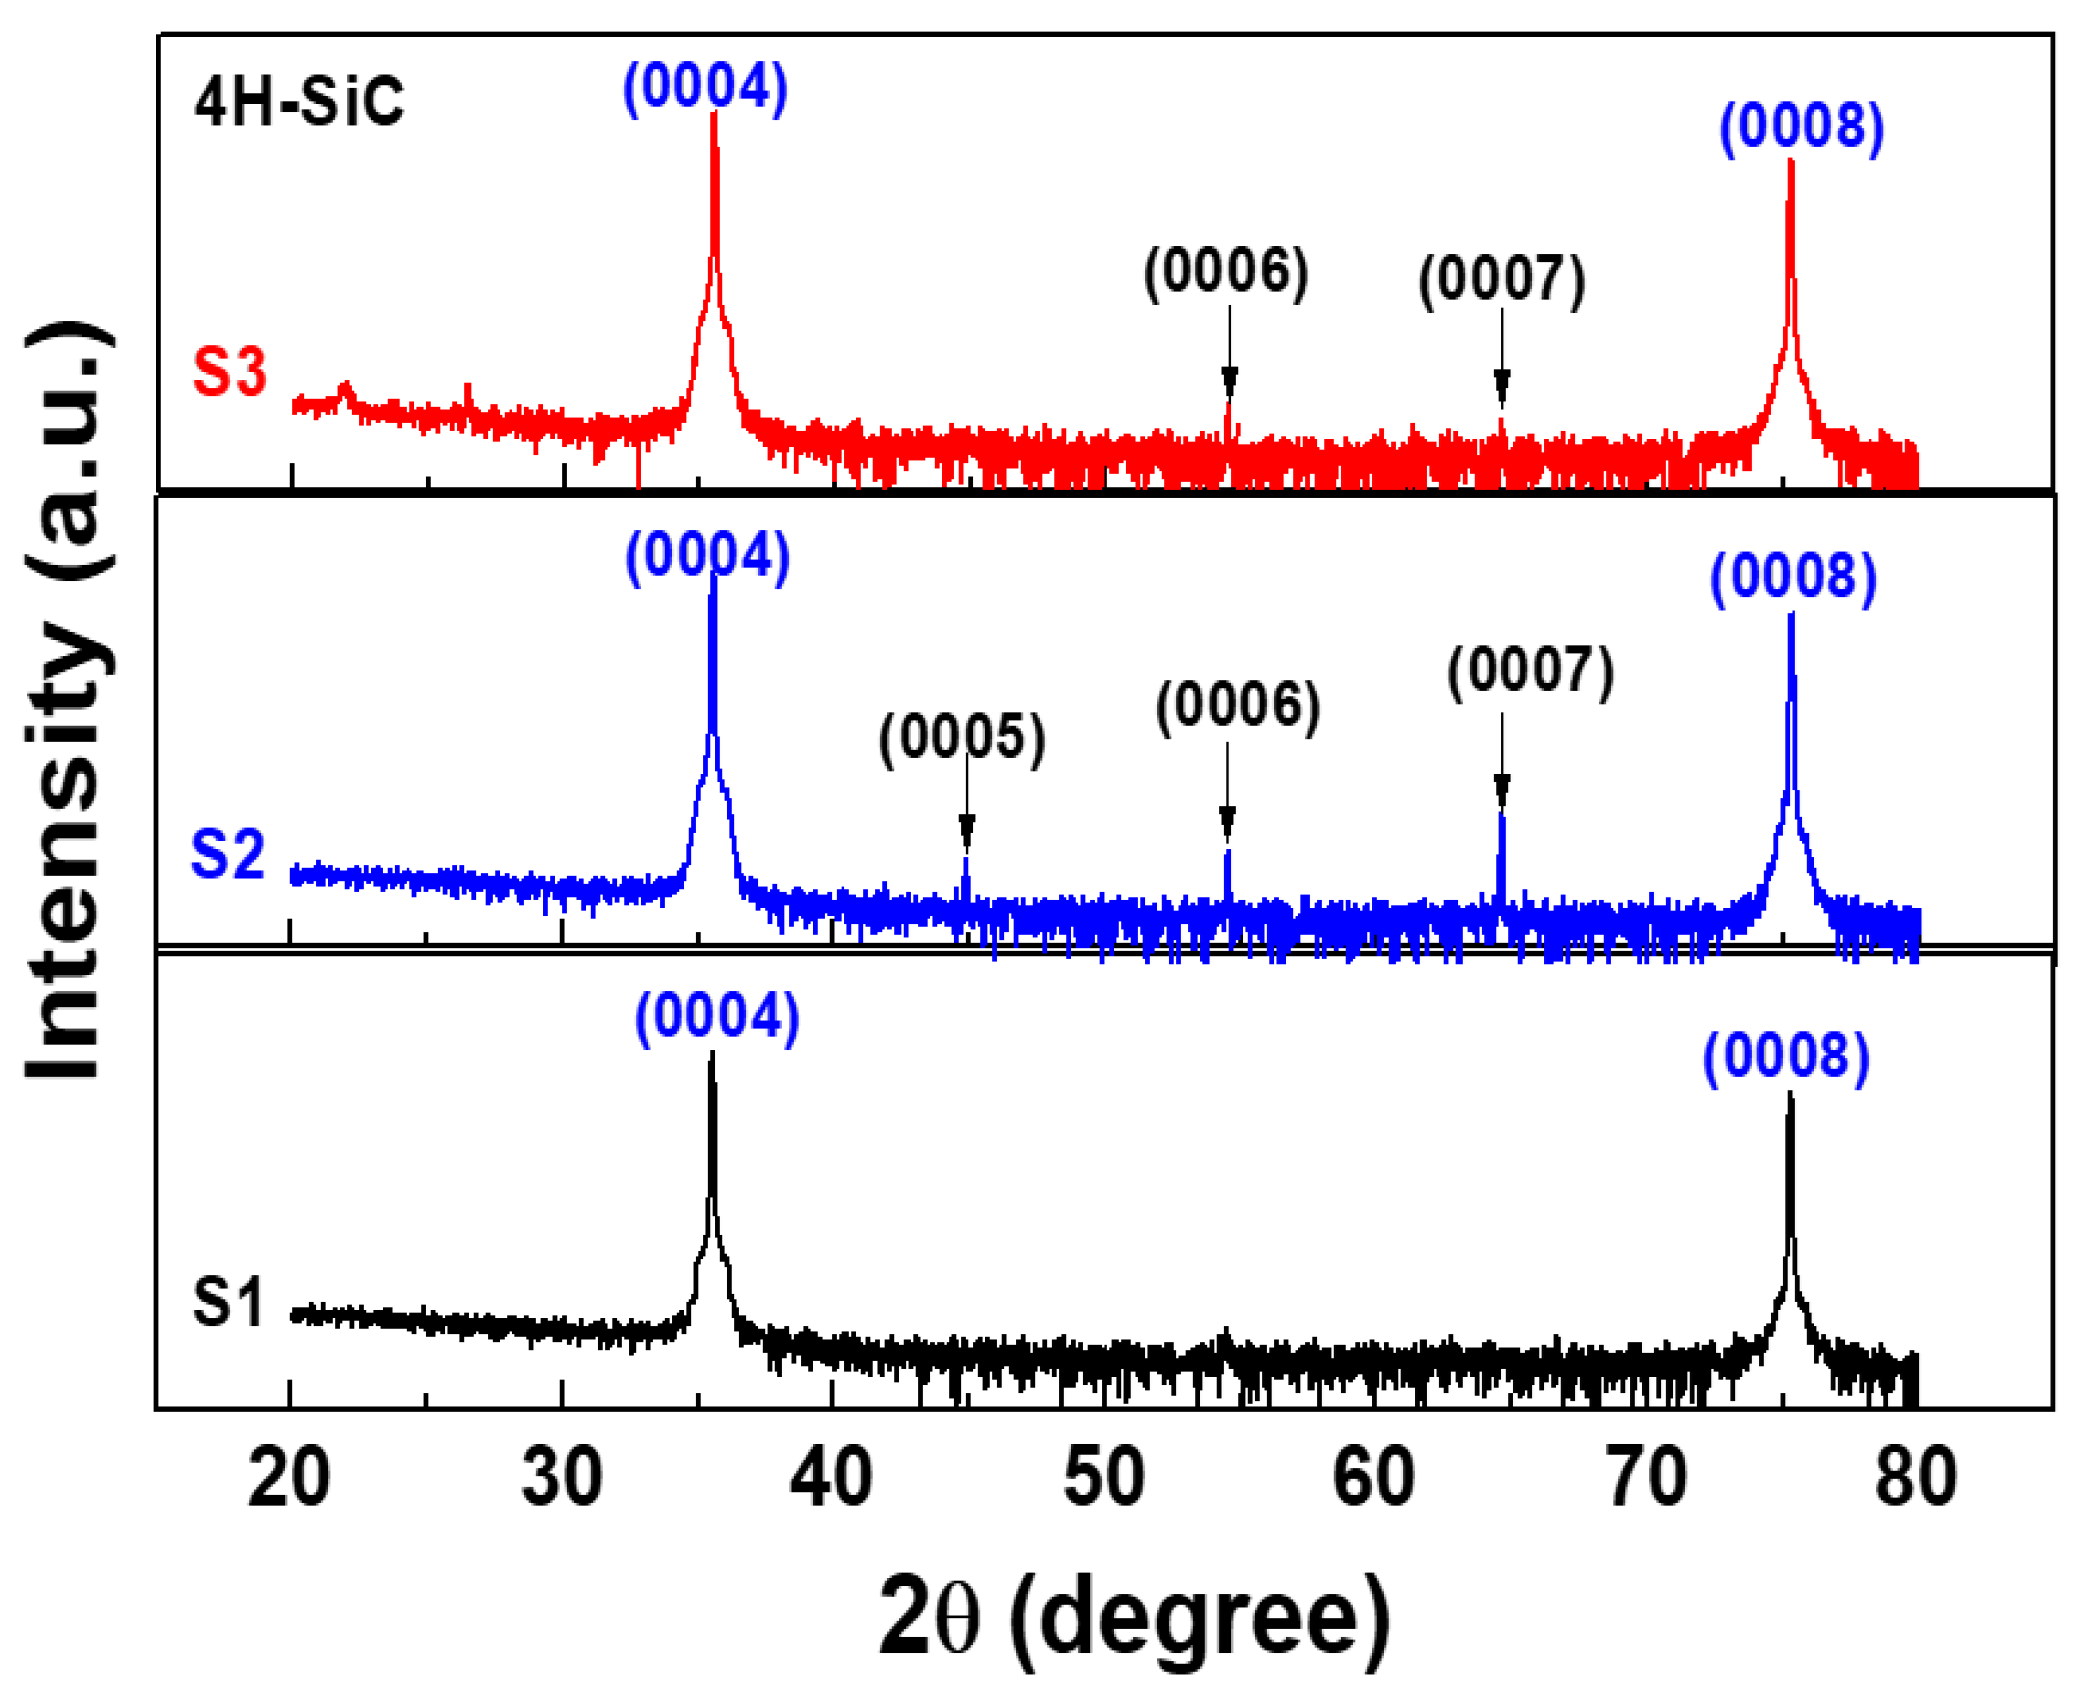
2.3. X-ray Diffraction

The crystalline phases of the 3C-SiC powders were characterized using XRD (D/max-2500V/PC, Rigaku, Tokyo, Japan) with Cu Kα radiation at 30 mA and 40 kV. In addition, the crystalline orientation of the 4H-SiC crystal samples was characterized using a multi-function X-ray diffractometer (XRD; PANalytical, Malvern, Worcestershire, UK) and high-resolution two-dimensional (2D) XRD (Bruker, D8 Discover, Billerica, MA, USA) at the Korea Basic Science Institute (KBSI, Daegu, Korea). To obtain the oriented diffraction plane of the main and minor XRD peaks, the XRD result was obtained with a θ-2θ scan using multi-function XRD with Cu Kα radiation at 30 mA and 40 kV.

2.4. Inductively Coupled Plasma Optical Emission Spectrometry

The elemental compositions of the 4H-SiC crystal samples were determined using inductively coupled plasma optical emission spectrometry (ICP-OES; Optima 5300DV, Perkin Elmer, Waltham, MA, USA). The operation conditions were used at a radio-frequency power of 1.6 kW and a plasma argon gas flow rate of 14.0 L/min. Before measurement, the 4H-SiC crystal samples were pre-treated. To remove the organic components or contaminations in the 4H-SiC crystal samples, nitric acid (HNO3) in an amount of 2–5 mL was put into the sample, and then the resulting products were dried and concentrated. Next, the resulting products were dissolved in the mixture of HCl and HNO3. Finally, the dissolved products were treated by using the prepared aqueous solution with H2SO4 and HF. To fabricate the microwave-assisted acid digestion of the SiC samples, sample preparations were performed by using a microwave digestion system (Milestone Srl - START D, Sorisole, Italy) with PTFE vessels. The quantification of the elemental concentration was performed by using the certified reference material (ECRM 780-1), which was calibrated with a lower standard deviation of 1% for accuracy. For the preparation of the boron analysis, the resulting samples were put into a beaker. Then, the prepared solutions of hydrofluoric acid and nitric acid were put into the PTFE bottle. After that, they were maintained for 24 h to be dissolved in the mixed acid solution.

2.5. Elemental Analyzer

The elemental composition of the 4H-SiC crystal samples was determined using an elemental analyzer (EMGA-920, Horiba, Kyoto, Japan). The 4H-SiC crystal samples were placed in a graphite crucible. The operations were performed under the conditions of a power of 5.5 kW and a high temperature at 2650 °C. The 4H-SiC crystal samples were introduced into a graphite crucible that was placed between two electrodes. Then, to achieve complete combustion and transfer the generated gas into the detector, the 4H-SiC crystal samples were heated at a high temperature. The generated gas was directly extracted into a thermal conductivity detector (TCD).

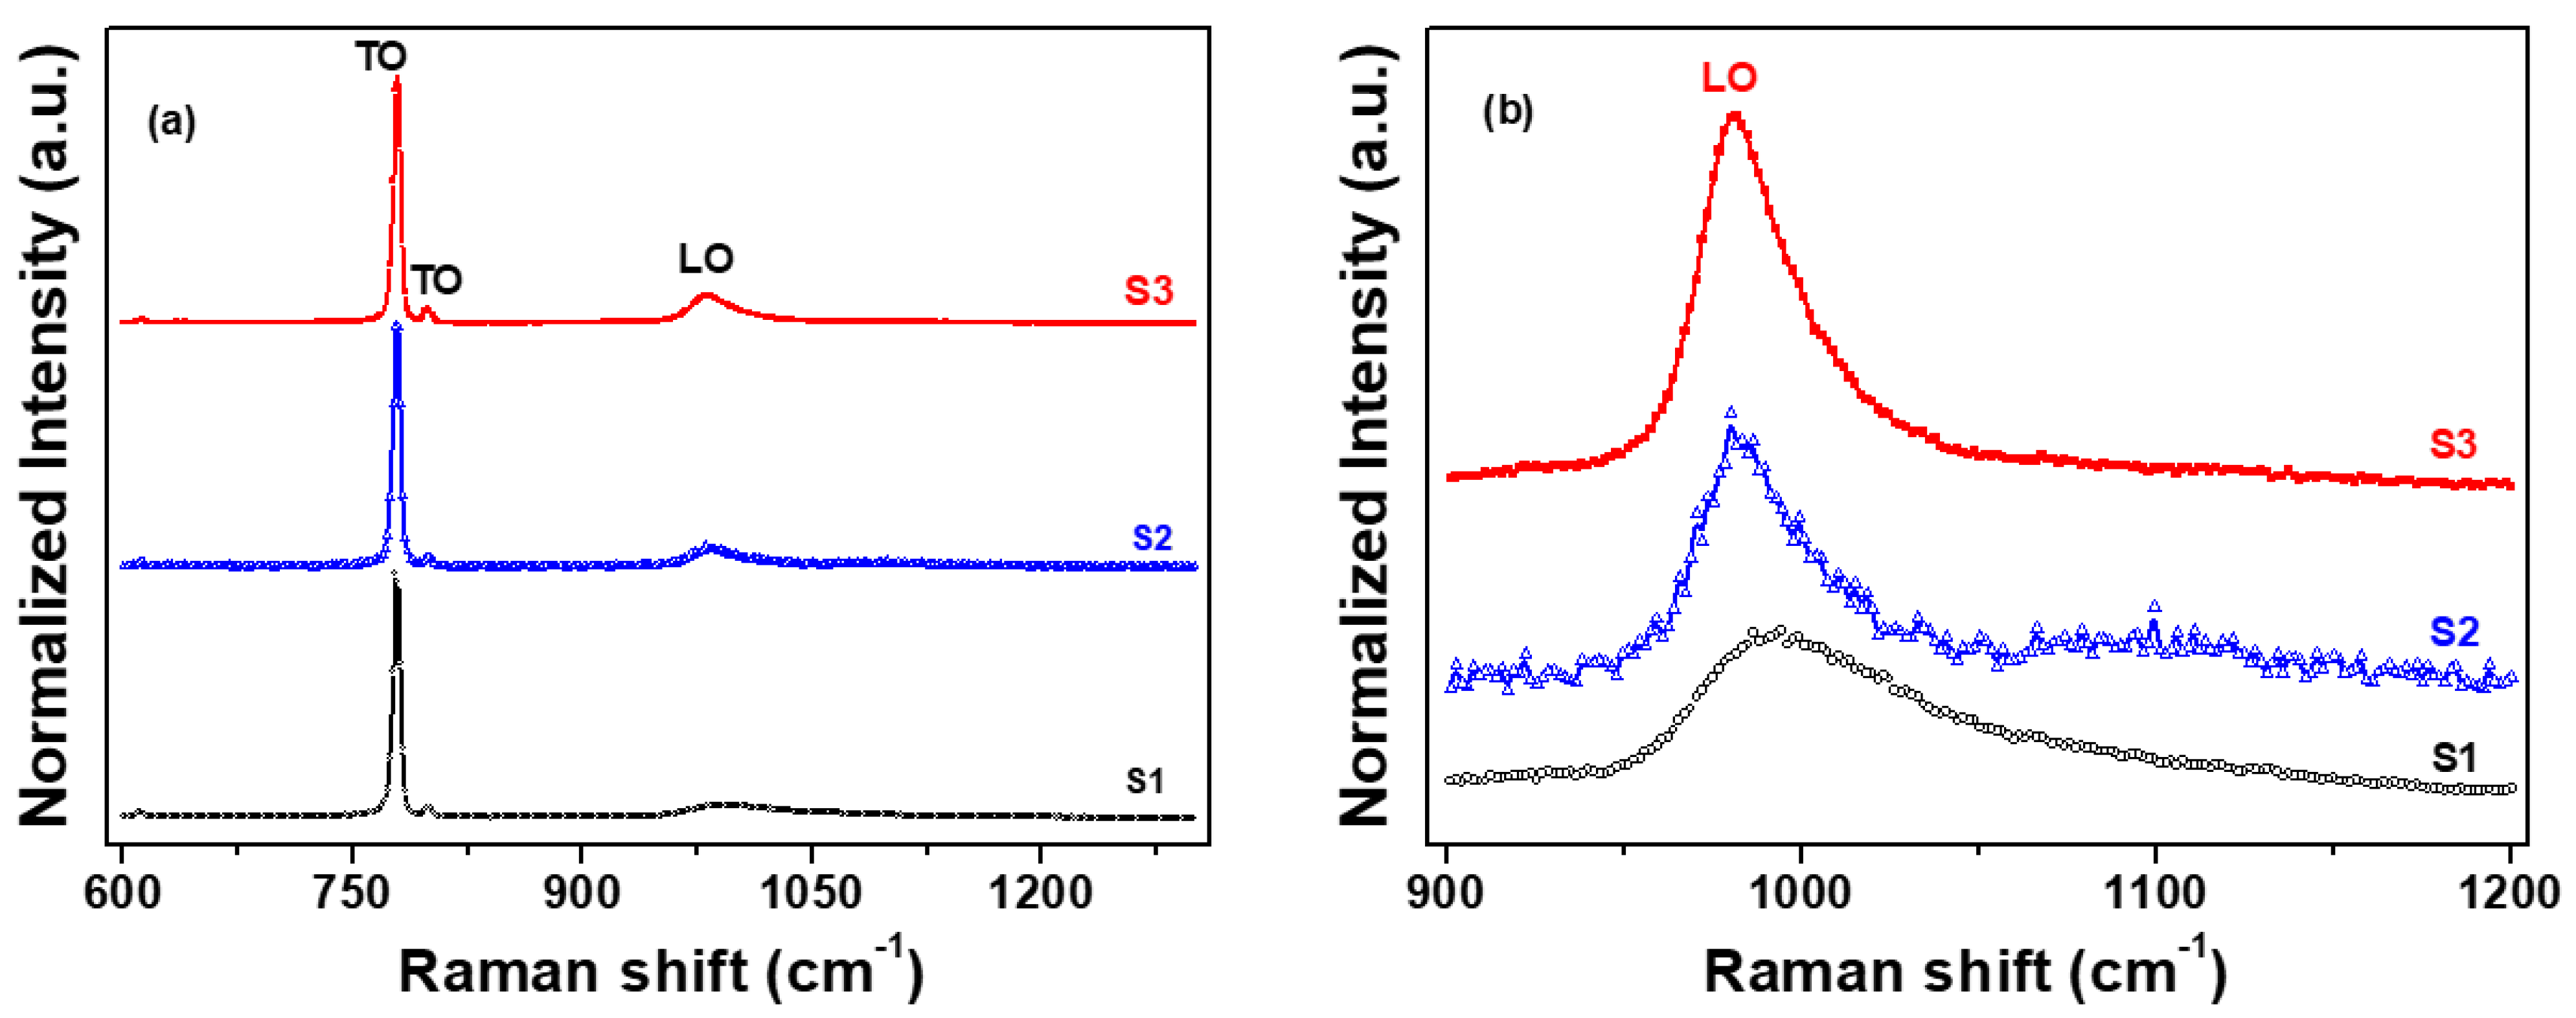
2.6. Raman Spectrometry

The structural phase identification of all of the samples was performed using a Raman spectrometer (Renishew, Wotton-under-Edge, UK) with a 514 nm laser as the excitation source. The Raman spectra were collected over the wavenumber range of 120–2000 cm−1 with a four-stage Peltier cooled CCD detector (UV-Vis-NIR range). The objective lens of the microscope (DM500, LEICA, Wetzlar, Germany) had a magnification of 50×, and the exposure time for accumulation was 5 s. The power intensity of the laser beam was 5.0 ± 0.1 mW.

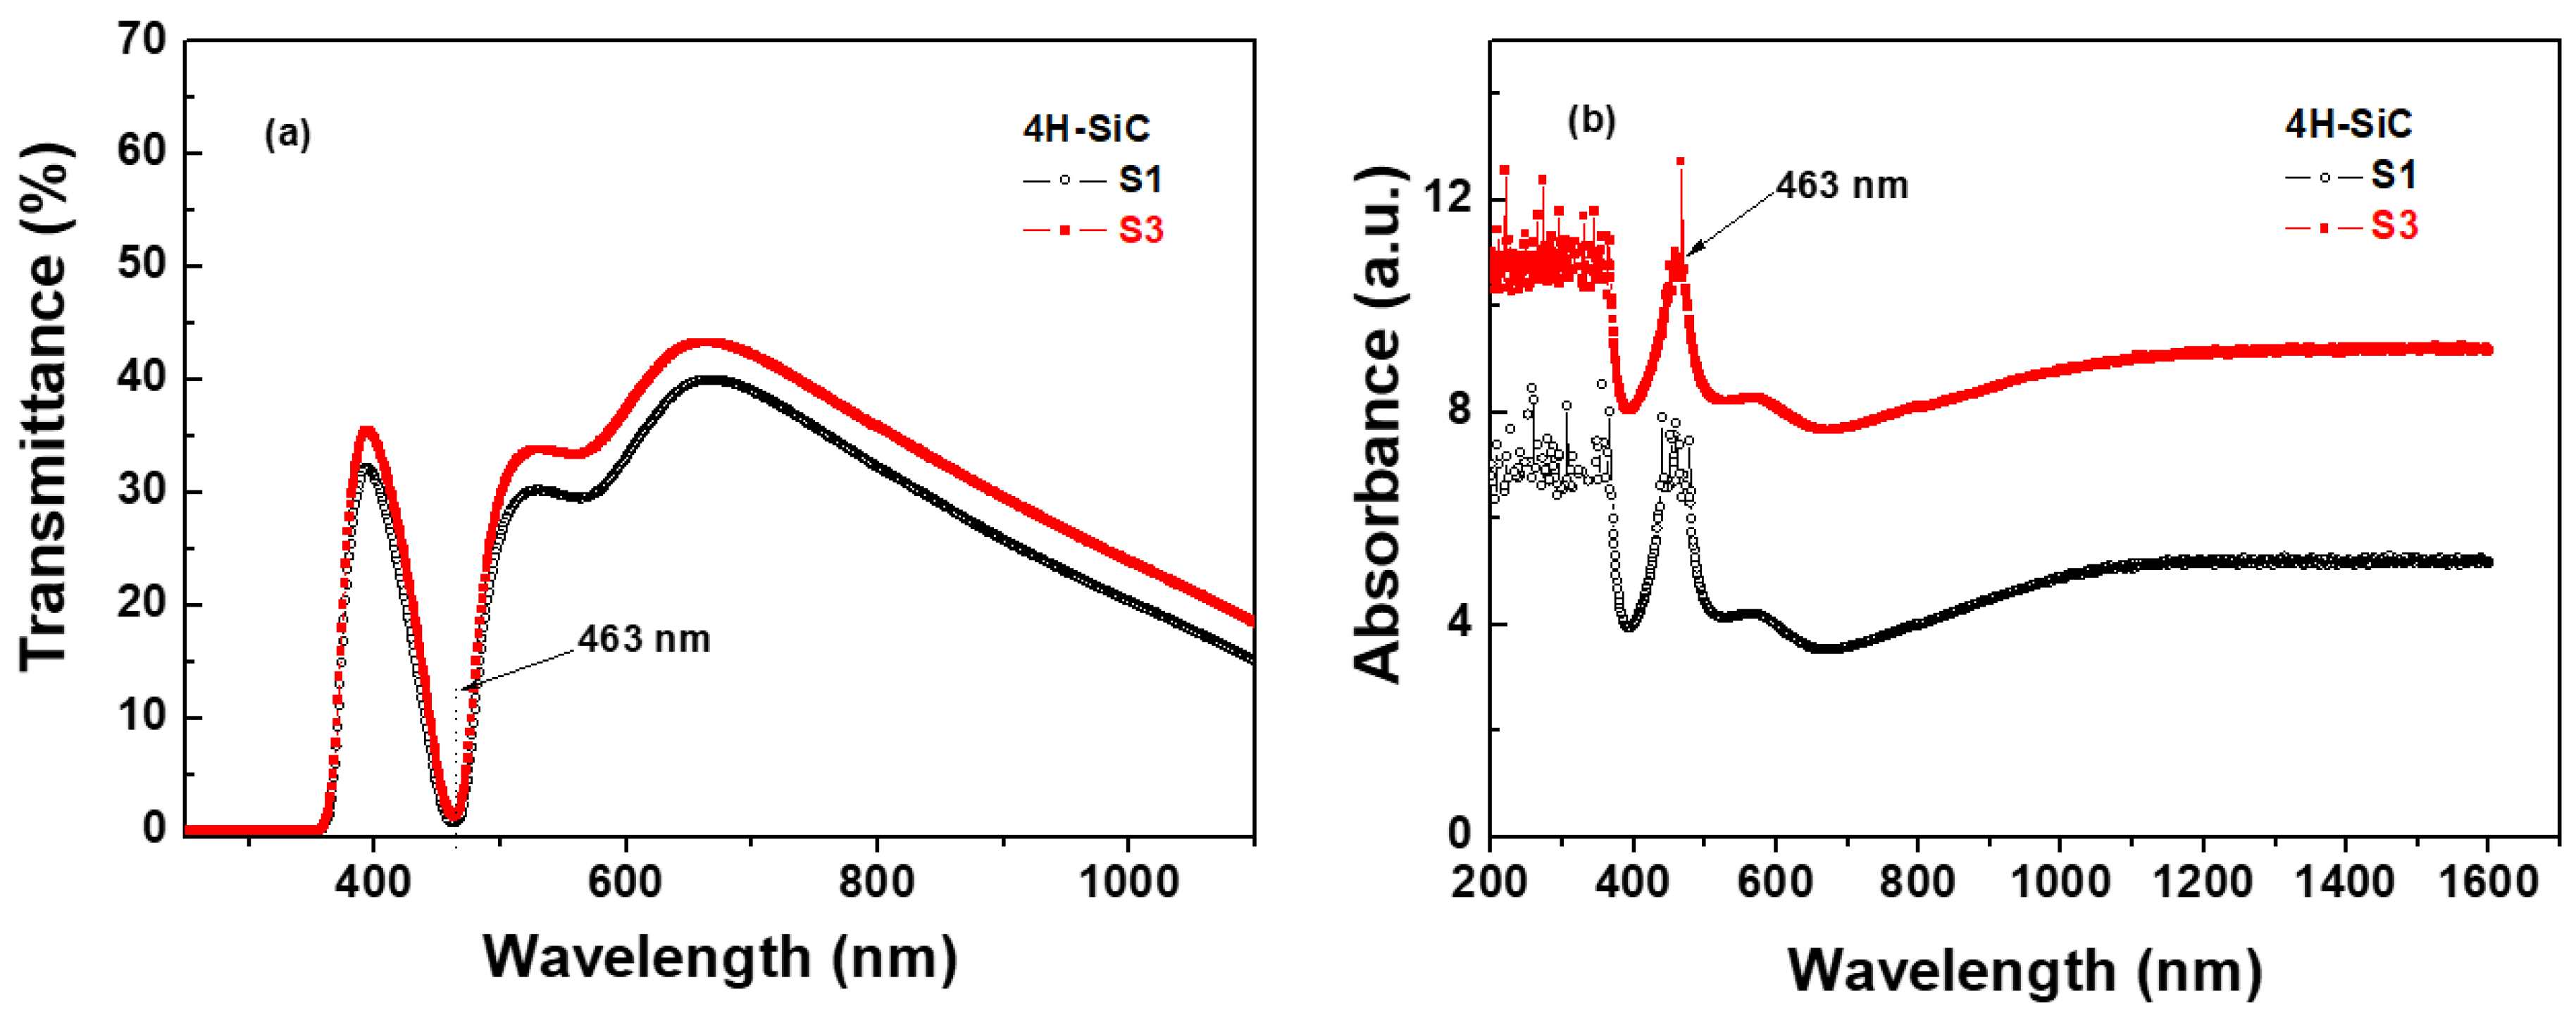
2.7. UV-Vis-NIR Spectrophotometer

The optical transmittance and absorbance spectra of the 4H-SiC crystal samples in the wavelength range of 200–1000 nm were measured at room temperature (298 K) using an ultraviolet–visible (UV-vis) spectrophotometer (LAMBDA 950, Perkin Elmer, Waltham, MA, USA).

2.8. Photoluminescence Spectrophotometry
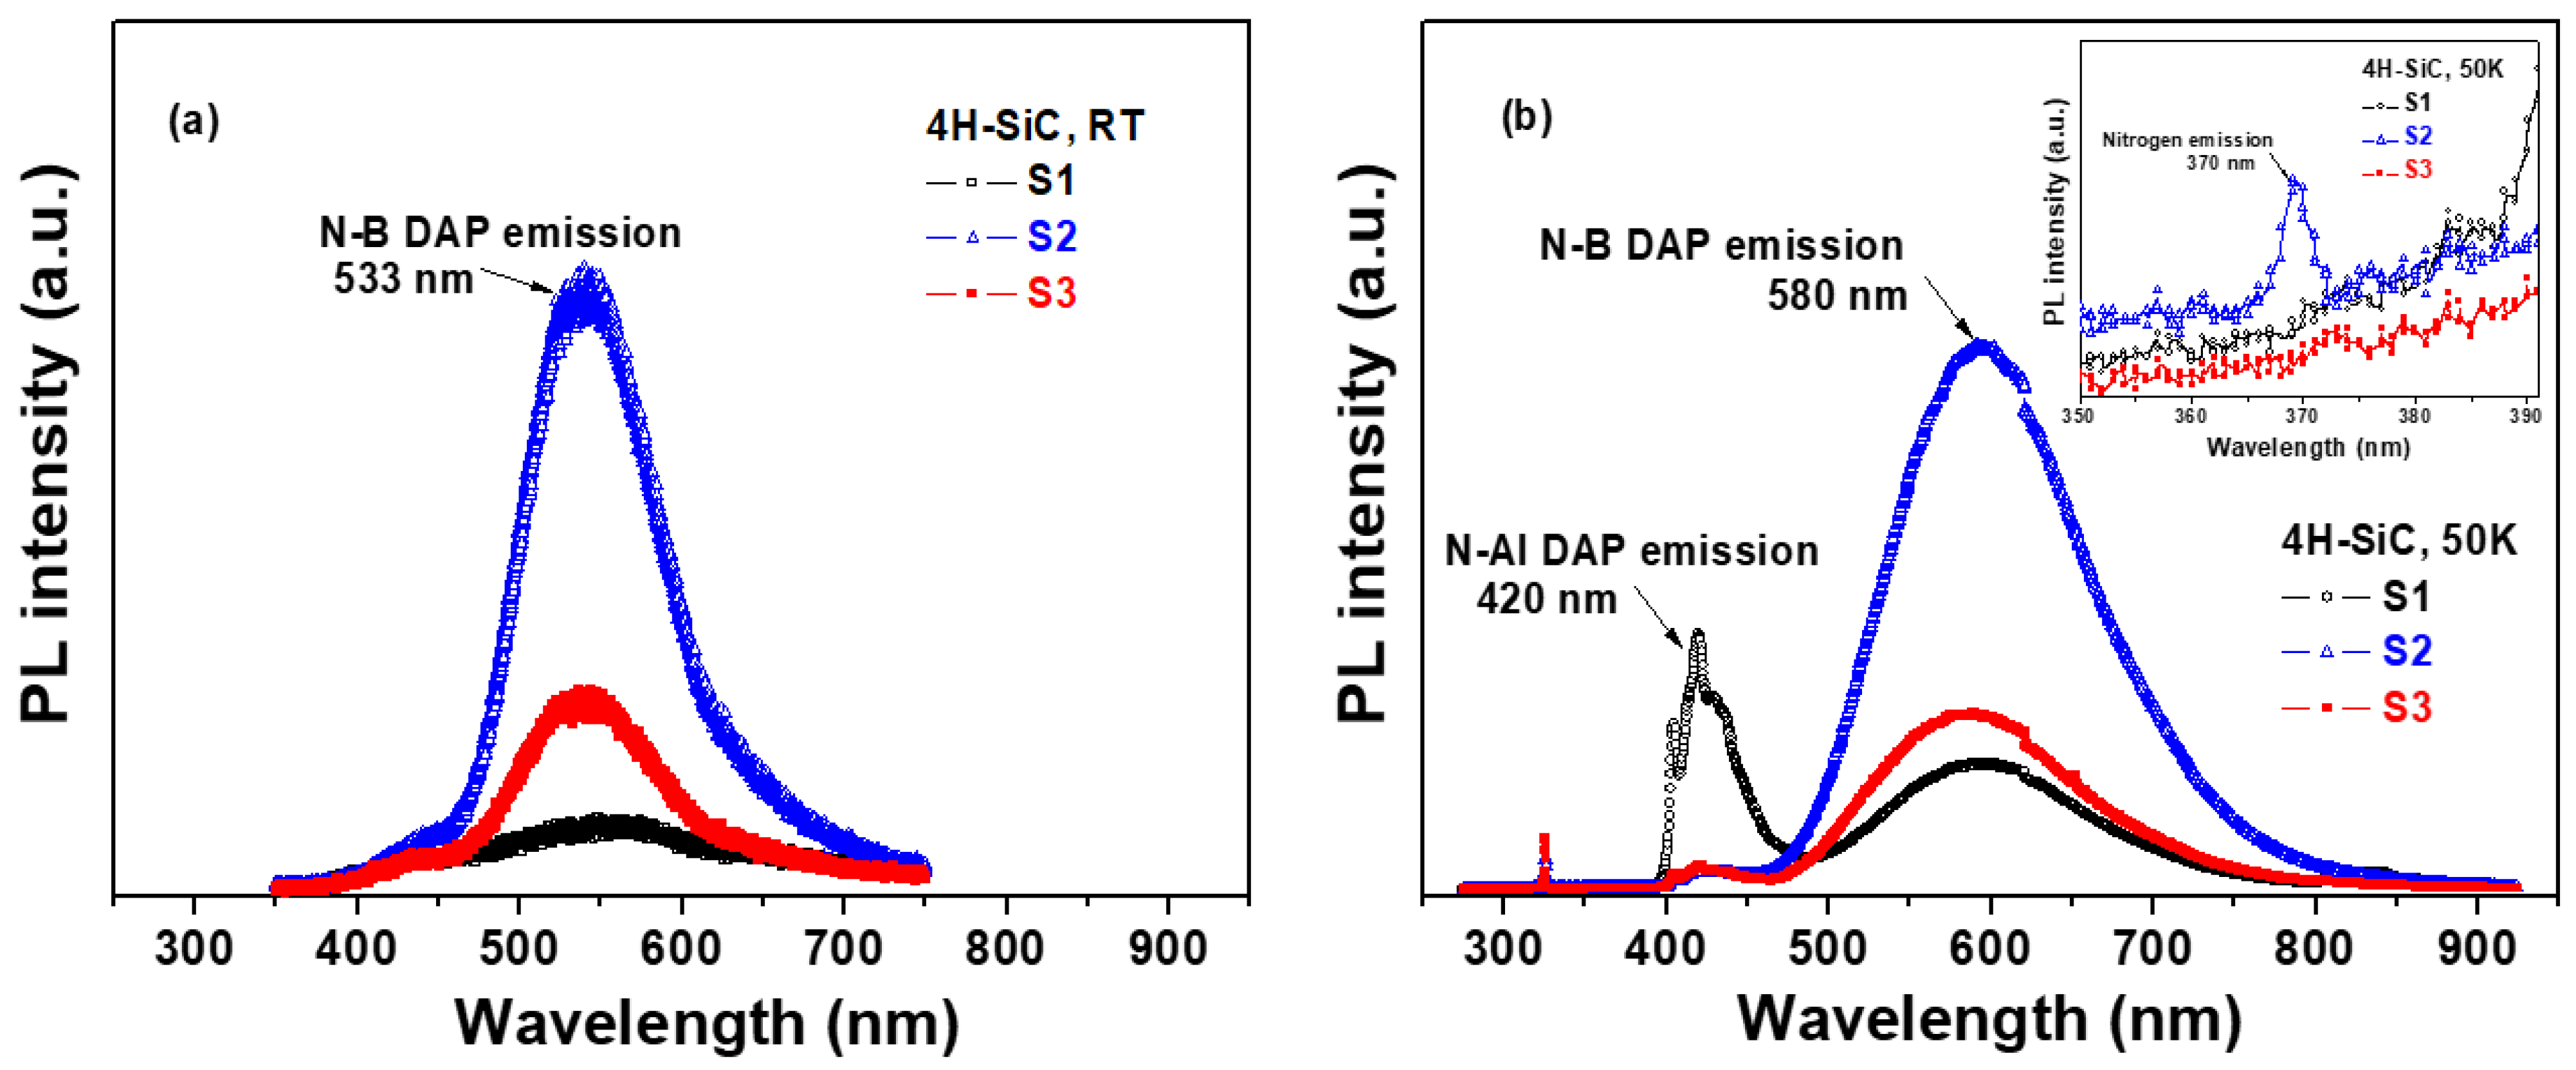
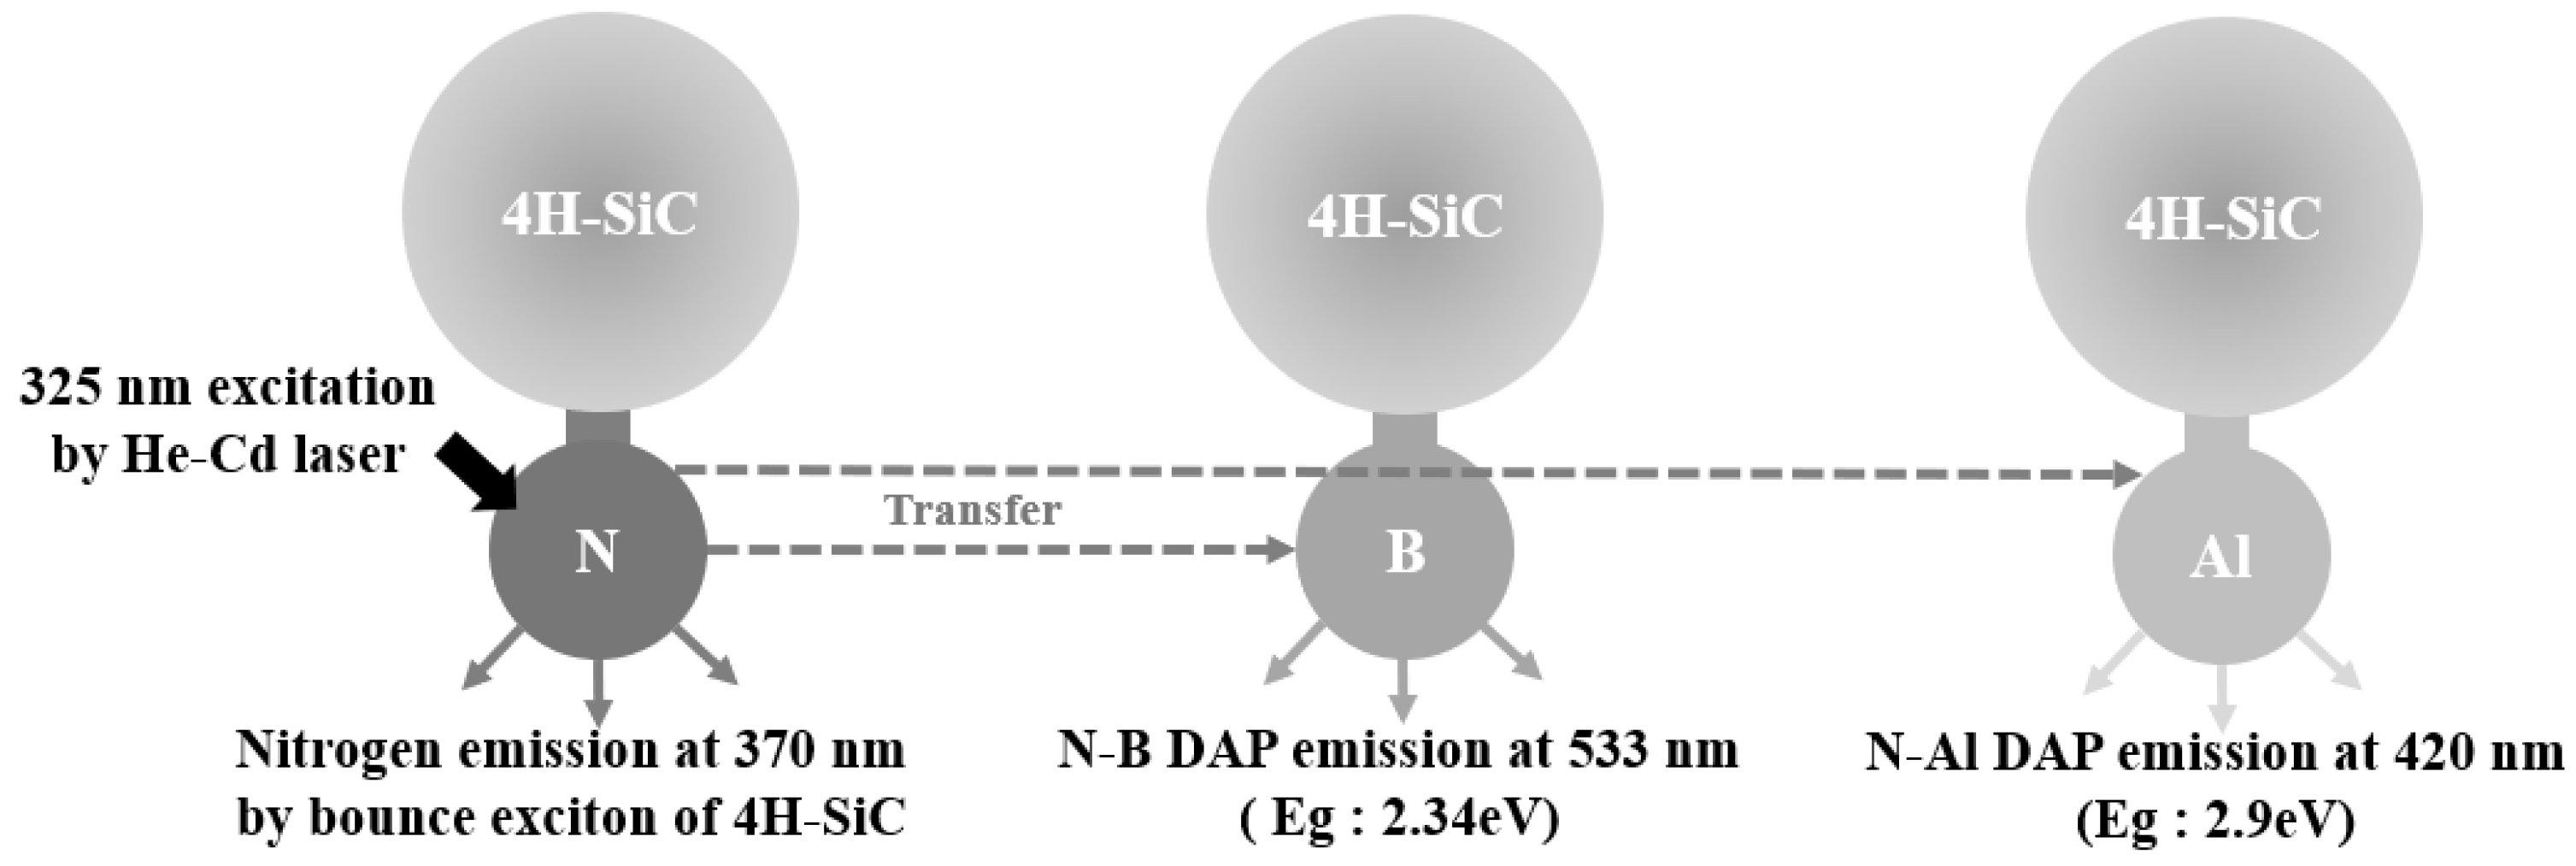
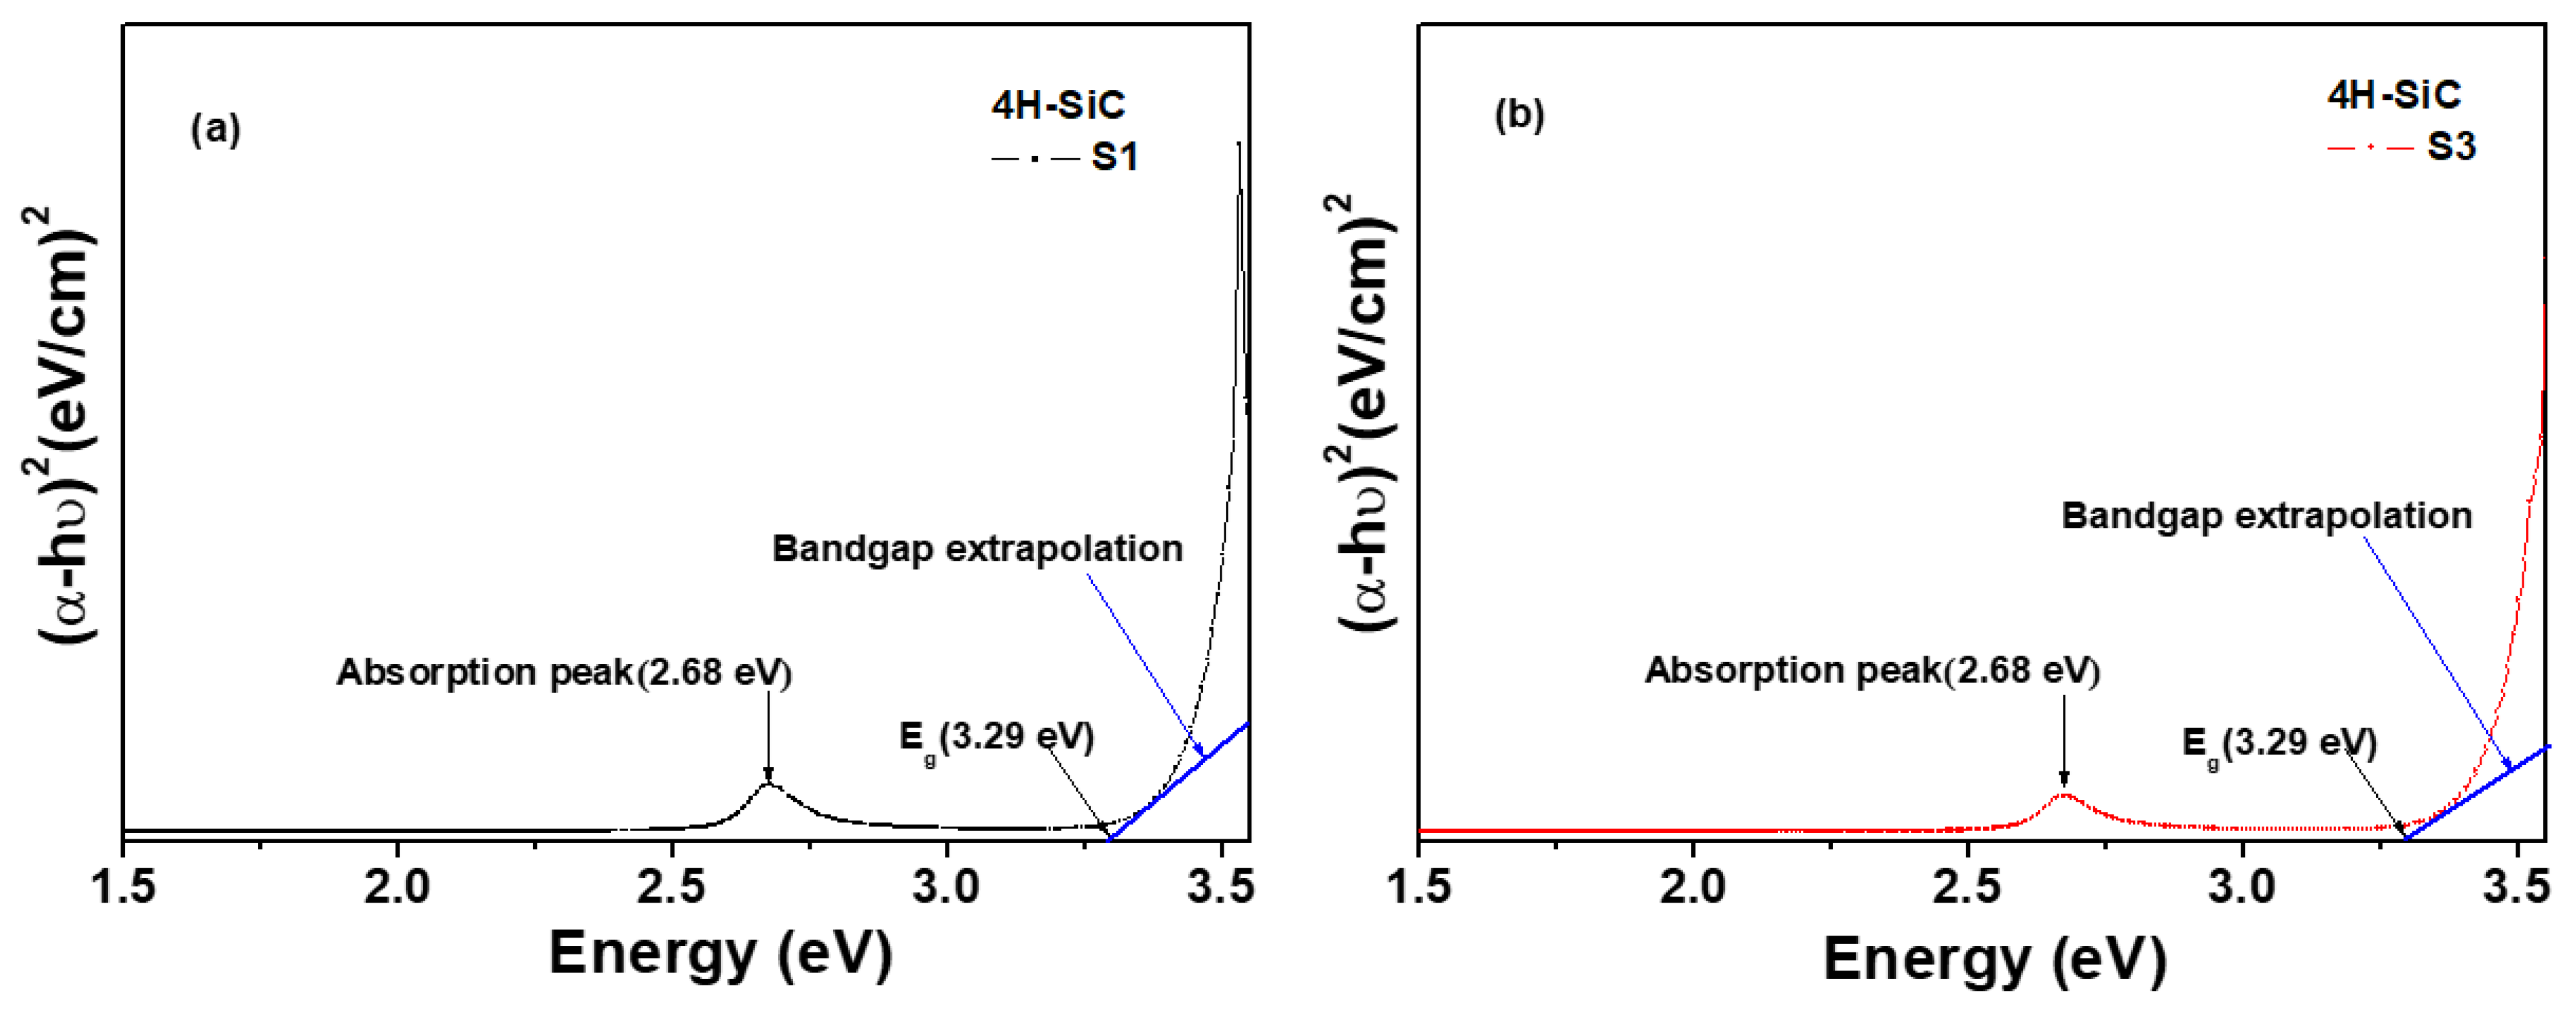
Photoluminescence (PL) spectra were collected at both room temperature (298 K) and an extremely low temperature of 50 K using a PL spectrometer (HORIBA, LabRAM HR Evolution, Kyoto, Japan) with a He-Cd laser with a wavelength of 325 nm and power ranging from 0.15 to 15 mW as the excitation source. The power density ranged from approximately 0.023 to 23.6 kW/cm2. The laser was focused on the sample using a 50× objective lens.

3. Results

Figure 2a,b show a photo image of a two-inch 4H-SiC crystal grown with the PVT process and a visible-light-emitting luminescence of a fluorescent 4H-SiC sample excited by a 325 nm pulsed laser source. The spot diameter of the 325 nm laser source was about 10 mm, and the greenish light was emitted from inside the 4H-SiC crystal sample shown in Figure 2b. The 4H-SiC crystal that was grown was cut in the form of a wafer and was subjected to slicing and then polishing in a direction perpendicular to the c-axis on the Si face before the PL measurement.
The XRD patterns of S1, S2, and S3 (pristine, A, and B, respectively) showed peaks corresponding to 3C-SiC (β-SiC phase), as shown in Figure 3. These peaks at 35.7°, 41.2°, 59.9°, and 71.6° are attributed to the (111), (200), (220), and (311) planes of the β-SiC phase, respectively [18,19].
Figure 4 shows two prominent peaks at 36° and 76°, which are the reflections from the (0004) and (0008) planes, which correspond to 4H-SiC [20,21]. In addition, all peaks are good agreement with ICSD card 98-016-4971. Furthermore, a few peaks of low intensity that were separated by almost equal intervals were also observed. These weak diffraction peaks were due to the (0005), (0006), and (0007) planes [21]. Their appearance was due to the double diffraction effect, as explained by other researchers [21]. Herein, for the highly purified 4H-SiC, the small periodic peaks between the main peaks that were related to the double diffraction effect could indicate the polytype of a SiC crystal with small periodic peaks due to the periodic stacking layers in the c-direction on the crystal [21]. For our XRD results, after the purification process (S2 and S3), small periodic peaks were also observed, as shown in Figure 4. In addition, the S1 sample had no small periodic peaks due to the large amounts of impurities. However, these XRD results could not be evaluated for 4H-SiC crystals with lower impurity doping levels. Thus, in this work, we investigated 4H-SiC crystal samples in terms of the trace impurity doping level by using the Raman and PL techniques.
The Raman spectra of the 4H-SiC crystals that were grown are shown in Figure 5. The three characteristic peaks of the 4H-SiC samples were detected at approximately 795, 800, and 970 cm−1 [22,23,24]. In Figure 5a, the two characteristic peaks at 795 and 800 cm−1 correspond to the transverse optical (TO) phonon [22,23]. The peak at 970 cm−1 is the longitudinal optical (LO) phonon mode of 4H-SiC [22,23].
Figure 5b shows that the LO peaks (from 991 to 981 cm−1) in the Raman spectra of the three 4H-SiC crystal samples were altered with respect to the starting material (S1, S2, and S3). The Raman shifts of the LO peak for two samples (S2 and S3) occurred at significantly lower wavenumbers than those of S1. It may be considered that the reason was that the LO phonon mode also caused a shift in the peaks toward lower frequencies, which could probably be attributed to the decrease in the grain size, internal stress from impurities, and the atomic size effect [22,23,24,25,26,27,28]. The peak breadth and reduced intensity of the S1 sample were the result of the increase in the free carrier concentration, as shown in Figure 5b. The Raman features of the LO (or LOPC) modes are very useful in determining the structural properties of SiC and have been shown to allow the estimation of the nitrogen concentration [29]. As the starting material was purified, S1 to S3, the Raman spectra showed a decreasing nitrogen concentration with the shift toward lower energies, as well as a change in the intensity of the LOPC. The peak intensity of the LOPC increased and the peak position shifted to lower wavenumbers through the elimination of the nitrate element under various purification conditions, such as oxidation and reduction reactions.
Figure 6a shows the PL spectra of the 4H-SiC crystal samples prepared using different starting materials at room temperature (T = 298 K). The measurements were carried out with a 325 nm exciting laser source, and the PL emission spectra are shown in Figure 6a. All of the samples showed a wide non-Gaussian symmetric peak located at 533 nm that corresponds to the N-B donor–acceptor pair (DAP) emission [22,23]. The peak intensity of the N-B DAP emissions for S2 was observed to be high, resulting in an increase in the N-B DAP density at room temperature (T = 298 K) [30,31,32]. The N-B DAP emissions of S1 were the weakest, although the concentrations of N and B were the highest among the three 4H-SiC crystal samples according to the ICP-OES data in Table 2. The reason could be that the N-B DAP emissions of S1 were affected by the N-Al DAP emissions at 420 nm [30,31,32]. These luminescence properties are directly correlated with energy-level transitions in semiconductors. The recombination of donor–acceptor pairs for 4H-SiC crystals with an indirect band gap forms a free exciton and a phonon. This type of recombination introduces a complex donor–acceptor recombination mechanism. Thus, the impurity concentration may have a critical influence on the luminescence properties [30,31,32].
Figure 6b shows the PL spectra of the three types of 4H-SiC crystal samples at extremely low temperatures (T = 50 K). Both N-Al and N-B DAP emissions were observed at 420 and 580 nm, respectively, at extremely low temperatures [30,31,32]. The peak intensity of the N-Al DAP emissions was observed to be the highest in S1. The peak intensities of the N-B DAP emissions for S2 were observed to be high, suggesting an increase in the N-B DAP density at extremely low temperatures [30,31,32]. The peak intensity of the N-B DAP emissions increased with the nitrogen concentration. As shown in the magnified image of Figure 6b, sample S2 showed a weak PL peak at 370 nm in the low-temperature PL spectra, which was caused by the emission of nitrogen from the nitrogen-bounce excitation [30,31,32]. Meanwhile, the N-B DAP emissions of S1 at 533 nm were the weakest due to the N-Al DAP emissions at 420 nm [30,31,32]. In the case of sample S1, the N-Al DAP emissions were dominant in the spectra at 420 nm, and they were affected by visible-green-light luminescence quenching at 533 nm.
To better understand the relationship between the impurities and PL properties, ICP-OES and an elemental analysis were performed to investigate the elemental composition of B, Al, and N in the three 4H-SiC crystal samples (S1, S2, and S3). The results are presented in Table 2.
From the obtained results, the concentration of each element was converted into units of atoms/cm3 so that the recombination ratio of the donor–acceptor (RDA) (CD-A and 2CB/(CNCB)) could be calculated using Equation (1) [22,23]. The B, Al, and N concentrations were defined as CB, CAl, and CN, respectively. The parameter CD-A was calculated as a function of CB − (CAlCN) [31,32,33]. The calculated concentrations are listed in Table 3.
CD-A = lnCB − (lnCAl − lnCN)
The DAP recombination rate is an efficient measure of emission luminescence [33,34,35]. The RDA is proportional to the donor concentration (CD) and acceptor concentration (CA). The correlation between CD, CA, and the PL properties in SiC samples has already been shown [22]. The increase in PL intensity of N-B DAP for S2 was shown to be due to an increase in CN. The Aukerman and Millea model [33,34,35] suggests that the correlation between the DAP recombination and concentration causes an increase in PL intensity with the increase in the difference between CN and CB, which is called the N-B concentration gap. When the N-B concentration gap is larger than CB, it becomes saturated. When the N-B concentration gap exceeds twice the value of CB, the PL emission intensity decreases due to non-radiative defects (non-emission), as shown in the S3 sample [32].
To compare the correlation between the N-B concentrations and PL, we calculated the value of 2CB/(CNCB). When N-B emissions were observed, the N impurity—substituted for C in the SiC lattice—made it difficult for the electrons/holes between the impurity levels to transition to non-radiative emission at 533 nm, resulting in luminescence quenching. In the S3 sample, there was no emission, as the calculated ratio of 2CB/(CNCB) was 0.01 or less. In the S1 sample, Al and N existed in the hexagonal lattice of SiC, leading to a blue emission spectrum derived from the N-B DAP luminescence quenching. This shows that N-B DAP luminescence quenching can be extinguished depending on the concentrations of N and B impurities in 4H-SiC. When the calculated ratio of 2CB/(CNCB) was less than 0.01, the PL intensity was enhanced. When the Al concentration (CAl) was high in 4H-SiC (S1), N-B DAP emissions could not be generated with the N-Al DAP emissions at 420 nm [30,31,32,35].
Based on the PL results, a schematic diagram of the proposed recombination paths of the main impurities in the 4H-SiC crystals is shown in Figure 7. When the wavefunction of an electron bound to a donor can interact with a hole that is bound to an acceptor, DAP recombination occurs. Typical DAP luminescence spectra were observed in 4H-SiC at room temperature (T = 298 K) and extremely low temperatures (T = 50 K). In Figure 7, the N-Al and N-B DAP PL spectra are shown. The N-Al DAP PL peaks were located in the relatively high-energy region, and the N-B DAP peaks appeared in the low-energy region because the Al acceptor levels were low, and the boron levels were relatively high. As described in Figure 7, the incorporation of B into 4H-SiC induced two boron-related levels, shallow boron and deep boron. In the N-B DAP PL, the deep boron centers were mainly involved in radiative recombination [30,31,32,35].
The optical transmittance spectra of the 4H-SiC samples in the range of 200–1000 nm are shown in Figure 8a for samples S1 and S3. The optical transmittance of sample S1 was below 40%, and that of sample S3 was also above 40%. For the S1 sample, more N doping could decrease the optical transmissivity of the 4H-SiC crystal for wavelengths from 600 to 1000 nm. The absorption at 463 nm caused by nitrogen doping may weaken N-Al DAP emission extraction. Most importantly, Al and N co-doping caused the N donor and Al acceptor at hexagonal sites to be dominated in the SiC crystal, resulting in more non-radiative recombination and light absorption losses [22]. This absorption band was caused by the transition between the bottom levels of the conduction band and the top levels of the valence band, while the absorption band was caused by the induction of the energy level of the N impurities [35].
The absorption spectra of the 4H-SiC samples in the range of 200–1600 nm are shown in Figure 8b. The absorption peak at 463 nm caused by nitrogen doping may weaken the N-Al DAP emissions. These N-B DAP emissions of the 4H-SiC samples were responsible for the low optical transmissivity, and the light extraction of the N-B DAP emissions in the visible light range was weakened [22,23]. The aluminum and nitrogen co-doping led to the N donor and Al acceptor at the hexagonal sites dominating in the SiC crystal, resulting in more non-radiative recombination and light absorption losses [22,35].
The optical band gap (Eg) was calculated from the transmittance spectra using the Tauc Equation (2) [36,37].
αhυ = A·(hυ − Eg)0.5
where α is the absorption coefficient, A is a constant, and hυ is the photon energy [36,37]. Eg can be evaluated from the relation between αhυ and the photon energy (hυ), as shown when plotting (αhυ)2 vs. energy in Figure 9. The value of Eg of the samples can then be determined by extrapolating a straight line to cross with the hυ axis at zero, as shown in Figure 9. The value of Eg of the 4H-SiC that was grown was found to be 3.29 eV for both S1 and S3 [36,37].

4. Conclusions

In summary, we investigated the correlation between the impurity concentrations and PL properties of single 4H-SiC crystals prepared with the PVT method. The single 4H-SiC crystals grown with the PVT process were evaluated by using Raman spectroscopy, XRD, ICP-OES, UV-Vis spectroscopy, and PL measurements. As a result, XRD peaks at two prominent peaks at 36° and 76°, which are reflections from the (0004) and (0008) planes, respectively, were found to correspond to 4H-SiC. After purification (S2 and S3), a few peaks of weak intensity were also separately observed at almost equal intervals, although the S1 sample had no small periodic peaks due to the large number of impurities. However, with XRD results, it is somewhat difficult to analyze the concentrations of trace impurities using peak shifts or weak minor peaks. Thus, we investigated the 4H-SiC crystal samples in terms of the trace impurity doping level by using the Raman and PL techniques. The Raman spectra of the 4H-SiC crystals that were grown were observed to have three characteristic peaks, which were detected at approximately 795, 800, and 970 cm−1. In particular, the LO peak intensities of S2 and S3 decreased, and the LO peak shifts of the S2 and S3 samples occurred at lower wavenumbers than those of S1. It may be considered that reason was that the LO phonon mode also caused a shift in peaks toward lower frequencies, which could probably be attributed to the decrease in the grain size, internal stress from impurities, and the atomic size effect. For the PL spectra at a low temperature (50 K), two prominent PL emission peaks were observed at 420 and 580 nm. These DAP emission peaks were attributed to the impurity concentration caused by the doping of N and B in the single 4H-SiC crystals. The value of 2CB/(CNCB) was employed to evaluate the correlation between the N-B concentrations and PL. As the ratio of 2CB/(CNCB) was less than 0.01, there were no emissions in the S3 sample. Since Al and N existed in the S1 sample, N-B DAP emissions were not observed due to due to the luminescence quenching by the N-Al DAP emissions at 420 nm. These results show that N-B DAP luminescence quenching can be extinguished depending on the concentrations of N and B impurities in 4H-SiC. When the 2CB/(CNCB) ratio was 0.01 or less, the 4H-SiC samples with high CAl values showed no N-B DAP emissions at 420 nm. Thus, the PL technique is a useful technique for detecting the lower trace impurity doping levels in 4H-SiC crystal samples.

Author Contributions

Conceptualization, S.-K.K., E.Y.J. and M.-H.L.; methodology, S.-K.K. and M.-H.L.; software, S.-K.K. and E.Y.J.; validation, S.-K.K., E.Y.J. and M.-H.L.; formal analysis, S.-K.K., E.Y.J. and M.-H.L.; investigation, S.-K.K., E.Y.J. and M.-H.L.; resources, S.-K.K. and M.-H.L.; data curation, S.-K.K., E.Y.J. and M.-H.L.; writing, original draft preparation, S.-K.K., E.Y.J. and M.-H.L.; writing—review and editing, S.-K.K., E.Y.J. and M.-H.L.; visualization, S.-K.K. and E.Y.J.; supervision, E.Y.J. and M.-H.L.; project administration, M.-H.L.; funding acquisition, M.-H.L. All authors have read and agreed to the published version of the manuscript.

Funding

This research was funded by the Technology Development Program (No. S2797799) from the Ministry of SMEs and Startups.

Institutional Review Board Statement

Not applicable.

Informed Consent Statement

Not applicable.

Data Availability Statement

Not applicable.

Acknowledgments

The authors would like to thank Sang-Geul Lee at the Korea Basic Science Institute (Daegu) for their useful discussions and for providing the XRD data. In addition, the authors would like to thank Hongtaek Kim at Horiba Korea Ltd. for his useful discussions and for providing the PL data.

Conflicts of Interest

The authors declare no conflict of interest.

References

  1. Deng, L.; Wang, X.; Hua, X.; Lu, S.; Wang, J.; Wang, H.; Wang, B. Purification of β-SiC powders by heat treatment in vacuum. Adv. Compos. Hybrid Mater. 2021, 00372. [Google Scholar] [CrossRef]
  2. Pomaska, M.; Beyer, W.; Neumann, E.; Finger, F.; Ding, K. Impact of microcrystalline silicon carbide growth using hot-wire chemical vapor deposition on crystalline silicon surface passivation. Thin Solid Film 2015, 595, 217–220. [Google Scholar] [CrossRef]
  3. Lee, K.-I.; Seok, D.C.; Jang, S.O.; Choi, Y.S. Development of silicon carbide atomic layer etching technology. Thin Solid Film 2020, 707, 138084. [Google Scholar] [CrossRef]
  4. Yousefi, M.; Rahim-abadi, M.M. Improvement of the mechanical and oxidation resistance of pyrolytic carbon coatings by co-deposition synthesis of pyrolytic carbon-silicon carbide nanocomposite. Thin Solid Film 2020, 713, 138320. [Google Scholar] [CrossRef]
  5. Mas’udah, K.W.; Diantoro, M.; Fuad, A. Synthesis and structural analysis of silicon carbide from silica rice husk and activated carbon using solid-state reaction. IOP Conf. Ser. J. Phys. Conf. Ser. 2018, 1093, 012033. [Google Scholar] [CrossRef] [Green Version]
  6. Via, F.L.; Severino, A.; Anzalone, R.; Bongiorno, C.; Litrico, G.; Mauceri, M.; Schoeler, M.; Schuh, P.; Wellmann, P. From thin film to bulk 3C-SiC growth: Understanding the mechanism of defects reduction. Mater. Sci. Semicond. Process. 2018, 78, 57–68. [Google Scholar] [CrossRef]
  7. Huseynov, E.M.; Naghiyev, T.G. Study of thermal parameters of nanocrystalline silicon carbide (3C-SiC) using DSC spectroscopy. Appl. Phys. A 2021, 127, 267. [Google Scholar] [CrossRef]
  8. Lu, F.; Tarekegne, T.; Ou, Y.; Kamiyama, S.; Ou, H. Temperature-dependent photoluminescence properties of porous Fluorescen SiC. Sci. Rep. 2019, 9, 16333. [Google Scholar] [CrossRef] [Green Version]
  9. Gadalla, M.N.; Greenspon, A.S.; Defo, R.K.; Zhang, X.; Hu, E.L. Enhanced cavity coupling to silicon vacancies in 4H silicon carbide using laser irradiation and thermal annealing. Proc. Acad. Natl. Sci. USA 2021, 118, e2021768118. [Google Scholar] [CrossRef]
  10. Berwian, P.; Kaminzky, D.; Roßhirt, K.; Kallinger, B.; Friedrich, J.; Oppel, S.; Schneider, A.; Schütz, M. Imaging defect luminescence of 4H-SiC by ultraviolet-photoluminescence. Solid State Phenom. 2016, 242, 484–489. [Google Scholar] [CrossRef]
  11. Hashemi, A.; Linderälv, C.; Krasheninnikov, A.V.; Ala-Nissila, T.; Erhart, P.; Komsa, H.P. Photoluminescence line shapes for color centers in silicon carbide from density functional theory calculations. Phys. Rev. B 2021, 103, 125203. [Google Scholar] [CrossRef]
  12. Chen, B.-Y.; Chi, C.-C.; Hsu, W.K.; Ouyang, H. Synthesis of SiC/SiO2 core–shell nanowires with good optical properties on Ni/SiO2/Si substrate via ferrocene pyrolysis at low temperature. Sci. Rep. 2021, 11, 233. [Google Scholar] [CrossRef]
  13. Hiller, D.; López-Vidrier, J.; Gutsch, S.; Zacharias, M.; Nomoto, K.; König, D. Defect-induced luminescence quenching vs. charge carrier generation of phosphorus incorporated in silicon nanocrystals as function of size. Sci. Rep. 2017, 7, 863. [Google Scholar] [CrossRef] [Green Version]
  14. Cheng, D.J.; Shyy, W.J.; Kuo, D.H. Growth characteristics of CVD beta-silicon carbide. J. Electrochem. Soc. 1987, 134, 3145–3149. [Google Scholar] [CrossRef]
  15. Wang, Z.; Dai, X.-Y.; Xu, S.-P.; Xu, M. Preparation of SiC powders by carbonthemal reduction method at low temperature. MATEC Web Conf. 2017, 114, 02015. [Google Scholar] [CrossRef] [Green Version]
  16. Gao, P.; Xin, J.; Liu, X.; Zheng, Y.; Shi, E. Control of 4H polytype of SiC crystals by moving up the crucible to adjust the temperature field of the growth interface. CrystEngComm 2019, 21, 6964–6968. [Google Scholar] [CrossRef]
  17. Shin, D.-G.; Kim, B.-S.; Son, H.-R.; Kim, M.-S. Study on the growth of 4H-SiC single crystal with high purity SiC fine powder. J. Korean Cryst. Growth Cryst. Technol. 2019, 29, 383–388. [Google Scholar]
  18. Luo, X.; Ma, W.; Zhou, Y.; Liu, D.; Yang, B.; Dai, Y. Radiation synthesis and photoluminescence property of silicon carbide nanowires via carbothermic reduction of silica. Nanoscale Res. Lett. 2010, 5, 252. [Google Scholar] [CrossRef] [Green Version]
  19. Ugraskan, V.; Isik, B.; Yazici, O.; Cakar, F. Surface characterization and synthesis of boron carbide and silicon carbide. Solid State Sci. 2021, 118, 106636. [Google Scholar] [CrossRef]
  20. Irfan, M.; Ajmal, M.; Mazhar, M.E.; Usmani, M.N.; Ahmad, S.; Abbas, W.; Mahmood, M.; Hussain, M. Growth and characterization of 4H-SiC by thermal evaporation method. Dig. J. Nanomater. Biostruct. 2019, 14, 243–247. [Google Scholar]
  21. Arora, A.; Pandey, A.; Patel, A.; Dalal, S.; Yadav, B.S.; Goyal, A.; Raman, R.; Thakur, O.P.; Tyagi, R. Polytype switching identification in 4H-SiC single crystal grown by PVT. J. Mater. Sci. Mater. Electron. 2020, 31, 16343–16351. [Google Scholar] [CrossRef]
  22. Liu, X.; Zhuo, S.-Y.; Gao, P.; Huang, W.; Yan, C.-F.; Shi, E.-W. Donor-acceptor-pair emission in fluorescent 4H-SiC grown by PVT method. AIP Adv. 2015, 5, 047133. [Google Scholar] [CrossRef]
  23. Khashan, K.S.; Ismail, R.A.; Mahdi, R.O. Synthesis of SiC nanoparticles by SHG 532 nm Nd:YAG laser ablation of silicon in ethanol. Appl. Phys. A 2018, 124, 443. [Google Scholar] [CrossRef]
  24. Aldalbahi, A.; Li, E.; Rivera, M.; Velazquez, R.; Altalhi, T.; Peng, X.; Feng, P.X. A new approach for fabrications of SiC basedphoto detectors. Sci. Rep. 2016, 6, 23457. [Google Scholar] [CrossRef] [PubMed]
  25. Nakashima, S.-I.; Mitani, T.; Tomobe, M.; Kato, T.; Okumura, H. Raman characterization of damaged layers of 4H-SiC induced by scratching. AIP Adv. 2016, 6, 015207. [Google Scholar] [CrossRef] [Green Version]
  26. Peng, Y.; Hu, X.; Xu, X.; Chen, X.; Peng, J.; Han, J.; Dimitrijev, S. Temperature and doping dependence of the Raman scattering in 4H-SiC. Opt. Mater. Express 2016, 6, 2725–2733. [Google Scholar] [CrossRef]
  27. Bauer, M.; Gigler, A.M.; Huber, A.J.; Hillenbrand, R.; Stark, R.W. Temperature-depending Raman line-shift of silicon carbide. J. Raman Spectrosc. 2009, 40, 1867–1874. [Google Scholar] [CrossRef]
  28. Wan, L.; Zhao, D.; Wang, F.; Xu, G.; Lin, T.; Tin, C.-C.; Feng, Z.; Feng, Z.C. Quality evaluation of homoepitaxial 4H-SiC thin films by a Raman scattering study of forbidden modes. Opt. Mater. Express 2018, 8, 119–127. [Google Scholar] [CrossRef]
  29. Kwasnicki, P. Evaluation of Doping in 4H-SiC by Optical Spectroscopies. Ph.D. Thesis, Université Montpellier II—Sciences et Techniques du Languedoc, Montpellier, France, 2014. [Google Scholar]
  30. Zhuo, S.-Y.; Liu, X.-C.; Xu, T.-X.; Yan, C.-F.; Shi, E.-W. Strong correlation between B-Al-N doping concentration fluctuation and photoluminescence effects of f-SiC. AIP Adv. 2018, 8, 075130. [Google Scholar] [CrossRef] [Green Version]
  31. Nagasawa, F.; Takamura, M.; Sekiguchi, H.; Miyamae, Y.; Oku, Y.; Nakahara, K. Prominent luminescence of silicon-vacancy defects created in bulk silicon carbide p–n junction diodes. Sci. Rep. 2021, 11, 1497. [Google Scholar] [CrossRef]
  32. Liu, L.; Liu, A.; Bai, S.; Lv, L.; Jin, P.; Ouyang, X. Radiation resistance of silicon carbide Schottky diode detectors in D-T fusion neutron detection. Sci. Rep. 2017, 7, 13376. [Google Scholar] [CrossRef] [PubMed] [Green Version]
  33. Allgaier, R.S. Extension of the aukerman-willardson two band hall coefficient analysis. J. Appl. Phys. 1965, 36, 2429. [Google Scholar] [CrossRef]
  34. Wei, Y.; Tarekegne, A.T.; Ou, H. Influence of negative-U centers related carrier dynamics on donor-acceptor-pair emission in fluoescent SiC. J. Appl. Phys. 2018, 124, 054901. [Google Scholar] [CrossRef] [Green Version]
  35. Zhuo, S.-Y.; Liu, X.-C.; Huang, W.; Kong, H.-K.; Xin, J.; Shi, E.-W. Photoluminescence in fluorescent 4H-SiC single crystal adjusted by B, Al, and N ternary dopants. Chin. Phys. B 2019, 28, 017101. [Google Scholar] [CrossRef]
  36. Rasheed, M.N.; Maryam, A.; Fatima, K.; Iqbal, F.; Afzal, M.; Syvajarvi, M.; Murtaza, H.; Zhu, B.; Asghar, M. Enhanced electrical properties of nonstructural cubic silicon carbide with graphene contact for photovoltaic applications. Dig. J. Nanomater. Biostruct. 2020, 15, 963–972. [Google Scholar]
  37. Alhusaiki-Alghamdi, H.M. Effect of silicon carbide (SiC) nanoparticles on the spectroscopic properties and performance of PMMA/PC Polymer Blend. J. Mod. Phys. 2019, 10, 487–499. [Google Scholar] [CrossRef] [Green Version]
Figure 1. Flowchart for the fabrication of 4H-SiC crystals with the PVT process with three differently treated starting materials of 3C-SiC (S1, S2, and S3).
Compounds 02 00006 g001
Figure 2. (a) Photo image of a two-inch 4H-SiC crystal grown with the PVT process with 3C-SiC powder and (b) a visible-light-emitting fluorescent 4H-SiC sample excited by a 325 nm laser source.
Compounds 02 00006 g002
Figure 3. X-ray diffraction (XRD) patterns of three differently treated starting materials of 3C-SiC powder (S1, S2, and S3).
Compounds 02 00006 g003
Figure 4. X-ray diffraction (XRD) patterns of the 4H-SiC crystal samples prepared with the PVT process with three different starting materials (S1, S2, and S3).
Compounds 02 00006 g004
Figure 5. Raman spectra of the three 4H–SiC crystal samples: (a) wide scan and (b) narrow scan of the LO peak.
Compounds 02 00006 g005
Figure 6. PL spectra of 4H-SiC crystal samples measured at (a) room temperature (T = 298 K) and (b) an extremely low temperature (T = 50 K) in a wavelength range of 300 to 900 nm.
Compounds 02 00006 g006
Figure 7. Schematic diagram of the proposed recombination paths with the elemental impurities incorporated into the 4H-SiC crystals.
Compounds 02 00006 g007
Figure 8. (a) Optical transmittance and (b) absorbance spectra of 4H-SiC crystal samples at room temperature (T = 298 K).
Compounds 02 00006 g008
Figure 9. Plots of the variation in (αhυ)2 versus photon energy (hυ) of the 4H-SiC crystal samples grown with the PVT method with different 3C-SiC powders: (a) S1 sample and (b) S3 sample.
Compounds 02 00006 g009
Table 1. Experimental conditions and identification for the growth of the 4H-SiC crystal samples.
Sample ConditionsTreatment MethodIdentification
PristinePulverizationS1
Step AAcid leaching and decarburizationS2
Step BDenitrificationS3
Table 2. Elemental composition measured by ICP-OES and an element analyzer with the different 4H-SiC crystal samples (ppm: part per million, mg/kg).
Sample ConditionElement Composition
S1S2S3
SiC (wt%)99.5 wt%99.7 wt%99.8 wt%
N (mg/kg)2097310220
B (mg/kg)9.251.930.17
Al (mg/kg)560.120.10
Table 3. Calculated concentrations of B, N, and Al using the ICP-OES results (atoms/cm3).
Sample ConditionThe Calculated Concentration (atoms/cm3)
S1S2S3
CN (atoms/cm3)2.10 × 10203.10 × 10192.20 × 1019
CB (atoms/cm3)1.20 × 10182.50 × 10172.20 × 1016
CAl (atoms/cm3)2.90 × 10186.12 × 10154.99 × 1015
RDA of CD-A (a.u.)464946
The ratio of 2CB/(CNCB)0.010.020.002
Publisher’s Note: MDPI stays neutral with regard to jurisdictional claims in published maps and institutional affiliations.

