1. Introduction
The Sixth Assessment Report (AR6) of the Intergovernmental Panel on Climate Change (IPCC) reported that the average global surface temperature has risen by approximately 1 °C compared to 1850–1900, and forecasted that the global average temperature rise is expected to reach or exceed 1.5 °C in the next 20 years [
1,
2]. This report predicts that, because of this increase in temperature, climate change will intensify over the next few decades. When the global temperature rises by 1.5 °C, the frequency of heat waves will increase, the length of the warm season will be extended, and the cold season will be shortened; when the global temperature rises by 2 °C, the high temperature extremes will increase. These changes will cause the critical tolerance thresholds for agriculture and human health to be reached more frequently. Issues caused by climate change are not only temperature-based, but will bring additional combinations of changes to different regions. Further warming will cause changes such as shifts in dryness, humidity, wind, snow, and ice [
1,
2]. In China, extreme events, such as regionally persistent heavy rainfall, high temperatures and heat waves, and persistent drought, have attracted wide attention due to their potential regional hazards.
Central China is a key area for the transient between China’s east–west and north–south borders and is a hub for land and water transportation. This region has a developed agriculture and a foundation for light and heavy industries [
3]. Central China has a large north–south span with a complex weather system. Extreme precipitation events can trigger floods in central China and can have a significant impact on the industrial and agricultural production, including the local population [
4]. In particular, low-probability, high-intensity, long-lasting rainstorms can lead to frequent large-scale severe floods, and can often cause a major loss of life and property [
5,
6]. Therefore, to ensure the sustainable development of the economy in central China, it is of great significance to study the development and evolution of extreme climate events in central China.
Research on climate extremes mainly focuses on the extreme value of various climactic events, the analysis of the changing trend of the extreme climate index, the frequency, intensity and change in major precipitation and temperature events, and the research on some major extreme climate events as they occur. Many have conducted an analysis on the impact of extreme climate events on agriculture, ecology, energy, etc. [
7,
8,
9,
10,
11,
12,
13,
14].
When determining the extreme climate index, many scholars choose suitable indices to discuss the changing characteristics and trends of the climate events, based on the extreme climate index published by the World Meteorological Organization (WMO). For example, Klein Tank and Können used the extreme climate index to study the trends of daily extreme climate and precipitation in Europe [
15]. Studies by some scholars have shown that, in the past half-century, the difference between the maximum and minimum temperature has been significantly reduced [
16]. Gallant analyzed the trend of the extreme climate index changes in the United States, Europe, and Australia from 1950 to 2012, to study the impact of climate change on those countries [
17]. Pita-Díaz and Ortega-Gaucin used the climate change index to analyze changes in temperature and precipitation extremes in Zacatecas, Mexico [
18]. Lucas et al. used daily high-resolution grid data to analyze 22 extreme climate indices from 1980 to 2016 in the XRB, located in the Amazon region of Brazil. The research results show that, in recent decades, both the day and night have become warmer [
19]. The rainfall in the central and southern parts of the XRB shows a downwards trend, while the rainfall in the northern part of the basin shows an increasing trend [
19]. Some scholars have found that, in the past 100 years, there has been a clear trend of humidification in Central Asia [
20]. A variety of papers analyzed extreme climate indices in many regions of the world, including Asia, America, and Africa [
21,
22,
23,
24].
China’s research on extreme climates is mainly focused on the above five aspects. In terms of extreme climate indices research, Shi et al. analyzed the extreme continuous diurnal trends of temperature and precipitation in China from 1961 to 2015. The results show that China’s duration of cold periods (CSDI) and duration of warm periods (WSDI) are 0.9 days and 0.1 days per decade, respectively [
25]. The CSDI has dropped significantly, while the WSDI has increased significantly, at a rate of 0.8 days per decade [
25]. He et al. used an independent and comprehensive climate index to quantitatively assess extreme climate events in Guangdong [
26]. Many scholars have conducted detailed analyses on the distribution and changing trends of multiple extreme climate indices in the region [
27,
28,
29,
30]; Zhai and Liu pointed out that the frequency of heavy rainfall events in the middle and lower reaches of the Yangtze River has increased, while droughts in the northeast, north, and southwest regions are clearer, and high temperatures and heat waves occur more frequently in the eastern region [
31]. Liu and Xu pointed out that the total amount of precipitation in the southwestern region decreased slightly, but the maximum daily precipitation and precipitation intensity increased significantly [
32]. Ju et al. showed that the highest and lowest temperature in East China are both increasing [
33].
However, few have considered the entirety of central China as the area of research when studying the regional trends and impact of extreme climate indices. This article aims to analyze the extreme climate characteristics of the four provinces in central China by nine selected extreme climate indices, and quantify the variation patterns and temporal-spatial distribution characteristics of temperature and precipitation extreme events of central China from 1988 to 2017.This work aims to also provide a scientific basis and reference for decision-making in disaster prevention and mitigation in central China under the background of future climate change.
2. Materials and Methods
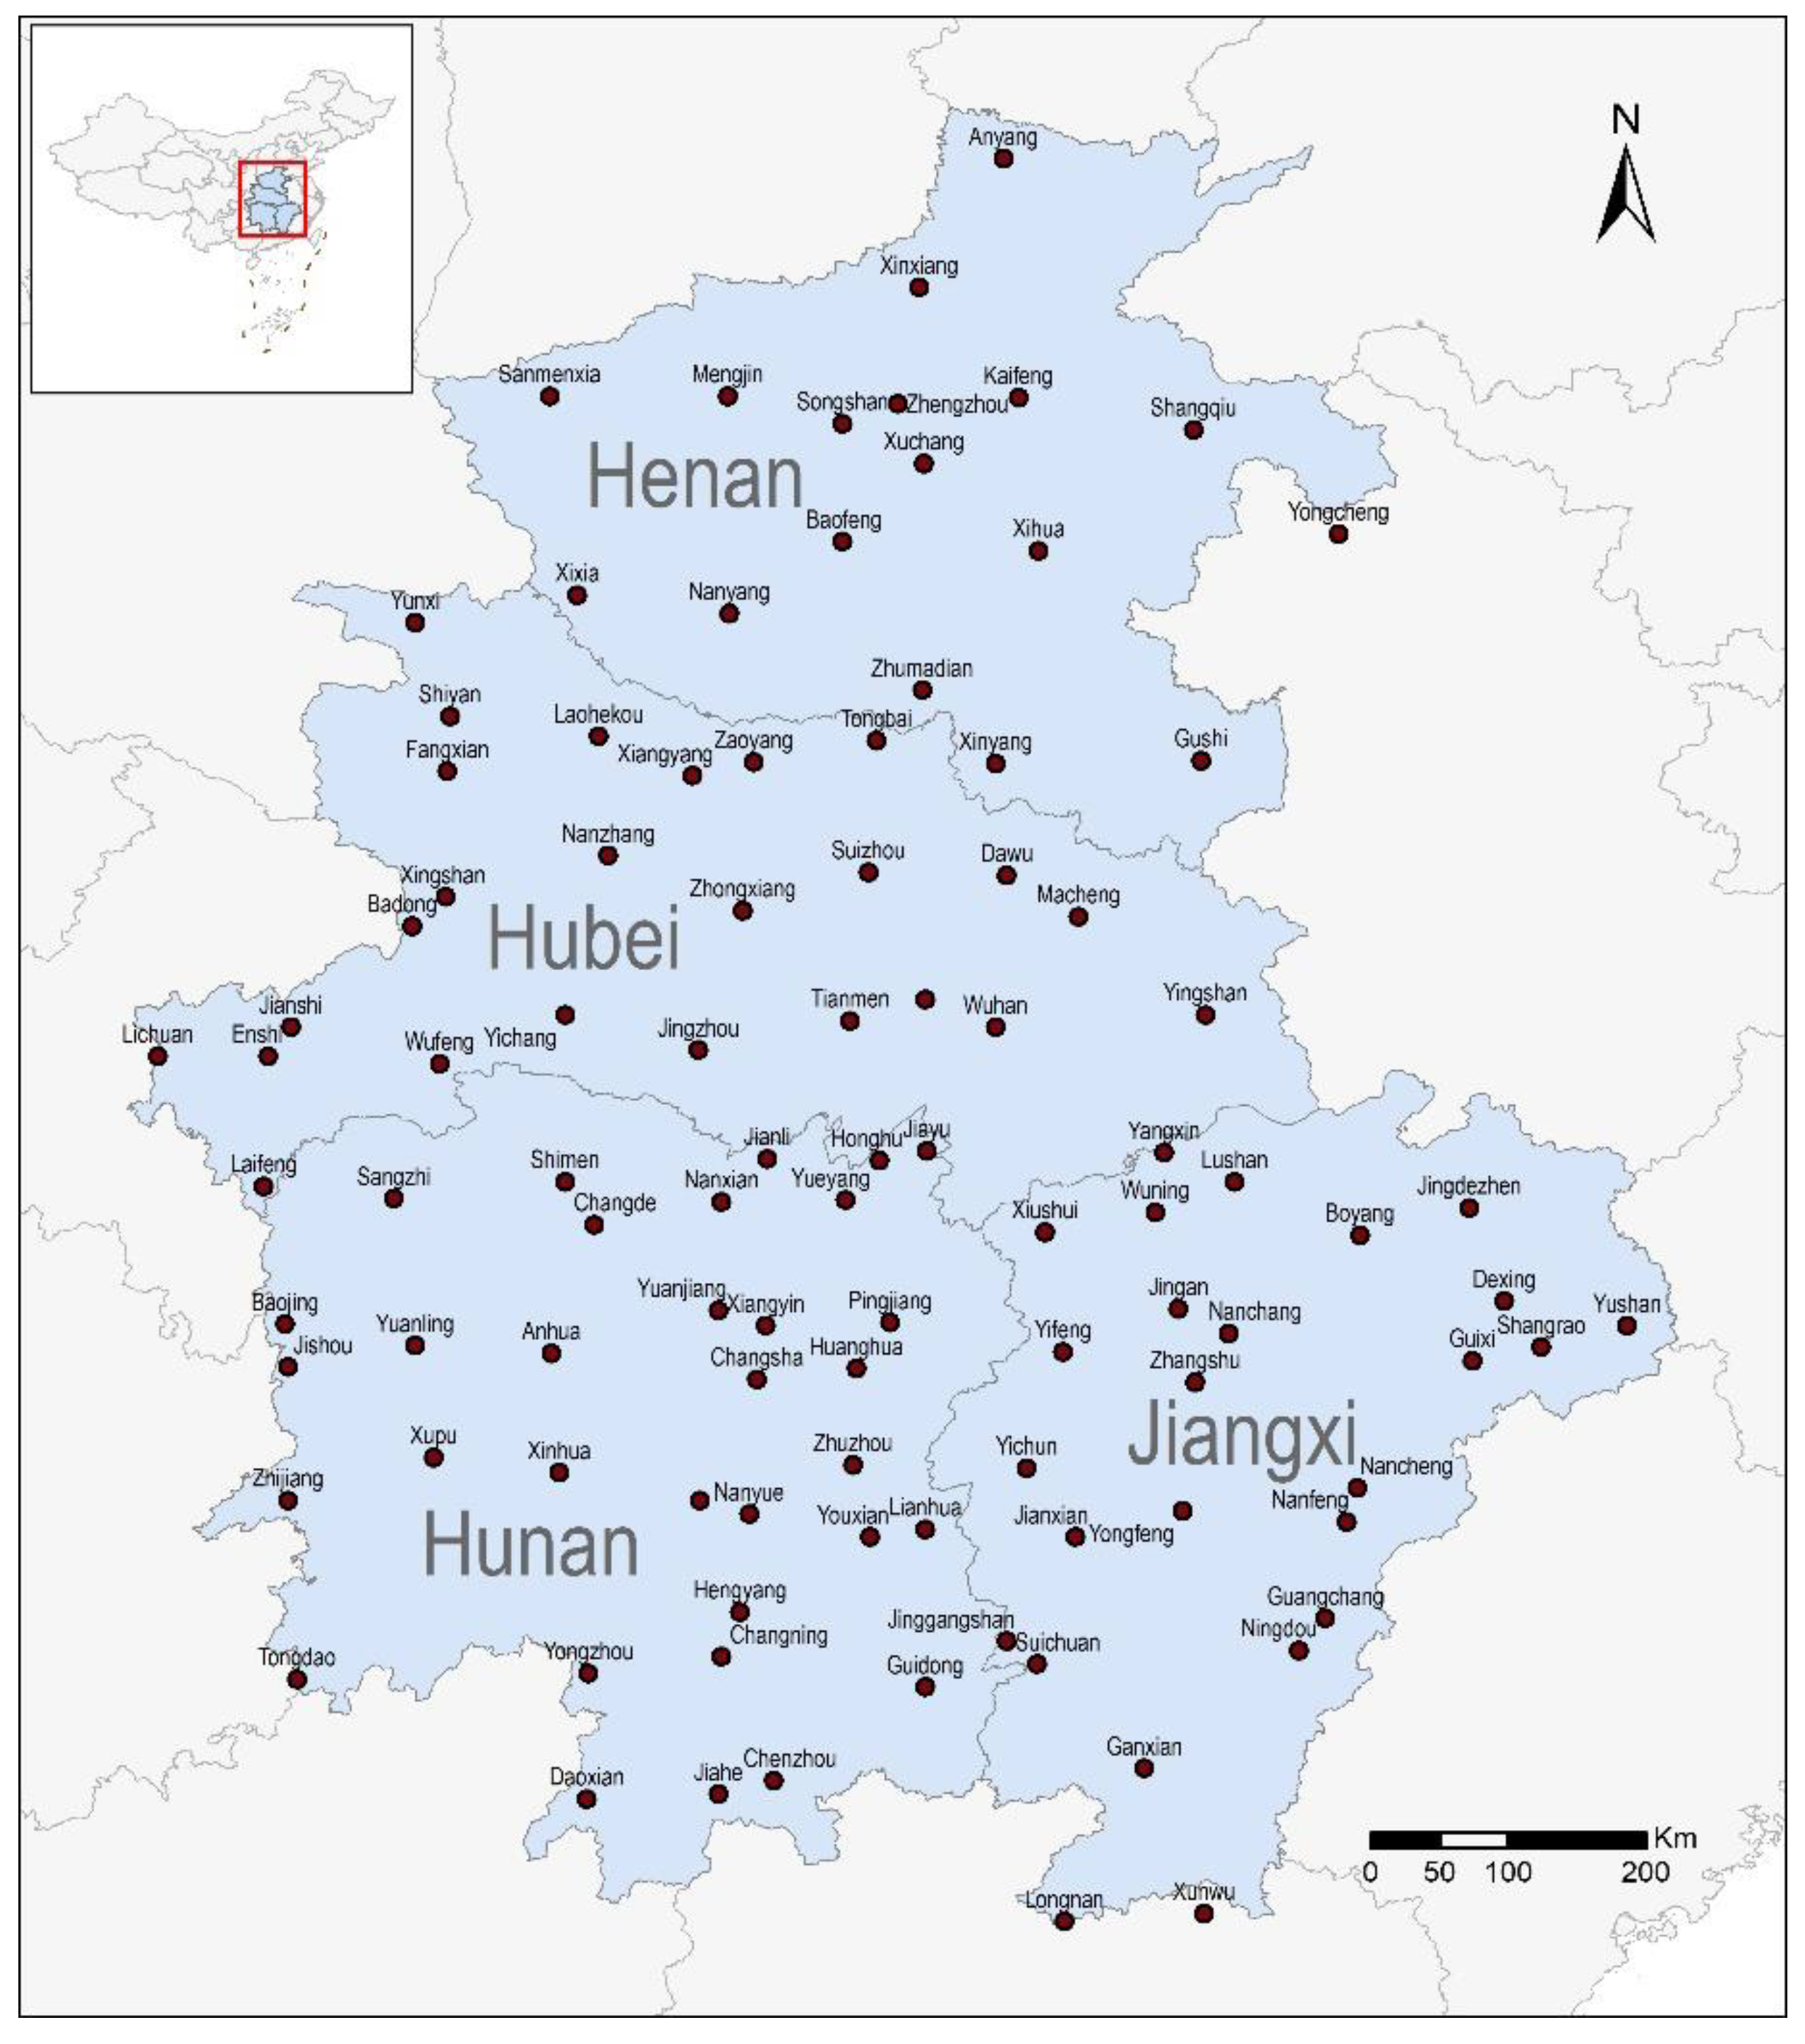
The daily precipitation series, daily maximum and minimum temperature series of 101 meteorological stations (
Figure 1) in central China (Henan, Hubei, Hunan, Jiangxi) from 1988 to 2017 (30 years) were used. The data came from the National Meteorological Information Center. We conducted a quality control process on the data to eliminate the impact of site relocation or missing records. For example, Songshan in Henan Province was eliminated due to the lack of years recorded.
The purpose of this study was to quantify the changes in extreme events of temperature and precipitation in the four provinces of central China, from 1988 to 2017. Considering the impact of continuous extreme climate events, we selected four of the extreme climate indices published by the WMO, which are WSDI, CSDI, CDD, and CWD. Considering the temperature and precipitation extremes, the five indices of ID, FD, TNn, TXx, and R95 were selected. By studying the temporal changes and spatial distribution of these nine extreme climate indices, the characteristics of the extreme climate events in the four provinces of central China were analyzed. The definitions of the indices are shown in
Table 1. Since the daily maximum air temperature (TXx) had a greater impact in the summer, and the daily minimum air temperature (TNn) had a greater impact in the winter, TXx in the summer and TNn in the winter were emphatically analyzed.
To analyze the characteristics of the extreme climate index, a linear trend analysis method was used to discuss the variation trend of each element. The Mann–Kendall test method was used for the climate mutation testing of the extreme climate indices. This method was not limited to the distribution of samples, and could also exclude a few interferences of outliers [
10]. It was suitable for meteorological non-normally distributed data, and the calculation was convenient. Climate mutation referred to the change of statistical characteristics of the climate state, which was manifested as the discontinuity of climate change. It was a phenomenon that the climate changes abruptly from one stable state to another. Among several detection methods of climate mutation, the Mann–Kendall method was very confident in the detection of mean mutation. It is a nonparametric statistical test method. Its advantage is that it does not need samples to follow a certain distribution, nor is it disturbed by a few outliers, and the calculation is relatively simple. Therefore, the Mann–Kendall test method is an effective tool recommended by WMO (World Meteorological Organization) for analyzing abrupt climate changes and related climatological research.
To analyze the temporal variation characteristics of each extreme climate index, the wavelet analysis method was used to study its periodicity. The wavelet analysis method introduced the window Fourier transform, which can obtain the frequency characteristics of physical quantities, and can also present the variation of the period with time, which is one of the important methods of period analysis.
To understand and master the cyclical change characteristics of the extreme climate indices in central China, wavelet analyses were conducted on the nine extreme climate indices, the significant oscillation periods, and the oscillation strength changes of the main periods at different times were obtained. First, the original time series of the extreme climate indices was standardized to eliminate the influence of units on the data analysis. Subsequently, the 95% confidence interval of the wavelet and the period range that passed the 0.05 significance level test were obtained by analyzing the wavelet power spectrum and the real part of the wavelet coefficients, to understand the characteristics of the main period change with time. By drawing the full spectrum of the wavelet, the changes of the main period of the extreme climate index and the main period passing the significance test were obtained.
3. Results
3.1. Spatial Distribution of the Extreme Temperature Index
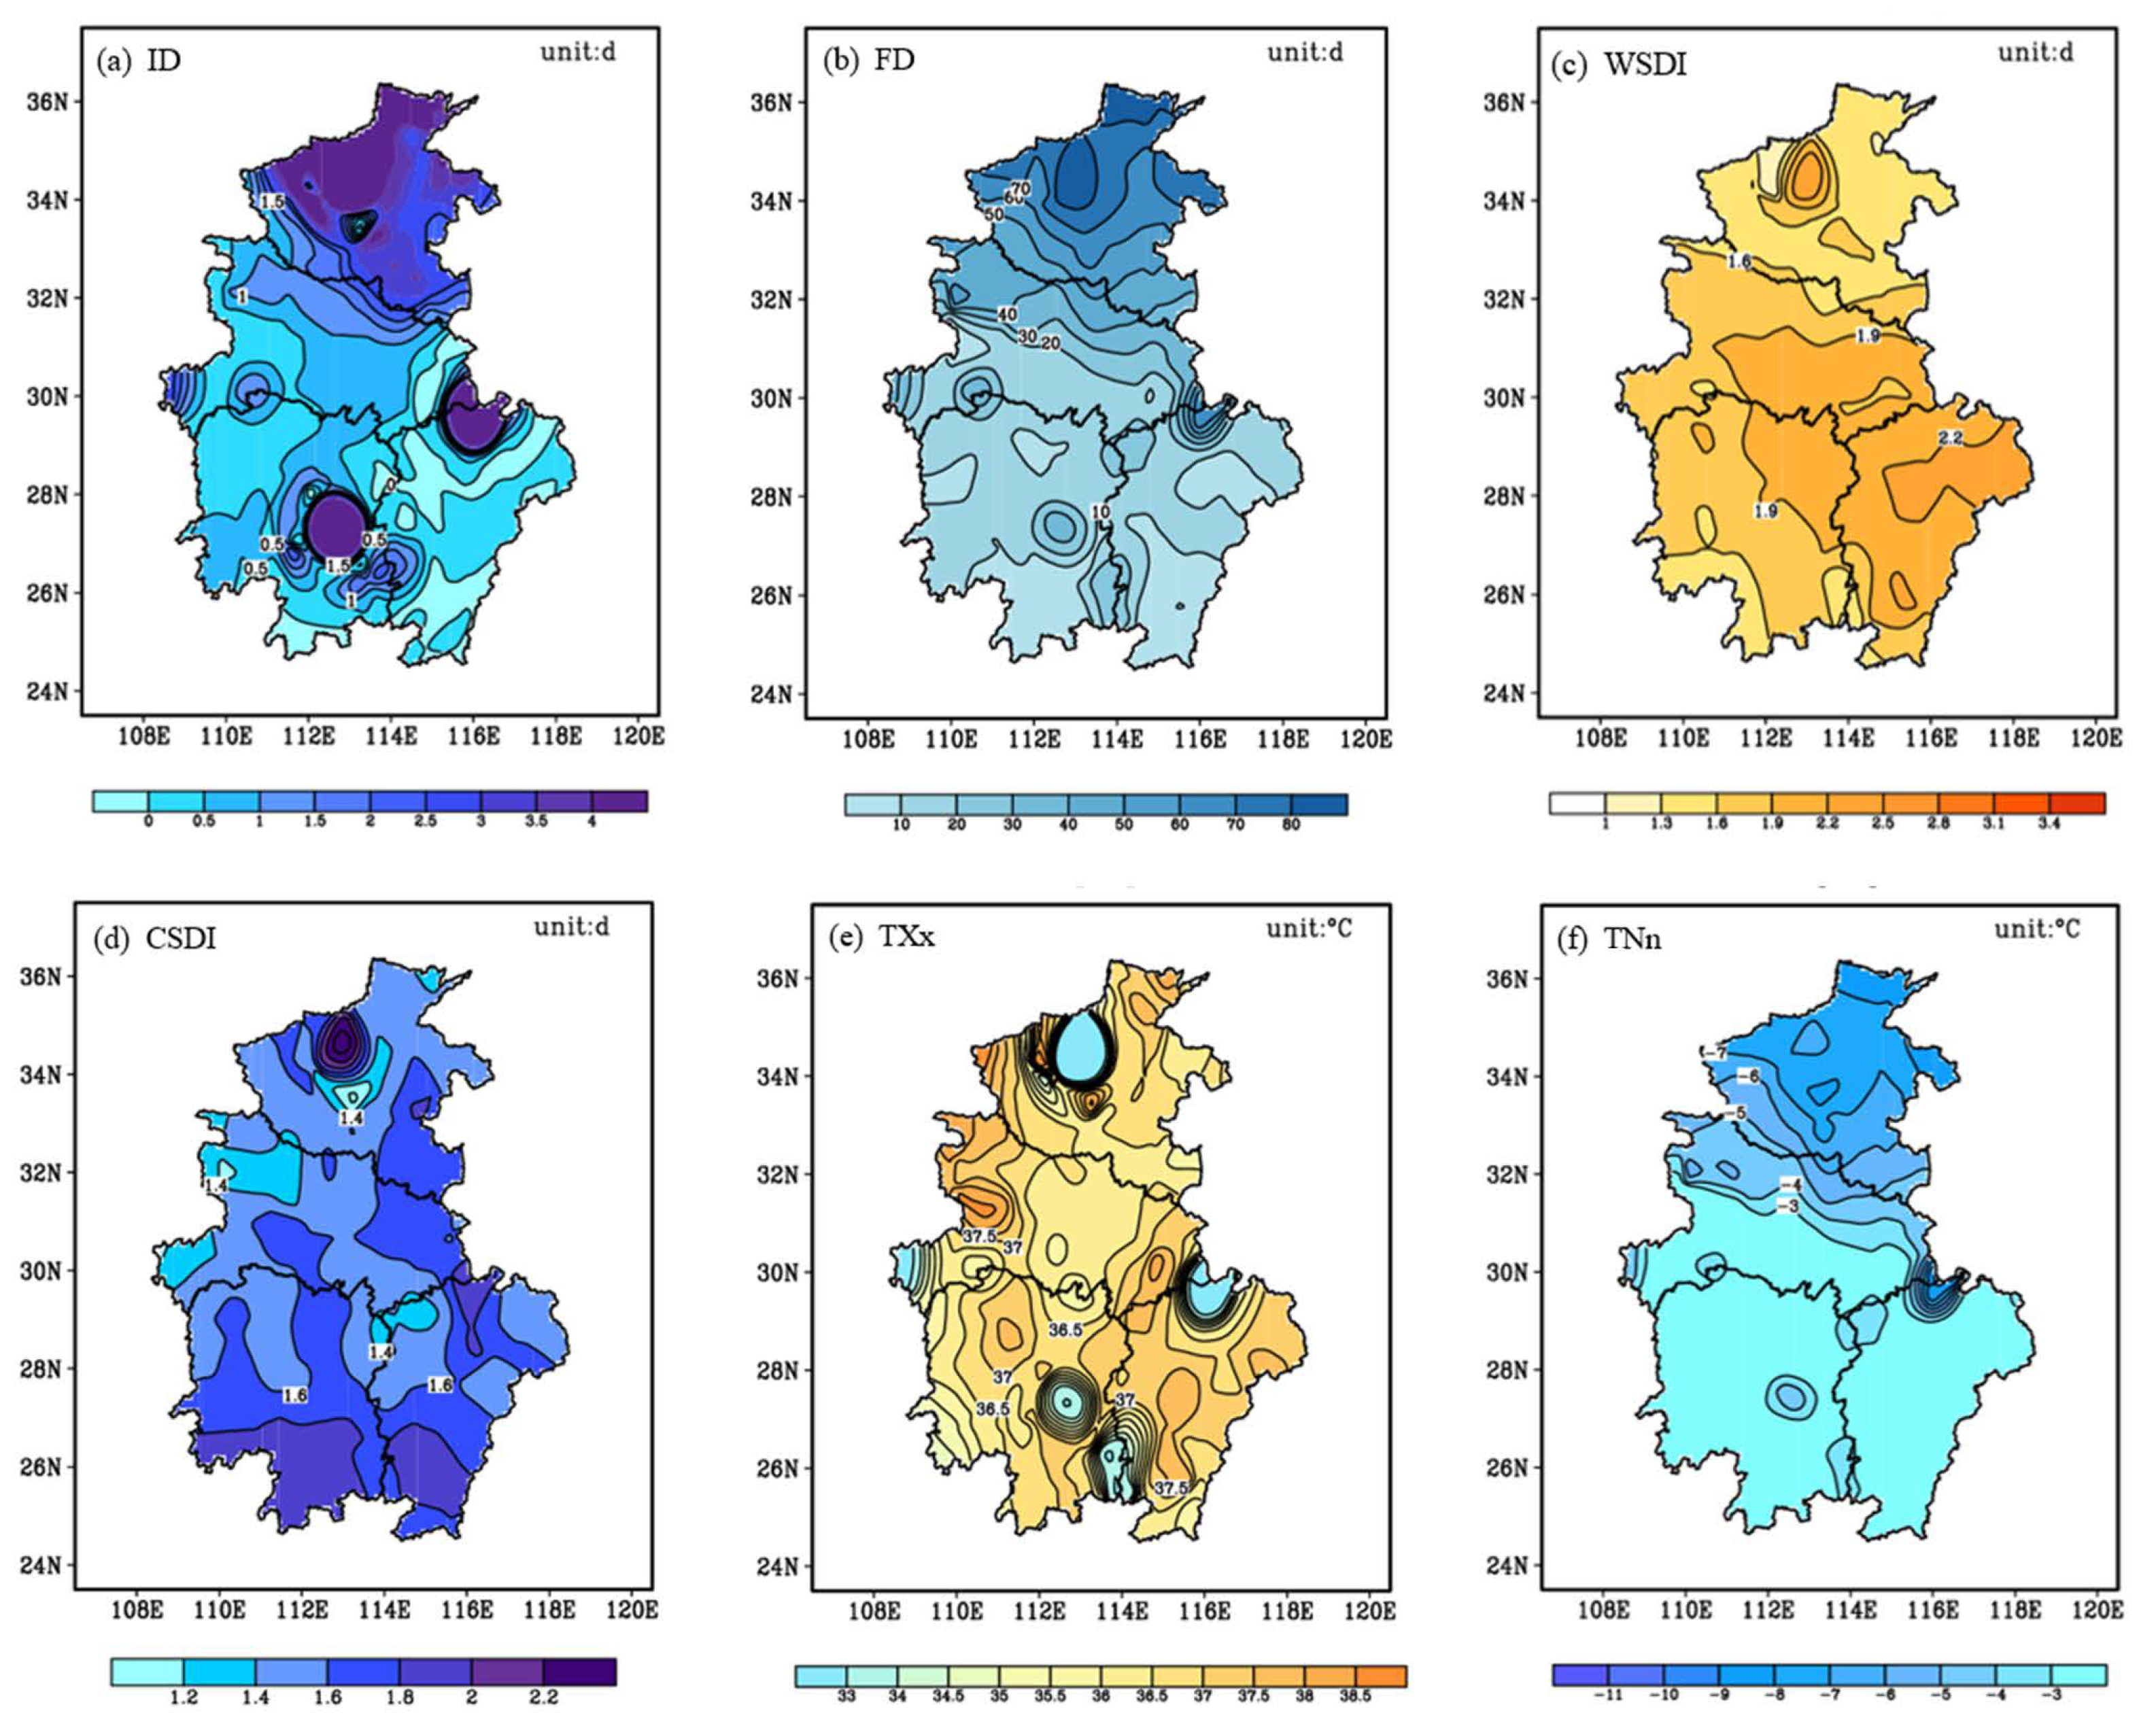
From the spatial distribution map of the six extreme temperature indices in central China (
Figure 2), it can be seen that the extreme temperature indices have clear spatial distribution characteristics, and are closely related to latitude and topography.
The cold series indices include icing days (ID), frost days (FD), duration of cold periods, and the lowest minimum temperature (TNn). The spatial distribution map shows that the number of icing days (ID) and the number of frost days (FD) both gradually decrease from north to south. The large value areas are concentrated in Henan and northern Hubei, while southern Hubei, Hunan, and Jiangxi are the low-value areas in central China. In addition, Lushan Mountain in northern Jiangxi and Nanyue Mountain in southeastern Hunan have significantly more freezing days and frost days than surrounding areas, due to their high altitudes.
The duration of cold periods was shorter in the north and longer in the south. The area with the highest values were located in Hunan and southwestern Jiangxi. In contrast, Henan and Hubei had fewer cold duration days, and the distribution in Hubei was shorter in the west and longer in the east. The lowest minimum temperature (TNn) in central China gradually decreased from south to north. The average low-temperature center in winter in central China was mainly located in Henan. Hunan and Jiangxi were the areas with high winter temperatures in central China; generally higher than −3°C. However, affected by the mountainous topography, the TNn indices of Nanyue in Hunan and Lushan in Jiangxi reached −8.0 °C and −8.8 °C, respectively.
The warm series indices include the duration of warm periods and highest maximum temperature. The duration of the warm periods was longer in the south and shorter in the north. Most of the Jiangxi Province, central and eastern Hubei Province and eastern Hunan Province were high-value areas located in central China, and the occurrence of warm persistent events was generally more than double; the high-value areas gradually increased from west to east, indicating that the high-temperature events were persistent in these areas, making the regions prone to drought. Among them, Jiangxi had the highest number of persistently warm days. The number of warm sustained days in Hunan was generally characterized by a decreasing distribution from northeast to southwest, which are mostly related to the geomorphological characteristics of the mountains on the east, south, and west sides of Hunan.
The average value of the TXx index in central China in summer was 36.5 °C, and the high-value areas were mainly concentrated in Henan and western Hubei. Among them, Xingshan in Hubei had the highest value of the summer daily maximum temperature in central China, reaching 38.9 °C. The TXx index in Hubei showed the distribution characteristics of low in the middle and high in the east and west. The high-value area of TXx index in Hunan was located in the northern region, and the high-value area of TXx index in Jiangxi was located in the northwest and central regions of Jiangxi, both exceeding 37 °C.
3.2. Time Change Trend Analysis of the Extreme Temperature Index
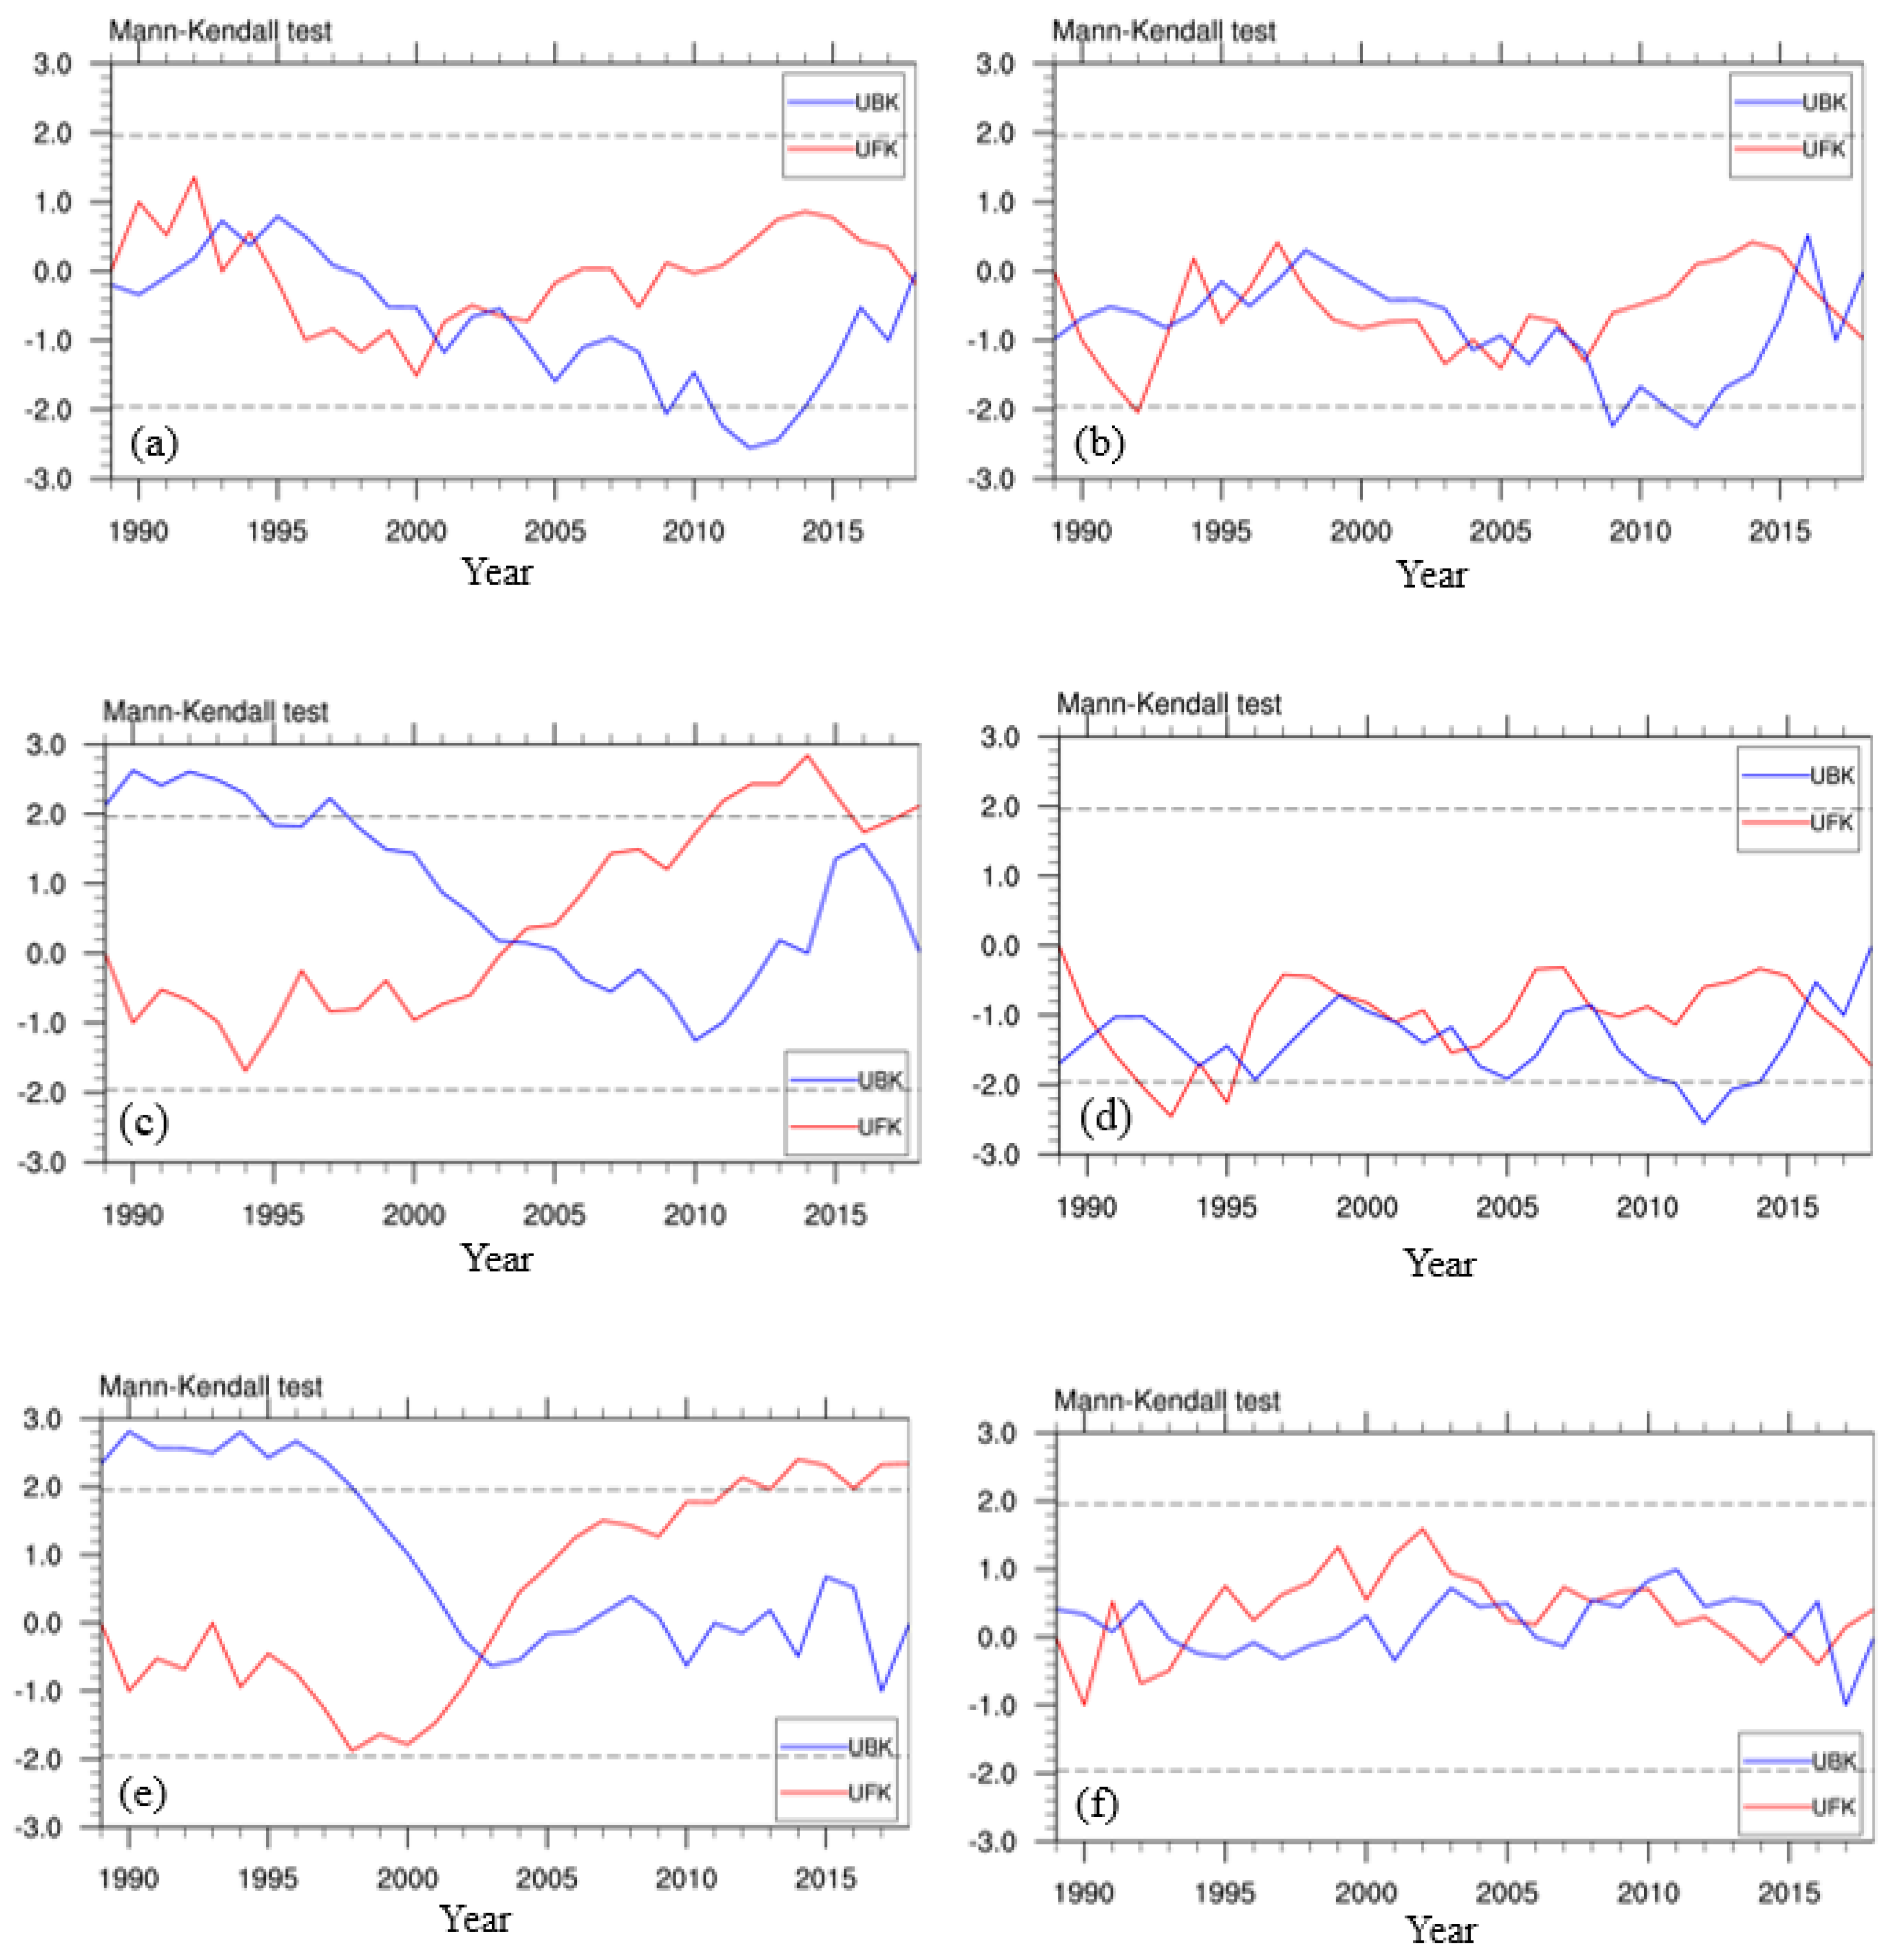
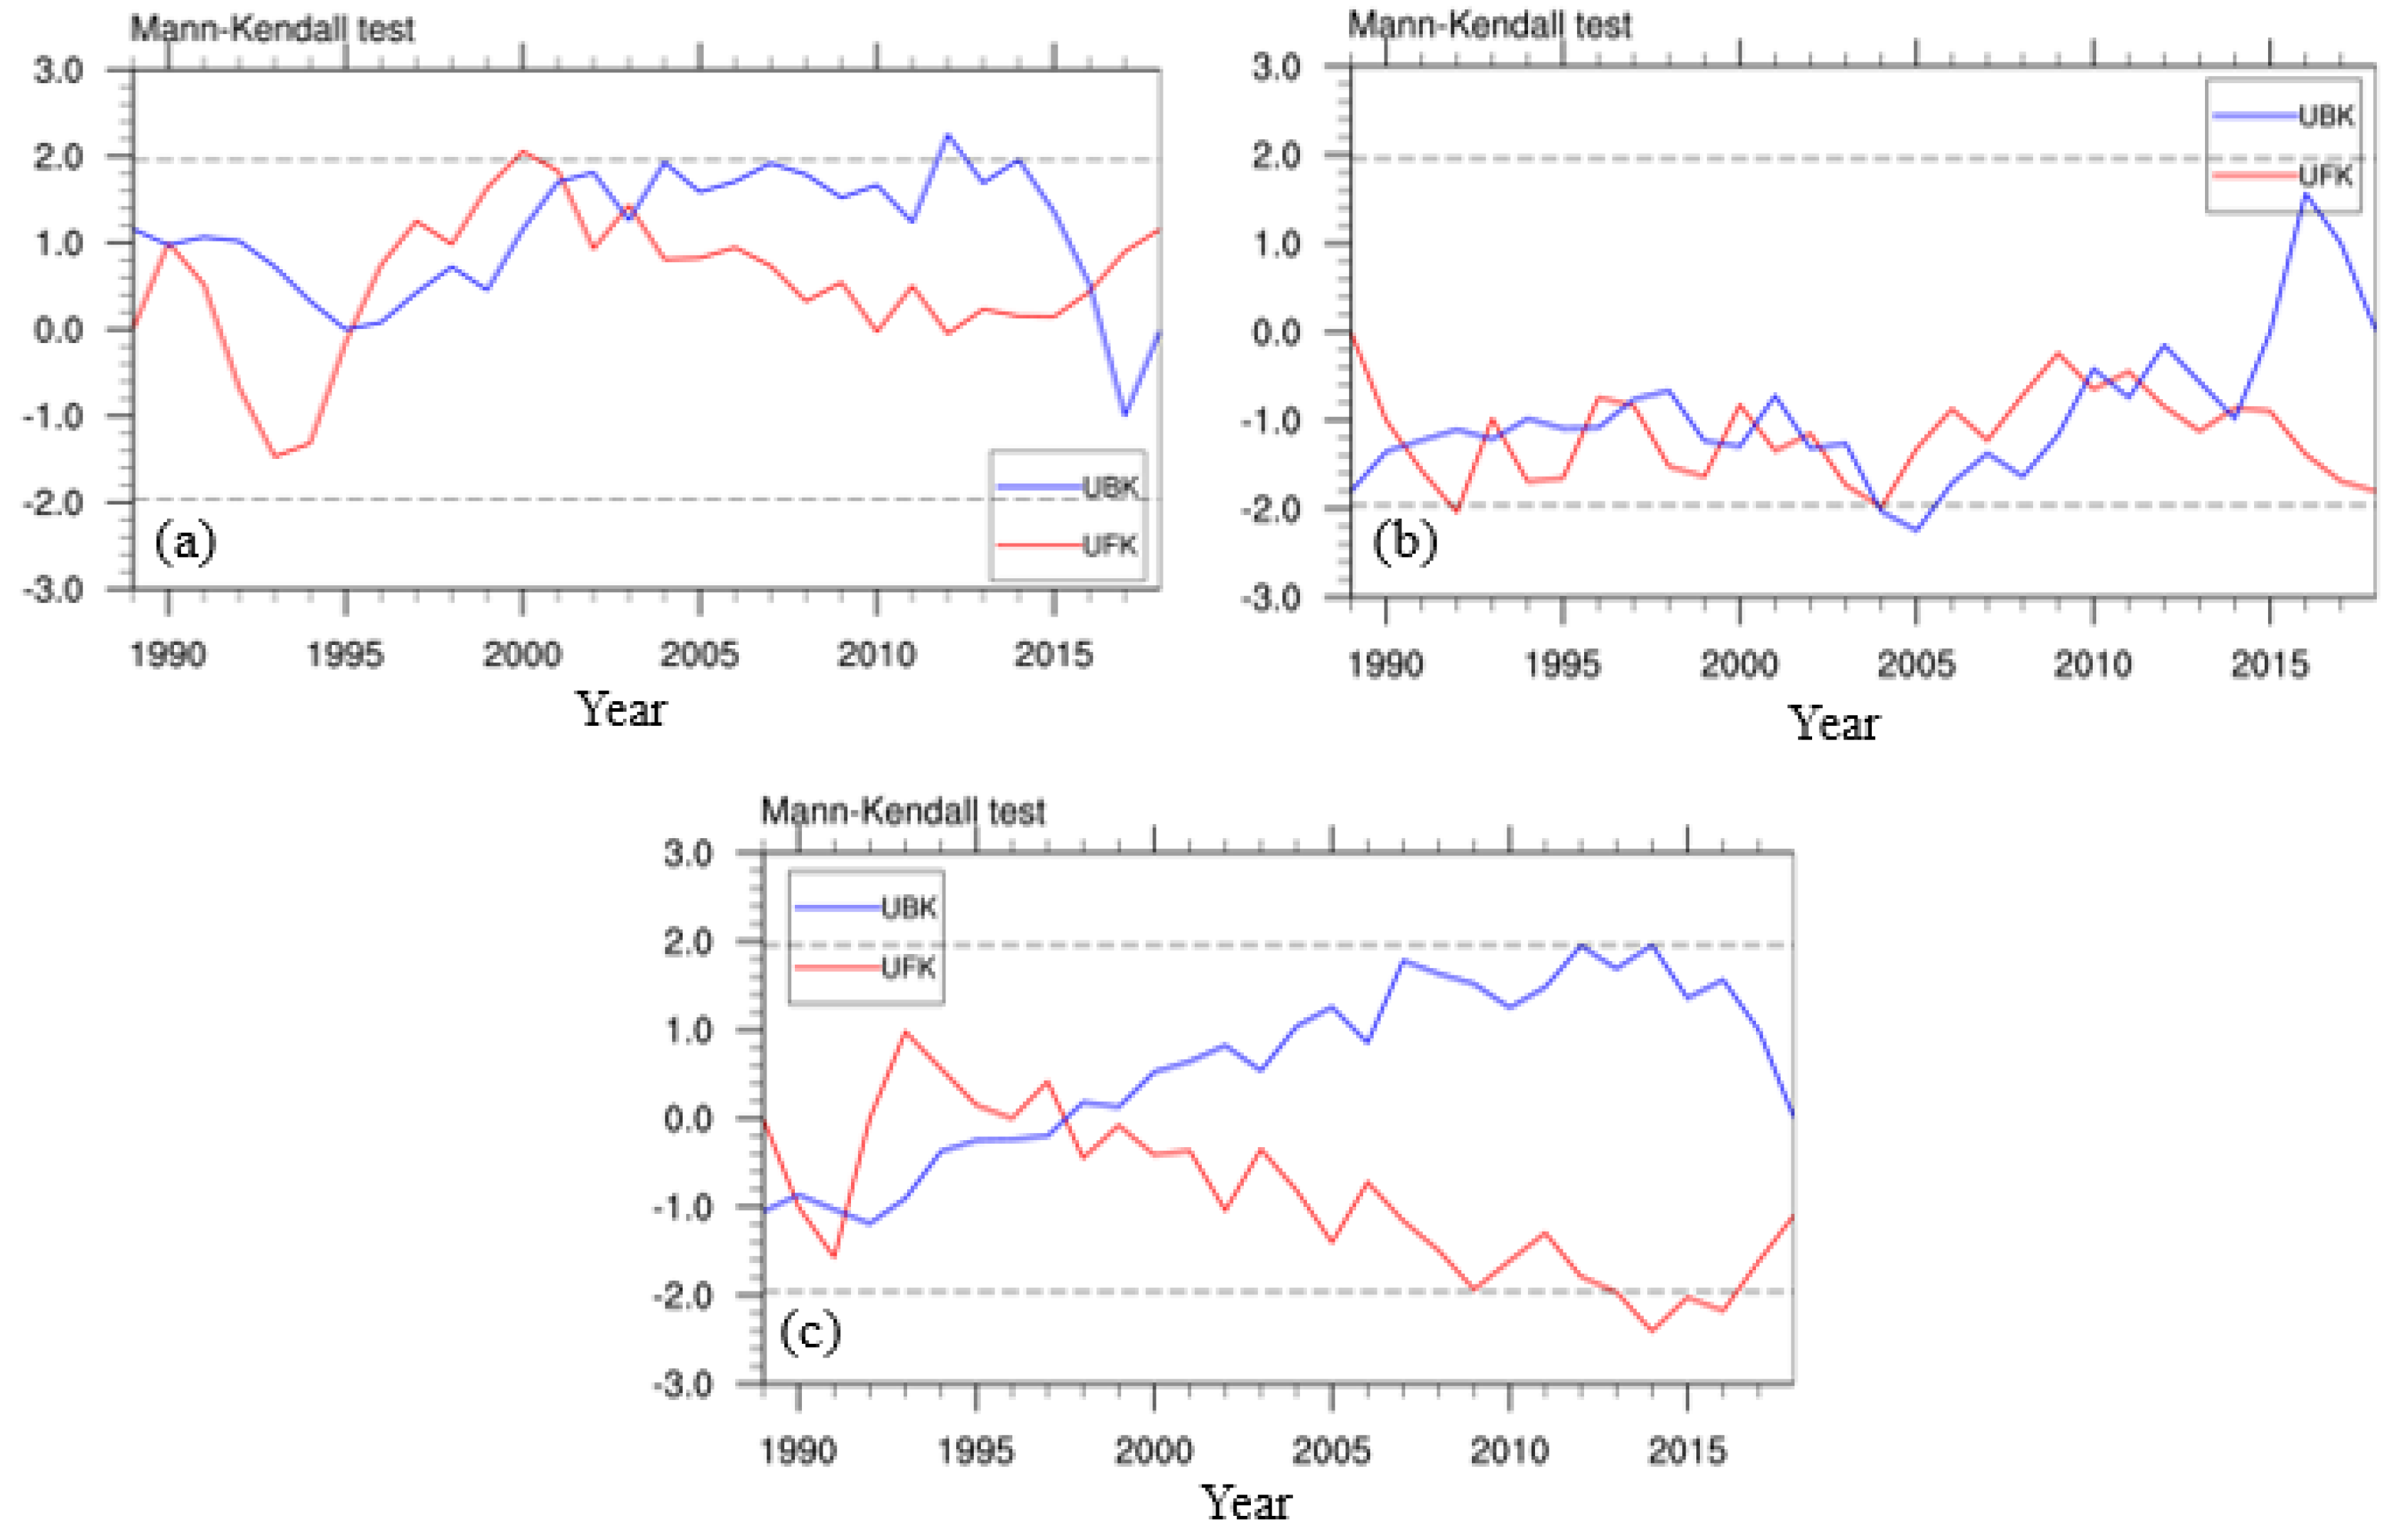
The Mann–Kendall method (
Figure 3) was used to test the trend of each extreme temperature index in central China in combination with trend analysis (see
Table 2 for test statistics). The results showed that the trends of each extreme climate index were different. Combined with
Figure 3 and
Table 2, if the UF
K value is greater than 0, it indicates that the sequence shows an upward trend, and if it is less than 0, it indicates a downward trend. When UF
K and UB
K exceed the critical value, it indicates that the upward or downward trend is significant. The time that UF
K and UB
K curves intersect is the time when the mutation starts.
From the overall trend, only the CSDI index in the cold series index (ID, FD, CSDI, TNn) had a significant change, and the rate of change decreases with −0.19n/10a, indicating that the number of cold duration days had a tendency to decrease annually, with the duration of low temperature events becoming shorter. The warm series indices (WSDI, TXx) showed a significant increasing trend, WSDI increased with a linear trend of 0.25 d/10 a, and TXx increased with a linear trend of 0.30 °C/10a, indicating that there were more continuous warm events in central China, and the high value of the hottest temperature increases significantly. The duration of extremely high temperature events and the intensity of the events increased.
According to the results of the Mann–Kendall mutation test, there were climate mutations in several extreme temperature indices, as shown by the mutation of both the ID index and WSDI index in 2004, the mutation of the FD index in 2008, and the mutation of the TXx index in 2003. The results of the segmented trend analysis of the extreme climate index show that, after 2008, the frost index had a significant decrease, indicating that the winter and spring in central China will be warmer after 2008, and the number of days with minimum daily temperature below 0 °C will be decreased.
As seen from the above, the warm series indices (WSDI, TXx) have a significant linear trend, and abrupt climate change exists. The averages of the values before and after the mutation were further calculated, and the results showed that the warm series index average in central China increased significantly after the mutation. Specifically, the average durations of the warm periods were 1.6 times more than in 1988–2003, and 2.1 times more than in 2004–2017. The TXx in central China was 36.1 °C in 1988–2002, and 36.8 °C in 2003–2017. In addition, the maximum WSDI (3d) and TXx index (38 °C) appeared in 2013. This may be related to the sustained, large-scale, high-temperature event in China during the mid-summer of 2013. Some studies suggest that the sustained high temperature event in 2013 may be affected by the continued strength of the western Pacific subtropical high and the westward ridge point.
3.3. Periodic Analysis of the Extreme Temperature Index
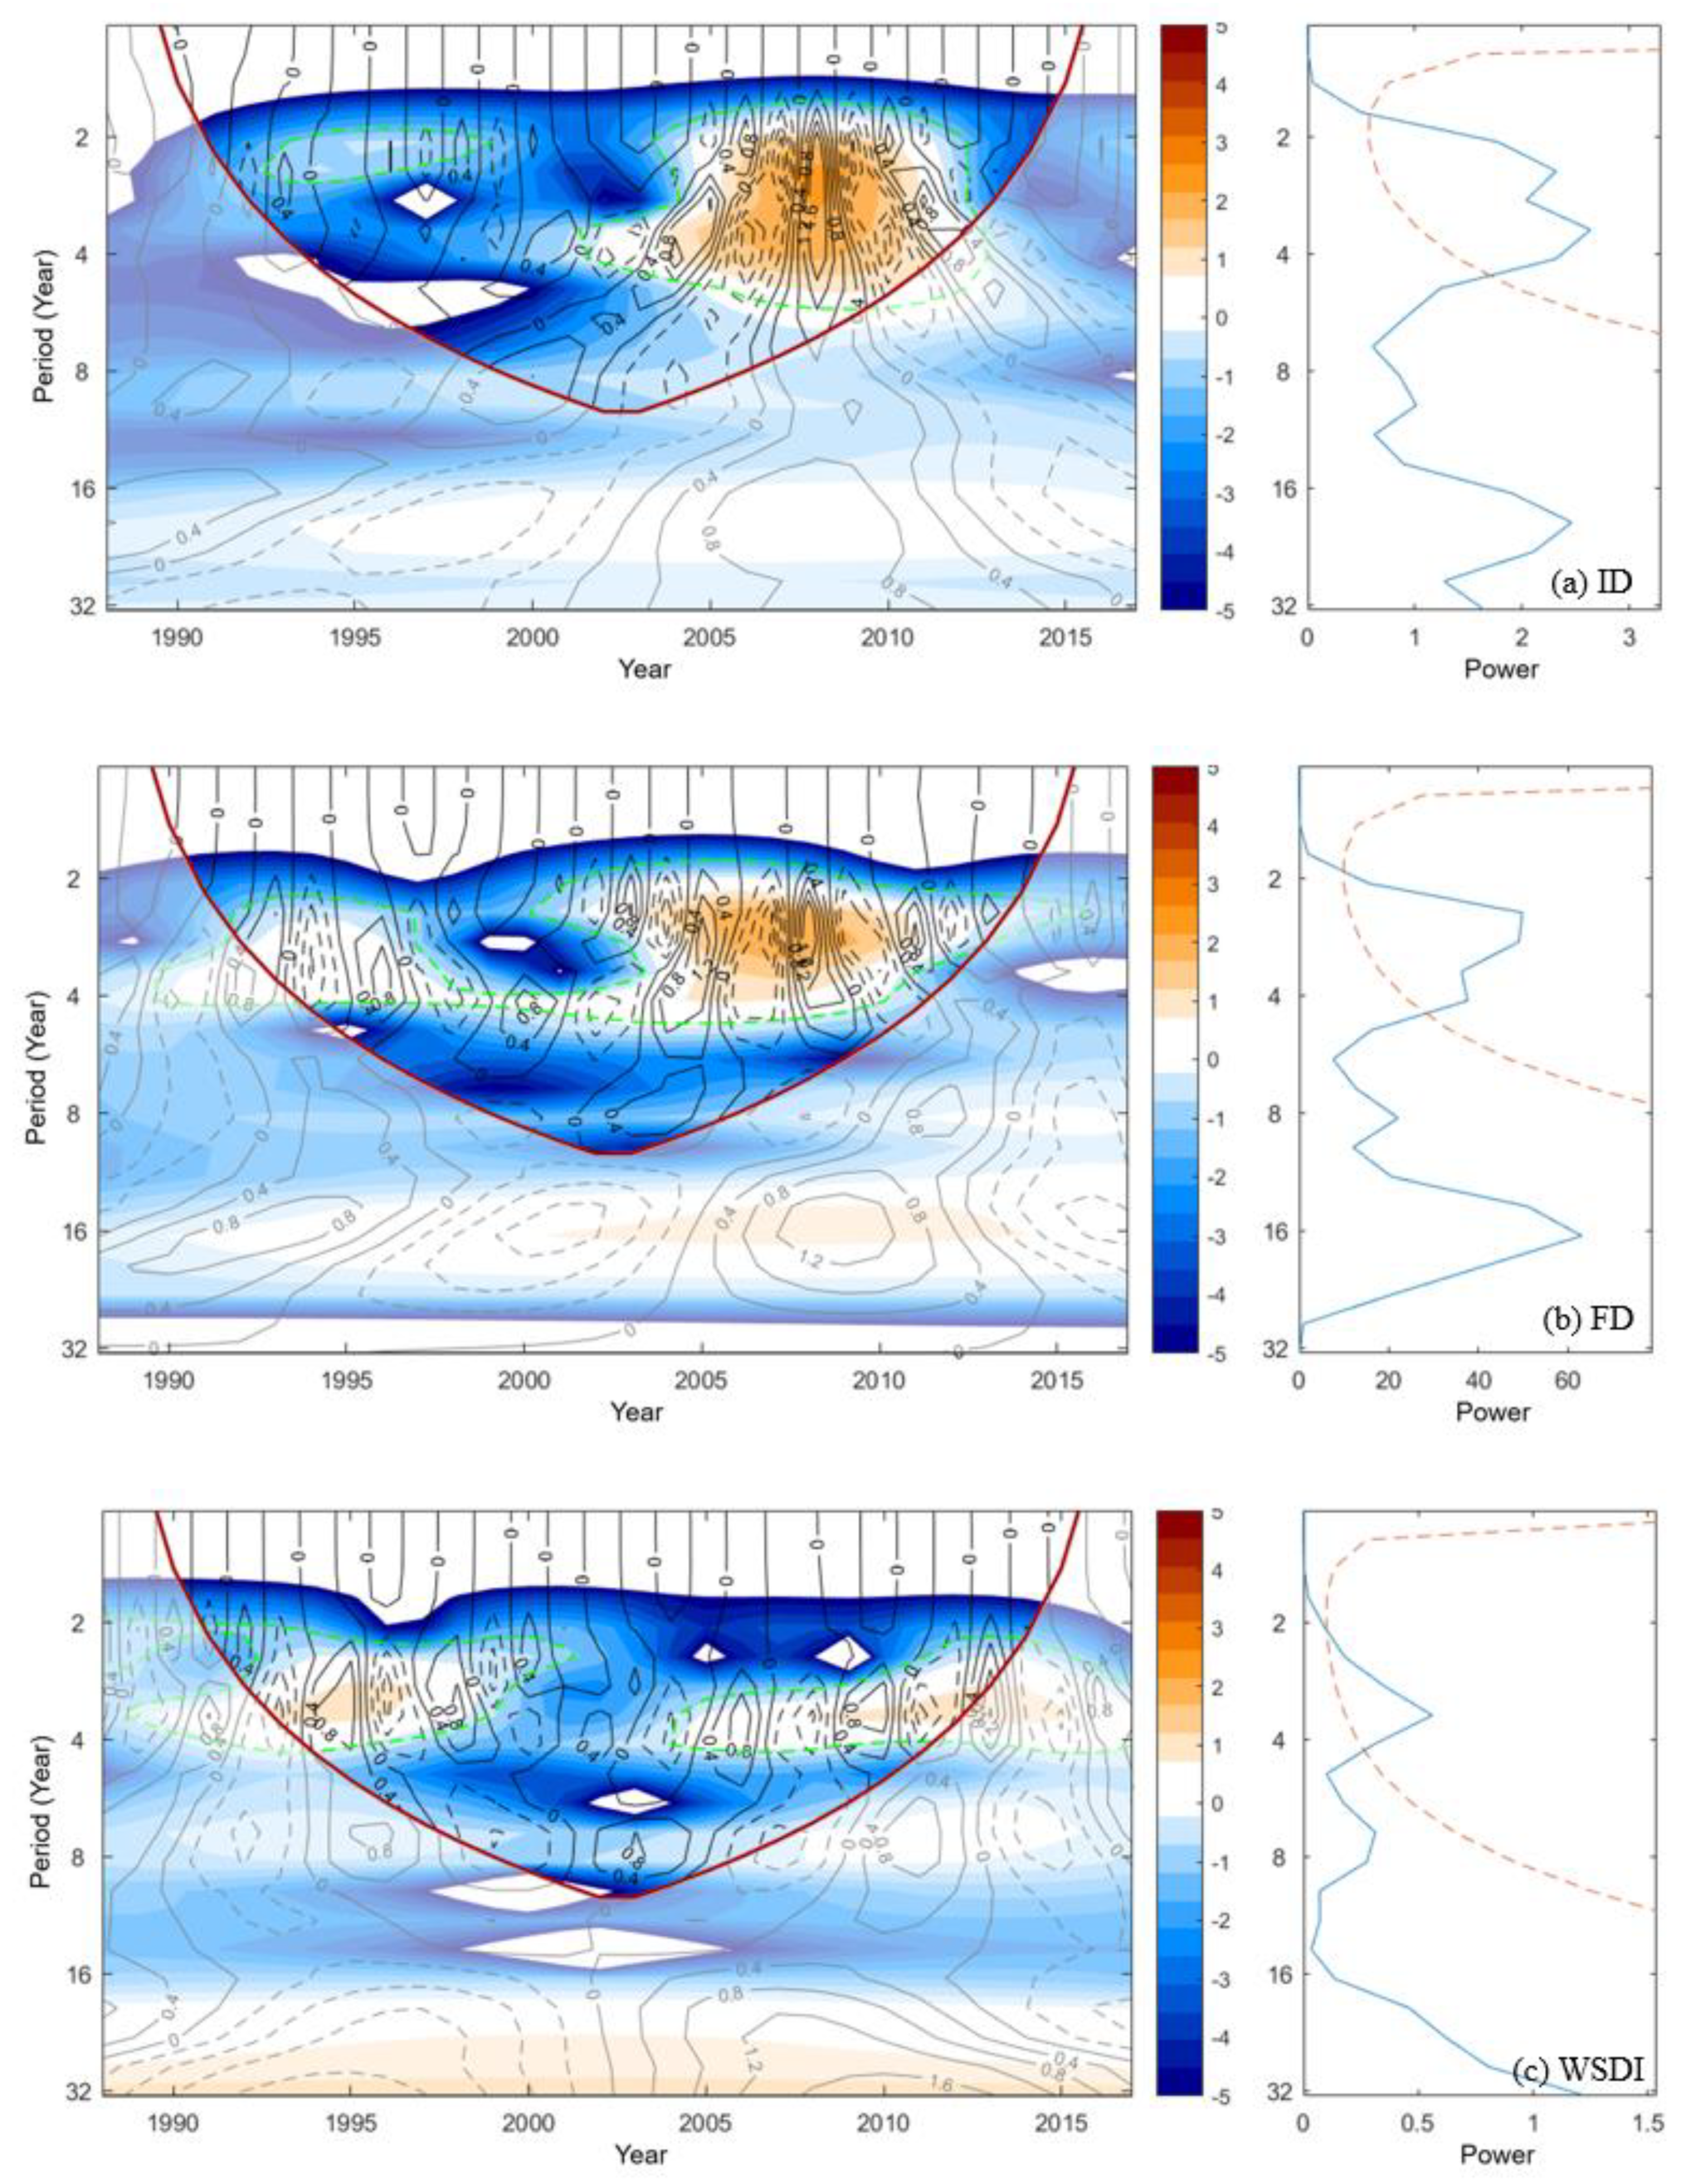
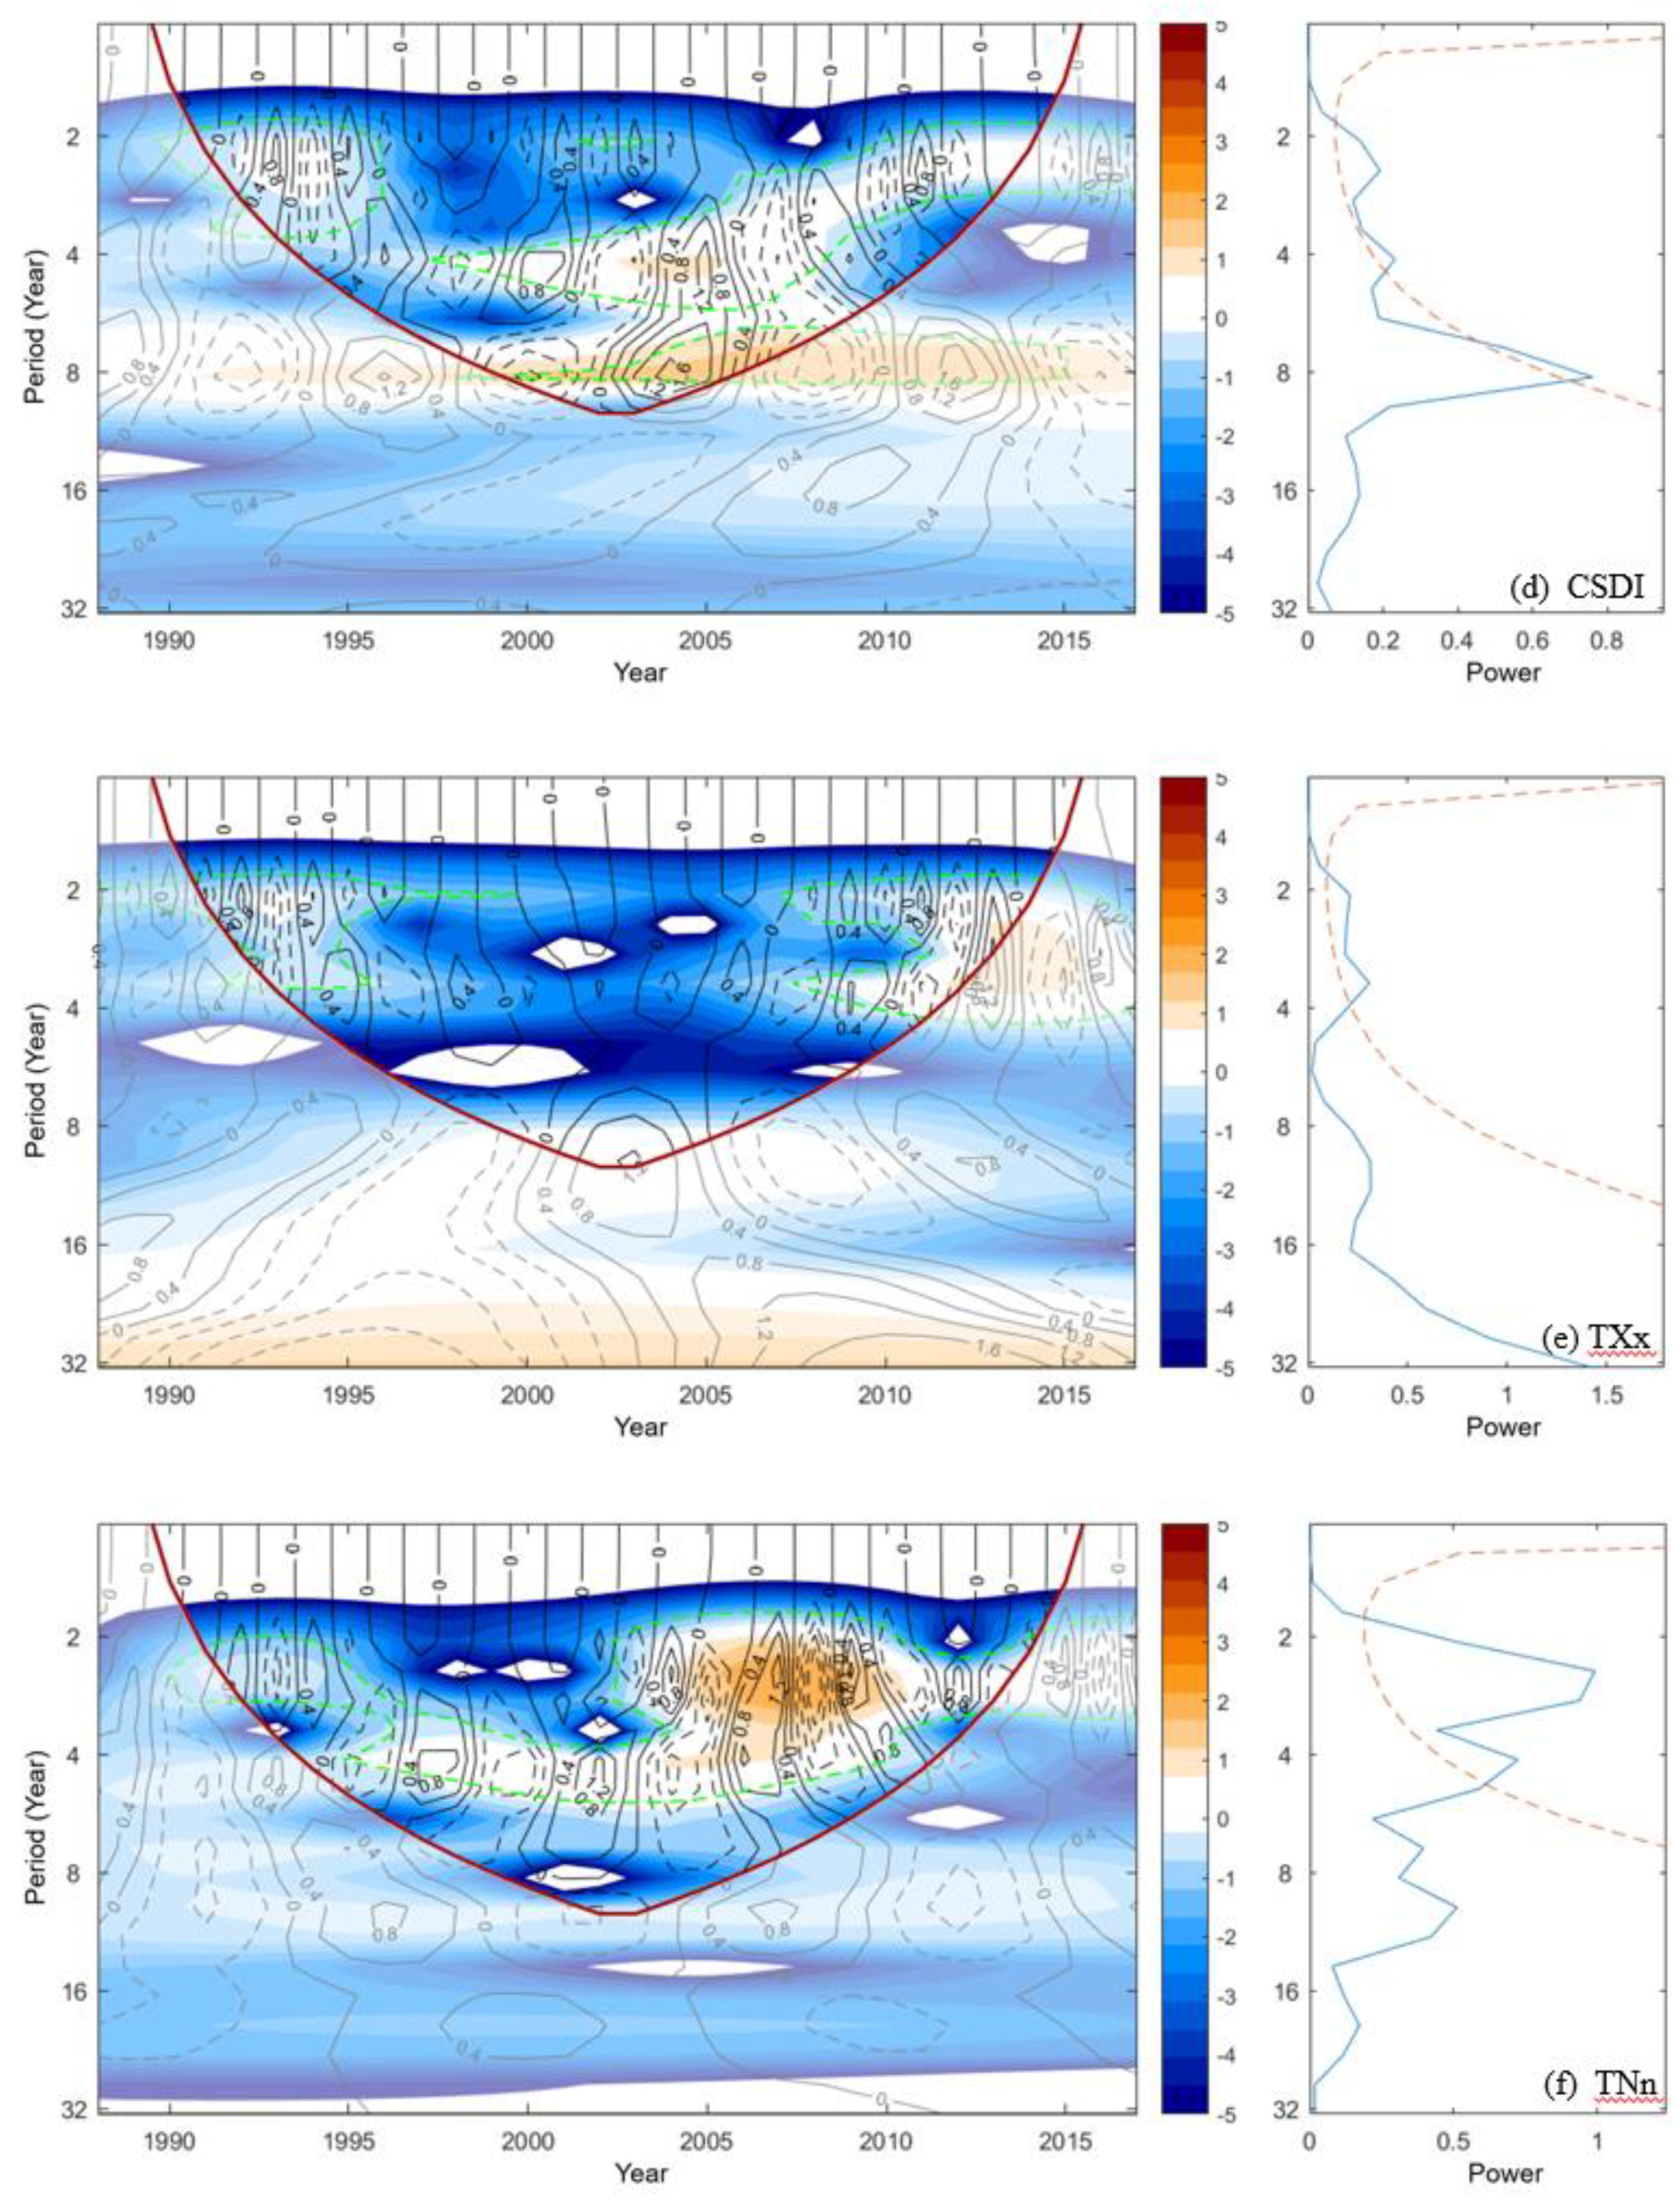
By standardizing the original time series of the extreme temperature index and analyzing the wavelet power spectrum (as shown in
Figure 4), the wavelet 95% confidence interval (the area inside the red solid line on the left of
Figure 4) and the period range that passed the 0.05 significance level test (the area surrounded by the green dotted line on the left of
Figure 4) were obtained. Considering the boundary effect of wavelet analysis, in the 30 years from 1988 to 2017, the confidence level of the wavelet analysis results for the 2–8 year cycle from 1990 to 2015 is greater than 95%.
This is done by plotting the full spectrum of the wavelet (the colored part in the left image of
Figure 4) to obtain the main change period of the extreme temperature index (the peaks shown in the blue solid line on the right image of
Figure 4) and the main period that passes the significance test (as shown in the right image of
Figure 4, the crest of the blue solid line on the right of the red dotted line). Through the analysis of the real part of the wavelet coefficient (as shown in the black isoline in the left figure of
Figure 4), the characteristics of the main change period with time and the stage of significant change were understood. The results of the wavelet analysis show that different extreme temperature indices show different oscillation periods, and there are some differences in the main periods of separate time periods.
In the cold series index of central China, the number of icing days (ID) shows a cycle, which is most notable from 2002 to 2013, and is dominated by a cycle of 2–3 years and sometimes four years (
Figure 4a). Frost days show a significant cycle of 3–4 years, which was most notable in 1990–1998 and 2002–2015. The period from 1990 to 1998 was dominated by 3–4 years and from 2002 to 2015 by a 2–4 years cycle (
Figure 4b). The number of cold duration days showed a significant period of 2–8 years, which was most notable in 1991–1996 and 2000–2015. Among them, the period of 1991–1996 was mainly approximately 2–4 years and 6–8 years, and the periods of 2000–2015 were mainly approximately 3–4 years and 6–8 years (
Figure 4d). The average daily minimum temperature in the winter has a cycle of 2–4 years, and the period is most notable in 1991–1995 and 1996–2013. Among them, the cycle of 1991–1995 is dominated by approximately two years, and 1996–2013 is approximately two and four years (
Figure 4f).
In central China, the warm duration days showed a cycle of 3–4 years, which was notable from 1990 to 2000, and from 2009 to 2015. The above two stages are mainly based on a cycle of approximately 3–4 years (
Figure 4c). The extremely high value of the average daily maximum temperature during the summer shows a cycle of 2–4 years, which is most notable in 1991–1996 and 2008–2015. The above two phases are in a cycle of approximately 2–4 years (
Figure 4e).
In conclusion, with the exception of CSDI, the types of extreme temperature indices all have significant cycles of 2–4 or 3–4 years, and the CSDI has a 6–8 years cycle, in addition to the 2–4 years cycle. The main periods of ID and FD reflecting the extreme value of the low temperature were both notable in 2002–2013. The WSDI and TXx (highest Tmax) represent extremely high temperatures, and their main cycle was significant from 2000 to 2015.
3.4. Spatial Distribution of the Extreme Precipitation Index
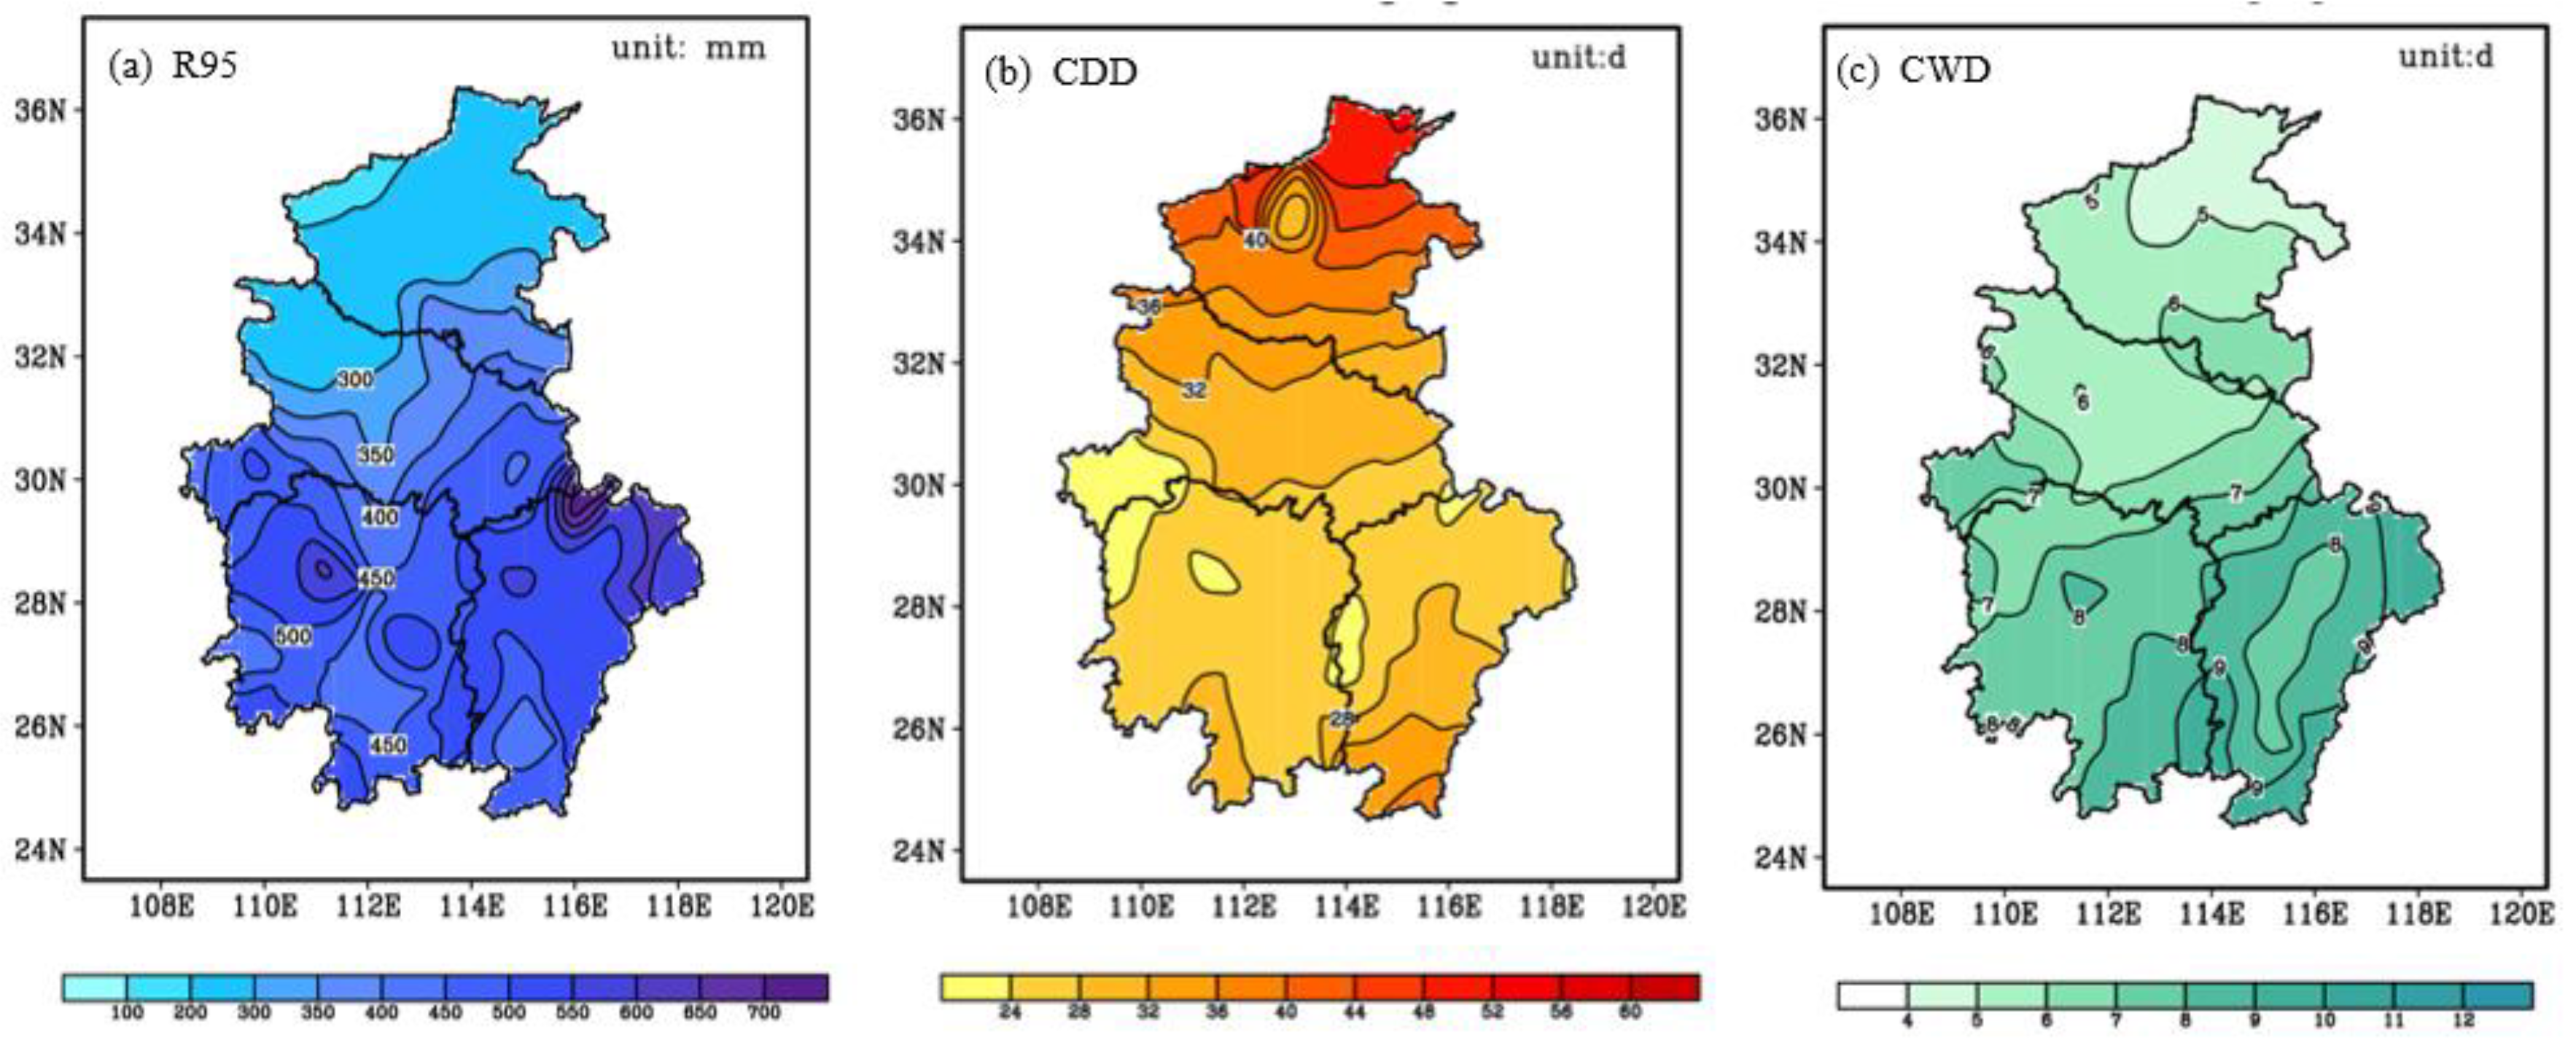
Figure 5 shows the distribution of extreme precipitation indices in central China. The extreme precipitation indices include extreme precipitation (R95), consecutive dry days, and consecutive wet days.
The extreme precipitation and the number of consecutive wet days generally showed the distribution of a gradual increase from north to south and from west to east, and the distribution of high-value areas to low-value areas in the region was clear, with an average value of 431.6 mm for the region. Jiangxi was the area with the highest extreme precipitation in central China, and the extreme values were concentrated in the north and east, generally exceeding 500 mm. At the same time, Jiangxi was also the region with the longest consecutive wet days in central China, generally higher than eight days. Jiangxi had a higher probability of extreme consecutive heavy precipitation events, and was more prone to flood disasters. Western Henan and north-western Hubei were the areas with the lowest extreme precipitation in central China, which was below 300 mm; Sanmenxia, in Henan Province, had the lowest extreme precipitation (161.6 mm) in central China. Meanwhile, Henan was also the region with the shortest consecutive wet days in central China.
3.5. Time Change Trend Analysis of the Extreme Precipitation Index
Additionally, using the Mann–Kendall method (
Figure 6), combined with trend analysis, the trend change test was performed on the three extreme precipitation indices in central China (see
Table 3 for test statistics).
The extreme precipitation (R95) in central China had a climate mutation (
Figure 6a). The mutation years were 1995 and 2004. The trend analysis of the three periods before and after the mutations showed that the R95 index had increasing, decreasing, and increasing trends in 1988–1995, 1996–2003, and 2004–2017, respectively. The maximum and minimum values in the study period both appeared in the 1996–2003 period, which were 1998 (615.6 mm) and 2001 (295.0 mm), respectively.
The consecutive dry days in central China showed a significant decreasing trend, with a linear trend value of –1.67 d/10a, but there was no clear climate mutation (
Figure 6b), indicating that the duration of the extreme drought events in central China was gradually shortened.
The overall trend of consecutive wet days in central China was not significant, but there was a sudden climate mutation (
Figure 6c) in 1998. The maximum value of the CWD index appeared in 1992 (10 days), and the minimum value appeared in 2013 (5.5 days) in the pre-mutation and post-mutation periods.
3.6. Periodic Analysis of the Extreme Precipitation Index
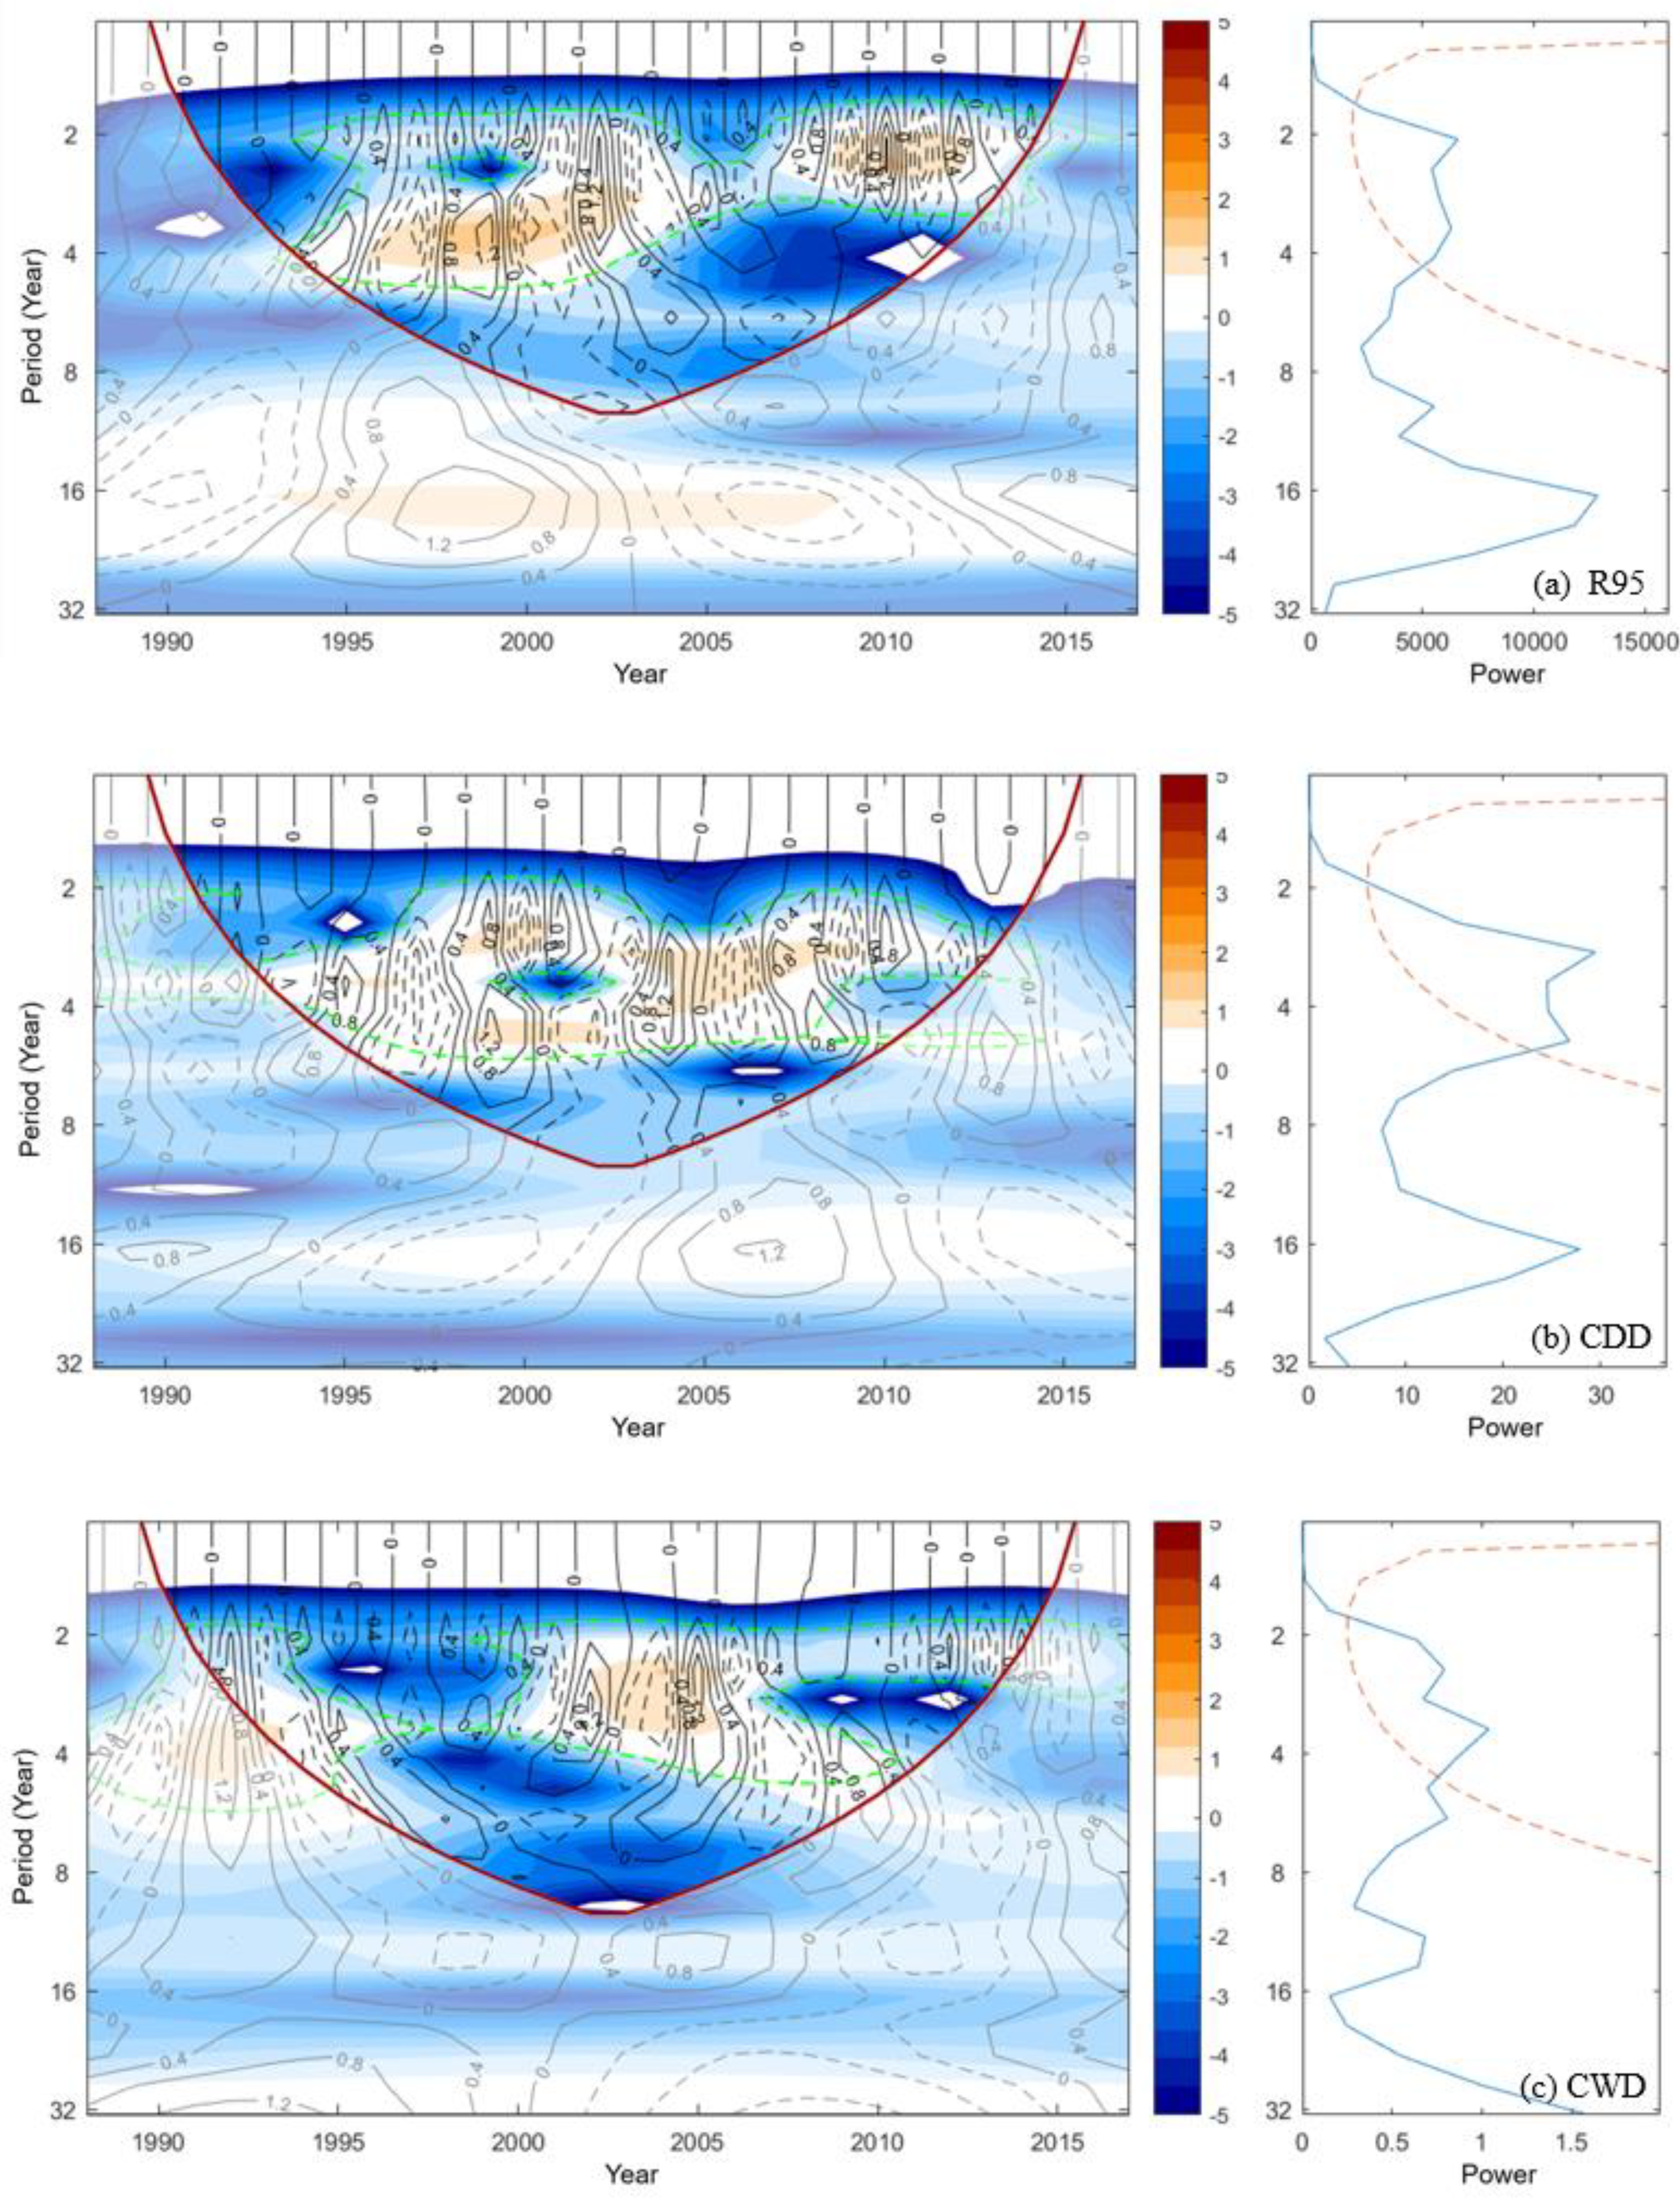
The wavelet analysis method was also used to analyze the periodicity of the extreme precipitation index (
Figure 7). The results showed that the extreme precipitation (R95) in central China showed a 2–4 years cycle, which was more notable in 1994–2005 and 2007–2015. Specifically, the 1994–2005 period was mainly 2–4 years, and the 2007–2015 period was mainly 2 years (
Figure 7a).
The number of consecutive dry days in central China showed a significant period of 2–6 years, which was more significant from 1993 to 2014, with periods of approximately two years and 4–6 years (
Figure 7b).
The number of consecutive wet days in central China had a significant period of 2–4 years, which was more significant in 1990–1996 and 2000–2015 (
Figure 7c).
In conclusion, the significant periods of extreme precipitation, consecutive dry days, and consecutive wet days in central China are not consistent. However, from the early 1990s to approximately 2015, these three indices had significant periods in most years, with a 2–4 years cycle dominating.
4. Discussion
This article analyzes the temporal and spatial variation characteristics of extreme climate indices in central China, which can help us to understand the changing regularity of severe weather in central China. Many studies have found that the evolution of extreme climate events is often closely related to the abnormal atmospheric circulation situation [
34,
35,
36]. For example, the maximum value of ID index and FD index appeared in 2008, which was mainly due to the obvious abnormality of the upper-level jet in East Asia at the beginning of 2008, compared with normal years. The stronger East Asian upper-level jet means that the intensity of cold air in the north is stronger, and the high-level divergence area on the anticyclone side of the jet inlet area provides the occurrence and maintenance of low-temperature events [
37,
38]. As a result, there has been long-lasting and strong low-temperature rain and snow freezing weather in many places, including central China, which made the ID index and FD index of central China in 2008 abnormally high.
The inter-annual variation of the WSDI index is large, and the average value after 2004 is larger than that in 1998–2004, which is considered to be closely related to global warming. The maximum value appeared in 2013. In addition, the WSDI index in 2010 was also abnormally high. The abnormal WSDI index in these two years was related to the abnormally strong western Pacific subtropical high. The subtropical high air prevails in the subtropical high control area, and the subtropical air heating and clear sky radiative heating lead to the appearance of high-temperature weather. While the western Pacific subtropical high had a larger range and stronger intensity in the abnormal years (such as 2010 and 2013), and stably extended westward to most of central China, the high temperature weather is persistent in this area [
39].
Affected by the super El Niño in 1997–1998, the subtropical high in the Northwest Pacific became more stable and stronger. The water vapor along the edge of the subtropical high was continuously transported to the middle and lower reaches of the Yangtze River, resulting in the emergence of severe floods, which appeared with an abnormally high R95 index in 1998 [
40]. The maximum value of the CDD index appeared in 1988. Some scholars believe that this is related to the large-scale drought caused by the strong La Niña event in 1988–1989 [
41]. It is mainly related to the weak subtropical high and weak water vapor transport caused by the La Niña event.
According to the cycle analysis results of six extreme temperature indices and three extreme precipitation indices, it can be extrapolated that the low-temperature events in central China will be more significant around 2022, 2025, and 2028; the drought events in central China around 2025 will be more significant, so disaster prevention and mitigation projects are suggested to be prepared in advance around these years.
5. Conclusions
Based on the above analysis, the spatial and temporal variation characteristics of extreme climate indices in central China can be obtained.
Spatially, the WSDI presented a distribution characteristic of more in the south and less in the north, where the highest value was mainly in Jiangxi. The extreme precipitation index generally showed the distribution characteristics increasing from north to south and from west to east. Jiangxi is the area with the largest extreme precipitation and the longest continuous precipitation days in central China. It has a greater probability of heavy rainfall events, and is more likely to be flooded. Combined with the analysis of extreme temperature indices and precipitation indices, it is found that the risk of extreme climate events in Jiangxi is greater.
The results of time evolution characteristics and the Mann–Kendall test show that the CSDI in the cold series index had a significant decreasing trend. The ID index and the FD index showed a significant decreasing trend after the mutation, indicating that the winter and spring in central China are gradually warmer. Both the warm series indices (WSDI and TXx) showed a significant increasing trend, and the mean values of the WSDI index and the TXx index increased significantly after the mutation, indicating that the duration of extreme high temperature events in central China became longer, and the intensity of extreme high temperature increased.
The results of the wavelet analysis show that the extreme climate index had significant cyclical change characteristics, mainly 2–4 years of periodic oscillation, and different indices have certain differences during the main period in separate time periods. Most of the extreme climate indices have significant periodic changes after 2000.
This study can provide a theoretical basis for the study of the occurrence regularity of extreme disastrous weather and climate events in central China. The next step is to carry out research on the impacts of extreme climate events on urban lifelines such as agriculture, transportation, water supply, power supply, and other different industries. In addition, more disaster mechanism studies should be carried out based on different disaster types. This will provide more scientific bases for the assessment of climate change and its impacts on stable grain production, energy supply, and urban safety management.


 ,
, 
