Article

Peanut Drought Risk Zoning in Shandong Province, China

1
Heilongjiang Province Key Laboratory of Geographical Environment Monitoring and Spatial Information Service in Cold Regions, Harbin Normal University, Harbin 150025, China
2
Shandong Provincial Meteorological Bureau, Jinan 250000, China
*
Authors to whom correspondence should be addressed.
Sustainability 2022, 14(6), 3322; https://doi.org/10.3390/su14063322
Submission received: 20 December 2021 / Revised: 5 March 2022 / Accepted: 7 March 2022 / Published: 11 March 2022
(This article belongs to the Special Issue Sustainability with Changing Climate and Extremes)

Abstract

:
Peanut growth in Shandong Province, a major peanut-producing area in China, is greatly affected by drought. The present study uses hierarchical analysis, weighted comprehensive evaluation, and ArcGIS spatial analysis to conduct spatial zoning of peanut drought risk in Shandong Province based on daily precipitation data for the province acquired from 1991 to 2020, the per capita GDP, and the peanut planting area of Shandong Province, so as to quantify the disaster risk of peanut drought and formulate disaster prevention and resilience planning accordingly. The results show the high-drought-risk zone was mainly distributed in the northwestern part of Shandong Province and on the Jiaodong Peninsula, covering 32.4% of the province. Drought risk was concentrated on the Jiaodong Peninsula, covering 20.7% of the province. The high-vulnerability zone was mainly distributed in the cities of Yantai, Weihai, Linyi, and Rizhao, accounting for 26.8% of the total area. The low-disaster-prevention and low-mitigation-capacity zone was mainly distributed in the western part of Shandong Province, covering 38.7% of the province. Medium- and high-risk areas for drought affecting peanuts were widely distributed, while the overall comprehensive risk index was high, covering 76.2% of the province. Spatial analysis to conduct risk zoning and assessment of peanut drought in Shandong Province, so as to provide a basis for peanut drought disaster prevention and safe peanut production in Shandong Province.

1. Introduction

According to the World Meteorological Organization, meteorological disasters cause about 85% of the total losses caused by various types of natural disasters, and drought in turn accounts for about 50% of meteorological disasters losses [1]. The peanut is an important food, source of oil, and cash crop in China [2,3]. Drought can seriously affect the plants during flowering and the quality of peanut kernels during the podding period [4,5,6], leading to a decline in peanut quality and yield [7,8]. Therefore, drought is an important factor limiting peanut growth and yield. Shandong Province ranks among the top peanut-growing areas in China, with the peanut cultivation area accounting for about 15–16% of the total domestic peanut growing area; total production in Shandong accounts for about 18–20% of the total domestic production [9,10]. The critical period of water demand for peanut growth is concentrated from June to August, which coincides with the occurrence of summer drought in Shandong Province; therefore, drought disasters are one of the major types of disasters affecting the growth and yield of peanuts in Shandong Province [11].
Natural disaster risk refers to the possibility of loss from the impact of a certain disaster in a certain area after considering the natural and social attributes together [12]. Therefore, the purpose of natural disaster risk research is to provide a scientific basis for regional disaster prevention and mitigation, and strengthening the research of comprehensive natural disaster zoning has been listed as one of the actions of disaster prevention and mitigation in China’s Agenda 21 [13]. Significant work has been carried out in various countries for drought risk zoning research. Araya, A. et al. [14] developed a suitable drought assessment technique by analyzing long-term climate data from four sites in northern Ethiopia; Moumita Palchaudhuri et al. [15] used a combination of AHP and GIS to conduct a drought zoning study in Puruliya, West Bengal, India; Nazarifar Mohammadhadi et al. [16] assessed and zoned drought risk in the Karkheh basin for different years and return periods; Zhongyi Sun et al. [17] proposed a methodology for integrated risk analysis, assessment, combination, and regionalization of droughts and floods in Anhui Province; and Luo D et al. [18] assessed the drought hazard by constructing a gray predictive incidence model (GPIM). Additionally, for peanut drought, risk zoning has also attracted the attention of scholars, but up to now the relevant research literature has been relatively scarce. Wei S. Cheng et al. [19] conducted a risk evaluation of peanut drought in the Yellow and Huaihai Sea region and concluded that high-risk areas for peanut drought disaster were scattered and mainly concentrated in the northwestern part of the Yellow River Basin. Additionally, more scholars have studied the impacts of drought on peanut growth and yield. For example, Celikkol Akcay U. et al. [20] concluded that the growth retardation of peanuts under drought stress conditions was mainly due to drought-induced oxidative damage and antioxidant responses; Jiang, C.J. et al. [21] proposed that drought inhibited different varieties of peanut and the drought resistance of different peanut varieties varied; and Zhang, K. et al. [22] selected 16 peanut varieties for drought resistance testing and concluded that geological drought can start and end quickly, while meteorological drought takes longer to develop and recover. These research results provide important reference values for conducting peanut drought risk assessment and zoning studies.
This paper selected Shandong Province, China, as the study area, and conducted a spatial zoning study on peanut drought risk in Shandong Province based on natural disaster risk theory, considering four aspects, hazard, exposure of disaster-affected bodies, vulnerability of disaster-affected bodies, and disaster prevention and mitigation capacity, by establishing a peanut drought risk index model, combined with Arc-GIS spatial analysis, a weighted comprehensive evaluation method, and hierarchical analysis method. Compared with the existing studies, in addition to the study of peanut drought risk, the exposure of disaster-affected bodies, vulnerability of disaster-affected bodies, and disaster prevention and mitigation capacity were also evaluated and zoned, providing a reference for carrying out peanut drought risk assessment and zoning studies. Research results provide a basis for the prevention of peanut drought and the safe production of peanuts in Shandong Province and provide a quantitative basis for the scientific formulation of disaster prevention and mitigation policies and planning by relevant departments.

2. Materials and Methodology
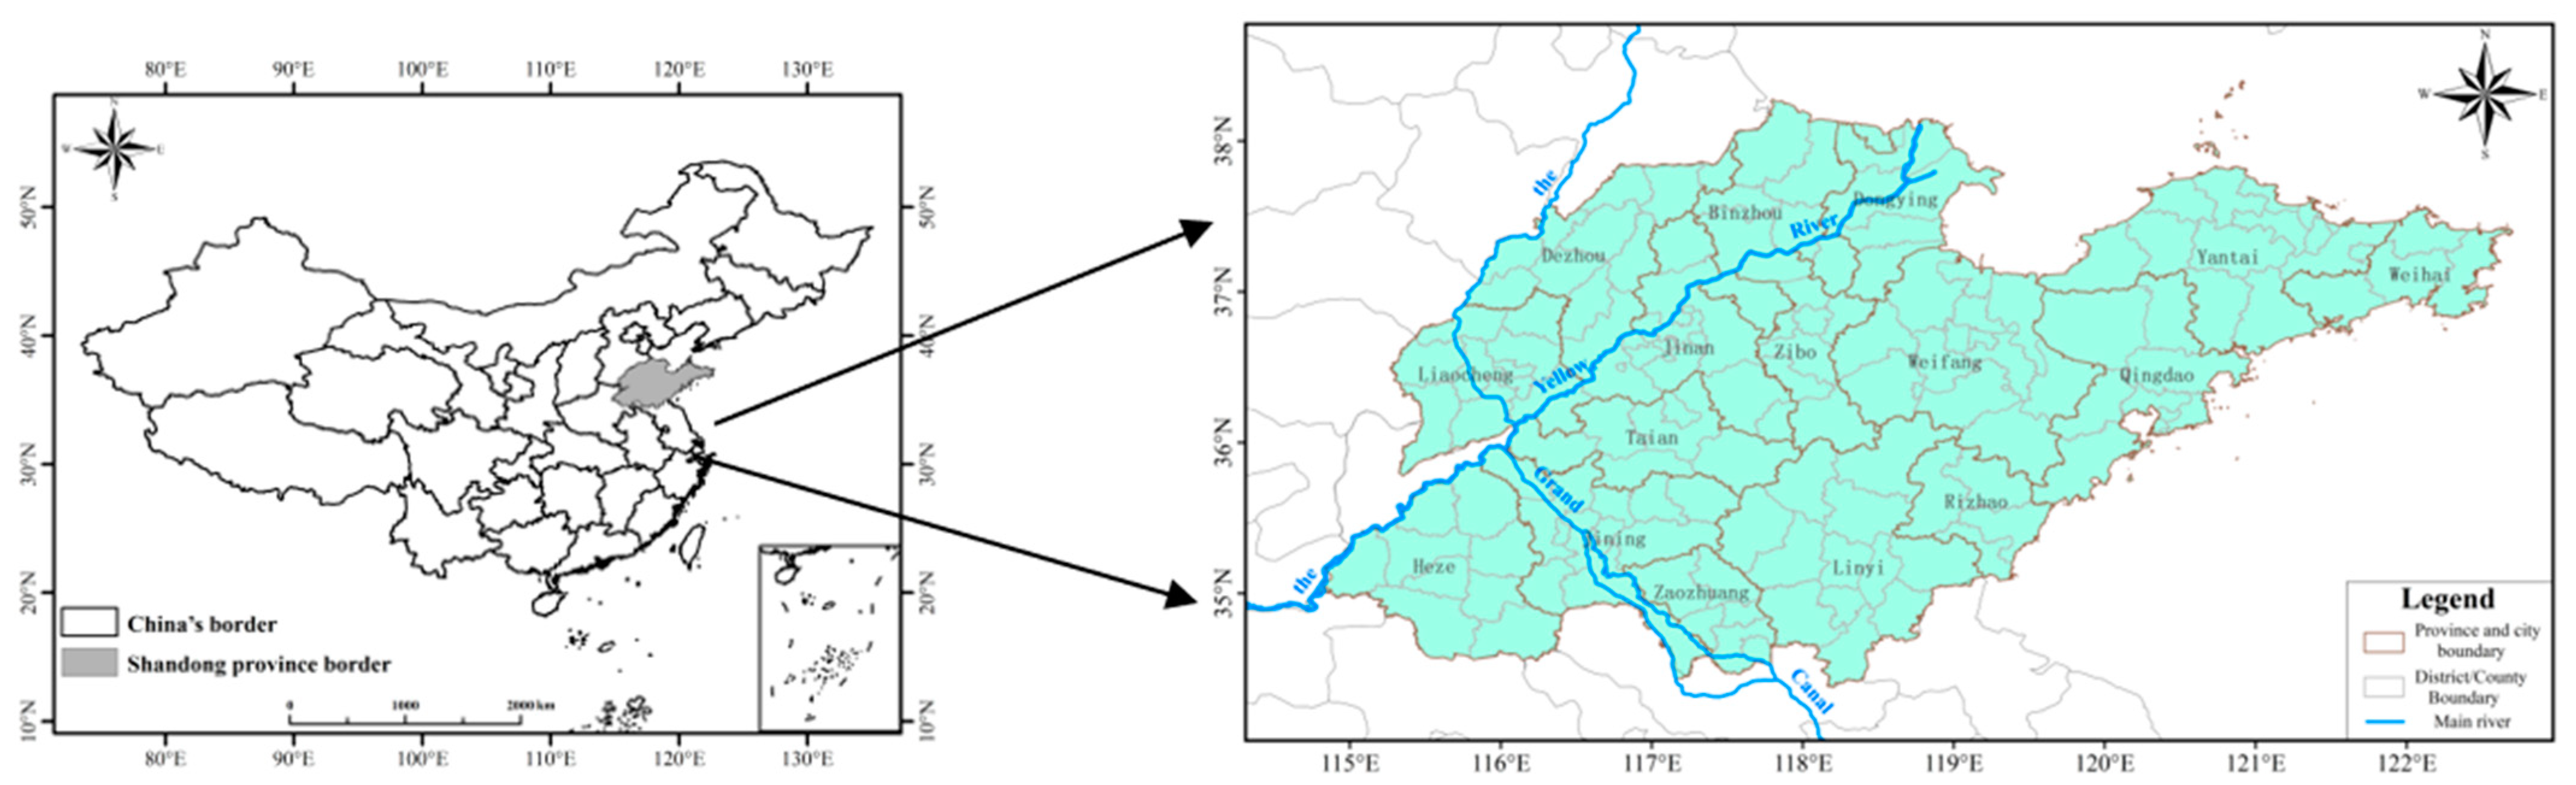
2.1. Study Area

Shandong Province is located on the east coast of China and the lower reaches of the Yellow River (114°48′ E–122°42′ E and 34°23′ N–38°17′ N), as shown in Figure 1. Total land area is 157,900 km2. The climate type is warm temperate monsoon. Precipitation is concentrated, and rain and heat occur in the same season. Spring and autumn are short, while winter and summer are long. The annual average temperature range is 11 °C–14 °C, and the annual average precipitation range is 550–950 mm. The rainfall season is unevenly distributed, with 60–70% of annual precipitation in summer. Landform types include plains, terraces, hills, and mountains. There is a dense river network in the region, including the Yellow River, Huaihe River, Haihe River, and smaller rivers in the central and southern mountainous area.

2.2. Data Sets

This paper covers a total of 122 meteorological stations in Shandong Province from 1991 to 2019, and the precipitation data for each month were obtained based on the daily precipitation data of each station. The daily precipitation data were obtained from Shandong Meteorological Center. According to the ground meteorological observation specification of China Meteorological Administration, the daily precipitation data were reviewed by the stations, their municipal meteorological bureaus, and the data review department of the provincial meteorological bureau before being entered into the database of Shandong Meteorological Center, and the anomalous values were eliminated to ensure the uniformity and accuracy of the data. Total GDP, total population, peanut planting area, percentage of peanut cultivation area, population density, per capita GDP, and water facilities are from the 2018–2020 Statistical Yearbook of Shandong Province.

2.3. Methods

This paper constructs a theoretical model for peanut drought risk assessment based on the basic theory of disaster risk assessment. The trend analysis method is used to analyze the temporal characteristics of the disaster-causing factors; the hierarchical analysis method is used to determine the weights of the factors constituting the risk impact; and the comprehensive weighted evaluation method is used to constitute the risk index model.

2.3.1. Basic Theory of Disaster Risk Assessment

Based on the theory of natural hazard risk formation [12], meteorological hazard risk is formed by the combination of four components: hazard (causative factor), exposure (carrier), vulnerability (carrier), and prevention and mitigation capacity. Each factor is in turn composed of a series of subfactors. The expressions are:
Disaster risk index = f (hazard, exposure, vulnerability, disaster prevention and mitigation capacity)
Hazardous factors: Hazardous factors include meteorological factors and environmental sensitivity. All meteorological factors that may lead to disasters can be called meteorological factor hazards; the sensitivity of the pregnant environment refers to the degree of strengthening or weakening of meteorological factors in the natural surface environment.
Exposure of disaster-bearing body: Disaster-bearing body is the object of disaster-causing factors and is the entity that bears the disaster. Exposure of the hazard-bearing body is the result of the interaction between the hazard-causing factor and the hazard-bearing body, and the exposure of the hazard-bearing individual to the hazard-causing factor.
Vulnerability of the disaster-bearing body: A disaster can be formed only when it acts on the corresponding object, i.e., human beings and their socioeconomic activities. Specifically, it refers to the degree of hazard or loss caused by the potential risk factors for all objects that may be threatened by the disaster-causing factors that exist in a given hazard area, and its combination reflects the degree of loss from meteorological disasters.
Prevention and mitigation capacity: It refers to various management measures and countermeasures used to prevent and mitigate meteorological hazards, including management capacity, mitigation input, and resource preparation. The more proper the management measures and the stronger the management capacity, the less potential losses that may be suffered and the less risk of meteorological disasters.
Based on the above theory, a hierarchical analysis model for peanut drought disaster risk assessment in Shandong Province was built (Figure 2). Figure 2 shows the model of peanut drought risk zoning. The risk was divided into meteorological factor risk and pregnancy disaster environmental sensitivity. The risk of meteorological factor selected was the precipitation anomaly percentage. The environmental sensitivity of pregnant disaster referred to the environmental factors that can enhance or weaken the risk of peanut drought. In this paper, factors such as elevation and slope were selected. Exposure was selected as the peanut planting area; vulnerability referred to the percentage of the peanut cultivation area; and the factors for disaster prevention and mitigation capabilities selected were the aspects of per capita GDP, level of education, and so on. However, when selecting indicators, they will be selected or replaced according to the factors in the Statistical Yearbook. Please refer to Section 3.1, Section 3.2, Section 3.3 and Section 3.4 for the selection basis of specific indicators.

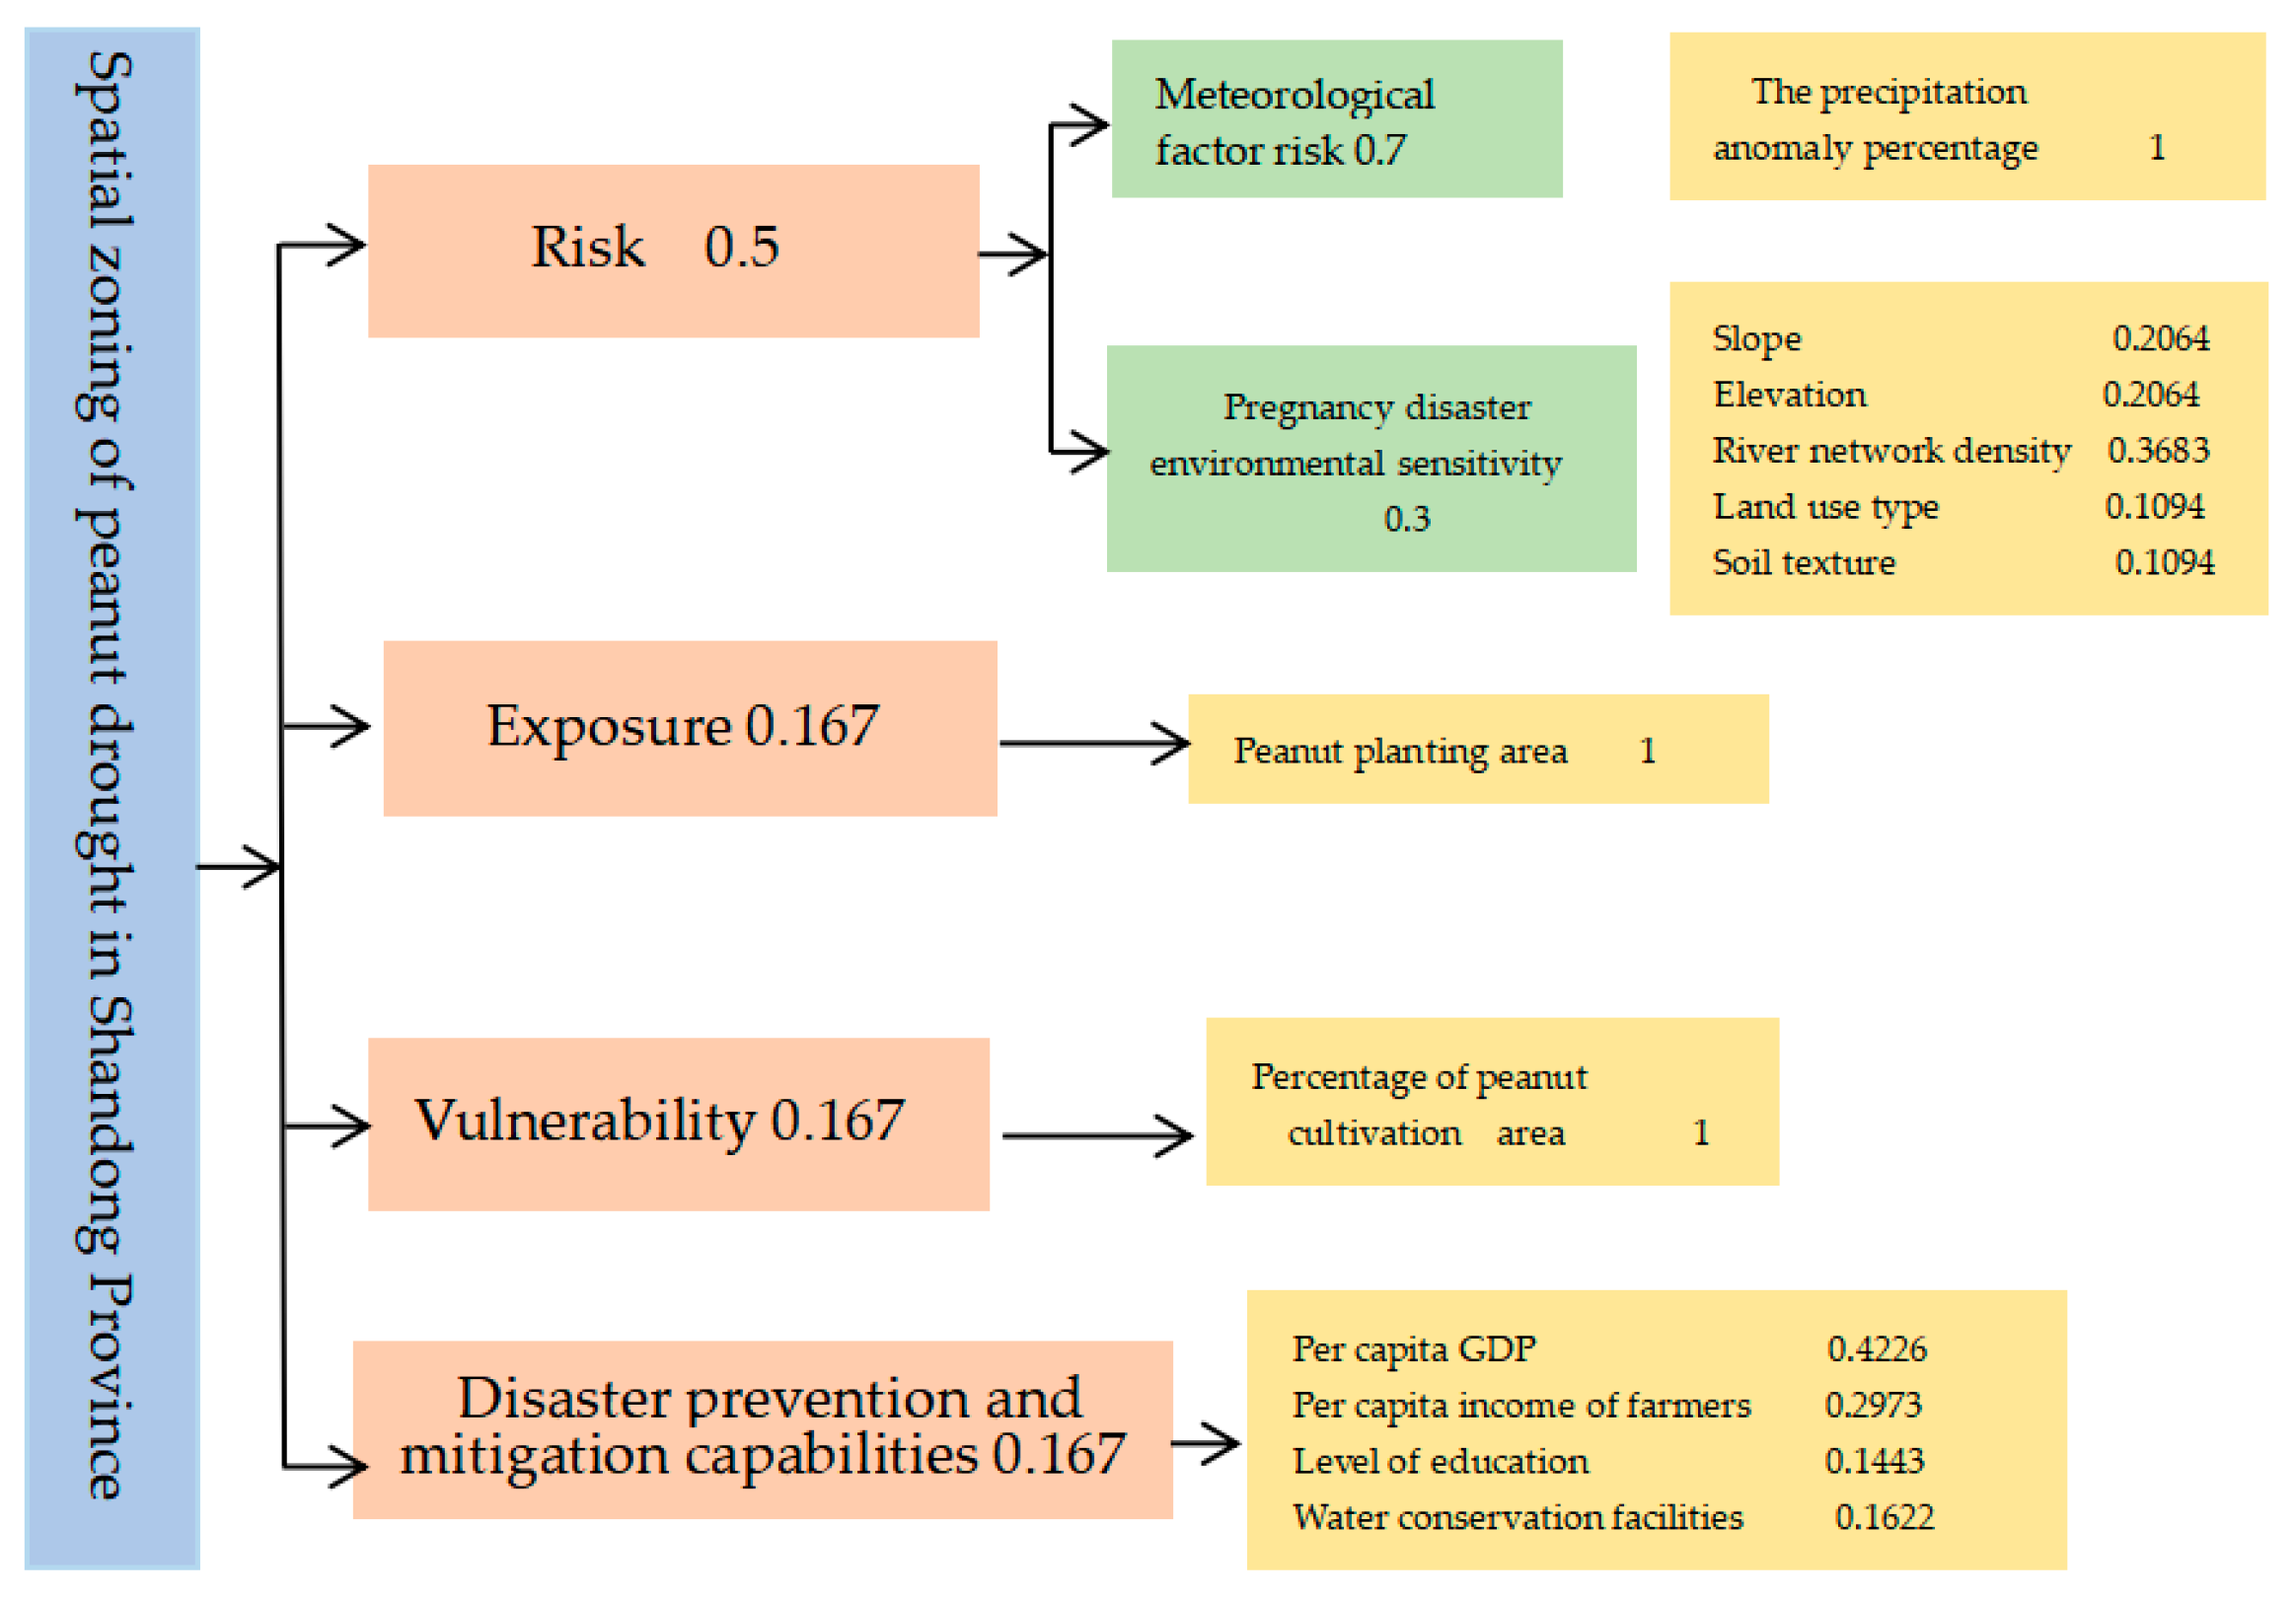
2.3.2. Weighted Comprehensive Evaluation Method

The weighted comprehensive evaluation method is a method that solves the “bottom-up” indexes in the risk hierarchy analysis and evaluation model, which takes into account the degree of influence of each factor on the overall object and integrates the strengths and weaknesses of each specific index and uses a numerical index to focus on the strengths and weaknesses of the entire evaluation object. This method is especially suitable for comprehensive analysis and evaluation of technologies, strategies, or programs and is one of the most commonly used calculation methods. Its expression is:
Y i = i = 1 m W i j Y i j   i = 1 , 2 , 3 , 4 ;   j = 1 , 2 , , m  
In the formula, Yi represents the disaster risk index, and i, respectively represents the risk, susceptibility, vulnerability, and disaster prevention and mitigation capabilities; Yij is the factor that affects the risk, susceptibility, vulnerability, and disaster prevention and mitigation capabilities, and Wij is the weight value of risk, susceptibility, vulnerability, and disaster prevention and mitigation capabilities (0 ≤ Wij ≤ 1) , while j represents the number of factors affecting i.
For the comprehensive risk index of natural disasters, the expressions are:
Y = i = 1 n W i Y i   i = 1 , 2 , 3 , 4  
In the formula, Y represents the comprehensive disaster risk index; Yi is the risk index, susceptibility index, vulnerability index, and disaster prevention and mitigation capability index, and Wi is the weight value. The stronger the disaster prevention and mitigation capacity, the smaller the comprehensive risk index, so the “negative sign” is used.
Among them, Wij and Wi are determined by the analytic hierarchy process; see research method Section 2.3.3 for details. Each factor in the formula needs to be standardized because of different dimensions; see research method Section 2.3.4 for details.

2.3.3. Analytic Hierarchy Process

Analytic hierarchy process (AHP) is a simple method for making decisions on more complex and vague problems, especially for those problems that are difficult to fully quantitatively analyze [23]. This paper used the operation principle of the analytic hierarchy process and used the 1–9 scale method given by Saaty to construct the judgment matrix for the pairwise relationship of the influence factors. The pairwise comparison of all influence factors determines the weight of each influence factor, which prevents the result error caused by the subjectivity of the expert. The qualitative comparison scale values between the two influencing factors are shown in Table 1 below.
The maximum eigenvector value of the judgment matrix and its corresponding eigenvector need to be solved by the sum-product method, and the consistency of the matrix (the following formula) should be solved; then, this should be solved by the sum-product method.
C I = λ m a x n n 1 = i = 1 n λ i n 1
C R = C I R I < 0.1
In the formula, CI is the consistency index of the judgment matrix; λ max is the largest characteristic root of the matrix; n is the order of the discrimination matrix; CR is the random consistency index of the judgment matrix; and RI is the average random consistency index of the discrimination matrix. The values of RI are shown in Table 2.
We summarize the calculation process in Table 3, as follows.
This paper adopted the analytic hierarchy process (AHP), taking the sensitivity of the pregnancy disaster environmental sensitivity as an example, and constructed the judgment matrix of each index; the calculation results are shown in Table 3. Since CR < 0.1, the matrix passed the consistency test.
Similarly, the weights of each factor of risk, exposure, vulnerability, disaster prevention and mitigation capacity, and comprehensive risk were obtained as shown in Figure 2.

2.3.4. Standardization

Because the dimensions of the selected factors are different, the values of each factor vary greatly. It is necessary to normalize each factor so that the values of each factor are between 0 and 1. When evaluating the risk of disaster-causing factors, the exposure of the disaster-affected body, the vulnerability of the disaster-affected body, and the disaster prevention and mitigation capacity, the correlations between the selected factors and each evaluation index are different; some are positively correlated, and some are negatively correlated. Therefore, when normalizing the factors with a positive correlation, if the cause subvalue is large, the normalized value is also large, so the maximum value should be selected for standardization. On the contrary, if the factors with a negative correlation are standardized, the minimum standardization is selected. For example, the larger the peanut planting area, the greater the exposure, so the great value standardization is chosen for the peanut planting area, and Equation (6) is selected; for example, the greater the river network density, the smaller the sensitivity of the pregnant environment, so the very small value standardization is performed for the river network density, and Equation (7) is selected.
Maximum standardization:
X max = | X ij X min | X max X min  
Minimum standardization:
X min = | X max X ij | X max X min
where Xij is the index number of the j-th factor of the x factor; Xmax and Xmin are the dimensionality of Xij; and Xmax and Xmin are the minimum and maximum values in the index sequence.

2.3.5. Arc-GIS Spatial Analysis

In this paper, the meteorological elements and geographic environment elements were interpolated using the Kriging method to obtain spatial distribution maps with a spatial resolution of 100 m × 100 m. The socioeconomic factors were resampled by administrative units to obtain spatial distribution maps with a spatial resolution of 100 m × 100 m. Then, according to the weights of each element, the raster calculation method was used to superimpose each element spatially to obtain the spatial distribution map of risk index, exposure index, vulnerability index, and disaster prevention and mitigation capability index. Finally, each index of risk was spatially superimposed by weights to obtain the spatial distribution map of comprehensive risk index. The natural grading discontinuity method was used to grade each index, and the zoning map of each index of risk zoning and the comprehensive risk zoning map were obtained.

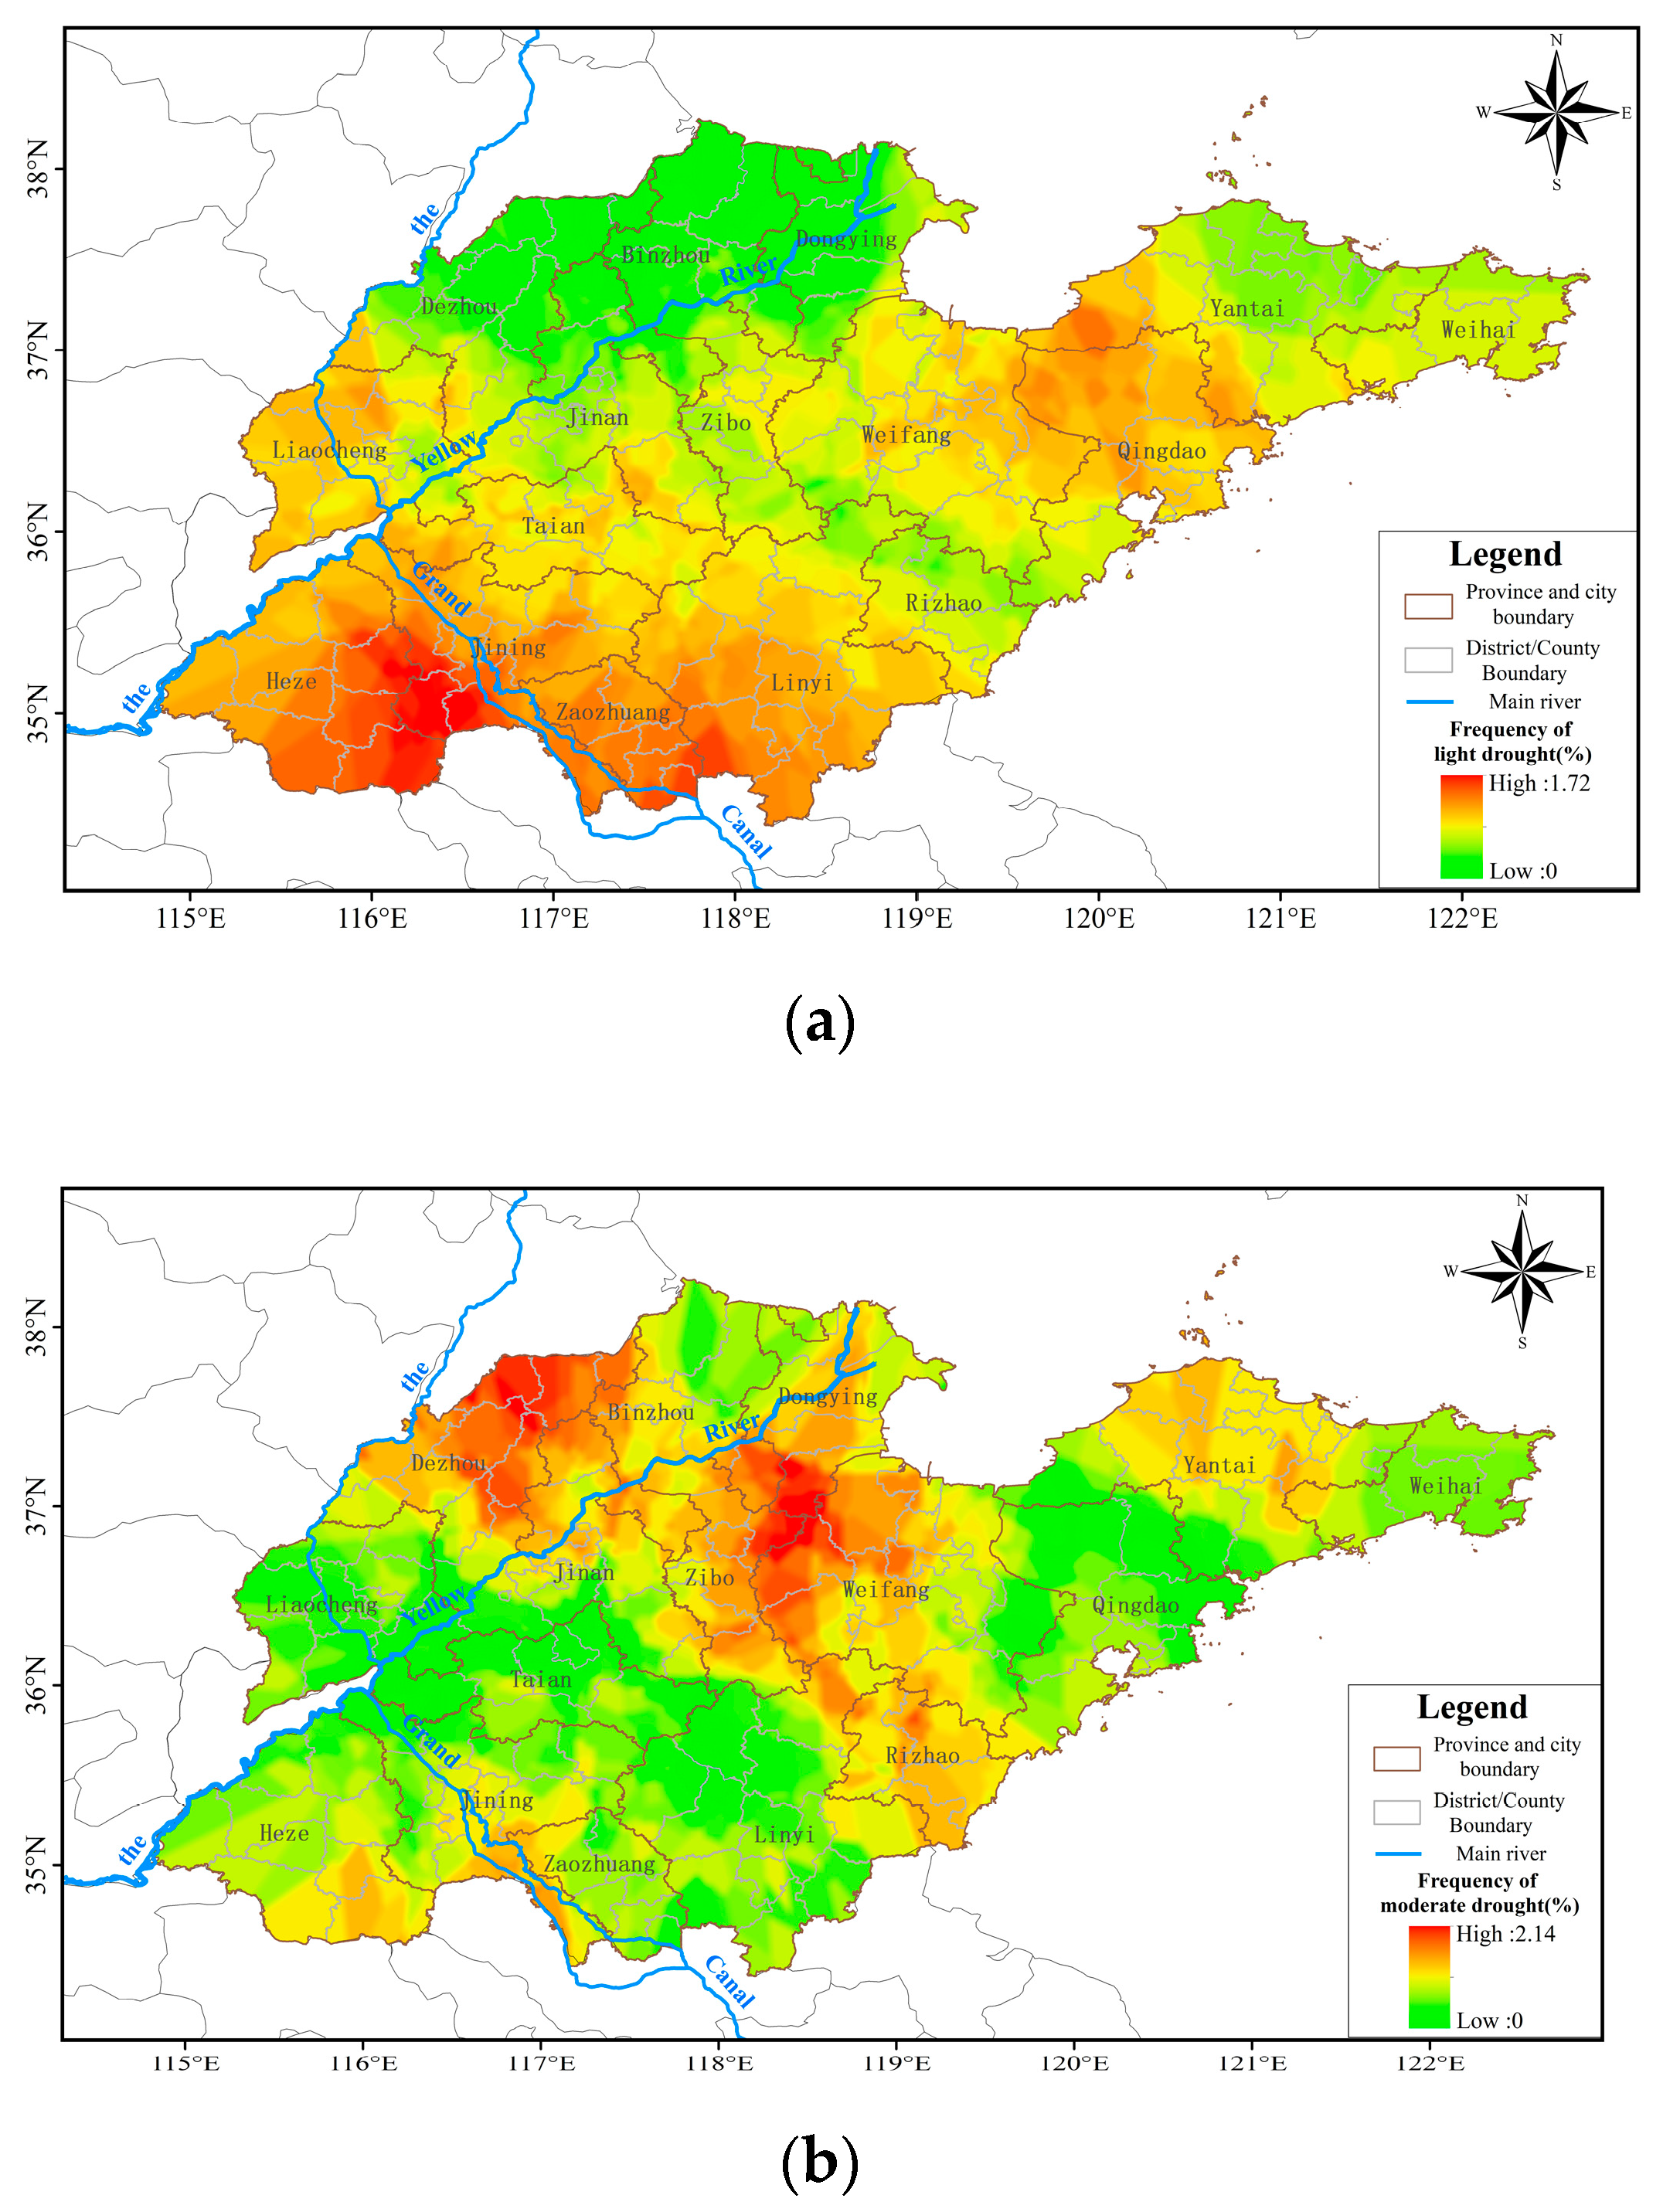
2.3.6. Drought Classification

A precipitation anomaly percentage indicator can visually reflect the degree of drought caused by precipitation anomalies; therefore, the precipitation anomaly percentage of peanuts for the entire growing period was selected as the risk indicator of a peanut drought meteorological factor. The precipitation anomaly percentage for a certain period was calculated according to Equation (8):
P a = P P ¯ P ¯ × 100 %
where Pa is the precipitation anomaly percentage (%); P is the precipitation for a certain time period (mm); and P ¯ is the multiyear average precipitation for the corresponding time period (mm), and the average value of 30 years was generally calculated.
In this paper, all grades of drought were calculated for each station according to (QX/T 82-2019) (Table 4) [24], and their frequencies were calculated and integrated in the formula of the danger index of meteorological factors of drought, which was calculated as:
R = 0.0960 D l + 0.1611 D m + 0.2771 D s + 0.4658 D e
where R is the meteorological risk index of peanut drought; Dl is the average number of days in 30 years of light drought (d); Dm is the average number of days in 30 years of moderate drought (d); Ds is the average number of days in 30 years of severe drought (d); and De is the average number of days in 30 years of exceptional drought (d).

3. Results

3.1. Spatial Distribution of Peanut Drought Risk

Peanut drought risk includes meteorological factor risk and disaster formative environmental sensitivity, which were assigned weights of 0.7 and 0.3, respectively, based on the AHP method (Figure 2).

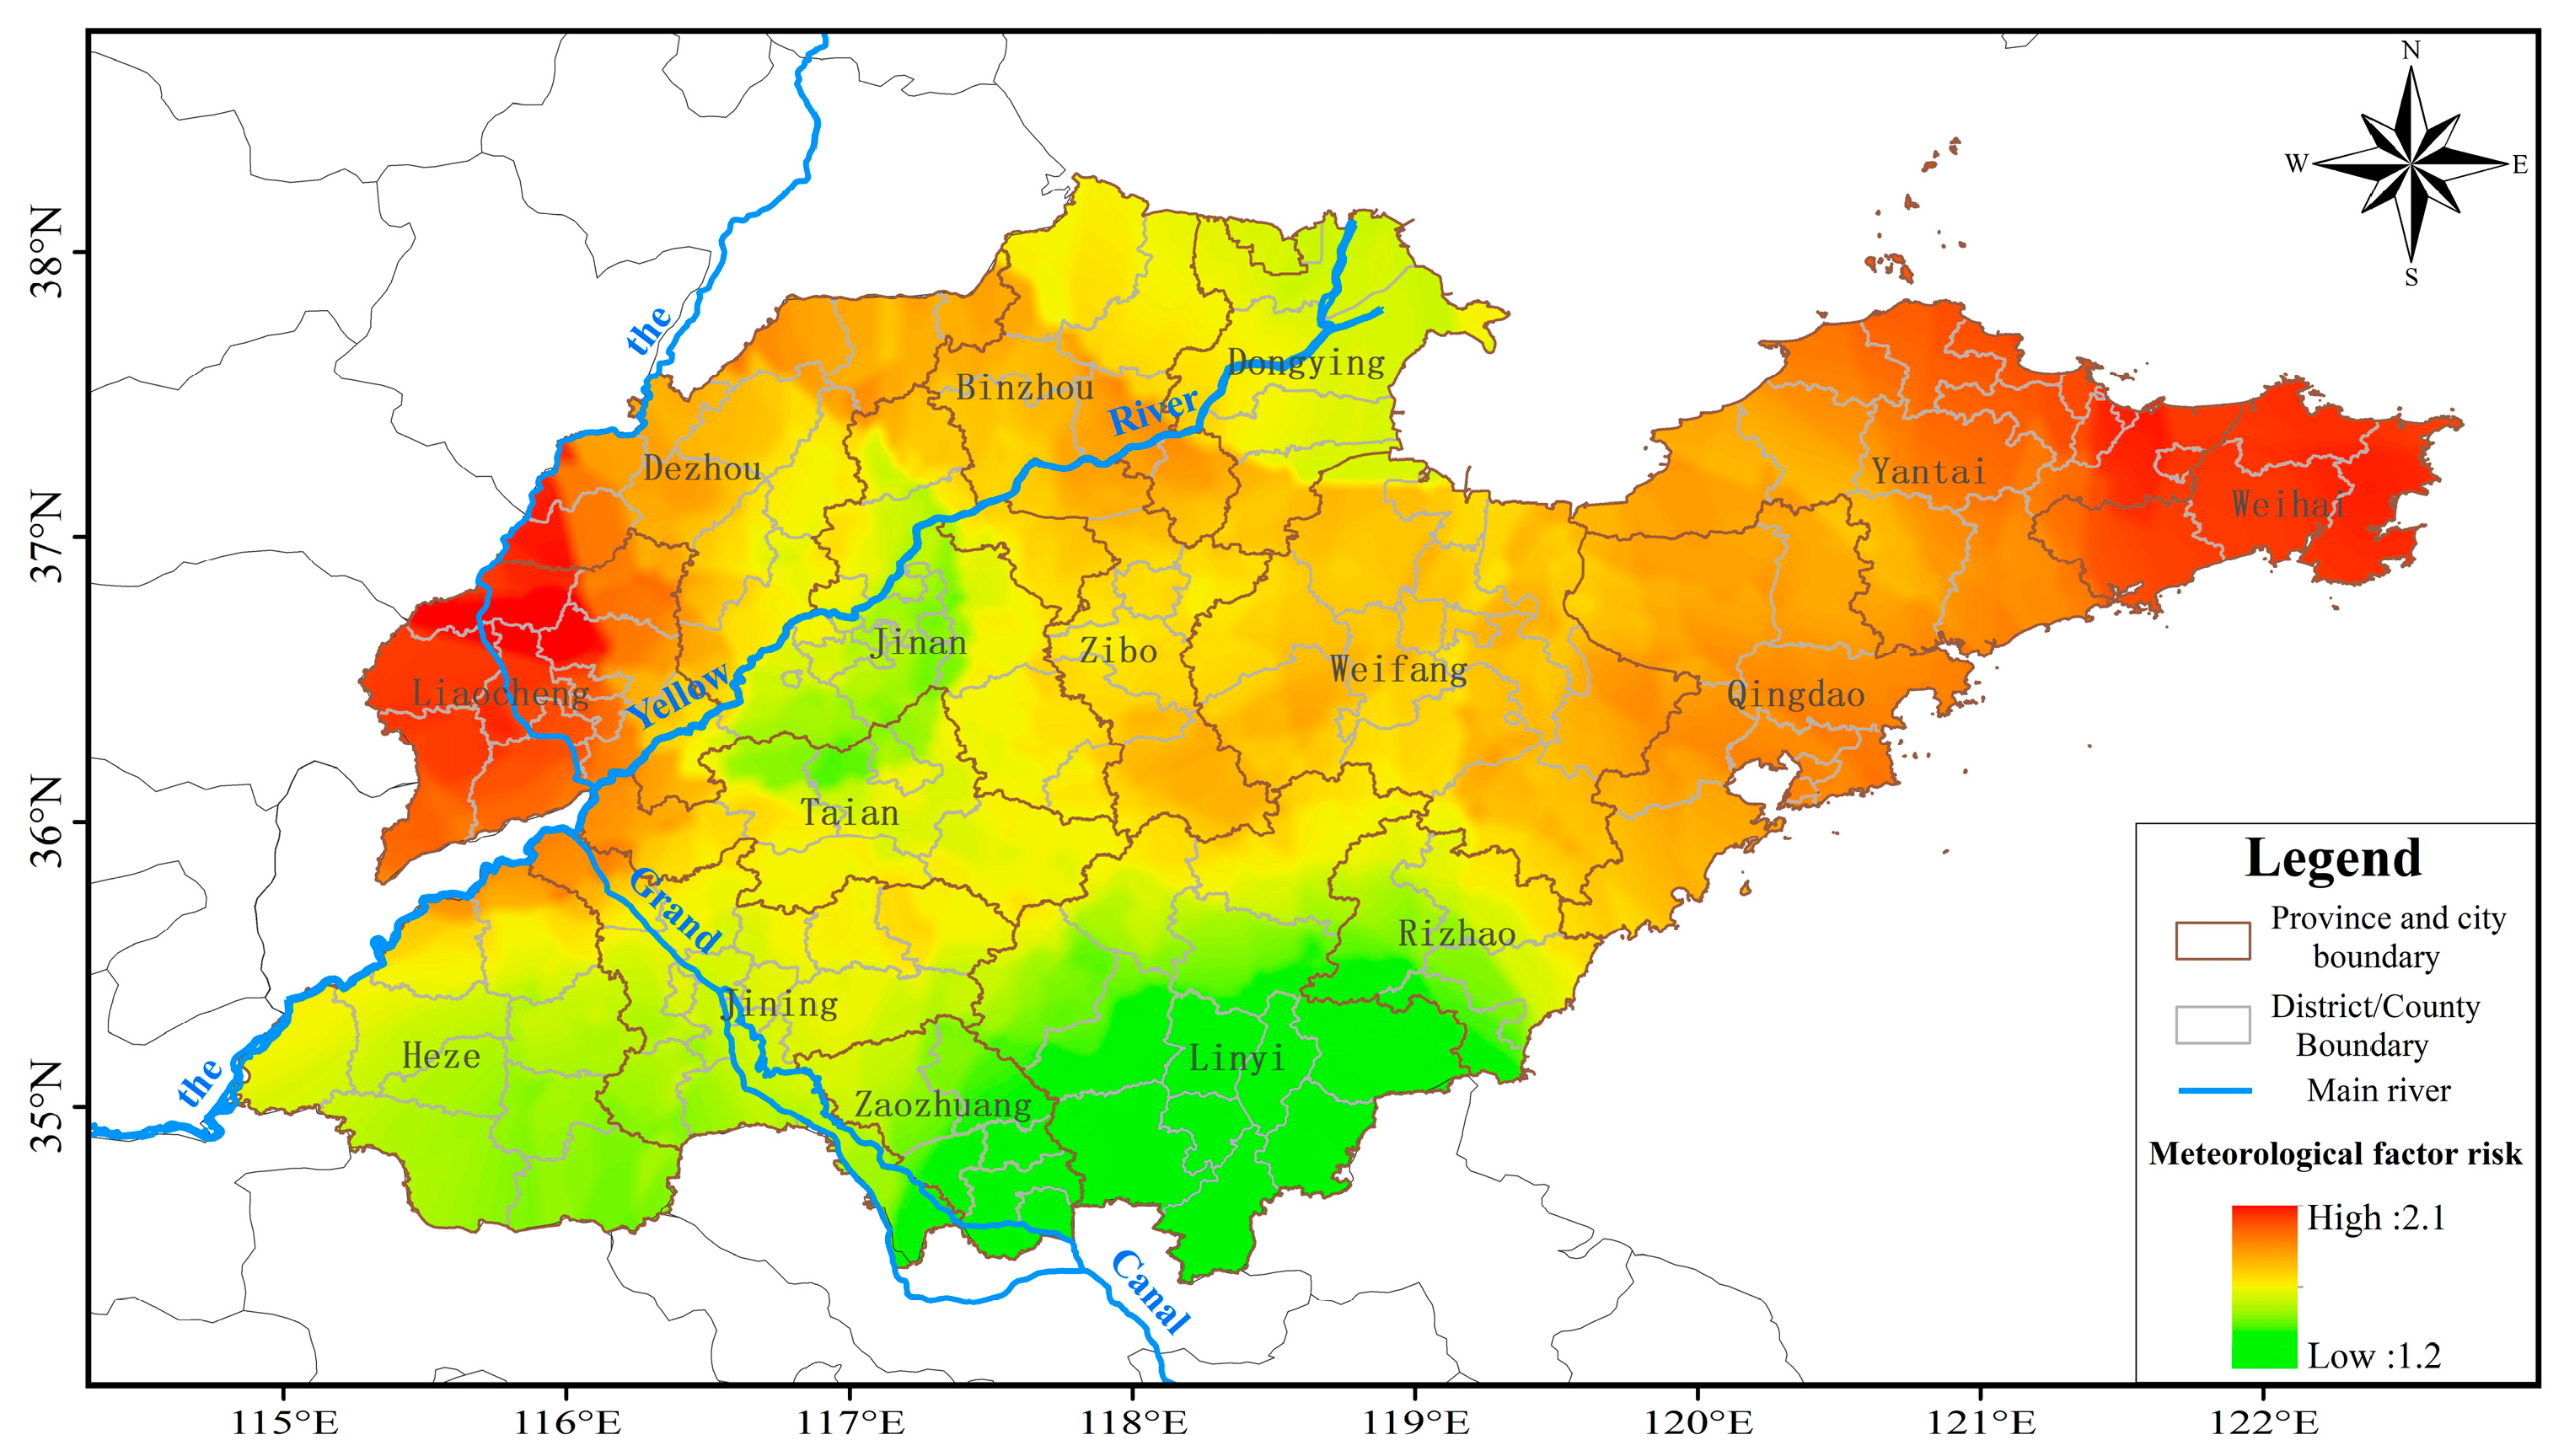
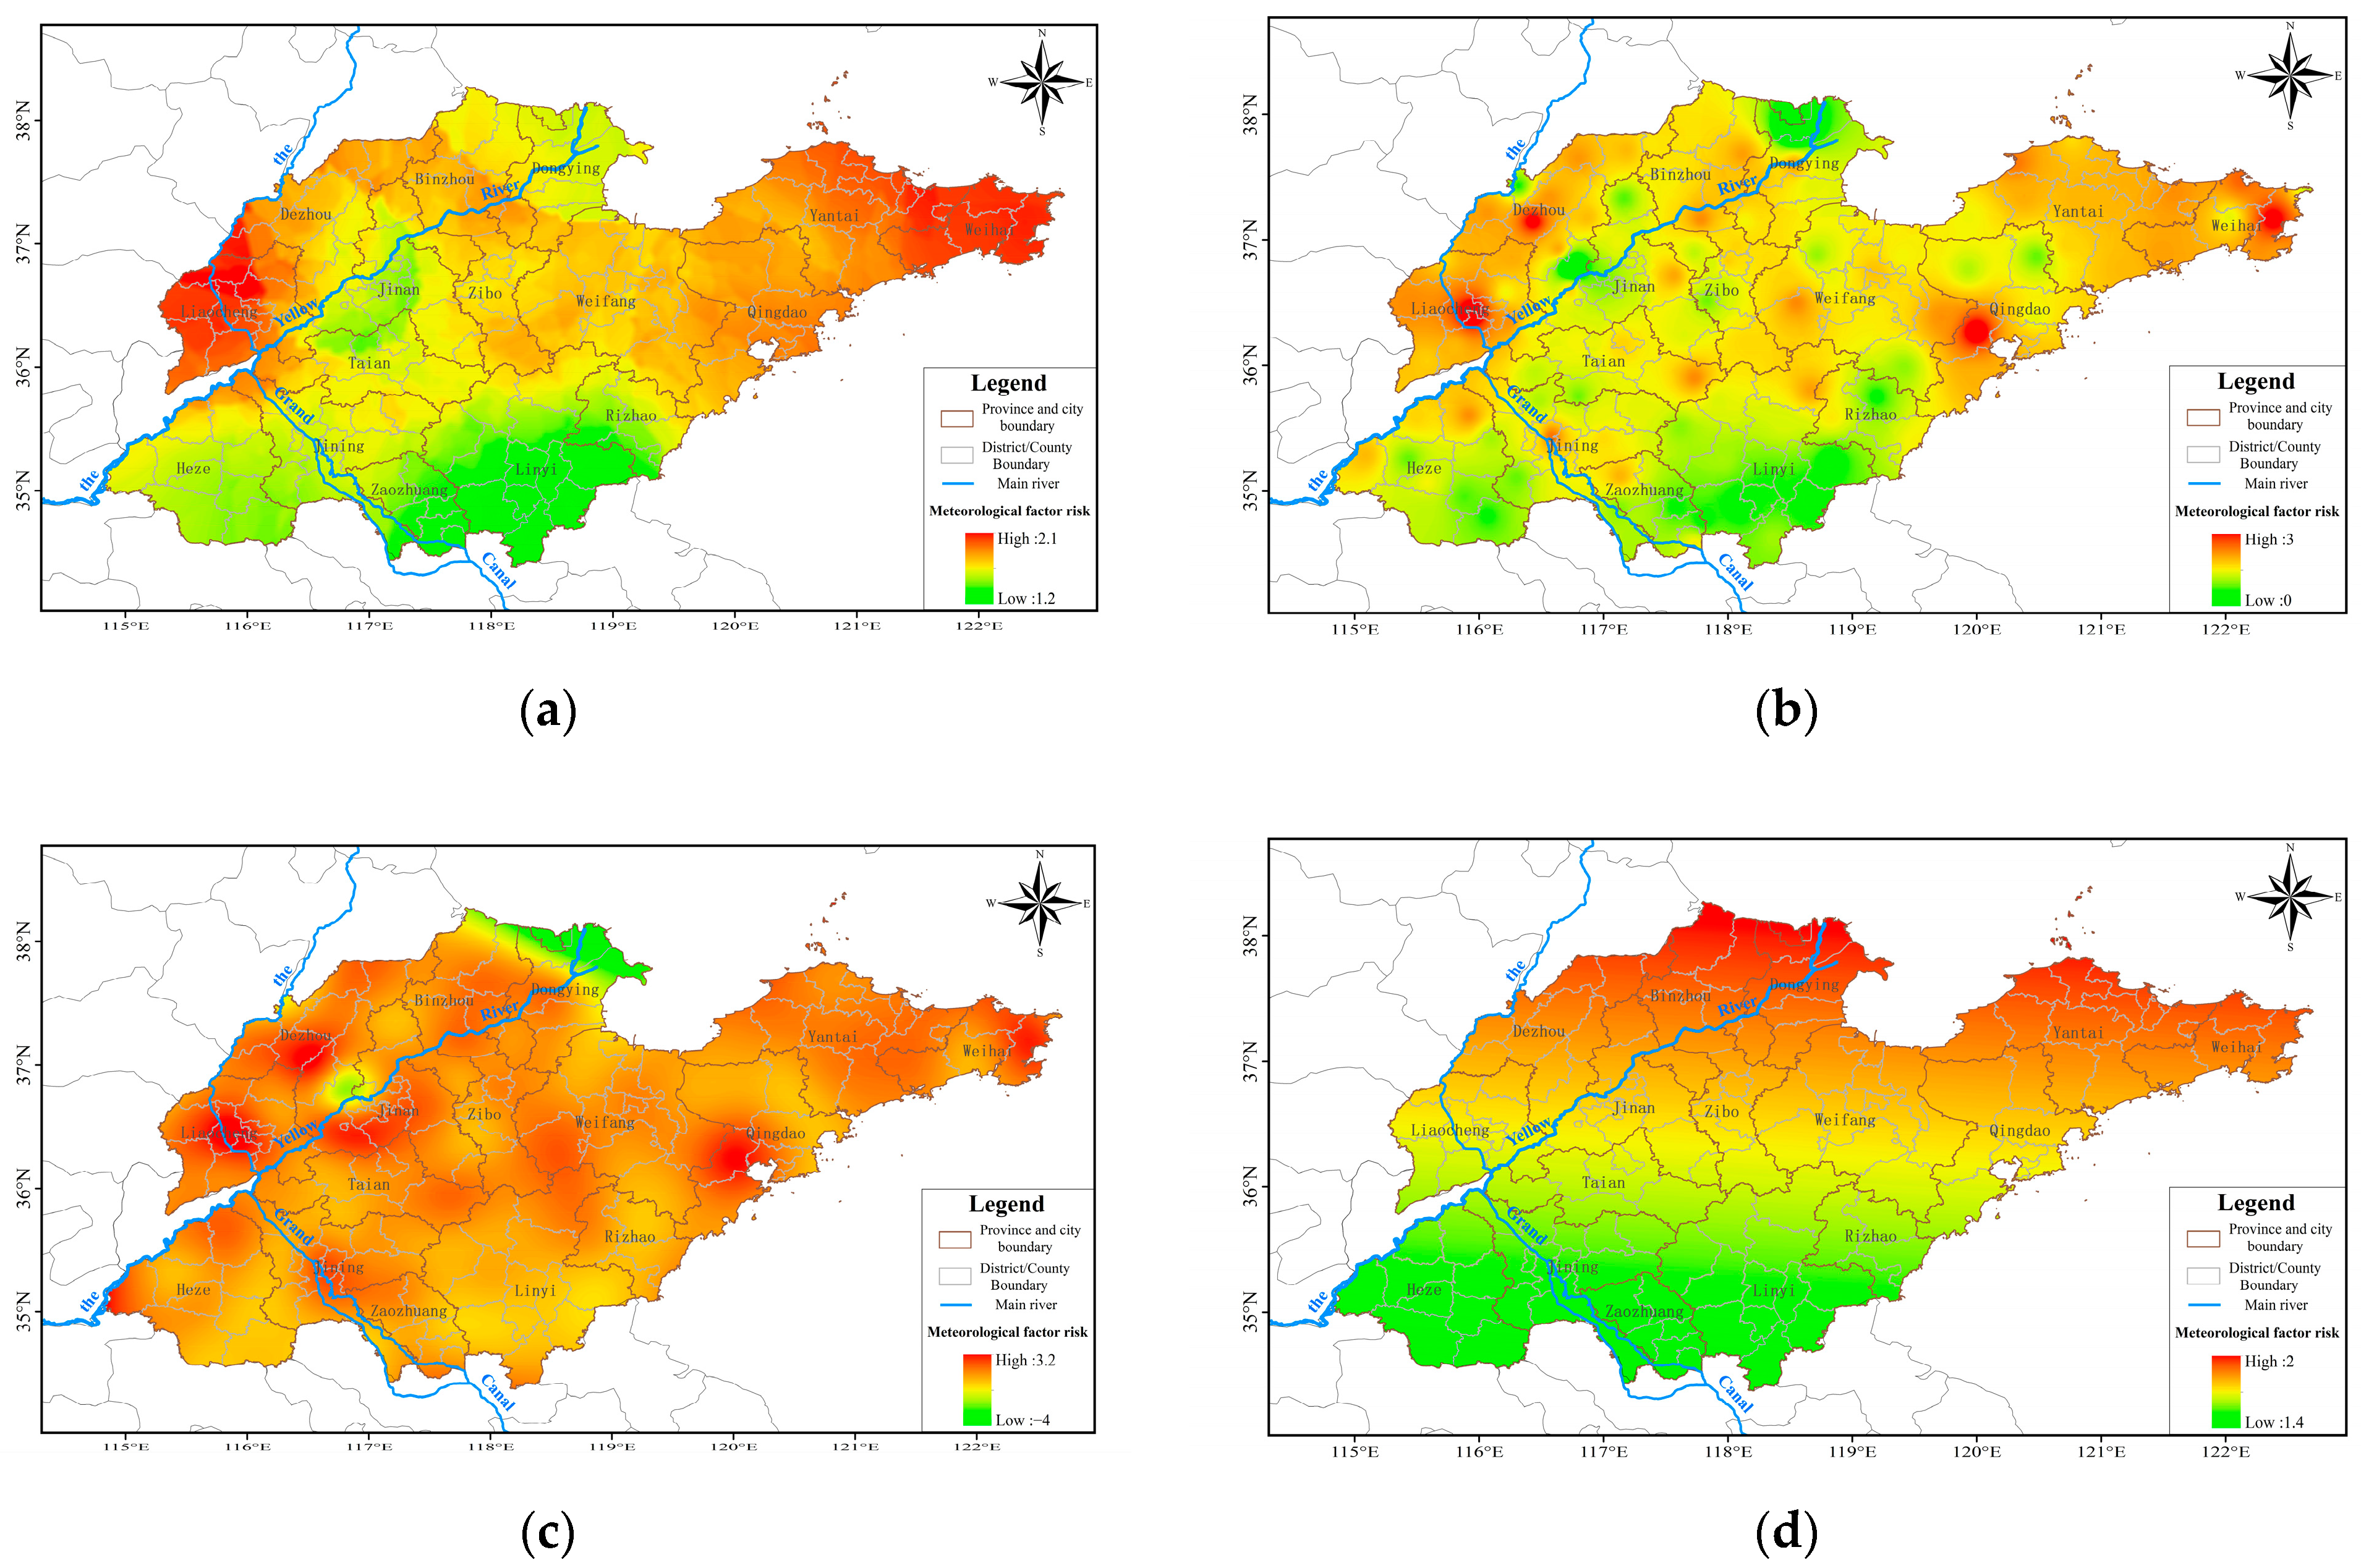
3.1.1. Meteorological Factor Risk Zoning

In this paper, the daily precipitation data of 122 stations in Shandong Province from 1991 to 2020 were used for meteorological data, and the precipitation anomaly percentage was calculated according to Equation (8), and the frequency of different drought levels in 122 stations in Shandong Province was calculated using the precipitation anomaly percentage according to the drought grade (Table 4); the drought grade was determined according to the meteorological drought standard of the people’s Republic of China (QX/T 82-2019), and the spatial distribution map of the frequency of different drought levels in peanut in Shandong Province during the whole reproductive period was obtained, and the spatial distribution of the frequency of different levels of drought in peanut growing areas in Shandong Province during the entire growing period was obtained (Figure 3). These findings show that the frequency of light drought was higher mainly in the southwestern part of Shandong Province, with a frequency of about 1.72%, with local high values in the northwestern and some eastern areas; the frequency of light drought in the northwestern area was the lowest, at 0. The frequency of moderate drought was higher in Dezhou, Zibo, Dongying, and Weifang, with the highest value being 2.14%, and lower in other areas. Severe drought was mainly concentrated in the Jiaodong Peninsula, with a frequency of about 2.59%, and it was also higher in some areas in western Shandong and lower in other areas; exceptional drought was widely distributed in the province, with a higher frequency in both northern and eastern areas at about 2.55% in the northern and eastern parts of the province, while the frequency was the lowest in the southwest.
The frequencies of light, moderate, severe, and exceptional drought were assigned weights of 0.0960, 0.1611, 0.2771, and 0.4658, respectively, to construct the meteorological factor risk index and obtain the spatial distribution of peanut drought meteorological factor risk in Shandong Province, as shown in Figure 4. The spatial distribution of the peanut drought meteorological factor risk in Shandong Province varied significantly. Specifically, the high-value areas were mainly distributed in Liaocheng, Dezhou, Binzhou, Zibo, Weifang, Qingdao, Yantai, and Weihai; the low-value areas were mainly distributed in Jinan, Zaozhuang, Linyi, and Rizhao.

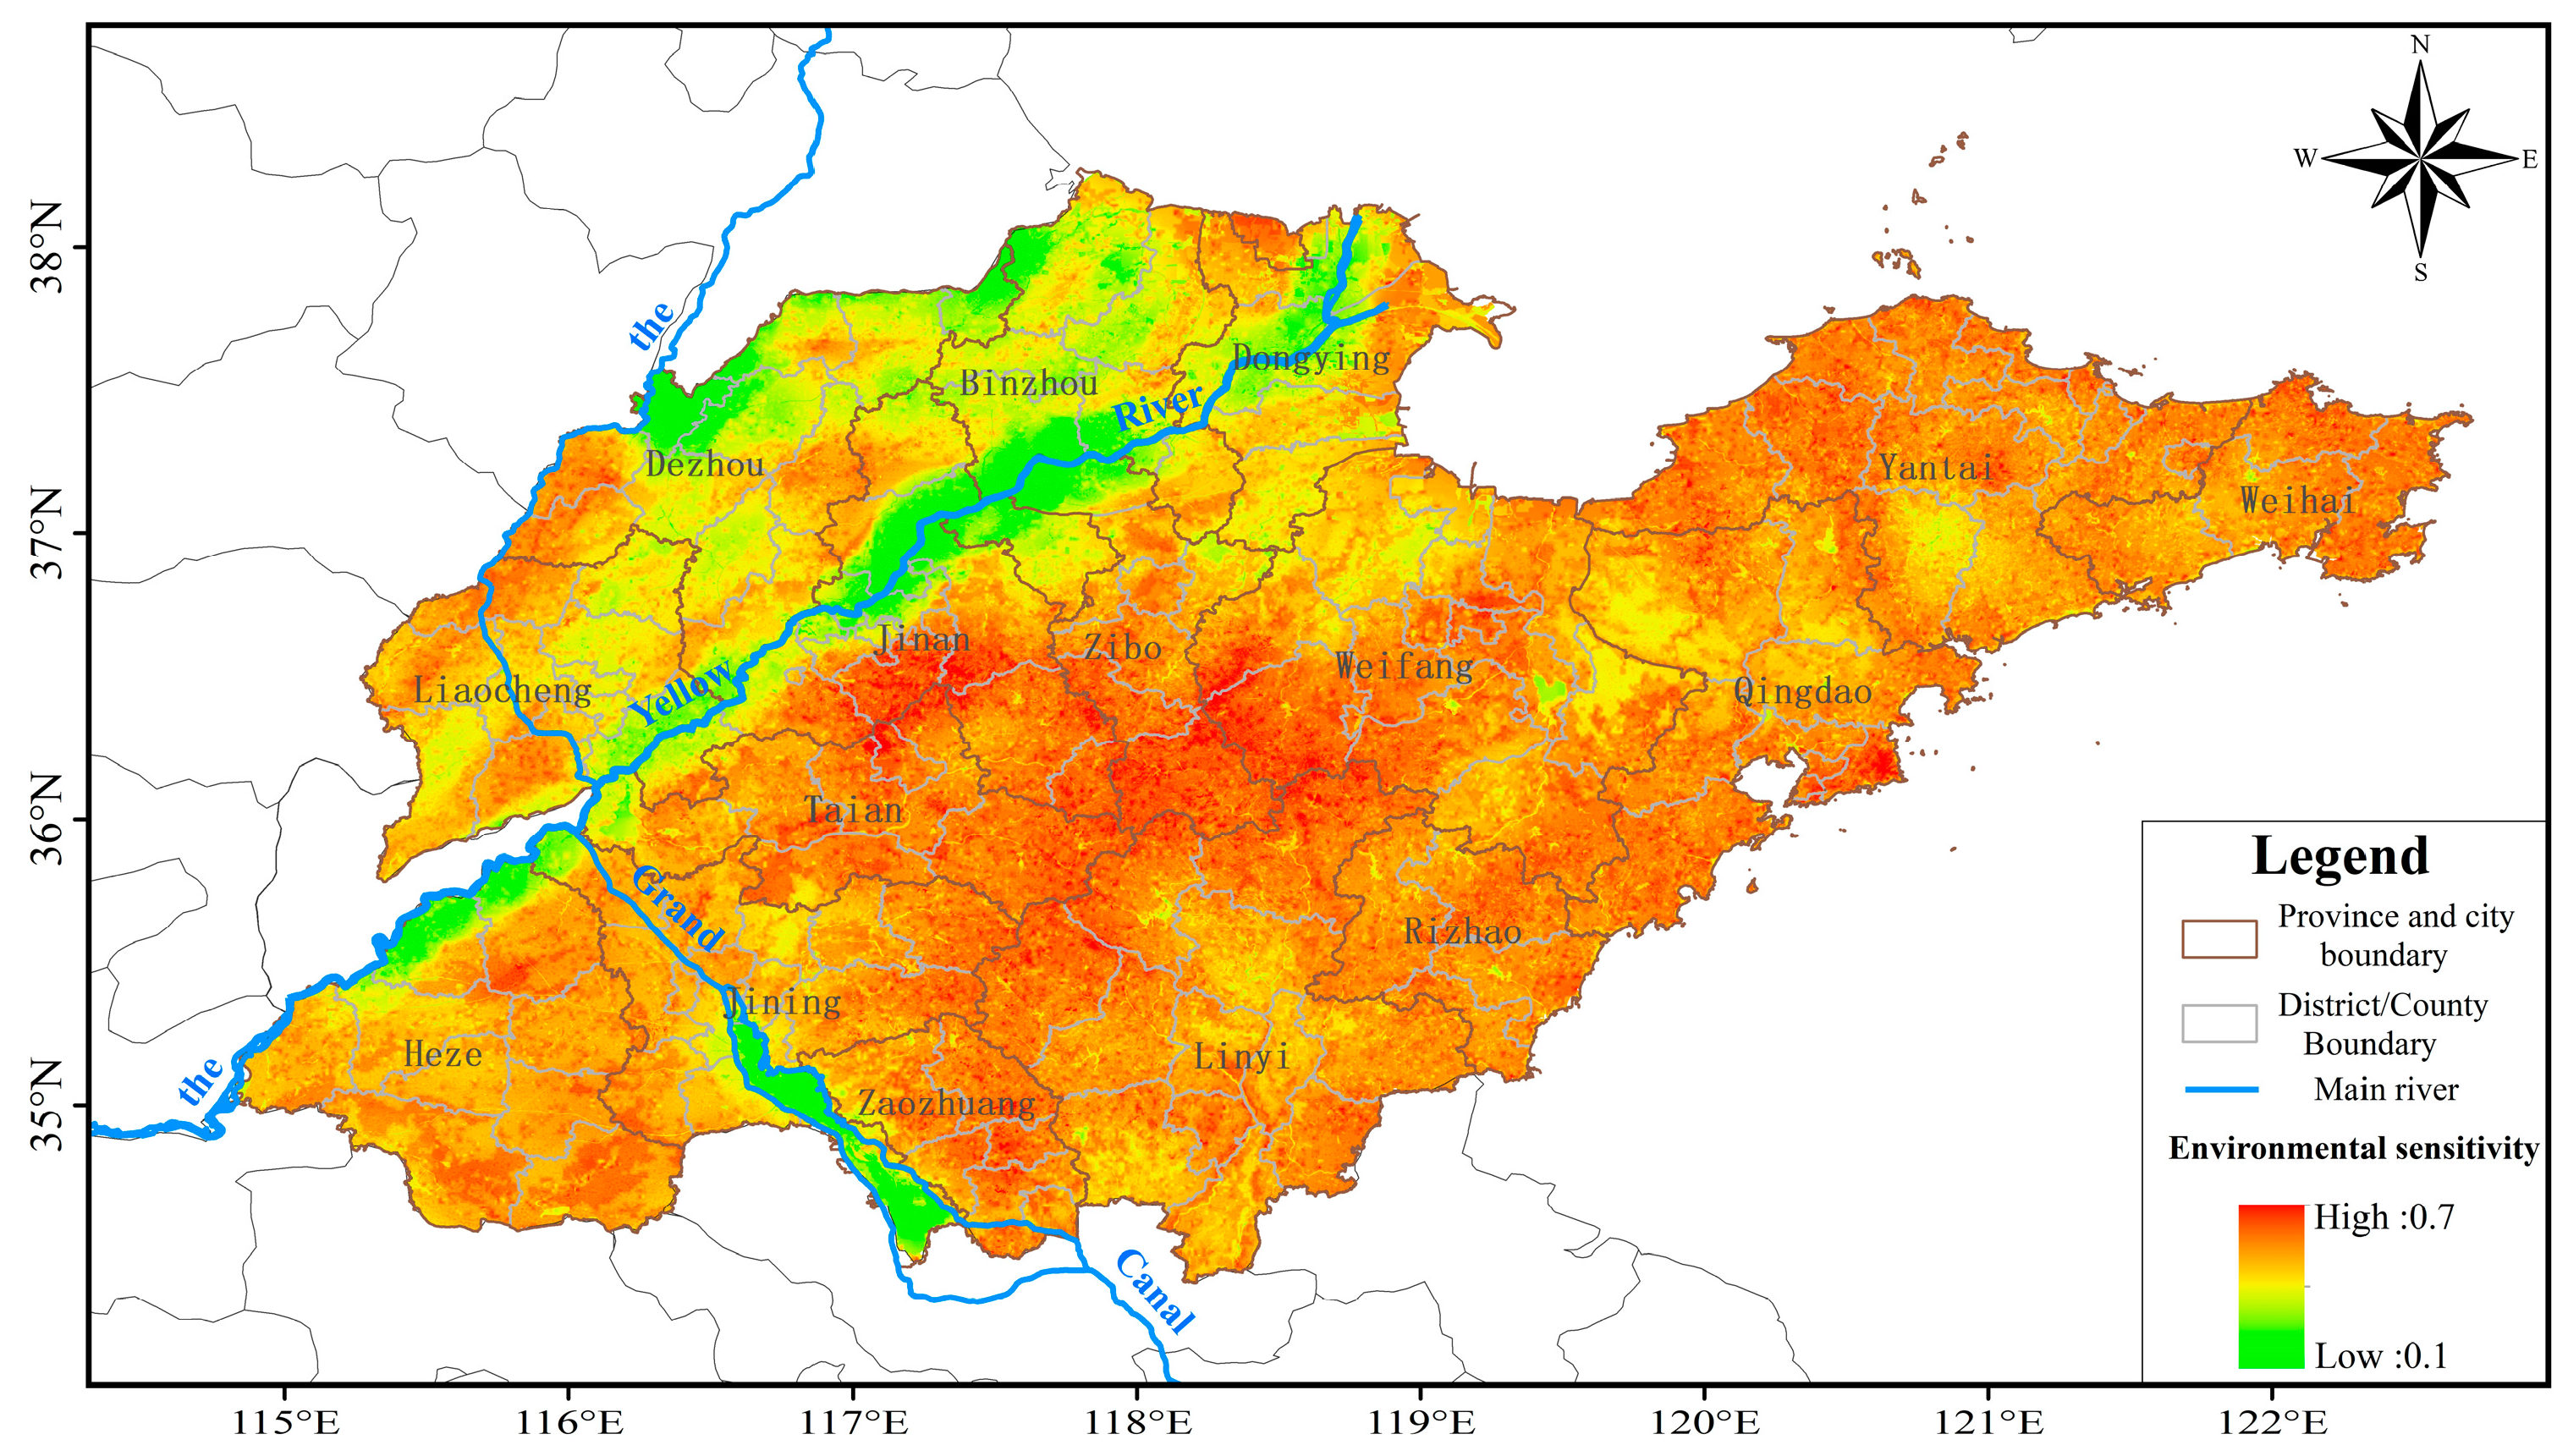
3.1.2. Zoning of Disaster Environment Sensitivity

Slope, elevation, river network density, land use type, and soil texture were selected as zoning indicators for the disaster-formative environmental-sensitivity analysis. Generally, the higher the elevation, the greater the chance of a drought occurring and the greater the sensitivity of an area to drought. Areas with greater slopes experience faster runoff and less infiltration so less moisture is stored in the slope body, making an area more prone to drought. Areas with a less dense river network had lower atmospheric humidity, making them more prone and sensitive to drought. Urbanization has resulted in arable land, grassland, and woodland being replaced by buildings and hardened ground that blocks rainwater from infiltrating into the soil, resulting in a worsening of drought conditions. Therefore, areas different land use types were given unique scores (Table 5). Areas with more clayey and heavier soil texture were less permeable to water, resulting in weaker vertical infiltration, and they were more likely to retain ground water, which is not conducive to the occurrence of drought disasters. Different soil textures were thus scored as in Table 6. In the calculation of the environmental sensitivity index, all factors except the river network density were normalized by the maximum value.
The spatial distribution of elevation, slope, river network density, land use type, and soil texture in Shandong Province are shown in Figure 5. It can be seen that the elevation of Shandong Province ranges from −169 to 1527 m, with an average elevation of about 90 m. The slope ranges from 0 to 49.1°, and the slope is below 1.5° in most areas, and the spatial distribution of elevation and slope is roughly the same. Areas with higher elevation and slope are concentrated in mountainous areas, such as Tai’an, Zibo, Jinan, and parts of Linyi in central Shandong, while the peninsula areas such as Yantai are also relatively high. The density of the river network in the northwest of Shandong Province is obviously higher than in the rest of the province; In particular, along the Yellow River where the river network density is high, high-value areas are mainly distributed in Dezhou, Binzhou, Jinan, and other parts of the region. The land use types in Shandong Province are mainly arable land and construction land, and arable land is distributed in a large area in all cities; forest land and grassland are more concentrated in the south and east of Shandong Province; the distribution of water is not concentrated; construction land is mainly distributed in the center of each city; and the area occupied by unused land is very small. Loam and sandy clay loam are widely distributed in Shandong Province, and clay soil is scattered in the province.
The five factors of the zoning results for elevation, slope, river network density, land use type, and soil texture were spatially superimposed according to the weights of 0.2064, 0.2064, 0.3683, 0.1094, and 0.1094. This resulted in the zoning results for the environmental sensitivity risk of peanut drought pregnancy in Shandong Province, as shown in Figure 6. Figure 6 shows the spatial distribution of this type of risk in Shandong Province had relatively little variability, with the low-value areas concentrated along the Yellow River and the rest sporadically distributed in Dezhou, Binzhou, Zaozhuang, and Jining. The high-risk areas were distributed in the province, but mainly in Jinan and the cities of Weifang, Qingdao, Yantai, Weihai, Heze, and Linyi.

3.1.3. Drought Risk Zoning for Peanuts in Shandong Province

According to the calculation from (2) and using the natural discontinuity point method to classify the areas with risks into low, medium, and high levels of risk, we obtained a spatial distribution map of peanut drought risk in Shandong Province (Figure 7).
As Figure 7 shows, peanut drought risk in Shandong Province has an obvious spatial distribution trend, showing the spatial distribution characteristics from high in the northwest to low in the southeast. Low-, medium-, and high-risk areas accounted for 22.6%, 50%, and 27.4% of the province’s area, with areas of 35,685.4 km2, 79,013.8 km2, and 43,227.8 km2, respectively. The entire area of Weihai City was a high-risk area while the cities of Qingdao, Yantai, and Liaocheng all had relatively larger areas identified as high-risk areas; meanwhile, the cities of Dezhou, Binzhou, Zibo, and Weifang had sporadically distributed areas with a high risk for drought that affects peanuts. The cities of Weifang and Dongying had a relatively large area with a moderate risk. The cities of Jining, Heze, Tai’an, Jinan, Zaozhuang, Linyi, and Rizhao were mainly exposed to low and moderate risks. In particular, Zaozhuang was basically in a low-risk area.

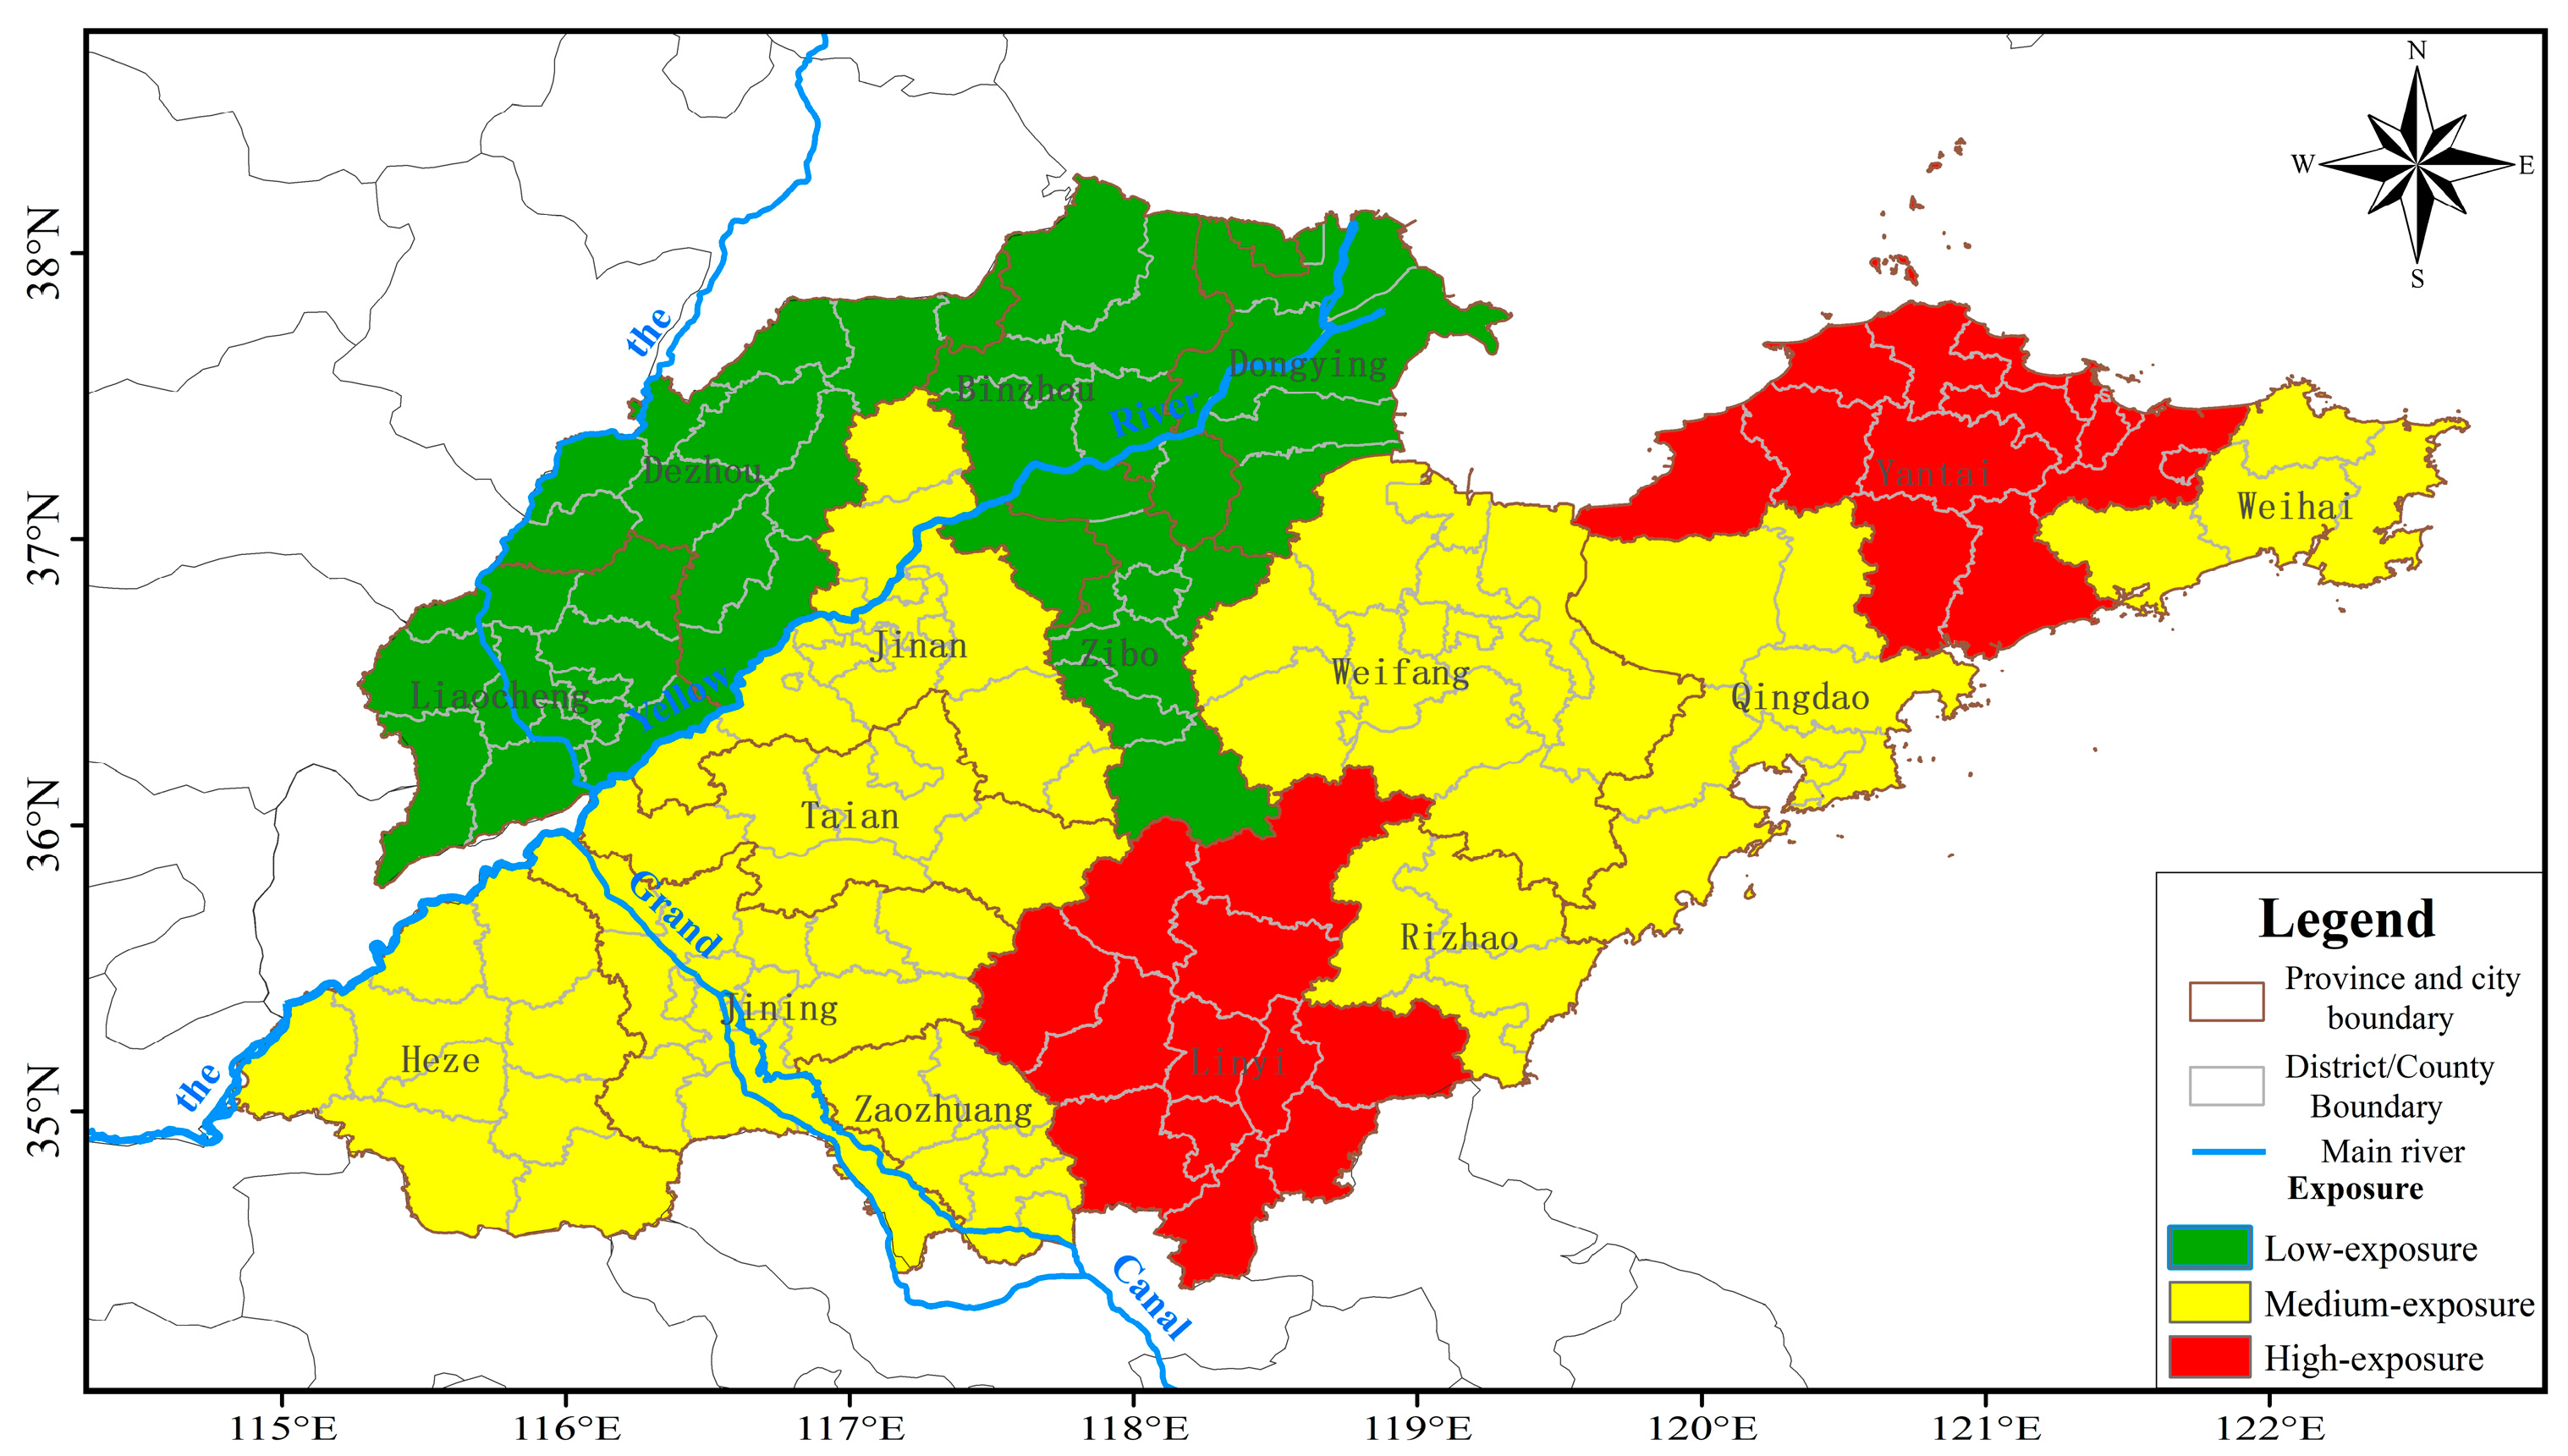
3.2. Spatial Distribution of Exposure of Peanut-Drought-Affected Bodies

In this paper, the disaster-affected body is the peanut, so the peanut planting areas were selected as the exposure index. The larger the peanut planting area, the higher the chance of being affected by the drought, so when calculating the exposure index, the factor was standardized by the maximum value, and the natural discontinuity point method was used to classify the exposure of the disaster-affected body into low, medium, and high exposure, and the spatial distribution of the exposure of the peanut-drought-affected body in Shandong province was obtained (Figure 8).
Figure 8 shows that the medium- and high-exposure areas for peanut drought in Shandong account for 76.8% of the total area of the province, with a high degree of exposure overall. Among these areas, the high-exposure areas covered 32,669.1 km2, or 20.7%, of the province; these were mainly distributed in Yantai and Linyi. The medium-exposure areas were mainly distributed in Heze, Jining, Zaozhuang, Tai’an, Jinan, Weifang, Rizhao, Weihai, and Qingdao with an area covering 88,538.9 km2, or 56.1%, of the province. The low-exposure area covered only 36,692 km2, mainly including the cities of Liaocheng, Dezhou, Binzhou, Zibo, and Dongying, or 25% of the province.

3.3. Spatial Distribution of Vulnerability of Peanut-Drought-Bearing Bodies

Since this paper took administrative districts as the unit for zoning, if the planting areas of peanuts in two administrative districts were the same, but two administrative districts were different, the percentages of peanut cultivation area were different, as obviously their vulnerabilities were not the same. Therefore, the percentage of peanut cultivation area was chosen as a vulnerability indicator in this paper. The larger the percentage of the peanut cultivation area, the stronger the vulnerability. This factor was normalized to the maximum value in the calculation of the vulnerability index. The natural discontinuity point method was used to classify the vulnerability of disaster-affected bodies into low, medium, and high vulnerability, and the spatial distribution of vulnerability of peanut-drought-affected bodies in Shandong province was obtained (Figure 9).
Figure 9 shows the vulnerability of drought-affected areas where peanuts are grown in Shandong Province has obvious spatial regional differences. The low-, medium-, and high-vulnerability areas accounted for 58.3%, 14.9%, and 26.8% of the province’s area, with areas of 92,059.1 km2, 23,566.5 km2, and 42,274.4 km2, respectively. Among these, the cities of Linyi, Rizhao, Yantai, and Weihai were areas with a generally high vulnerability to drought. Medium-vulnerability areas were mainly distributed in the cities of Tai’an, Zaozhuang, and Qingdao. Low-vulnerability areas were widely distributed in the cities of Heze, Jining, Liaocheng, Dezhou, Jinan, Zibo, Binzhou, Dongying, and Weifang.

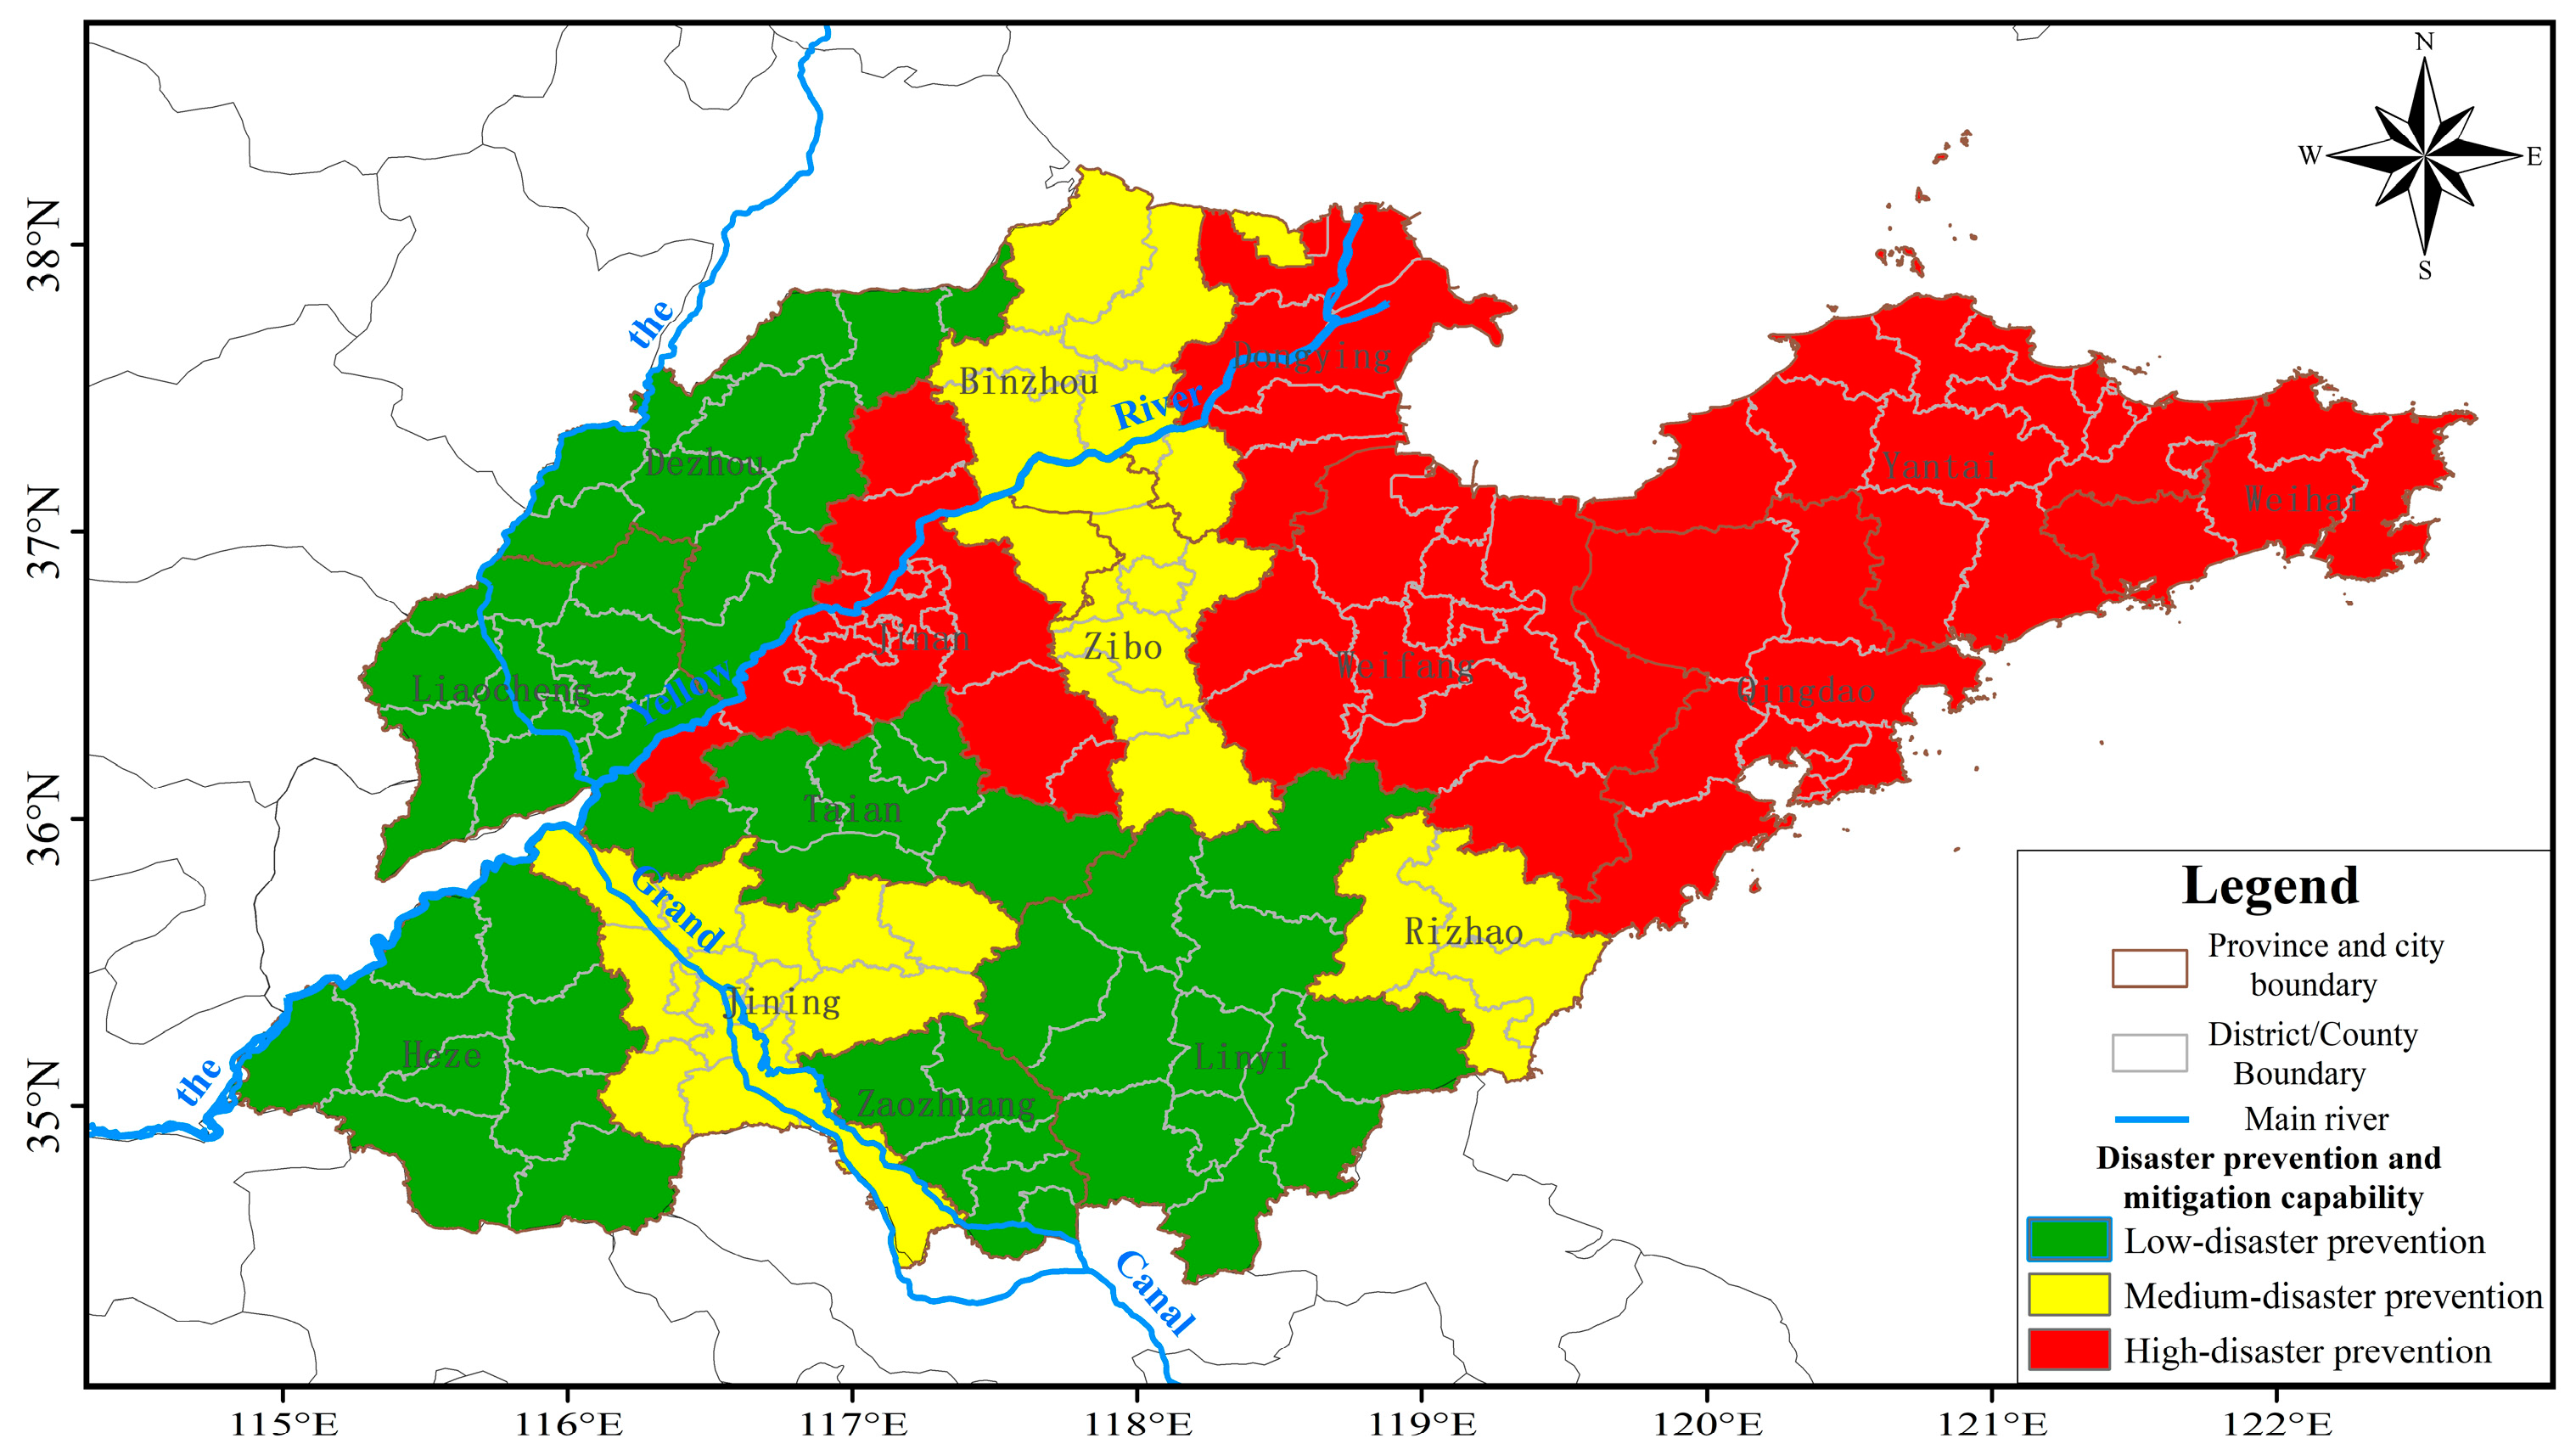
3.4. Spatial Distribution of Disaster Prevention and Mitigation Capability

The capacity to prevent and mitigate disasters refers to various management measures and countermeasures designed to prevent and mitigate meteorological disasters. The higher the economic level of a location, the stronger the capacity of humans to prevent and mitigate disasters. The higher the per capita GDP and income of farmers as and the higher their education level, the better ability they will have to develop policies designed to prevent and respond to disasters when peanut drought occurs. Improved construction of water conservation facilities is a direct manifestation of a stronger capacity to prevent and mitigate drought disasters; to reflect this reality, the per capita GDP and income of farmers, their level of education, and the existence of water conservation facilities were selected as indicators of the capacity of an area to prevent and mitigate disasters. Additionally, all factors are normalized to the maximum value in the calculation of the disaster prevention and mitigation capacity index. These selected indicators were given weights of 0.4226, 0.2708, 0.1443, and 0.1622, respectively, by using the AHP method. The calculations were carried out according to (2), and the natural discontinuity point method was used to classify the disaster prevention and mitigation capacity into low, medium, and high levels to obtain the spatial distribution of the capacity to prevent and mitigate drought disasters related to growing peanuts in Shandong Province (Figure 10).
Figure 10 shows the spatial distribution of the capacity to prevent and mitigate drought disasters related to peanuts in Shandong Province is highly variable. The area with a high level of this type of capacity covered 64,581.1 km2 and was mainly distributed in Jinan, Dongying, Weifang, Qingdao, Yantai, and Weihai, or 40.9% of the province’s area. The area with a medium level of this type of capacity was mainly distributed in Jining, Binzhou, Zibo, and Rizhao and covered 32,211.6 km2 or 20.4% of the province’s area. The area with a low level of this type of capacity covered 61,107.3 km2 or 38.7% of the province’s area; this area was mainly in the cities of Liaocheng, Dezhou, Tai’an, Heze, Zaozhuang, and Linyi.

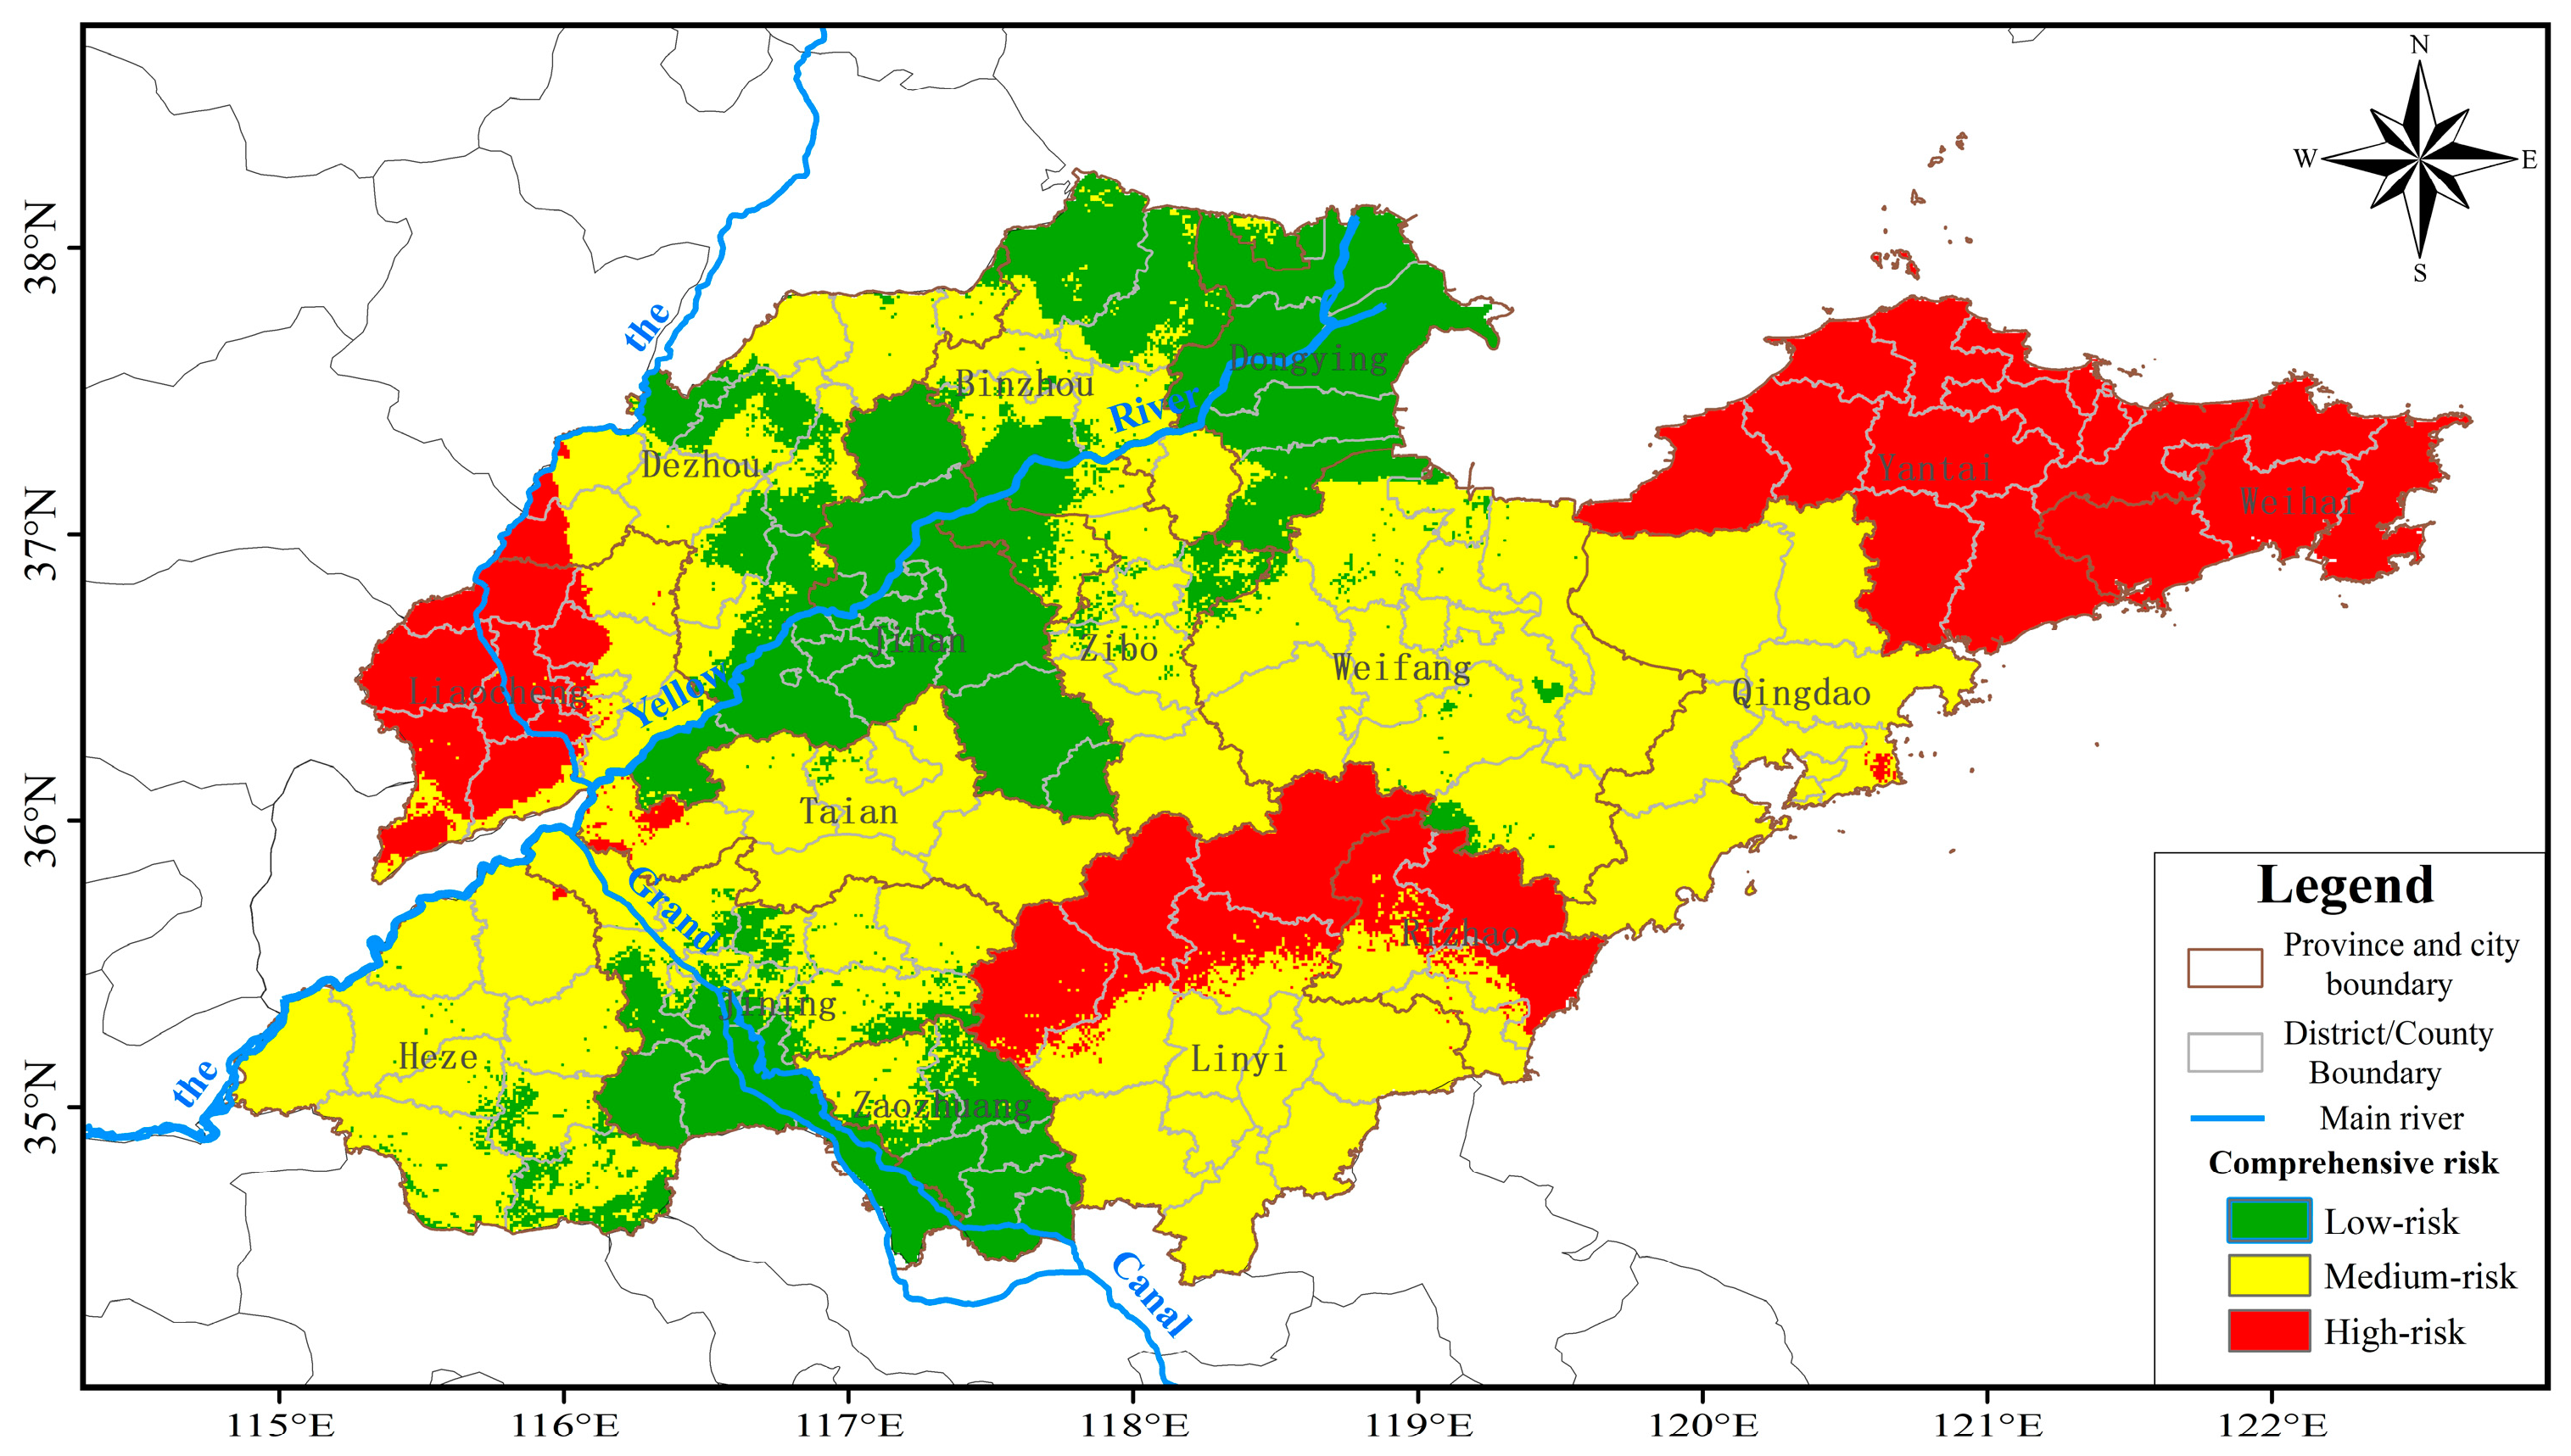
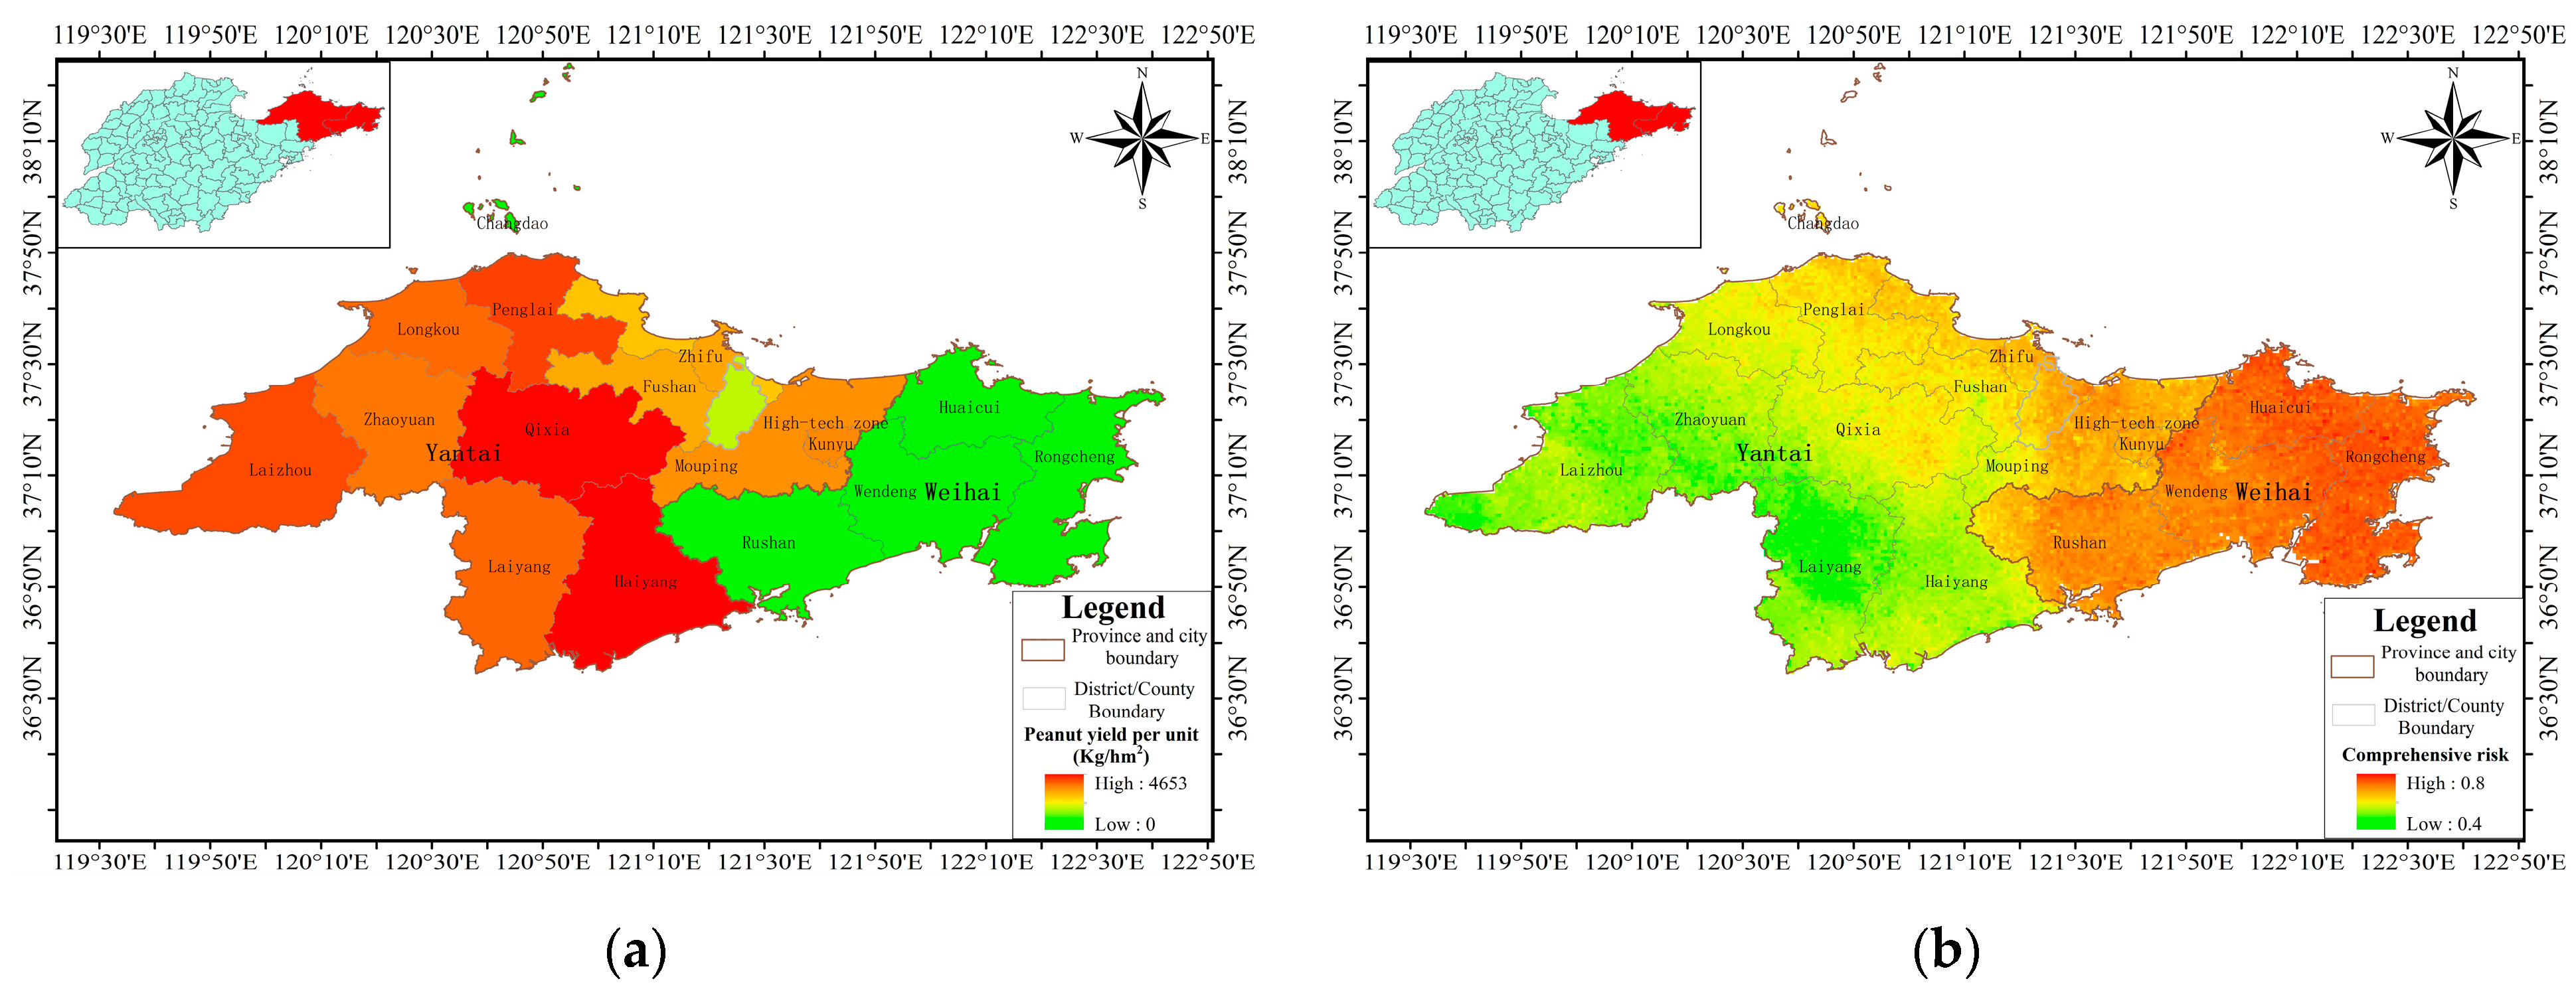
3.5. Spatial Distribution of Comprehensive Peanut Drought Risk

The four factors of the zoning results, risk, exposure of disaster-bearing bodies, vulnerability of disaster-bearing bodies, and disaster prevention and mitigation capability, were spatially superimposed according to the weights of 0.5, 0.167, 0.167, and 0.167. This allowed us to obtain the zoning results of the comprehensive risk of peanut drought in Shandong Province, as shown in Figure 11. Note that the comprehensive risk of peanut drought differs substantially in different areas. The medium- and high-risk regions were located mainly in the west and central areas, with low-risk regions in the east. The overall spatial distribution shows a strong degree of fragmentation. Table 7 shows the areas of the high-, medium-, and low-risk regions in each city. In Yantai, Linyi, Liaocheng, and Weihai, high-risk regions had the largest area. In Binzhou, Dongying, and Jinan, there were no high-risk regions. In Tai’an, Weifang, and Heze, the medium-risk regions had the largest area. The number of areas with medium risk in Weihai was zero. In Jinan, and Dongying, low-risk regions had the largest area. In summary, there were no low-risk regions in Qingdao or Yantai, only medium- and high-risk areas. High-, medium-, and low-risk regions for peanut drought amounted to 36,833.4 km2, 83,441.1 km2, and 37,625.5 km2, accounting for 40.6%, 37.0%, and 22.4% of the total land area, respectively.

4. Discussion

Droughts are divided into meteorological drought, climatic drought, atmospheric drought, agricultural drought, hydrological drought, and socioeconomic drought [25], which correspond to different monitoring methods and indicators for different drought types. These include precipitation (P) and precipitation anomaly percentages (Pa), a standardized precipitation index (SPI), relative wetness index, integrated drought index, soil moisture drought index, Palmer drought index, soil moisture remote sensing model, vegetation water supply index, and so on [26]. Among them, atmospheric drought, agricultural drought, hydrological drought, and socioeconomic drought involve several meteorological factors, soil property factors, and socioeconomic factors, which are easier to obtain at smaller spatial scales but more difficult to obtain at larger spatial scales. Therefore, this study focused on whether precipitation during the critical growing period of peanuts met its growth demand and therefore selected meteorological drought index and considered only precipitation. In the future, with more and more basic data at high spatial resolution, agricultural drought will be further considered, and parameters such as field moisture capacity and soil weight will be added to more accurately target the water deficit in peanuts caused by soil water deficiency during the peanut reproductive period.
In this paper, the meteorological factor risk was based on the observational results of meteorological observation sites; the frequency of drought occurrence in the entire growth cycle of peanuts at each site was calculated. A spatial distribution map of drought risk was obtained using Kriging interpolation in Arc-GIS. However, spatial interpolation methods other than Kriging exist, such as inverse distance weight interpolation, the spline function method, and trend surface analysis. This paper further compared the results of the centralized interpolation methods, as shown in Figure 12, which shows the spatial distribution of the frequency of drought occurrence obtained using different interpolation methods. The comparison shows that the spatial distribution of drought occurrence frequencies obtained by different interpolation methods varied in that the results of Kriging interpolation, inverse distance weight interpolation, the spline function method, and trend surface analysis all differed greatly. These four interpolation methods show that the areas with a high frequency of drought affecting peanuts during the entire growing period were located in the northwestern and eastern areas of Shandong Province. The results of existing studies show that the areas with drought frequency from 20% to 25% in the Yellow River and Huaihai regions include certain planting areas in the western, northwestern, northern, and central Yellow River basin, as well as in the northern and northeastern planting areas in the Huaihe River basin. The planting areas in the northwestern Huaihe River basin have a lower drought frequency of less than 15% and are not prone to drought [19]; after image comparison, the results obtained with Kriging interpolation method were more consistent with the results of related studies.
In the process of risk zoning, the main indicators that were selected were exposure, zoning of the vulnerability, and the capacity of an area to prevent and mitigate disasters, along with social and economic indicators; however, the influence of the statistical yearbook data based on the indicators tended to not be uniform across counties, with some indicators available in some counties and not in others. In order to achieve uniformity, there were cases in which adjustments or replacements were mad according to specific situations, which would more or less affect the zoning results. Nevertheless, the influence of the statistical yearbook information caused some indicators to be limited to the city level, so there were no indicators at the county level in some places, which would affect the spatial resolution of the zoning. In addition, the influence of statistical yearbook data caused the indicators selected to not be available, such as indicators based on the physical significance of exposure, and the vulnerability and capacity of an area to prevent and mitigate disaster because the data were not available in the statistical yearbooks, so similar indicators had to be substituted for these. For example, the education level of peanut farmers should be expressed by the percentage of farmers with a diploma at each level, but some statistical yearbooks lacked relevant information, and the number of school students had to be used to express the local level of education. This type of treatment also affected the final risk zoning results.
In this paper, when constructing the risk index, exposure index, vulnerability index, disaster prevention and mitigation index, and comprehensive risk index, weights needed to be assigned to different influencing factors. Since the above indices were used as dependent variables in this study and no specific data were available, methods such as multiple regression, principal components, and neural networks could not be used. The main advantage of the hierarchical analysis method is that it is a more appropriate method to determine the weights of the respective variables when the specific value of the dependent variable is not known and only the independent variable is available. It constructs a discriminant matrix by the relative importance of two factors and solves the weight of each factor on the premise that the matrix passes the heterogeneous consistency test. The hierarchical analysis method organically combines qualitative and quantitative methods of evaluation, neither one-sidedly pursuing high mathematical logic, nor simply focusing on subjective behavior and conscious judgment, so it is widely used when the dependent variables lack quantitative data and the weights of their influence factors need to be determined.
This paper assessed and zoned the risk of peanut-related drought in Shandong Province in terms of risk, exposure, vulnerability, prevention, mitigation capacity, and integrated risk assessment. Because little in the way of related research results exist, the analysis of this paper is comprehensive, and the zoning indices used proved to be good. The present study provides a research example for related studies, has certain reference value, and can promote future studies. The Jiaodong Peninsula is one of the major peanut-production areas in Shandong Province, so the actual peanut yields per unit in Yantai and Weihai of Shandong Province were used to verify the comprehensive peanut drought risk result obtained in this paper, as shown in Figure 13. The comprehensive peanut drought zoning results of the selected areas show that the high-risk areas were mainly distributed in Weihai and the northeastern areas of Yantai, and the spatial distribution of peanut yields per unit showed that peanut yields per unit in Weihai and the northeastern areas of Yantai were low. This shows that peanut yields per unit were lower in areas with higher integrated risks, indicating that the results obtained in this paper have a certain degree of accuracy and credibility.
Comprehensive analysis of peanut drought risk zoning results showed that the spatial distribution of peanut drought hazard, exposure, vulnerability, and disaster prevention and mitigation capacity in Shandong Province varied widely. Yantai in Shandong Province is a high-risk zone and also the area with the largest peanut cultivation area, the highest exposure zone, and highest vulnerability zone, and the comprehensive risk of Yantai determined it as a high-value zone. While Liaocheng in western Shandong Province is a high-value area for comprehensive risk of peanut drought, which is mainly caused by high risk and low disaster prevention and mitigation capacity; Weihai in eastern Shandong Province is a high-risk area with high vulnerability, which eventually forms a high-comprehensive-risk area. Therefore, for different regions, targeted measures can be proposed. For example, Liaocheng should focus on improving disaster prevention and mitigation capacity, while Yantai and Weihai should focus on improving the drought resistance of peanut varieties. The risk assessment and zoning of peanut drought in Shandong Province can not only improve people’s understanding of peanut drought, but also provide a reference for relevant departments to develop and carry out peanut drought prevention and relief policies and decisions.

5. Conclusions

The proportion of areas at medium and high risk for peanut drought in Shandong Province was 80.6%, with the cities of Weihai, Yantai, and Qingdao having a significantly higher risk than other cities. The proportion of medium- and high-exposure areas was 76.8%, which is high overall and distributed in patches in the cities of Yantai and Linyi. The medium- and high-vulnerability areas accounted for 41.7% of the province’s area. Except for the cites of Weihai, Yantai, Linyi, and Rizhao, other cities had low vulnerability. Areas with a strong, medium, and relatively strong capacity to prevent and mitigate drought accounted for 61.3% of the province’s area. The cities of Qingdao, Yantai, and Dongying had the highest capacity to prevent and mitigate drought disasters among the cities of the entire region. In addition, 76.2% of the area had medium and high integrated drought risk for peanuts in Shandong Province; the overall integrated risk was high.
Peanut drought risk, exposure, vulnerability, disaster prevention and mitigation capacity, and integrated risk in Shandong Province all showed spatial variability, with an inconsistent distribution of these factors across cities. The cities of Liaocheng had a significantly higher risk, poorer disaster prevention and mitigation capacity, and an overall higher integrated risk. The cities of Yantai had a higher risk, exposure, and overall higher integrated risk while Yantai and Weihai had a higher risk, vulnerability, and integrated risk. Dongying City had lower exposure, vulnerability, and integrated risk.

Author Contributions

Writing—original draft preparation, M.J.; resources, X.X.; writing—review and editing, L.Z.; methodology, Y.C. and H.S.; visualization, C.Z.; data curation, N.W. All authors have read and agreed to the published version of the manuscript.

Funding

This research was funded by the National Natural Science Foundation of China (grant No. 41771067) and the Key projects of Natural Science Foundation of Heilongjiang Province of China (grant No. ZD2020D002).

Institutional Review Board Statement

Not applicable.

Informed Consent Statement

Not applicable.

Data Availability Statement

Not applicable.

Conflicts of Interest

The authors declare no conflict of interest.

References

  1. Sarkar, T.; Thankappan, R.; Kumar, A.; Mishra, G.P.; Dobaria, J.R. Stress inducible expression of AtDREB1A transcription factor in transgenic peanut (Arachis hypogaea L.) conferred tolerance to soil-moisture deficit stress. Front. Plant Sci. 2016, 7, 935. [Google Scholar] [CrossRef] [Green Version]
  2. Tang, S.; Yu, S.L.; Liao, B.S.; Zhang, X.Y.; Sun, H.Y. Industry Status Existing Problems and Development Strategy of Peanut in China. J. Peanut Sci. 2010, 39, 3538. (In Chinese) [Google Scholar] [CrossRef]
  3. Subrahmanyam, P.; Reddy, L.J.; Gibbons, R.W.; McDonald, D. Peanut Rust: A Major Threat to Peanut Production in the Semiarid Tropics. Plant Dis. 1985, 69, 813–819. [Google Scholar] [CrossRef]
  4. Miao, H.C.; Li, Q.; Hou, X.F.; Jia, D.H.; Shi, B.X.; Ding, H.; Li, L.M.; Zhang, Z.M. Effects of Drought at Different Growth Stages on Growth and Yield of Peanut. Xinjiang Agric. Sci. 2021, 58, 441–449. (In Chinese) [Google Scholar] [CrossRef]
  5. Wang, X.; Li, Y.; Zhu, H.; Chi, X.Y.; Wu, L.R.; Zhao, L.G.; Wang, J.S.; Yu, S.L. Directional Screening on Peanut Mutant with High Oil Content and Correlation between Oil Content and Leaf Water Potential. J. Qingdao Agric. Univ. 2019, 36, 30–33. (In Chinese) [Google Scholar] [CrossRef]
  6. Jiang, H.F.; Ren, X.P. The Effect on SOD Activity and Protein Content in Groundnut Leaves by Drought Stress. Acta Agron. Sin. 2004, 30, 169–174. (In Chinese) [Google Scholar]
  7. Girdthai, T.; Jogloy, S.; Vorasoot, N.; Akkasaeng, C.; Wongkaew, S.; Holbrook, C.C.; Patanothai, A. Heritability of, and Genotypic Correlations between, Aflatoxin Traits and Physiological Traits for Drought Tolerance under End of Season Drought in Peanut (Arachis hypogaea L.). Field Crops Res. 2010, 118, 169–176. [Google Scholar] [CrossRef]
  8. Jongrungklang, N.; Toomsan, B.; Vorasoot, N.; Jogloy, S.; Boote, K.J.; Hoogenboom, G.; Patanothai, A. Drought Tolerance Mechanisms for Yield Responses to Pre-flowering Drought Stress of Peanut Genotypes with Different Drought Tolerant Levels. Field Crops Res. 2013, 144, 34–42. [Google Scholar] [CrossRef]
  9. Wan, S.B.; Wang, C.B.; Zhu, J.H. Advantages, Problems and Countermeasures of Peanut Industry in Shandong Province. Shandong Agric. Sci. 2004, 5, 5–8. (In Chinese) [Google Scholar] [CrossRef]
  10. Liao, B.S. A Review on Progress and Prospects of Peanut Industry in China. Chin. J. Oil Crop Sci. 2020, 42, 161–166. (In Chinese) [Google Scholar] [CrossRef]
  11. Li, Z.D. Study on the Pricing of Peanut Drought Index Insurance in Shandong Province. Ph.D. Thesis, Guizhou University of Finance and Economics, Guiyang, China, 2016. (In Chinese). [Google Scholar]
  12. Zhang, J.Q.; Liang, J.D.; Zhou, D.W. Risk Assessment of Ecological Disasters in Jilin Province Based on GIS. Chin. J. Appl. Ecol. 2007, 18, 1765–1770. (In Chinese) [Google Scholar] [CrossRef]
  13. Wang, P. Research on Method of Natural Disaster Regionalization Based on Geographical Information System. J. Beijing Norm. Univ. Nat. Sci. 2000, 36, 410–416. (In Chinese) [Google Scholar]
  14. Araya, A.; Stroosnijder, L. Assessing Drought Risk and Irrigation Need in Northern Ethiopia. Agric. For. Meteorol. 2011, 151, 425–436. [Google Scholar] [CrossRef]
  15. Palchaudhuri, M.; Biswas, S. Application of AHP with GIS in Drought Risk Assessment for Puruliya District, India. Nat. Hazards 2016, 84, 1905–1920. [Google Scholar] [CrossRef]
  16. Mohammadhadi, N.; Amir, S. Drought Risk Assessment And Zoning Using The Standardized Precipitation Index (Spi) (Case Study: Karkheh Basin). Desert Ecosyst. Eng. J. 2017, 6, 87–100. [Google Scholar]
  17. Sun, Z.Y.; Zhang, J.Q.; Zhang, Q.; Hu, Y.; Yan, D.H.; Wang, C.Y. Integrated Risk Zoning of Drought and Waterlogging Disasters Based on Fuzzy Comprehensive Evaluation in Anhui Province, China. Nat. Hazards 2014, 71, 1639–1657. [Google Scholar] [CrossRef]
  18. Luo, D.; Ye, L.; Zhai, Y.; Zhu, H.Y.; Qian, Q.C. Hazard Assessment of Drought Disaster Using a Grey Projection Incidence Model for the Heterogeneous Panel Data. Grey Syst. Theory Appl. 2018, 8, 509–526. [Google Scholar] [CrossRef]
  19. Wei, S.C.; Li, K.W.; Zhang, J.Q.; Yang, Y.T.; Liu, C.; Wang, C.Y. Hazard Assessment of Peanut Drought and Flood Disasters in Huang-Huai-Hai Region. J. Appl. Meteorol. Sci. 2021, 32, 629–640. (In Chinese) [Google Scholar] [CrossRef]
  20. Celikkol Akcay, U.; Ercan, O.; Kavas, M.; Yildiz, L.; Yilmaz, C.; Oktem, H.A.; Yucel, M. Drought-induced Oxidative Damage and Antioxidant Responses in Peanut (Arachis hypogaea L.) Seedlings. Plant Growth Regul. 2010, 61, 21–28. [Google Scholar] [CrossRef]
  21. Jiang, C.J.; Li, X.L.; Zou, J.X.; Ren, J.Y.; Jin, C.Y.; Zhang, H.; Yu, H.Q.; Jin, H. Comparative Transcriptome Analysis of Genes Involved in the Drought Stress Response of Two Peanut (Arachis hypogaea L.) Varieties. BMC Plant Biol. 2021, 21, 64. [Google Scholar] [CrossRef] [PubMed]
  22. Zhang, K.; Liu, Y.; Luo, L.; Zhang, X.; Li, G.; Wan, Y.; Liu, F. Root Traits of Peanut Cultivars with Different Drought Resistant under Drought Stress at Flowering and Pegging Phase. Acta Agric. Scand. Sect. B Soil Plant Sci. 2021, 71, 363–376. [Google Scholar] [CrossRef]
  23. Beynon, M. An Analysis of Distrbutions of Priority Values from Altemative Comparison Scales within AHP. Eur. J. Oper. Res. 2002, 140, 104–117. [Google Scholar] [CrossRef]
  24. Gu, Y.C.; Yu, L.W.; Dai, Q. Overview of Drought Classification and Common Calculation Methods. Northeast Water Power 2011, 29, 37–39. (In Chinese) [Google Scholar] [CrossRef]
  25. Zhao, M.; Huang, S.; Huang, Q.; Wang, H.; Leng, G.; Xie, Y. Assessing Socio-economic Drought Evolution Characteristics and Their Possible Meteorological Driving Force. Geomat. Nat. Hazards Risk 2019, 10, 1084–1101. [Google Scholar] [CrossRef] [Green Version]
  26. Keyantash, J.; Dracup, J.A. The Quantification of Drought: An Evaluation of Drought Indices. Bull. Am. Meteorol. Soc. 2002, 83, 1167–1180. [Google Scholar] [CrossRef]
Figure 1. Administrative division of Shandong Province, China.
Sustainability 14 03322 g001
Figure 2. Hierarchical model for peanut drought risk assessment.
Sustainability 14 03322 g002
Figure 3. Spatial distribution of the frequency of different drought levels for peanuts in Shandong Province during the whole reproductive period: (a) frequency of light drought; (b) frequency of moderate drought; (c) frequency of severe drought; and (d) frequency of exceptional drought.
Sustainability 14 03322 g003aSustainability 14 03322 g003b
Figure 4. Spatial distribution of peanut drought meteorological factor risk in Shandong Province.
Sustainability 14 03322 g004
Figure 5. Spatial distribution of elevation (a), slope (b), river network density (c), land use type (d), and soil texture (e) in Shandong Province.
Sustainability 14 03322 g005aSustainability 14 03322 g005b
Figure 6. Spatial distribution of environmental sensitivity of peanut drought pregnancy in Shandong Province.
Sustainability 14 03322 g006
Figure 7. Spatial distribution of peanut drought risk in Shandong Province.
Sustainability 14 03322 g007
Figure 8. Spatial distribution of exposure of peanut-drought-bearing bodies in Shandong Province.
Sustainability 14 03322 g008
Figure 9. Spatial distribution of vulnerability of peanut-drought-bearing bodies in Shandong Province.
Sustainability 14 03322 g009
Figure 10. Spatial distribution of peanut drought prevention and mitigation capacity in Shandong Province.
Sustainability 14 03322 g010
Figure 11. Spatial distribution of peanut drought comprehensive risk index zoning result in Shandong Province.
Sustainability 14 03322 g011
Figure 12. Spatial distribution of peanut drought meteorological factors risk in Shandong Province: (a) Kriging interpolation method; (b) inverse distance weight interpolation method; (c) spline function method; and (d) trend surface analysis method.
Sustainability 14 03322 g012
Figure 13. Spatial distribution of peanut yields per unit in Yantai and Weihai (a); spatial distribution of comprehensive peanut drought risk in Yantai and Weihai (b).
Sustainability 14 03322 g013
Table 1. Scale of AHP analysis method.
Scale bijDefinition
1The i factor is as important as the j factor.
3The i factor is slightly more important than the j factor.
5The i factor is more important than the j factor.
7The i factor is much more important than the j factor.
9The i factor is absolutely more important than the j factor.
2, 4, 6, 8Between the noted levels.
Table 2. Numerical values of random consistency index RI.
M1234567891011
RI0.000.000.580.901.121.241.321.411.451.491.51
Table 3. Judgment matrix and weights of various perceptual factors.
IIIIIIIVVWeight (W)Matrix Product (AW)AW/WλmaxCICR
I122330.3681.8515.035.0130.0090.003
II1/211220.2061.0355.02 λ = ( A W / W ) / n
CI = (λn)/n − 1
RI = 1.12
CR = CI/RI
III1/211220.2061.0355.02
IV1/31/21/2110.1090.5485.03
V1/31/21/2110.1090.5485.03
25.13
Note: In the table: I. river network density, II. slope, III. elevation, IV. land use type, and V. soil texture.
Table 4. The precipitation anomaly percentage drought classification table (based on meteorological drought rating criteria).
LevelTypesThe Precipitation Anomaly Percentage Pa (%)
Monthly ScaleQuarterly ScaleAnnual Scale
1Drought-free−40 < Pa−25 < Pa−15 < Pa
2Light drought−60 < Pa ≤ −40−50 < Pa ≤ −25−30 < Pa ≤ −15
3Moderate drought−80 < Pa ≤ −60−70 < Pa ≤ −50−40 < Pa ≤ −30
4Severe drought−95 < Pa ≤ −80−80 < Pa ≤ −70−45 < Pa ≤ −40
5Exceptional drought Pa ≤ −95Pa ≤ −80Pa ≤ −45
Table 5. Land use type scores.
Land Use TypeArable landWoodlandGrasslandWatersConstruction LandUnused Land
Score423156
Table 6. Soil texture composite score.
Soil TextureOverall ScoreSoil TextureOverall Score
Clay1Clay loam2
Chalky loam5Loam4
Sandy clay loam3Sandy loam6
Loamy sand6Sand7
Table 7. Low-, medium-, and high-risk areas in Shandong Province by city.
Low-Risk AreaMedium-Risk AreaHigh-Risk Area
Area (km2)Ratio (%)Area (km2)Ratio (%)Area (km2)Ratio (%)
Binzhou5098.253.14498.646.900
Dezhou3104.129.36953.865.6541.15.1
Dongying7082.698.1135.81.90.00.0
Heze1178.39.710,921.390.118.30.2
Jinan10,330.098.9110.31.10.00.0
Jining5342.947.65862.852.216.30.1
Liaocheng 18.30.23003.934.35737.365.5
Linyi 13.10.110,004.158.27173.141.7
Qingdao 1.00.011,068.998.9121.71.1
Rizhao 9.10.21940.836.33392.663.5
Taian 147.61.97484.395.4214.42.7
Weihai 0.00.00.00.05714.6100.0
Weifang 887.05.515,168.694.412.20.1
Yantai 0.00.015.30.113,961.399.9
Zaozhuang 3345.673.81175.726.09.10.2
Zibo 1076.917.75005.882.33.00.0
Publisher’s Note: MDPI stays neutral with regard to jurisdictional claims in published maps and institutional affiliations.

