
Chart Datum-to-Ellipsoid Separation Model Development for Obhur Creek Using Multibeam Hydrographic Surveying


1
Civil and Architectural Engineering Department, Sultan Qaboos University, Muscat 123, Oman
2
Public Works Engineering Department, Mansoura University, Mansoura 35516, Egypt
3
Hydrographic Surveying Department, King Abdulaziz University, Jeddah 21589, Saudi Arabia
*
Author to whom correspondence should be addressed.
J. Mar. Sci. Eng. 2022, 10(2), 264; https://doi.org/10.3390/jmse10020264
Submission received: 19 December 2021
/
Revised: 3 February 2022
/
Accepted: 10 February 2022
/
Published: 15 February 2022
(This article belongs to the Section Physical Oceanography)
Abstract
:A traditional shore-based discrete point chart datum (CD) that represents the lowest astronomical tide (LAT) in Saudi Arabia using tide gauge data is utilized to reduce the observed depth collected from hydrographic surveying test to CD-referenced depth for producing navigation charts for maritime navigation applications. A need for developing CD in a continuous form is essential to replace the traditional discrete CD using tide gauge data. The importance of the development of CD-to-ellipsoid (WGS84) separation model is that it can be utilized by the hydrographers to develop an accurate vertical control for hydrographic surveys applications and can be utilized by the mariners to produce accurate dynamic electronic navigation charts (ENCs). In this paper, a continuous CD to WGS84 ellipsoid separation model for the Sharm Obhur area is developed using a multibeam hydrographic surveying test. It is shown that the continuous chart datum ranges from −4.920 m to −4.766 m and can be achieved with standard deviation ranges from 0.1 cm to 2.3 cm. To validate the separation model, a comparison was made with the gravimetric/oceanographic method based on the separation height developed from geoid height, the sea surface topography and LAT value (chart datum to mean sea level) at the tide gauge located in the study area. The comparison showed that the average value of the developed continuous CD to WGS84 separation model heights using multibeam hydrographic surveying agrees with the separation height estimated from gravimetric/oceanographic method.
1. Introduction
A local tide-based CD is essential in marine engineering applications, and it is produced for the safety of maritime navigation [1]. Traditionally, tide gauge and sounding datasets are used to produce the CD through hydrographic surveying [1,2]. The height separation between tidal datums and datum references, through period observed soundings, are used in hydrographic surveying to determine the vertical control, which is used to reduce seafloor depth to estimate the CD [3]. Although the accuracy of hydrographic surveying in CD estimation is high, this processing makes it difficult to estimate the CD in real time, and the bathymetric surfacing algorithm have difficulty dealing with period sound observations [1,4].
Furthermore, today, Global Navigation Satellite System (GNSS) is commonly used in geoid modeling, ocean tide modeling, hydraulic datums and many maritime applications [3,4,5]. Thus, the integration of tidal and GNSS measurements is the most appropriate solution for a continuous and accurate hydrographic datum [3,4,6]. The requirements for generating continuous hydrographic datum through CD transformation are proposed in Iliffe et al. [7] and Eldiasty et al. [3] to conduct efficient hydrographic surveys by transforming the GNSS ellipsoid and to CD in real-time mode without observing tidal data. Therefore, a three-stage process is required [7]: In the first, it is essential to find the position of the mean sea surface (MSS) with respect to the ellipsoid. In this, level of a tidal surface can be found below or above the equilibrium tide. These, then, are used to estimate the position of the tidal surface with respect to the ellipsoid. Finally, the interpolation with respect to the appropriate tidal level is applied to generate the CD. It should be noted that the development of accurate CD is required for precision hydrographic surveying applications in real-time mode where CD accuracy contributes to a significant portion of the International Hydrographic Organization (IHO) total vertical uncertainty for special order (shallow water) surveys, which is about 25 cm at 95% confidence level [8]. Therefore, the target for developing continuous chart datum is to achieve accuracy within a decimeter level (±10 cm) to fulfill the IHO requirements.
Meanwhile, the theory of the CD-to-ellipsoid concept is presented in Abd-Rahman and Din [4]. A continuous CD is a relative two-dimensional reference to vertical reference datum, such as LAT in Saudi Arabia or the reference ellipsoid, WGS84. The estimation continuous hydrographic datum is proposed in different areas. For instance, the Saudi continuous chart datum in the Arabian Gulf area was developed by Eldiasty et al. [3]. The accuracy of the developed Saudi continuous chart datum ranges from 11 cm to 16 cm (1σ). A datum for Canadian waters (inland, coastal and offshore areas), so called Canadian Hydrographic Service (CHS’s CCVD datum), was developed by Jeffries et al. [9] and Robin et al. [10,11,12]. The accuracy of the CCVD datum is about ±10 cm (1σ). The United Kingdom Hydrographic Office (UKHO) Vertical Offshore Reference Frames (VORF) datum was provided for coastal and offshore areas by Iliffe et al. [7]. The accuracy of the VORF datum is about ±10 cm inshore and ±15 cm offshore (both 1σ). The National Oceanic and Atmospheric Administration (NOAA) Vertical Datum (VDatum) was demonstrated by Gesch and Wilson [13]. The accuracy of the VDatum datum ranges between ±4 cm and ±12 cm (1σ). The Service Hydrographique et Oceanographique de la Marine (SHOM) BATHYELLI datum was estimated by Pineau-Guillou and Dorst [14]. The accuracy of the BATHYELLI datum is about ±10 cm (1σ). The Australian Hydrographic Service (AHS) AusCoastVDT datum was illustrated by Keysers et al. [15]. The accuracy of the final adjusted AusCoastVDT datum is about ±3 cm (1σ). The Dutch and Belgium vertical reference datum (NEVREF) was investigated by Slobbe et al. [16]. The accuracy of the NEVREF datum is about ±10 cm (1σ).
However, all these abovementioned national chart datum separation models were developed using the hydrodynamic ocean model. This research aims to generate a new and accurate continuous hydrographic datum for the Sharm Obhur area through the CD-to-ellipsoid separation model estimation with a few centimeters’ accuracy. In addition, a CD separation model is developed using multibeam hydrographic surveying test in the study area that fits the area where the hydrodynamic ocean models are not usually available for these inland water areas. In summary, the accuracy for the majority of the developed continuous chart datums ranges between ±3 cm and ±15 cm (1σ).
The objective of this paper is to develop a continuous chart datum-to-ellipsoid (WGS84) separation model for the Sharm Obhur study area using a multibeam hydrographic surveying test. To meet the paper objective, the multibeam hydrographic surveying test from EM712 multibeam system along with GNSS and Inertial Navigation System (INS) integrated navigation solution (GNSS/INS) from POS–MV system and tide gauge data are processed in CARIS HIPS and SIPS software to provide CD to WGS84 separation model and associated accuracy represented by associated standard deviation values. To validate the separation model, a comparison was made with the gravimetric/oceanographic method based on the height developed from geoid height, the sea surface topography and chart datum to mean sea level value that represents the LAT in Saudi Arabia at the tide gauge located in the study area.
This research paper’s organizational structure is divided into six main sections. The first section (this section) provides the literature reviews and the objective of this research. The second section explains the separation model development using the proposed multibeam hydrographic surveying approach and the validation using the gravimetric/oceanographic method. Section 3 presents the methodology for developing the separation model under investigation. The fourth section describes the study area and all collected data using multibeam surveying system along with all required ancillary data for hydrographic data postprocessing. Section 5 shows, analyses and discusses the developed separation model and accuracy. Finally, Section 6 concludes the findings and importance of developing a separation model using the multibeam hydrographic surveying method.
2. Chart Datum-to-Ellipsoid Separation Model Development
In this paper, the separation model is developed using the multibeam hydrographic surveying method and is validated using gravimetric/oceanographic method. The following subsections describe the multibeam hydrographic surveying and the gravimetric/oceanographic methods.
2.1. Separation Model Development Using Multibeam Hydrographic Surveying
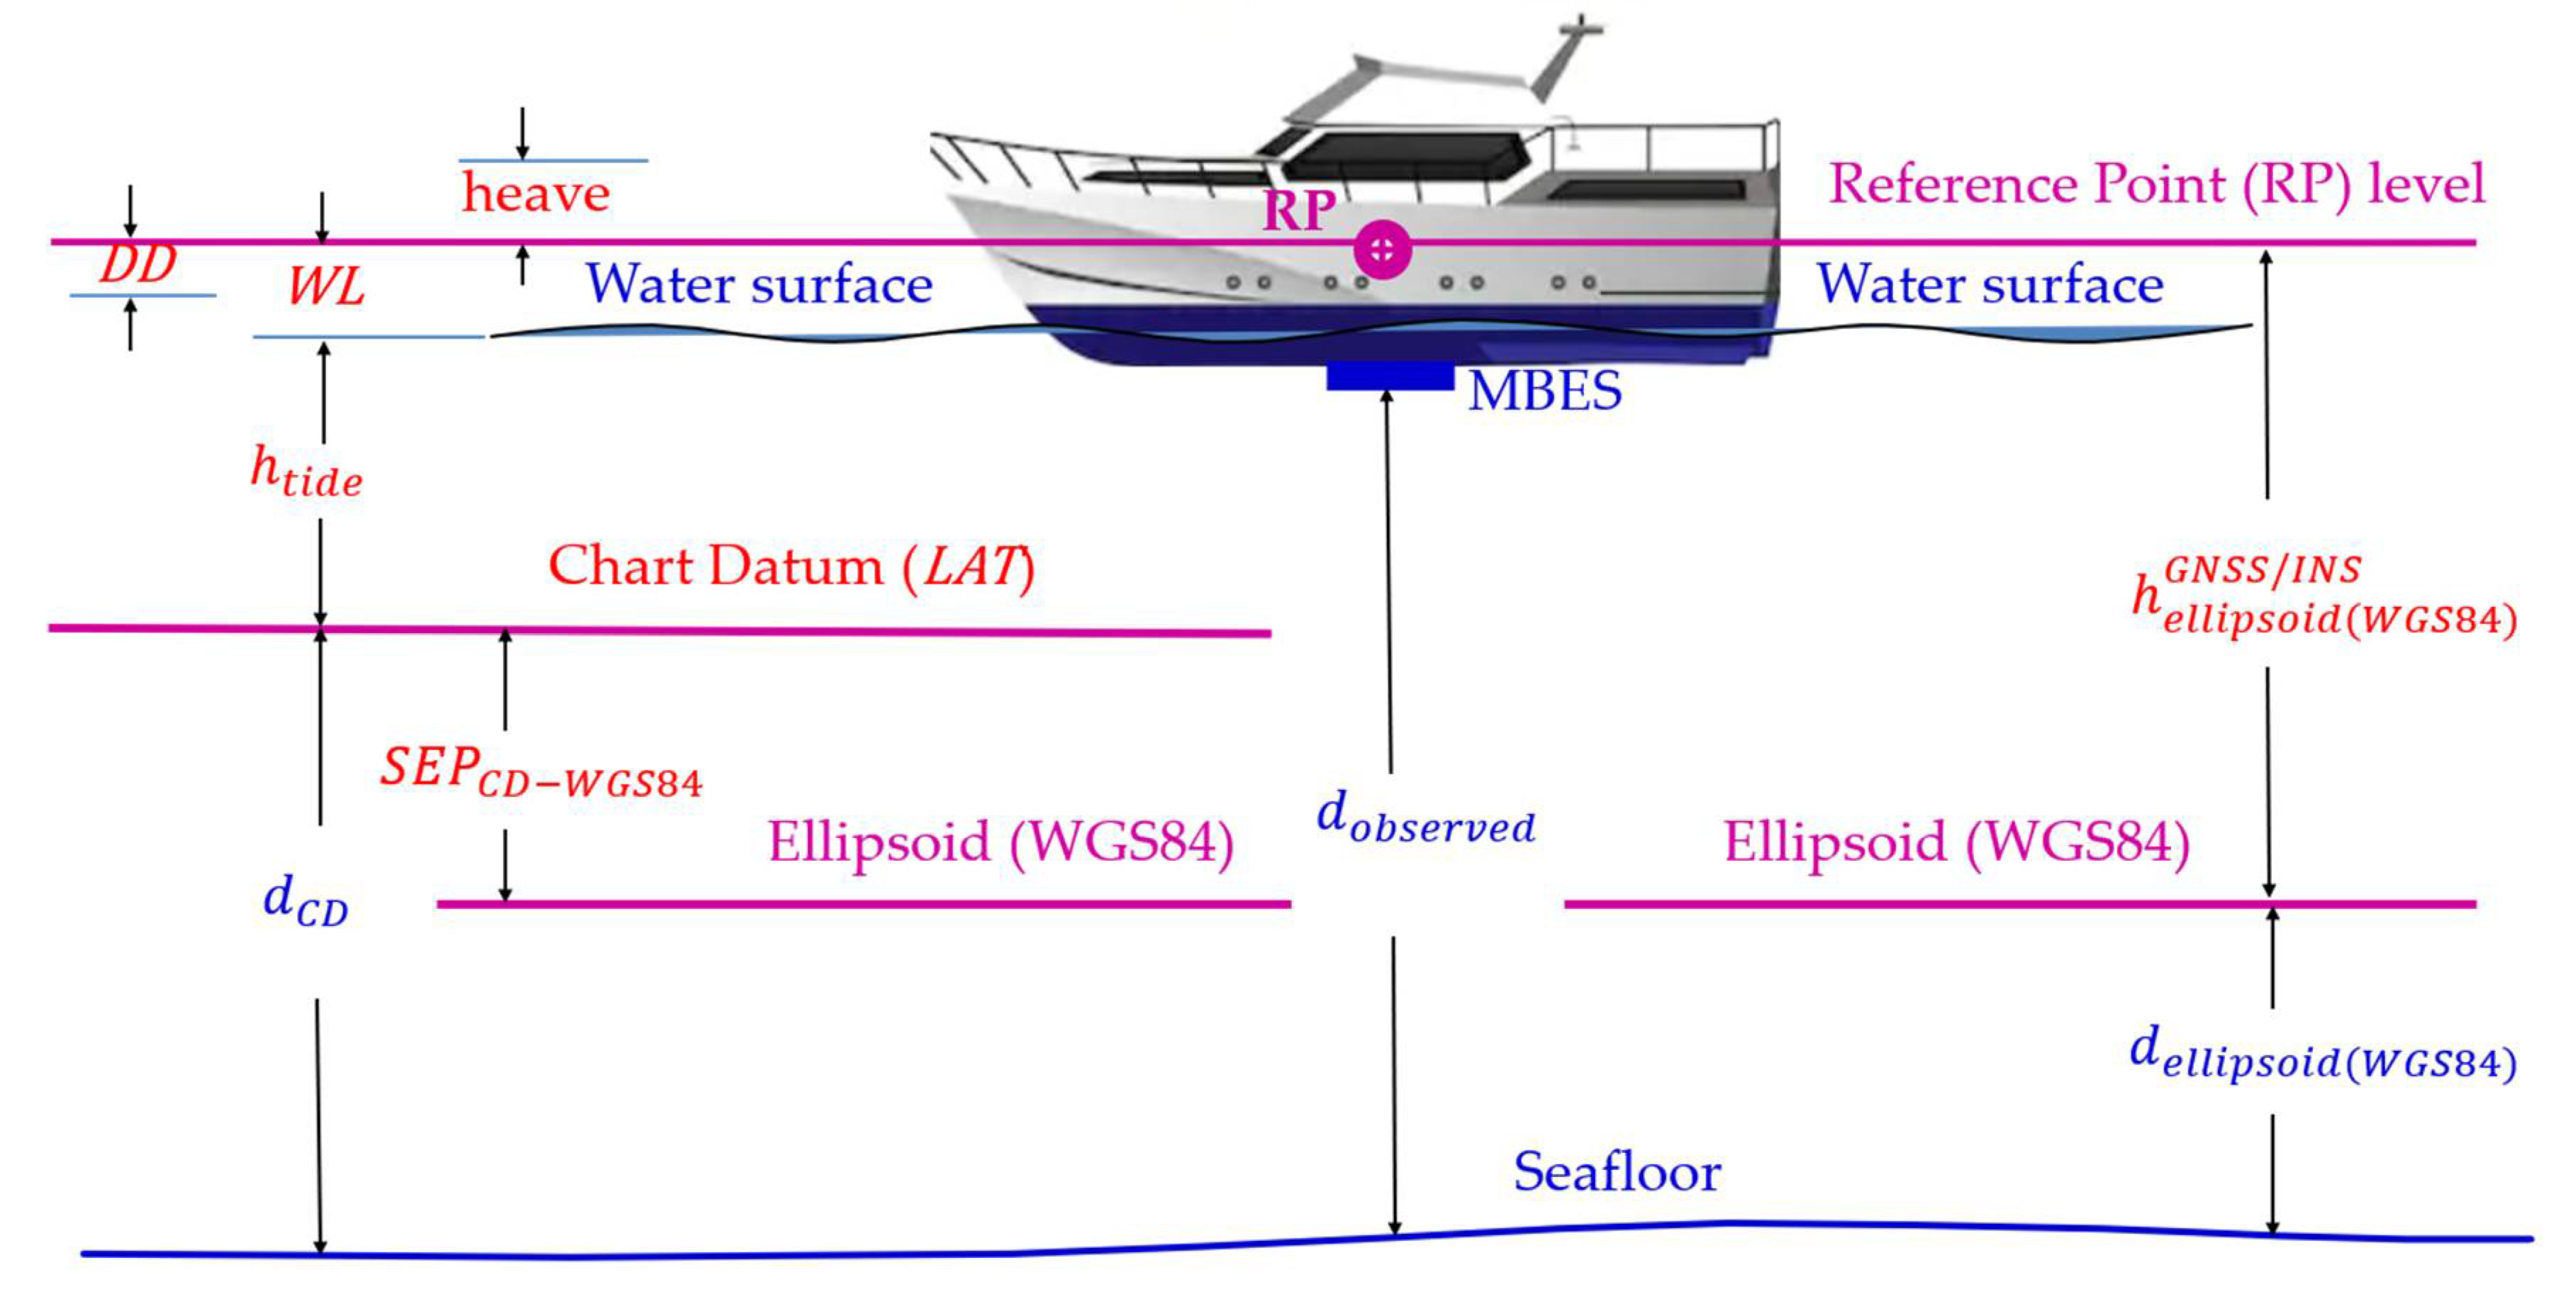
The CD-to-ellipsoid separation height model can be estimated using a multibeam hydrographic surveying vessel equipped with a GNSS/INS-integrated system. The high-accuracy GNSS/INS-integrated system is required to develop an accurate CD-to-ellipsoid separation model with few centimeters’ level of accuracy that is essential to reduce the ellipsoidally referenced observed depth to chart datum referenced depth using the accurate separation model that fulfills the IHO standards’ requirements. Figure 1 shows the schematic plot representing how the separation model can be estimated from ellipsoid height using the chart datum to mean sea level height (from tide gauge), heave, dynamic draft and waterline height [1,17]. The septation model height, , at multibeam nodes, can be estimated as follows:
where is the separation model height from CD-to-ellipsoid (WGS84), is the ellipsoidal height estimated from GNSS/INS integrated navigation system transformed to the reference point (RP) of the survey vessel, is the tide height records referenced to CD, is the heave value estimated from the INS system, is the dynamic draft value of the vessel that is dependent on the vessel speed and is waterline height from the reference point to the water surface.
In this paper, the CD to WGS84 ellipsoid separation model height along with the associated standard deviation are estimated at all multibeam nodes using CARIS HIPS and SIPS from the multibeam hydrographic surveying test associated with the tide gauge data collected in the Sharm Obour study area. Then, the comparison is made between the developed model using the hydrographic surveying test and the independent separation height estimated in the study area using the gravimetric/oceanographic method [18,19,20].
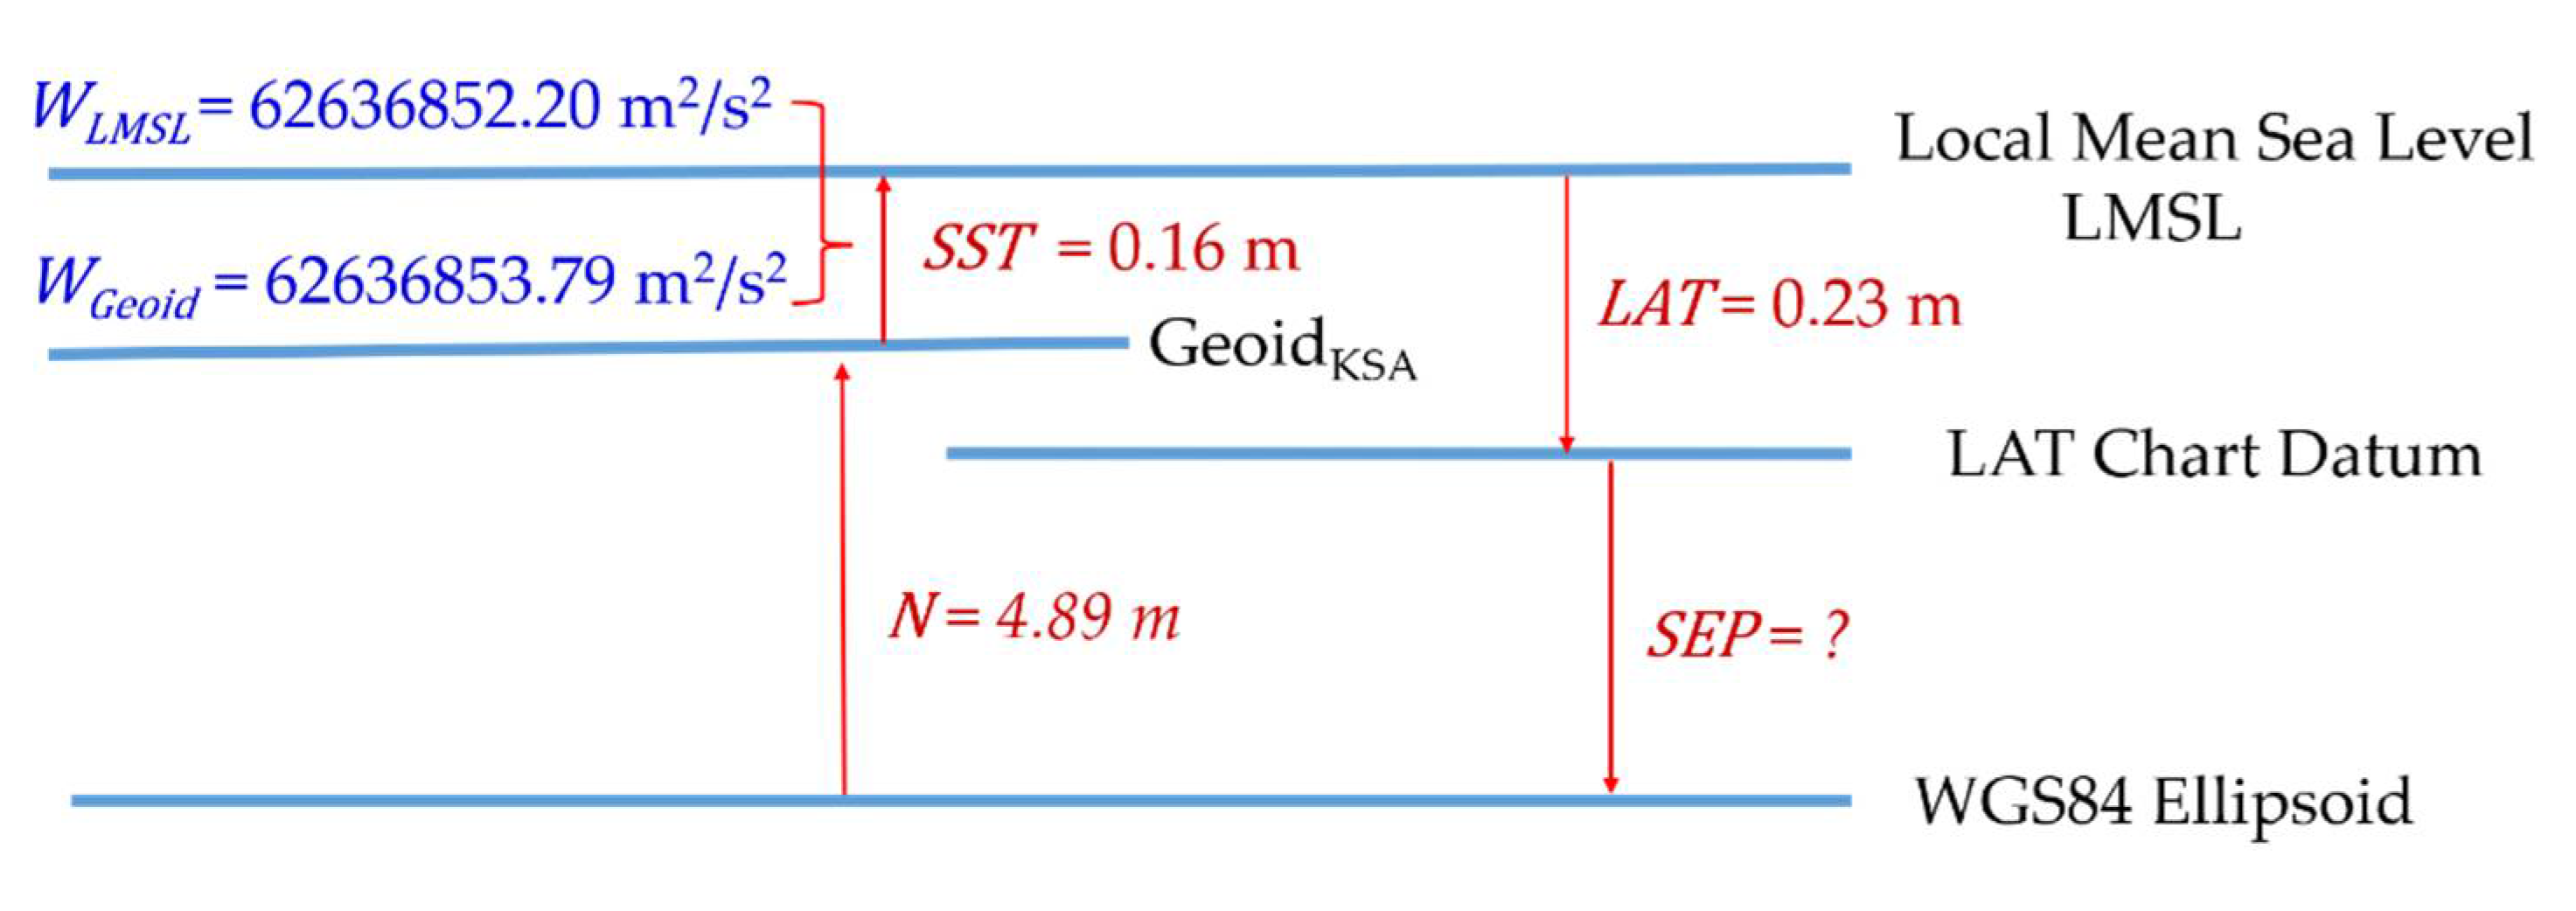
2.2. Separation Model Development Using Gravimetric/Oceanographic Method
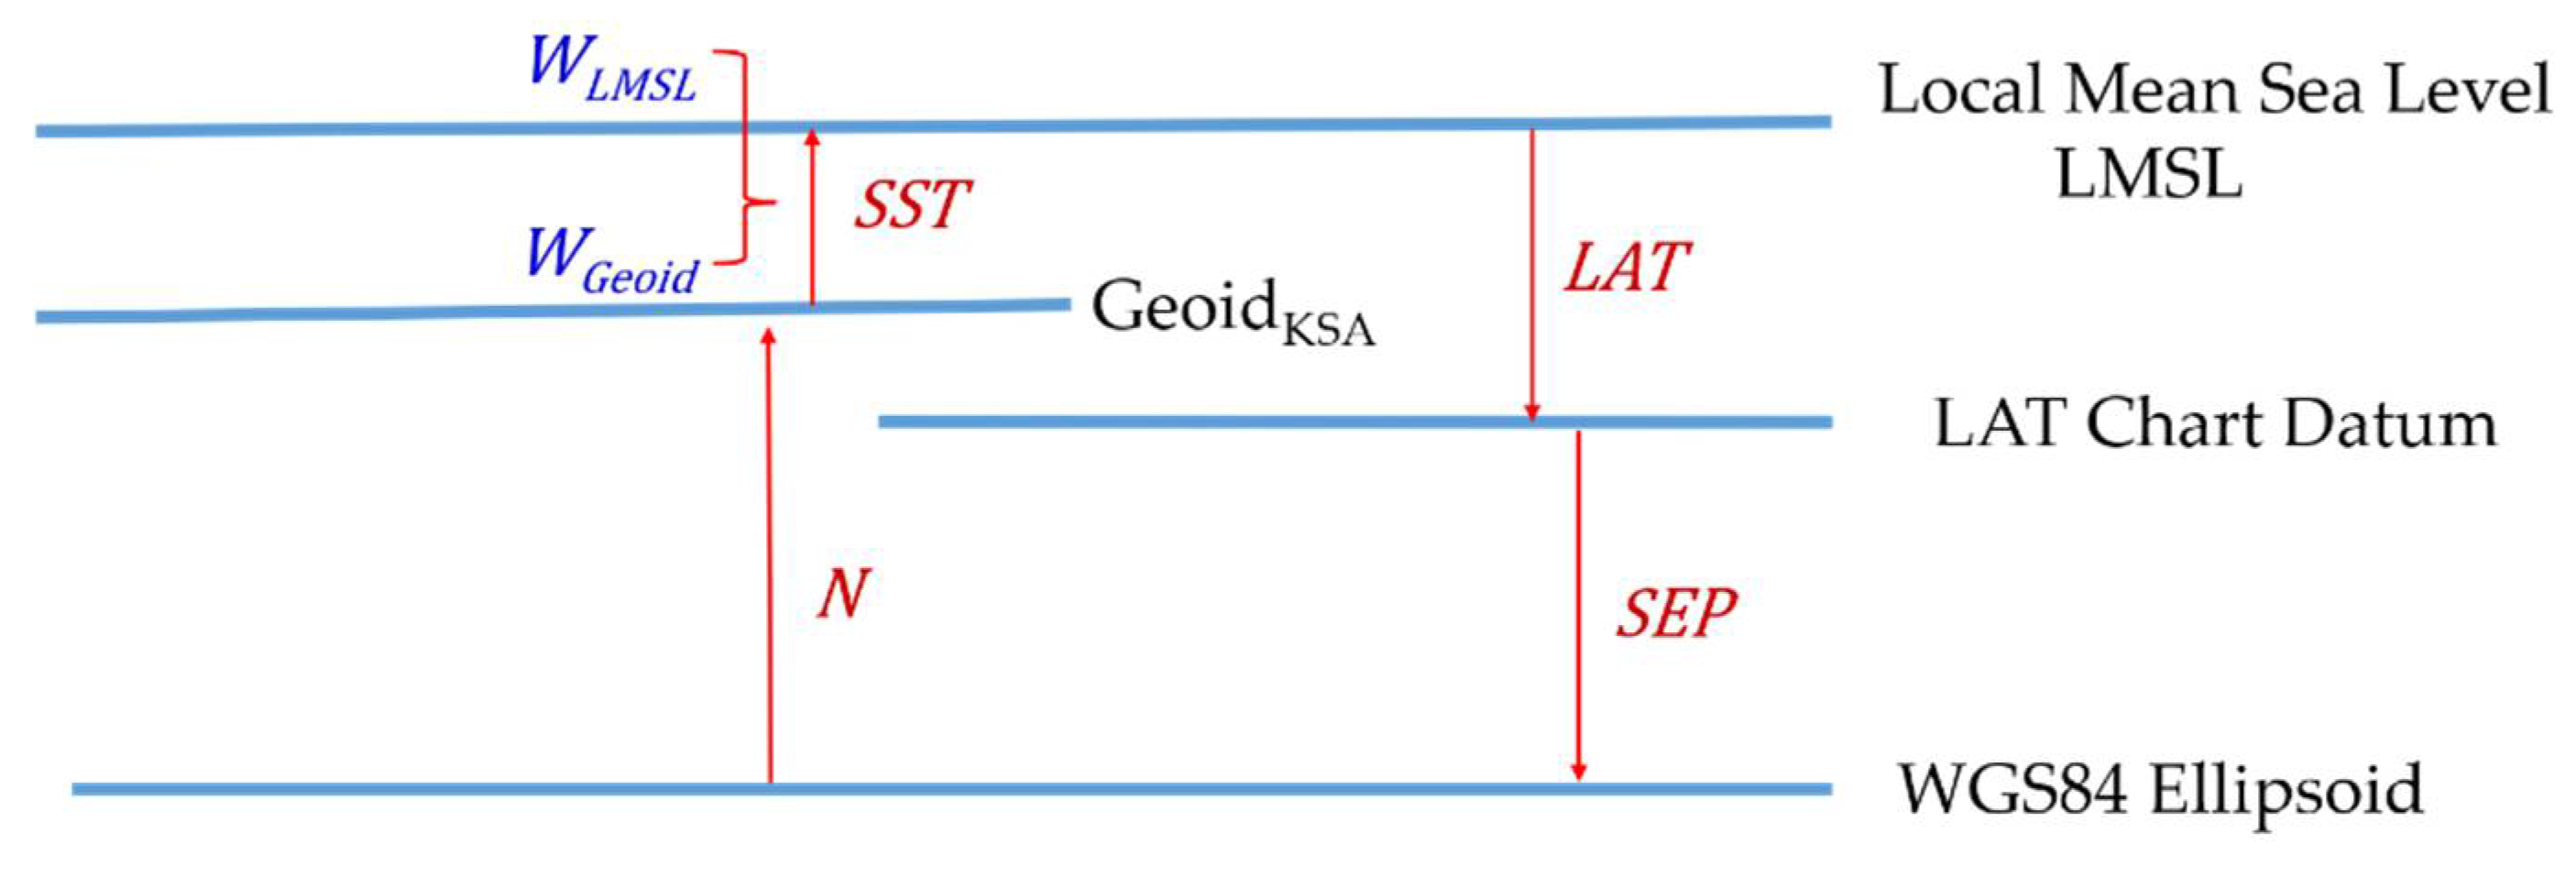
The estimated separation model from the hydrographic surveying test can be validated with the gravimetric/oceanographic method, as shown in Figure 2. The following equation can be used to estimate the separation value at specific point , as shown in Figure 2, with known geoid value and oceanographic values as follows [1,2]:
where is the geoid height (undulation), is the sea surface topography and is the LAT value at the tide gauge. The sea surface topography value between two equipotential levels at a point i can be calculated as [21]:
where is the geopotential number, is the gravity value at the point and is the observed (leveled) height of the point i. The geopotential number between two equipotential levels at a point can be calculated as:
where is the geopotential value of equipotential level at local mean sea level (LMSL) and is the geopotential value of equipotential level at the Kingdom of Saudi Arabia (KSA) geoid level.
3. Methodology
The methodology is shown in Figure 3. To develop the separation model for Sharm Obhur, multibeam data were collected using EM712 at (40–100) kHz. The hydrographic surveying data along with tide data and GNSS tide data were georeferenced using Post-Processed Kinematic (PPK) GNSS/INS-integrated navigation solution. Then, the georeferenced hydrographic surveying with tide data and GNSS-tide based on real-time heave solution and delayed heave solution were employed to develop two chart datum-to-ellipsoid separation models and associated standard deviation values that identify the quality of the developed separation models implemented in this paper. To validate the separation model, a comparison was made with the gravimetric/oceanographic method based on the height developed from geoid height, the sea surface topography and LAT value at the tide gauge located in the study area.
4. Study Area and Data Acquisition
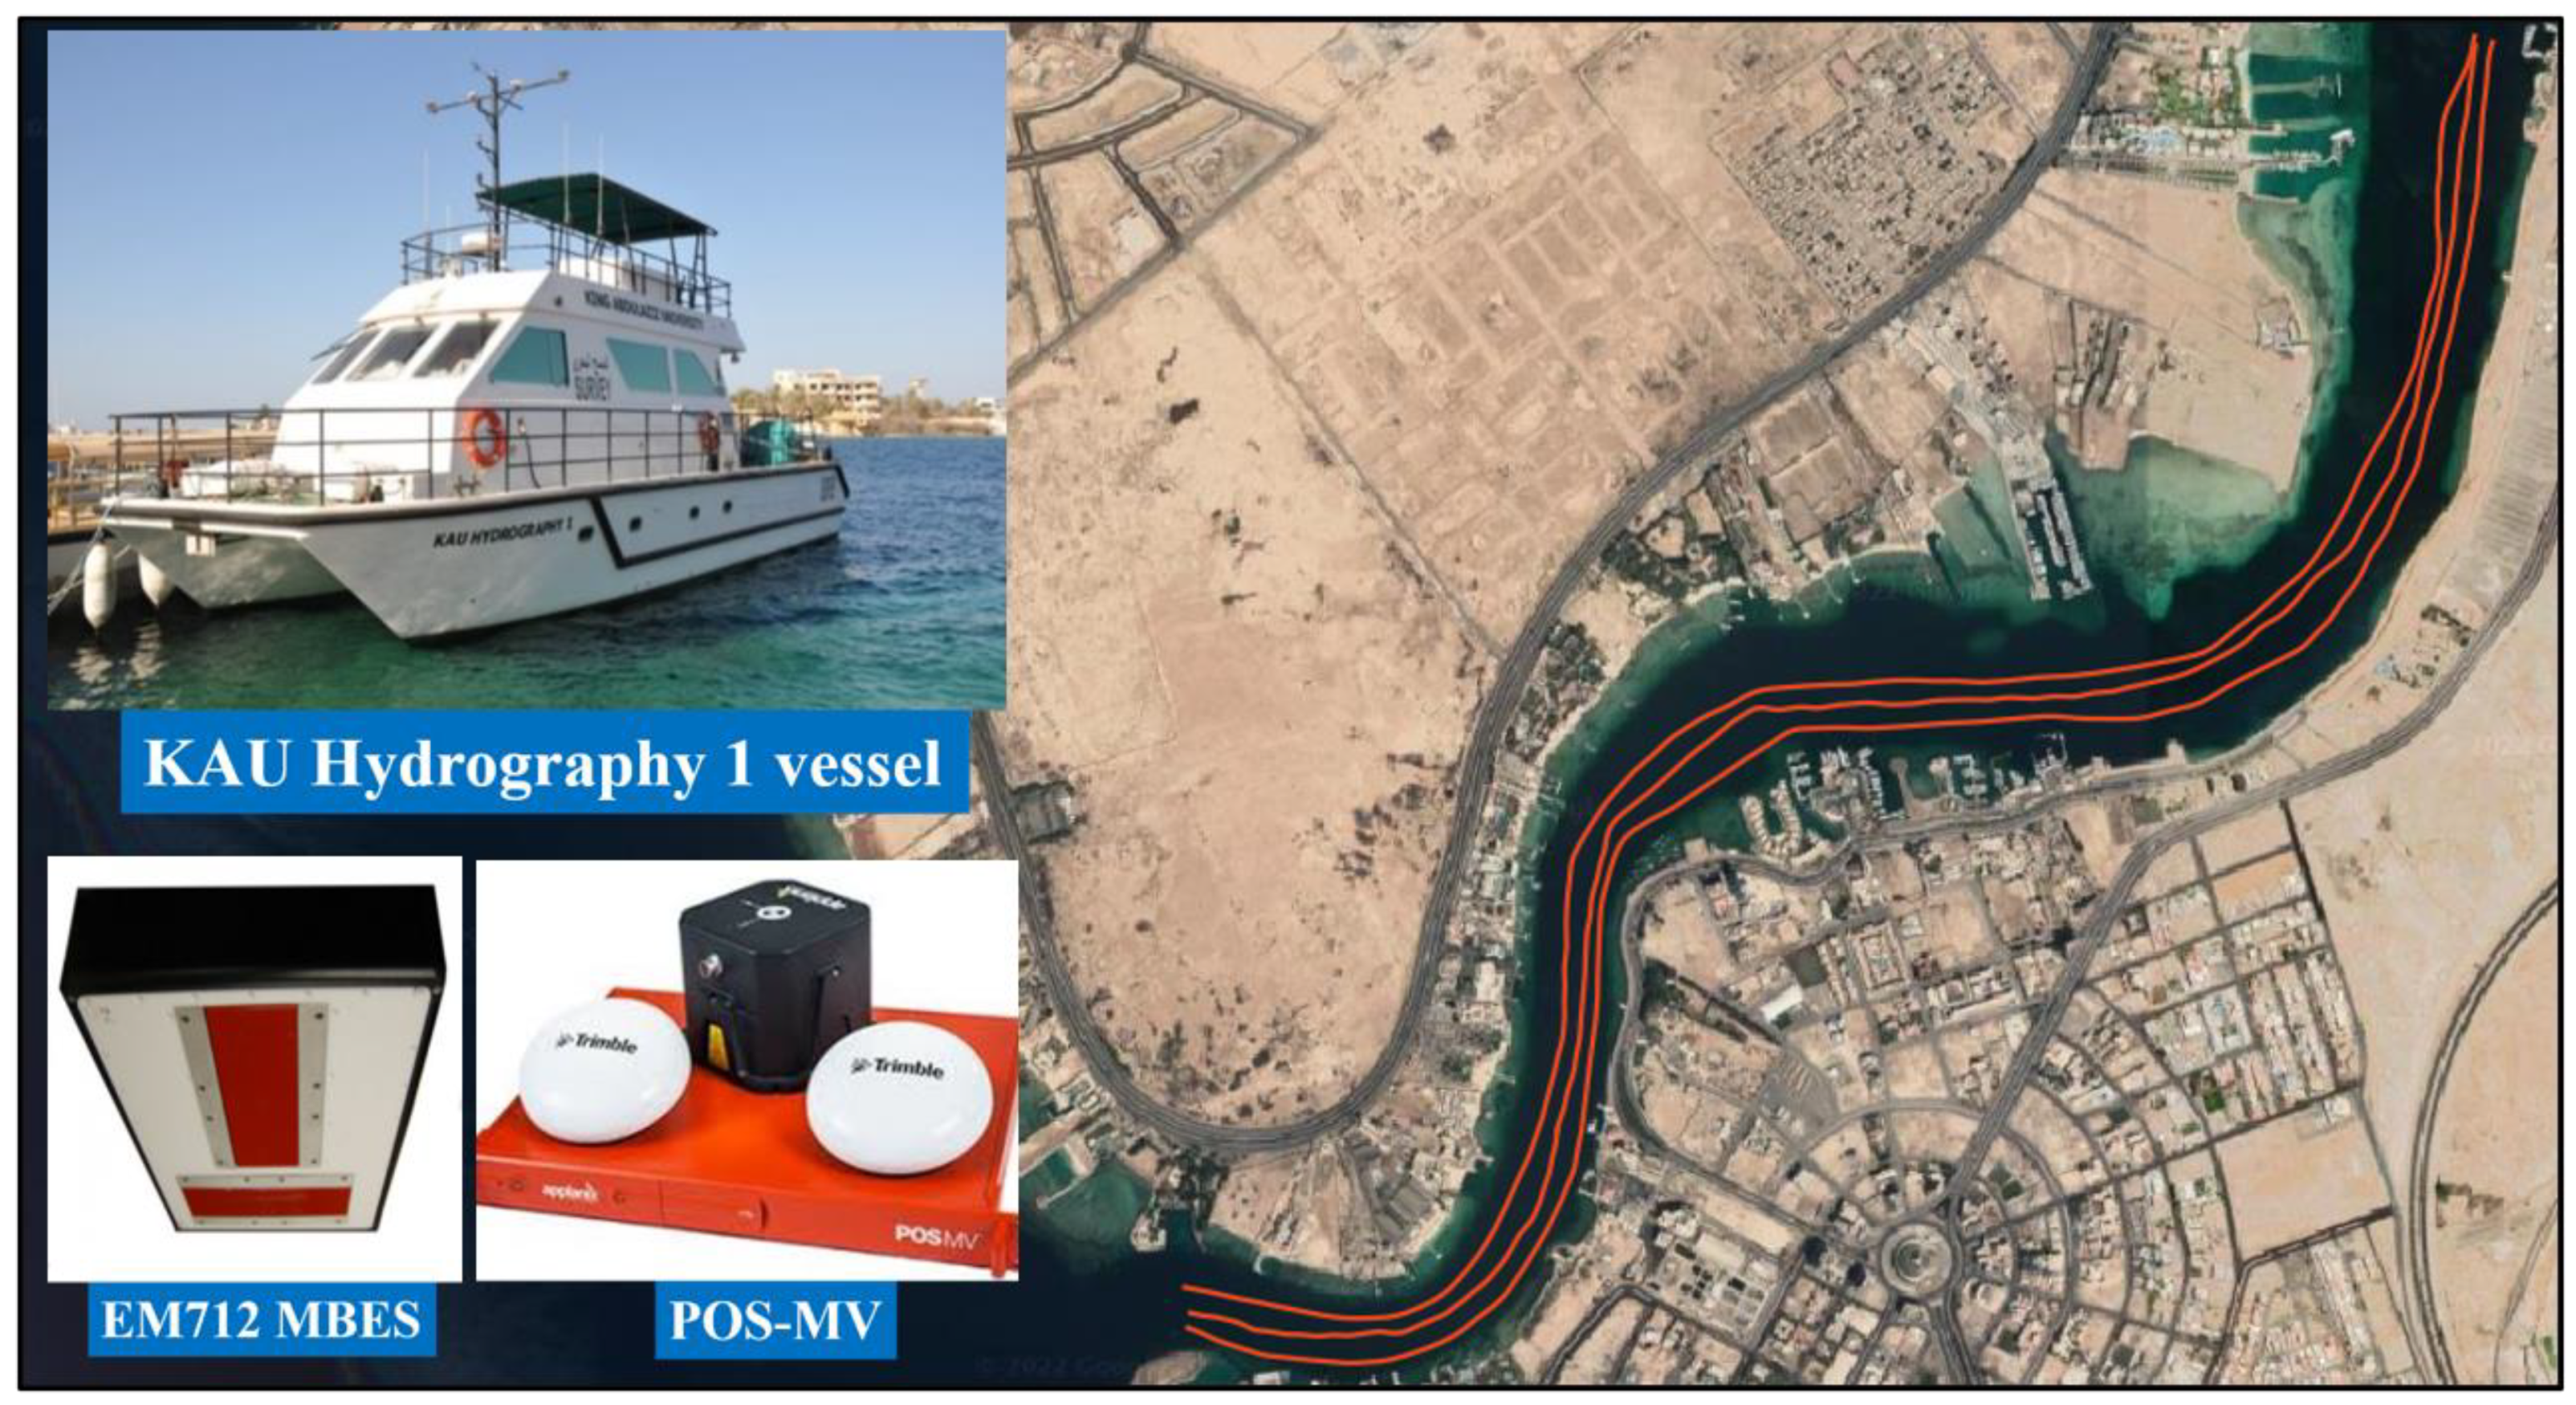
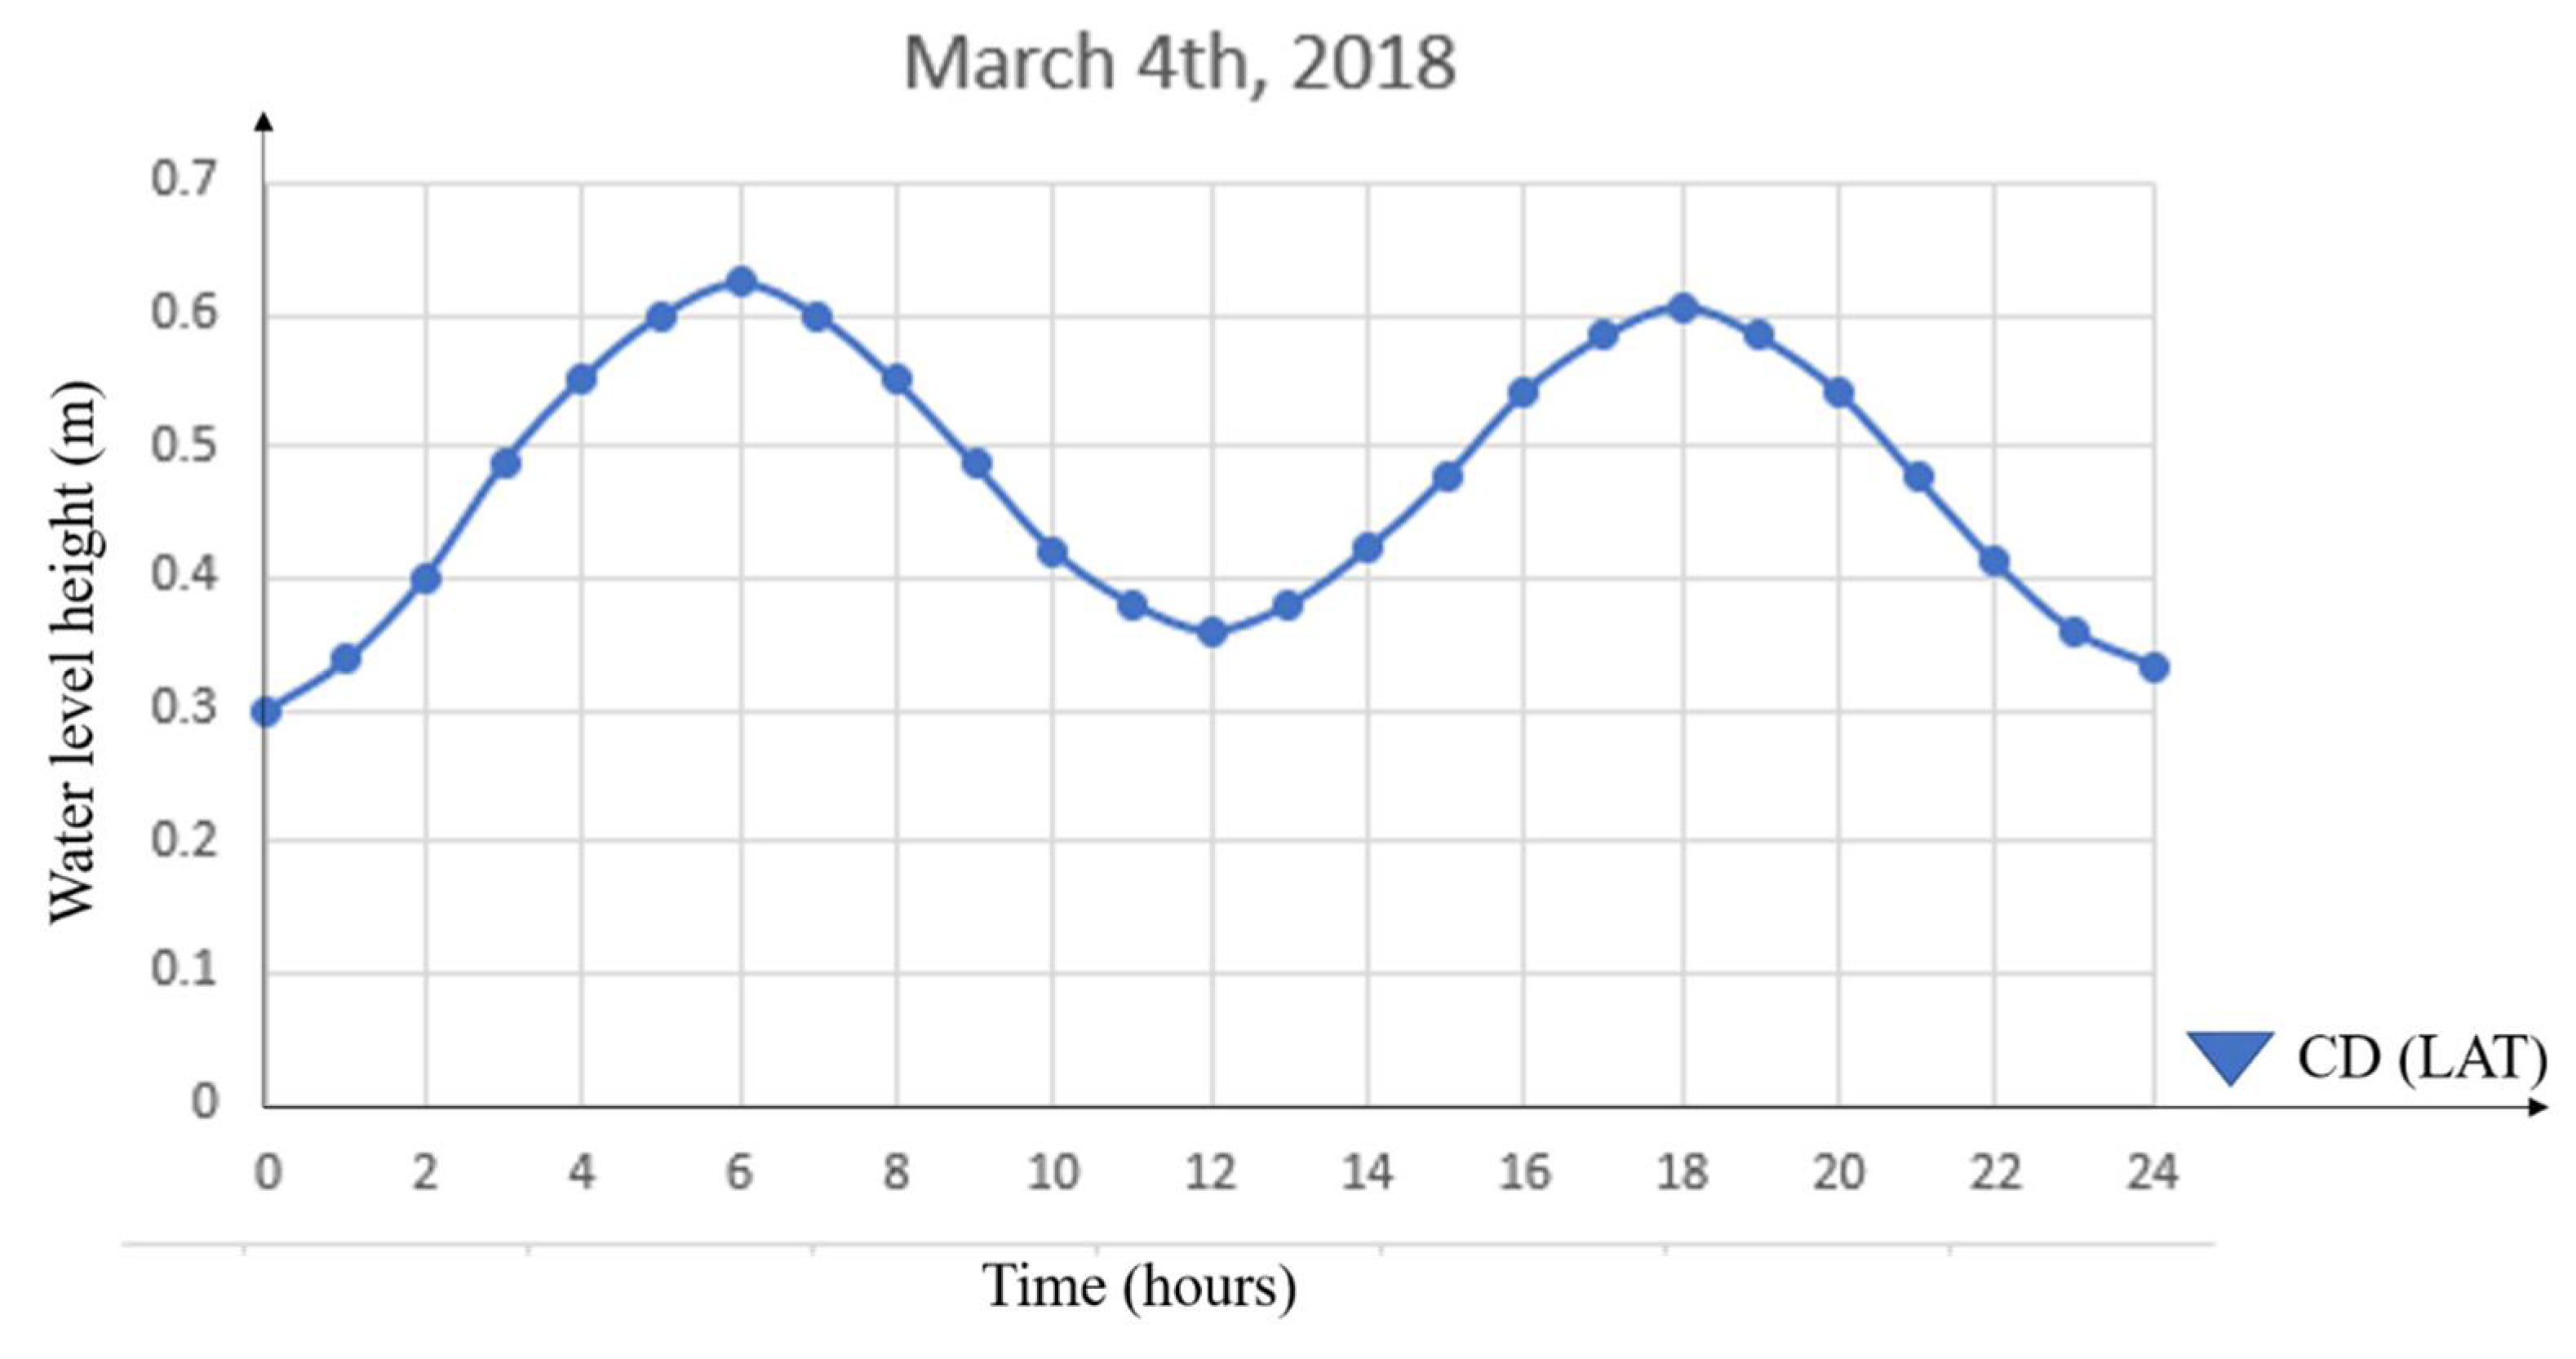
To develop separation model, the navigation measurements were collected from POS–MV system, and the multibeam data measurements were collected from EM712 Multibeam Echosounder System (MBES) on March 4th, 2018, in Sharm Creek, Jeddah, in Saudi Arabia on board a hydrographic surveying vessel called “KAU Hydrography 1” owned by the Department of Hydrographic Surveying, Faculty of Maritime Studies of King Abdulaziz University. Figure 4 shows the test survey track lines in the Sharm Obhur. The tide gauge data were extracted from the Aramco tide data table for the Jeddah tide gauge stations. The real-time heave and true (delayed) heave were obtained from the POS–MV system. The PPK GNSS/INS integration navigation data were obtained from POSPac software. The list of collected data are provided in Appendix A.
5. Results and Discussion
To develop an accurate separation mode, an accurate GNSS/INS-integrated navigation solution with centimeters accuracy is required. To obtain accurate navigation solution, the PPK GNSS/INS-integrated navigation solution used POS-MV data along with the GNSS base station (MK99) obtained from the KSACORS network collected by GCS that is about 5 km from the test area. The POS–MV data and the GNSS base station data were processed using POSPac software to provide the PPK GNSS/INS integrated navigation solution.
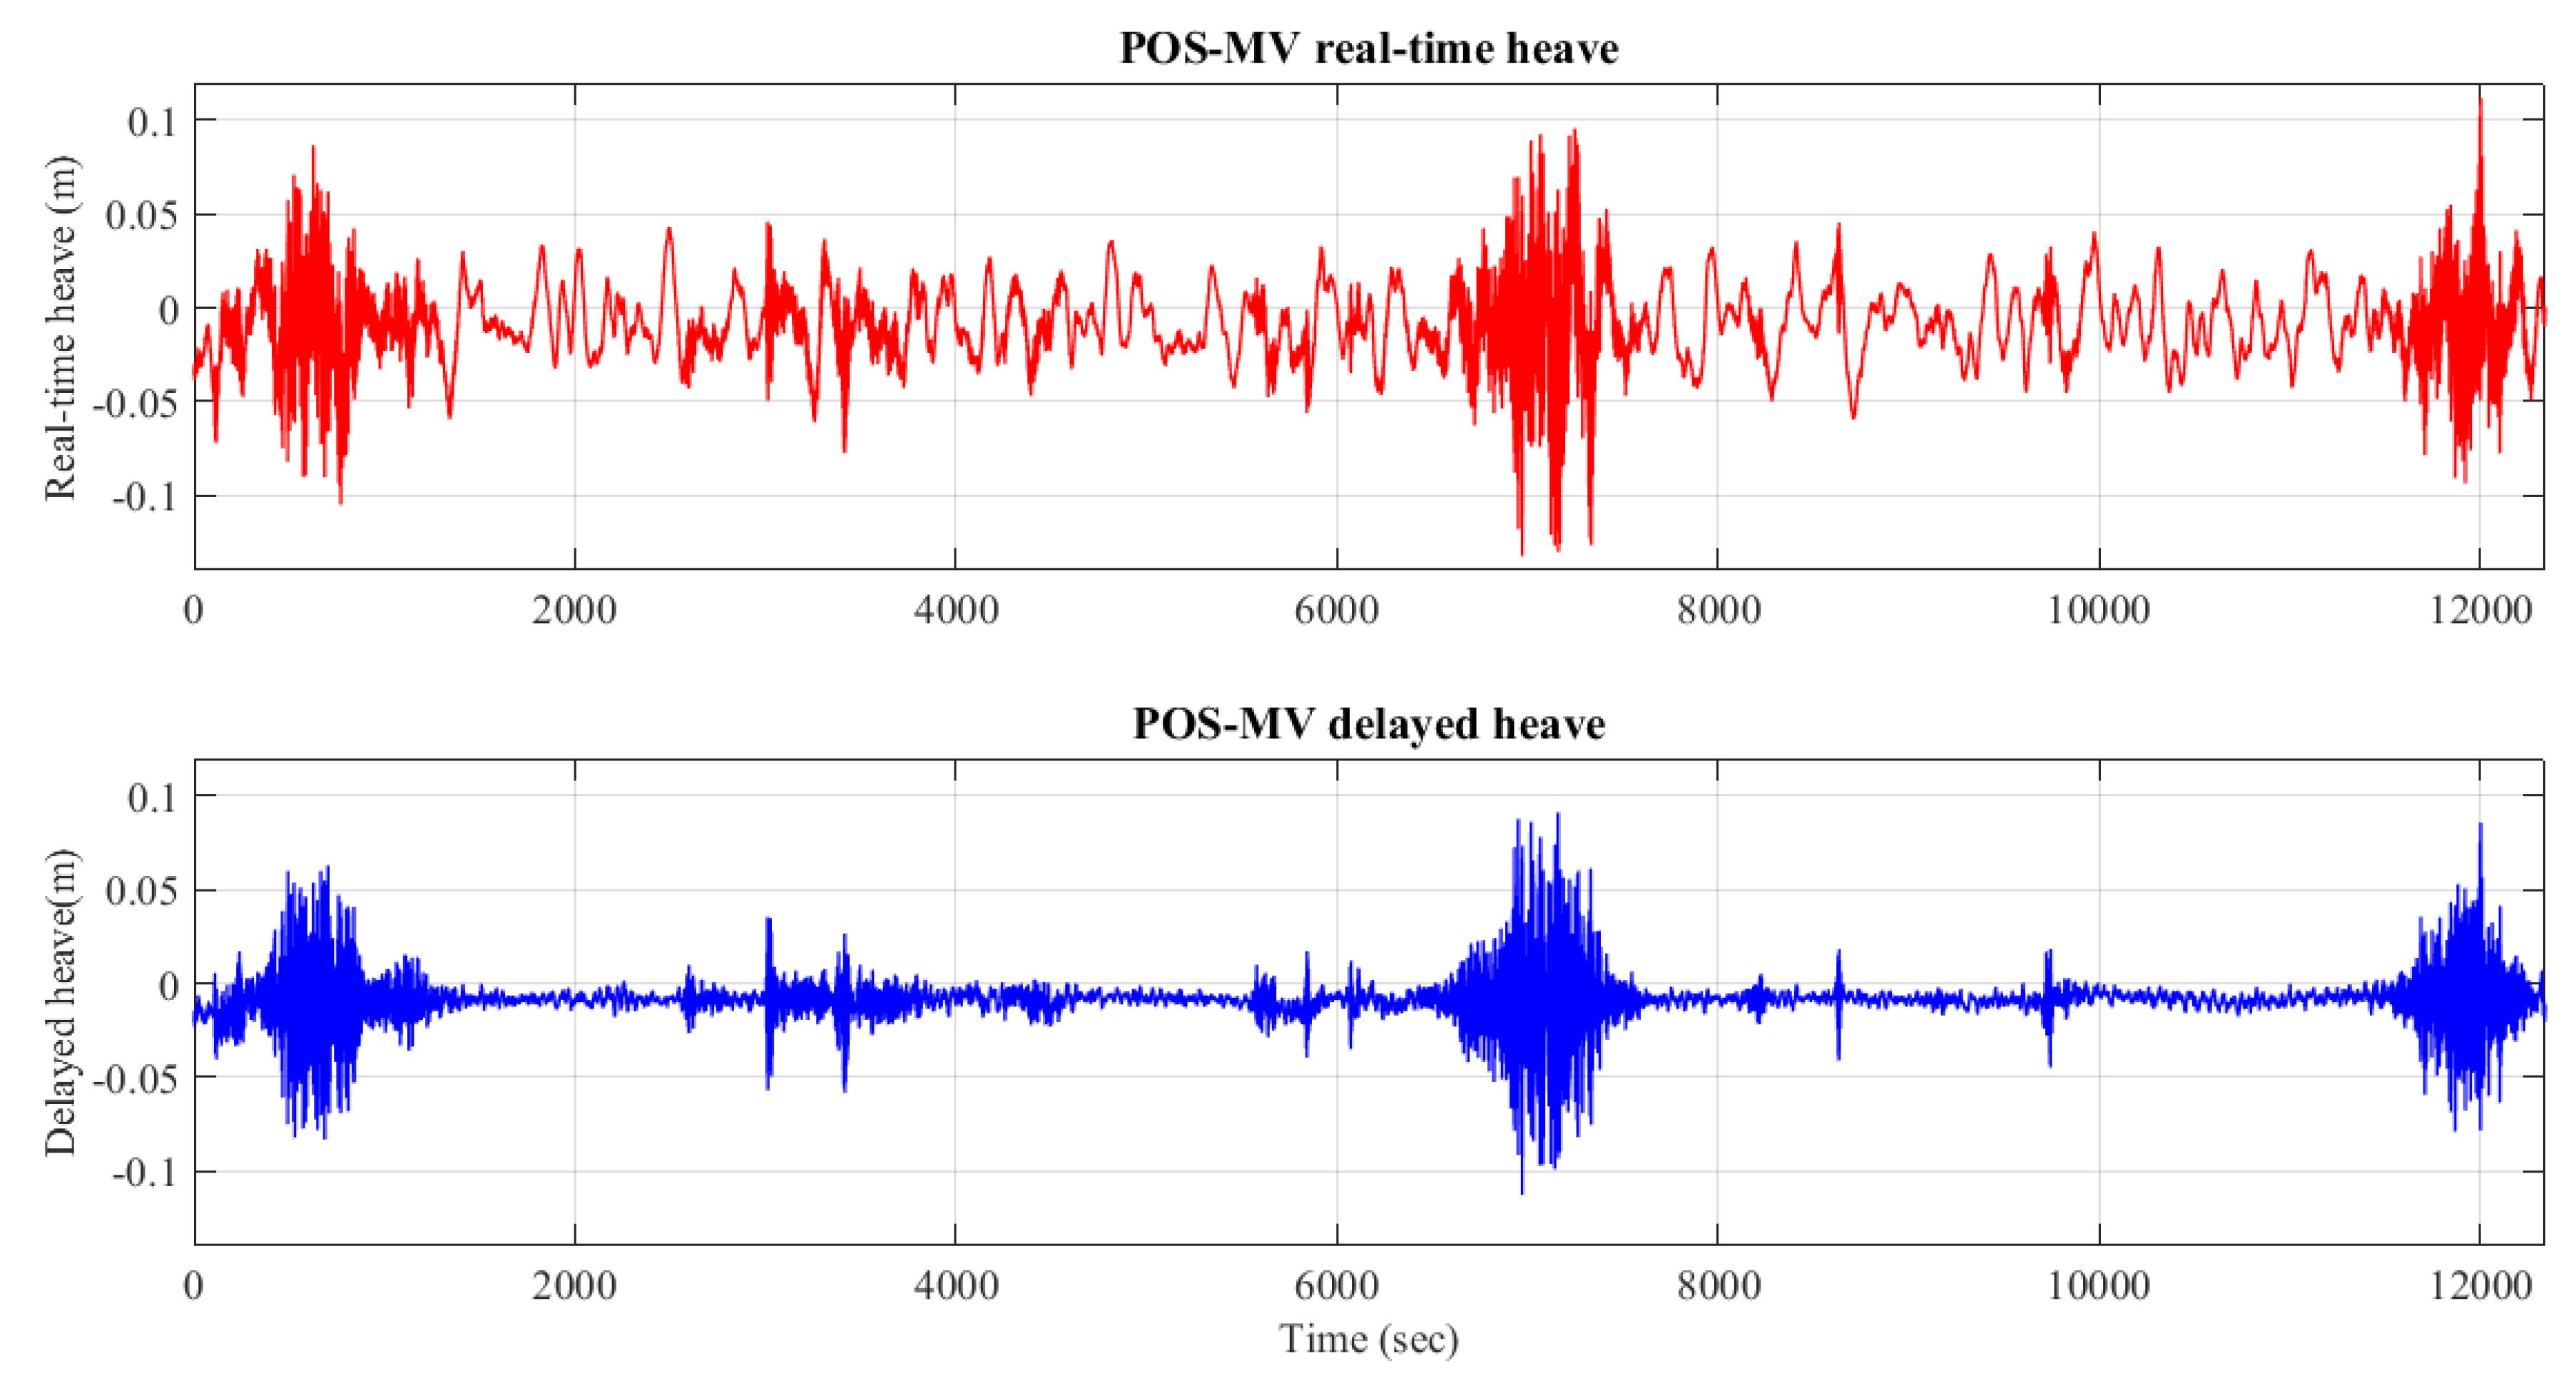
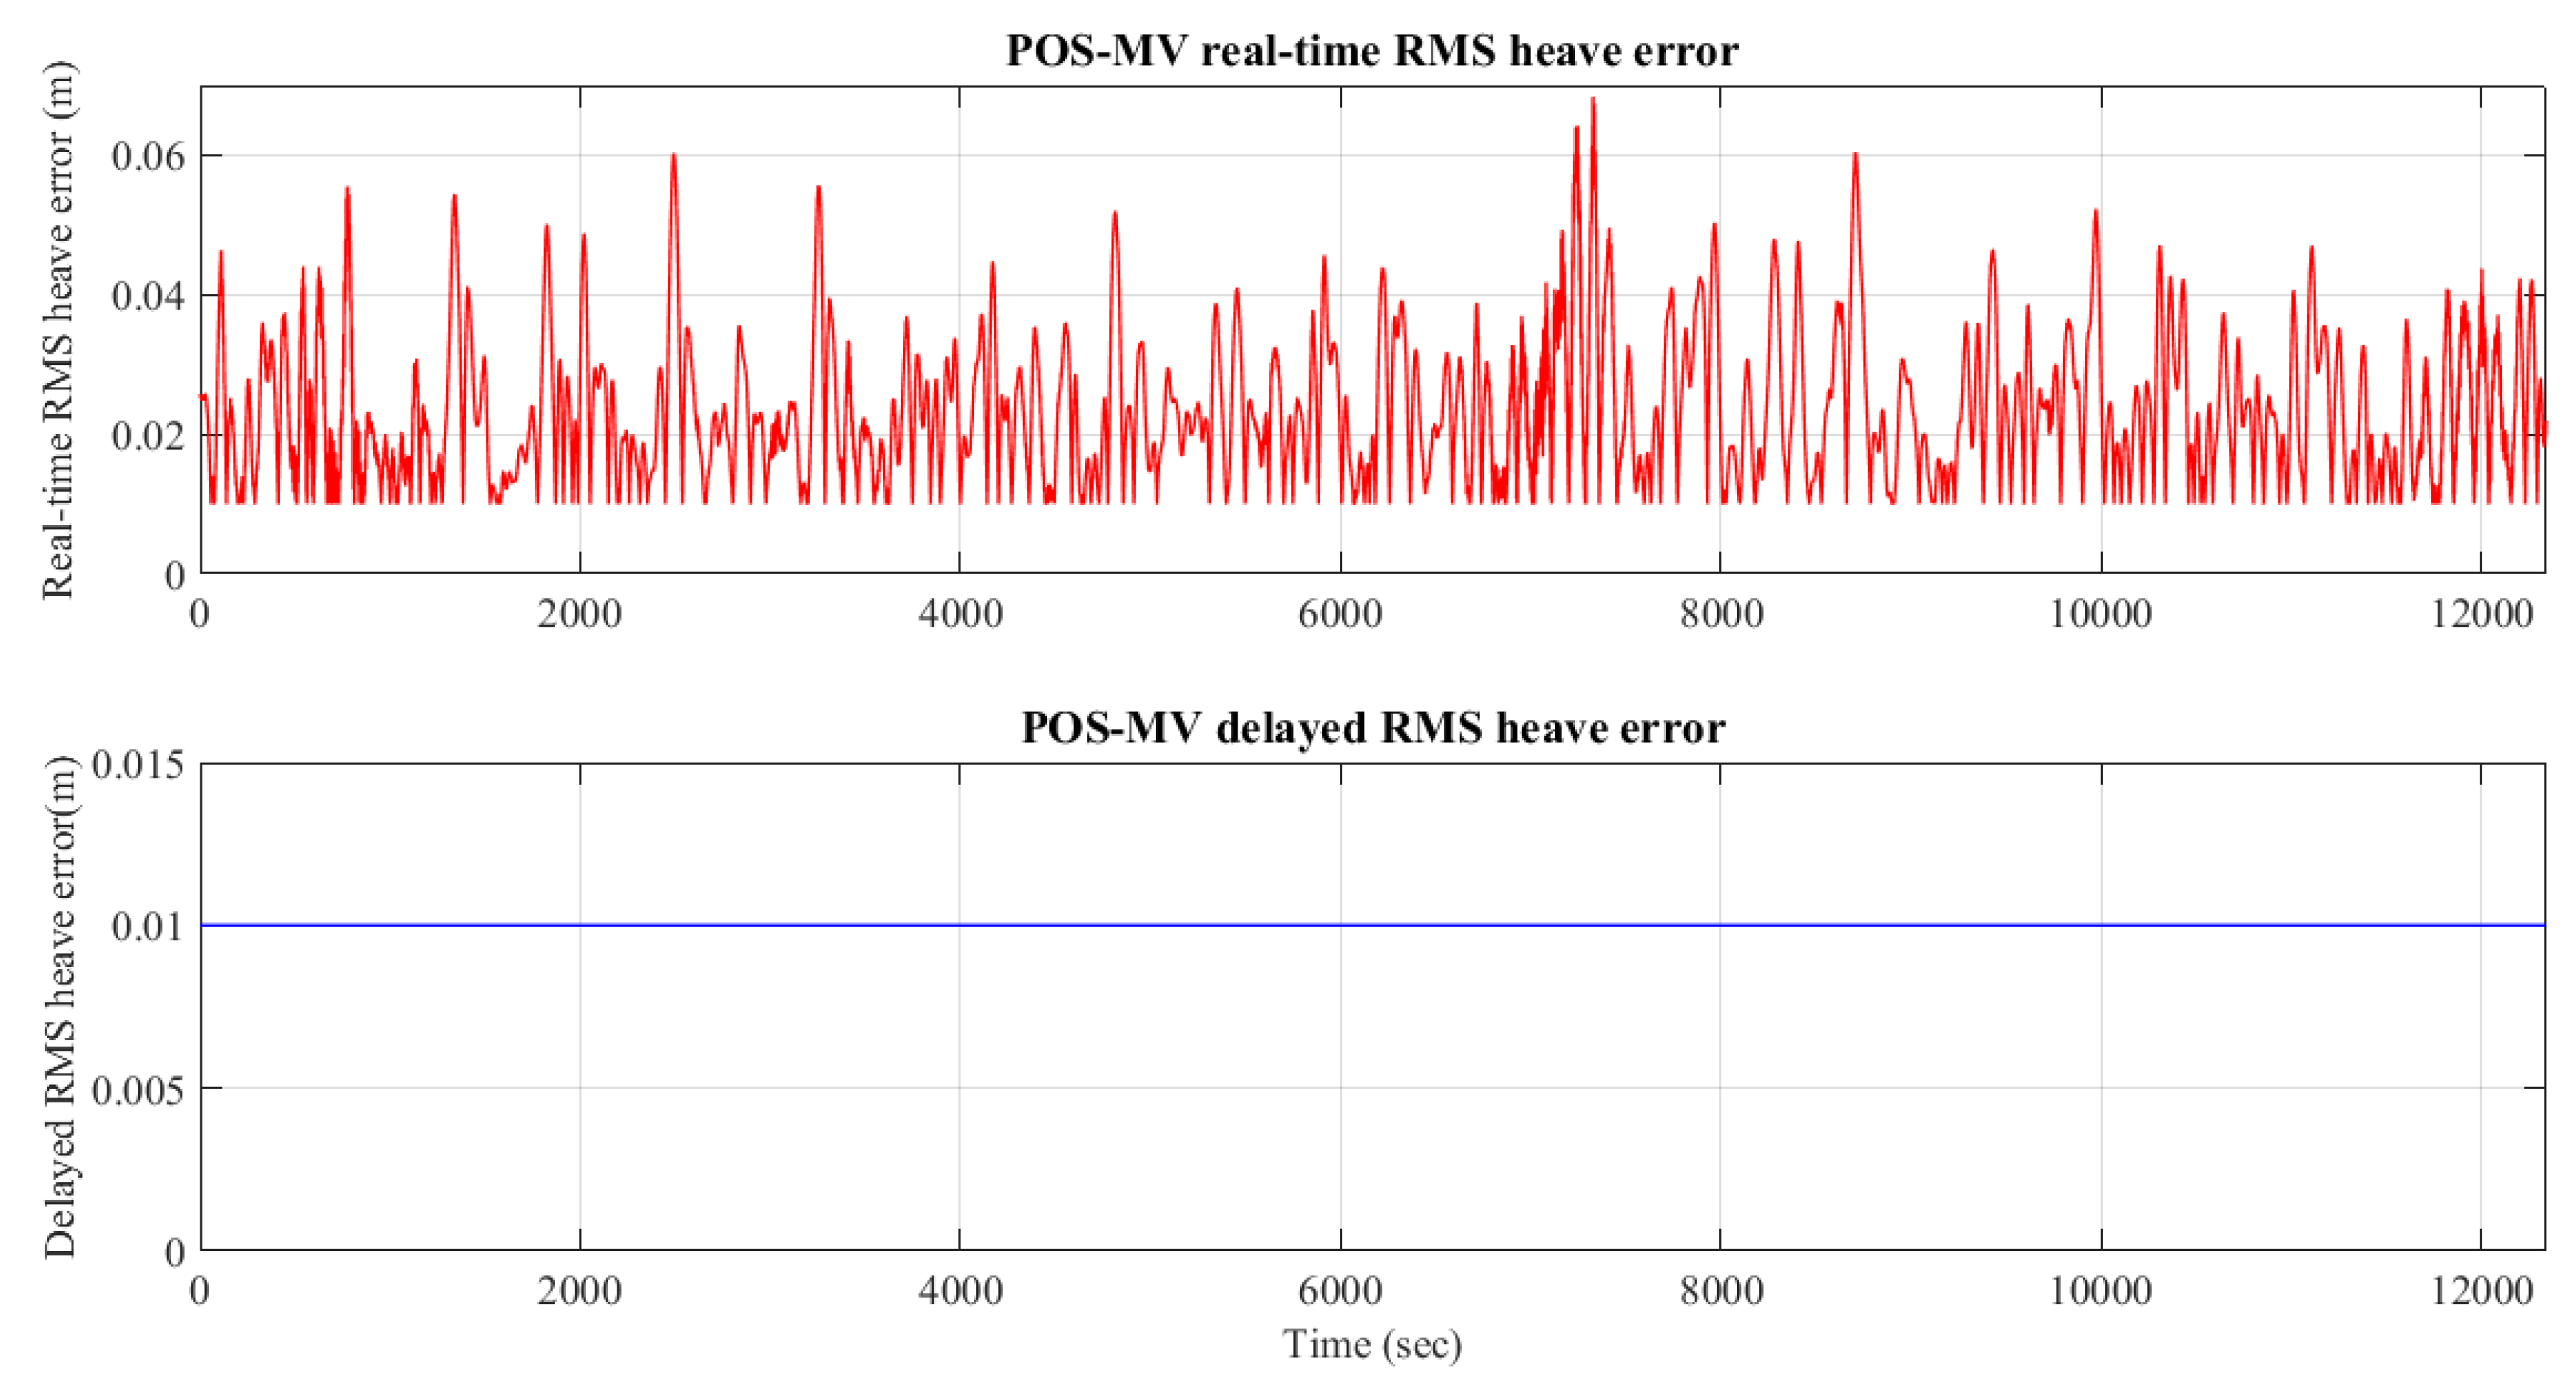
Figure 5 shows the PPK GNSS/INS-integrated navigation solution for latitude, longitude and ellipsoidal height referenced to the WGS84 ellipsoid, and Figure 6 shows the associated PPK navigation solution accuracy of latitude, longitude and ellipsoidal height implemented in the POSPac software. The ellipsoidal height accuracy ranges from 4 to 5 cm, which can be used to develop the separation model with a few centimeters’ accuracy and fulfill the IHO requirements for hydrographic surveying applications. Figure 7 shows the tide data of Jeddah station from Aramco tide tables of the Red Sea referenced to chart datum (LAT). The CARIS HIPS and SIPS software was employed to georeference the data from POSPac postprocessed navigation solution and apply tide data. The separation model was developed using the ellipsoidal height solution from the POSPac software and tide data. The separation model height represents the vertical distance between the chart datum and the reference ellipsoid (WGS84), namely (SEPCD-WGS84). The computed separation model is dependent on the draft and heave during the test survey. Figure 8 and Figure 9 show the true (delayed) heave and the real-time heave solution from POS-MV and associated errors, respectively. The heave is the vertical displacement of the survey vessel, and the value depends on the ocean basin [22]. The heave estimator is a technique that performs a combined double integration of the estimated vertical acceleration of the INS system in the navigation frame followed by high-pass filtering. If the filtering process is carried out in the real-time mode, the estimated heave is called real-time heave. However, if the filtering process is conducted in offline mode, the heave is called true (delayed) heave [22].
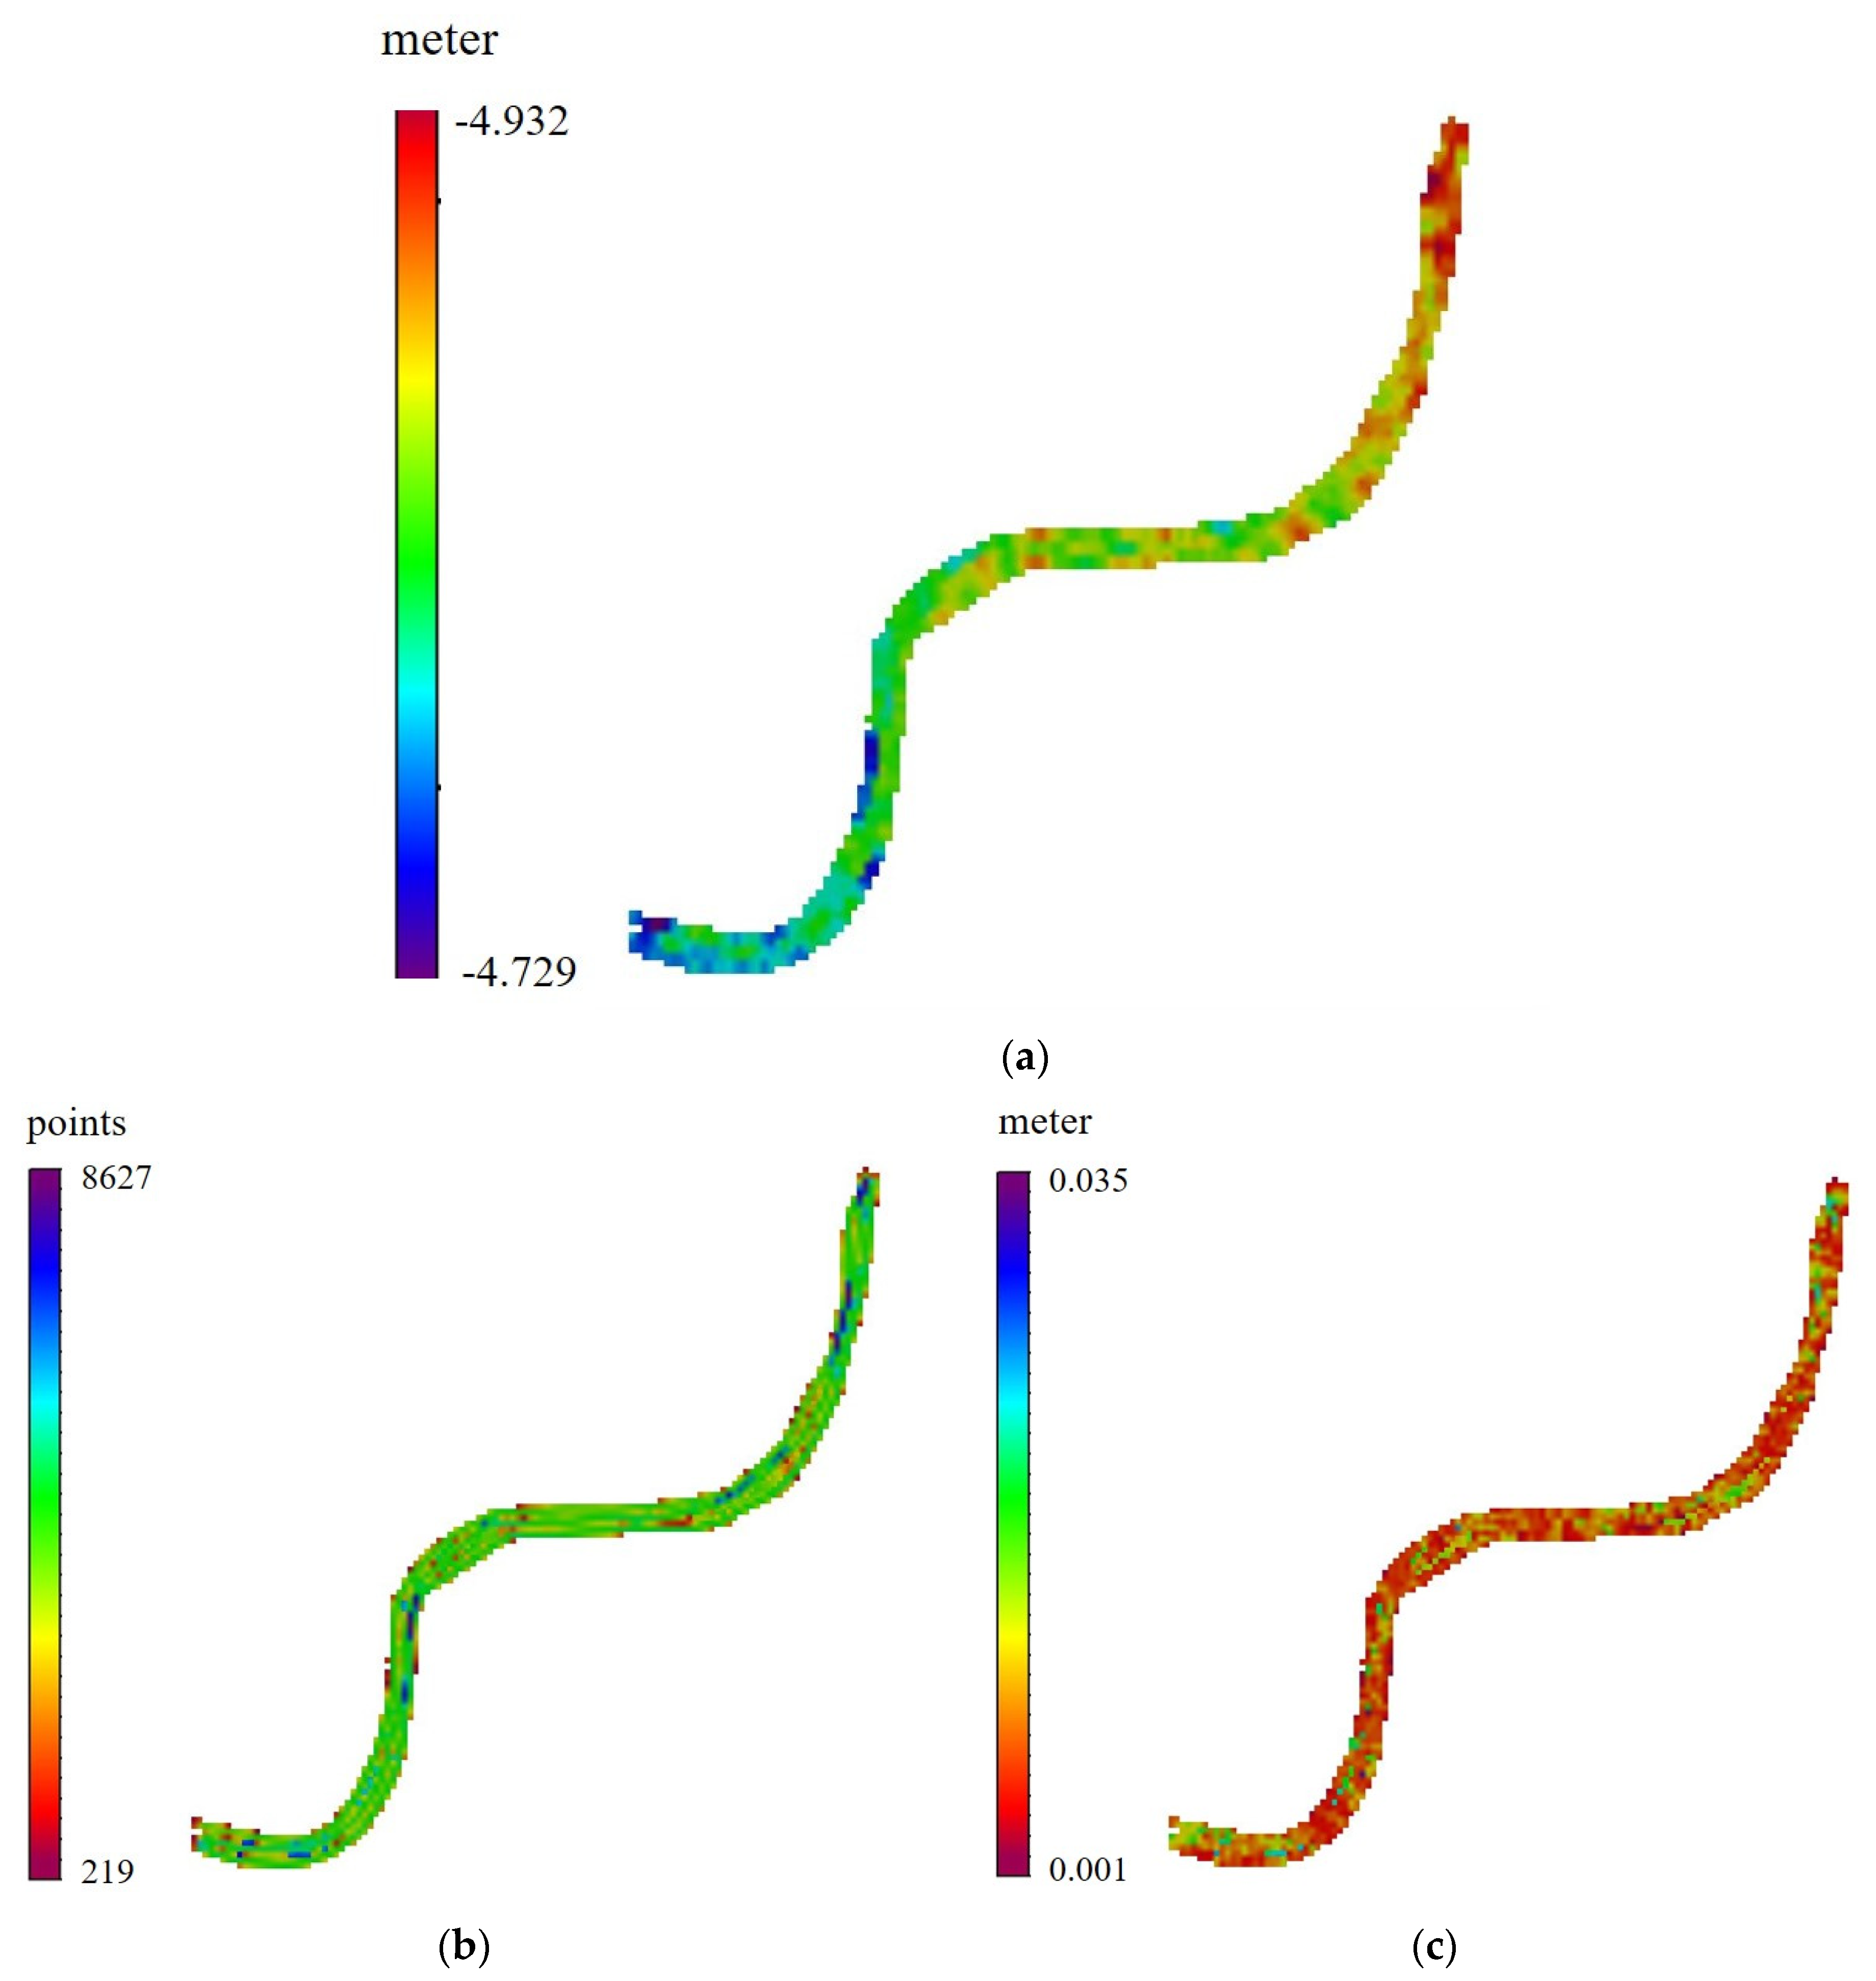
Two separation models were developed using CARIS HIPS and SIPS software based on real-time heave and delayed heave, respectively. Figure 10 shows the developed separation model using the real-time heave solution. Figure 10a shows the separation height between the chart datum and WGS84 at model grid nodes that range between −4.932 m to −4.729 m. Figure 10b shows the density of the number of points employed to estimate the separation heights at the grid nodes that range between 219 points and 8627 points. Figure 10c shows the standard deviations associated with the estimated separation heights at the grid nodes that range between 0.001 m and 0.035 m.
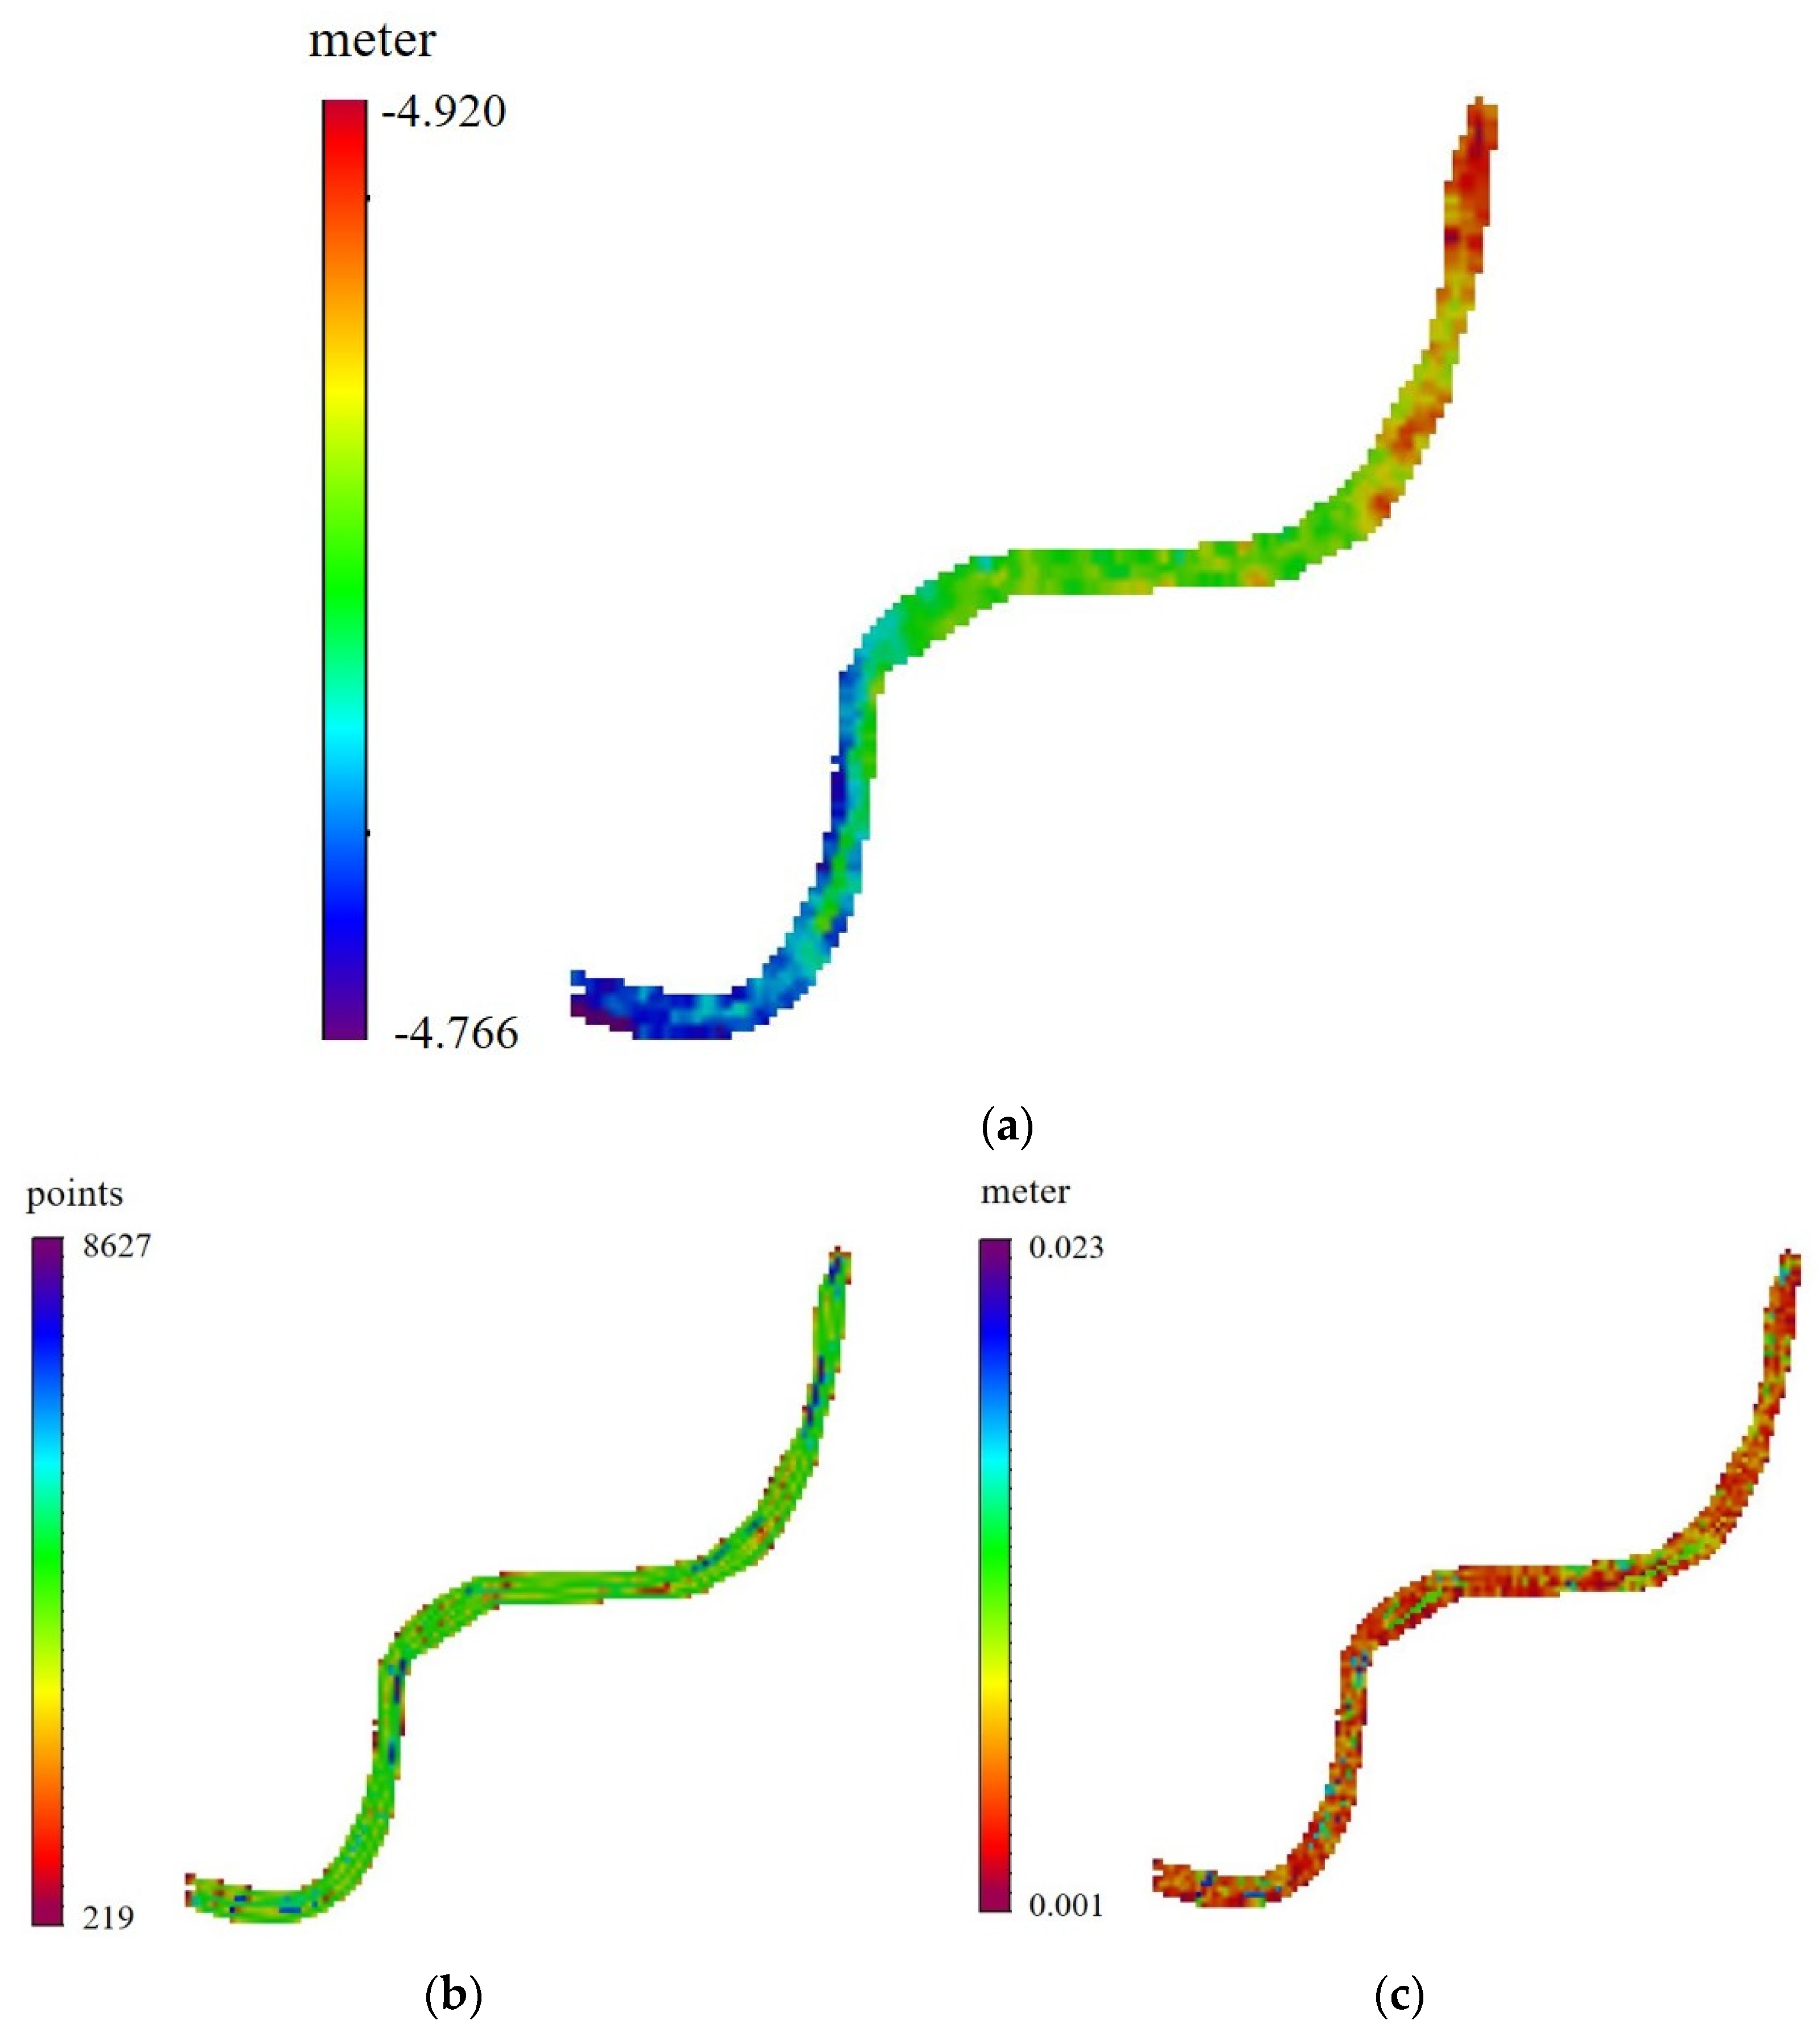
Figure 11 shows the developed separation model using the delayed heave solution. Figure 11a shows the separation height between the chart datum and WGS84 at model grid nodes that range between -4.920 m to -4.766 m. Figure 11b shows the density of the number of points employed to estimate the separation heights at the grid nodes that range between 219 points and 8627 points. Figure 11c shows the standard deviations associated with the estimated separation heights at the grid nodes that range between 0.001 m and 0.023 m.
Table 1 shows the summary of statistical results for the developed separation model, density and standard deviation using the real-time and delayed heave solutions. It is shown in Table 1 that the accuracy of the SEP model developed from delayed heave solution outperforms the SEP model developed from real-time heave solution with mean separation height value of −4.84 m and standard deviation value of 0.023 m.
The estimated separation model from hydrographic surveying test can be validated with gravimetric/oceanographic method, as shown numerically in Figure 12. The separation height model at the marine science tide gauge in the Sharm Obhur is estimated based on Equation (2) in Section 2.2 with known lowest astronomical tide value (LAT = 0.23 m is estimated from tidal constituents derived in by Shamji and Vineesh [23]), known gravimetric geoid height (N = 4.89 m value is obtained from Al-Kherayef [24]) and sea surface topography (SST = 0.16 m, estimated from equipotential values given in Al-Kherayef [24]); then the SEP equals:
A comparison is made between the estimated SEP mean value from the hydrographic surveying method and the gravimetric/oceanographic method. The estimated SEP mean value from the hydrographic surveying method is 4.84 m, and the estimated value from gravimetric/oceanographic method is 4.82. The difference between two SEP values from hydrographic surveying test and gravimetric/oceanographic method is about 2 cm, which is within the range the standard deviation values of the estimated SEP from the hydrographic surveying test (0.01 cm to 2.3 cm). Therefore, the SEP estimated hydrographic surveying test agrees with the SEP estimated from gravimetric/oceanographic method.
6. Conclusions
The objective of this paper is to develop a continuous chart datum-to-ellipsoid (WGS84) separation model for the Sharm Obhur study area using multibeam hydrographic surveying test. The research developed a separation model for the Sharm Obhur study using multibeam hydrographic surveying, the PPK navigation solution and delayed heave. The results provided continuous surface separation height, which ranges between −4.920 m to −4.766 m, with associated standard deviations ranges between 0.001 m and 0.023 m. Furthermore, a comparison was made between the estimated separation model value developed from the hydrographic surveying test and the estimated value developed from gravimetric/oceanographic method. The results demonstrated that average value of the separation model heights agrees with the height estimated by the gravimetric/oceanographic method. It should be noted that the developed separation model achieved a few centimeters’ accuracy and consequently fulfills the IHO requirements for hydrographic surveys for special order (shallow water) applications. The advantage of developing a separation model consists of the possibility to transform bathymetric data from ellipsoid to CD in real time without using a tide gauge. In such a way, it optimizes the hydrographic surveying workflow through the increased speed of data processing. For the future similar studies, it is strongly recommended to employ the continuous separation model when multibeam hydrographic surveying data are collected with high accuracy, inertially aided Real-Time Kinematic (RTK) or PPK navigation solutions to produce an accurate navigation chart for the safety of maritime navigation.
Author Contributions
Conceptualization; methodology; software, M.E.-D.; validation, M.E.-D., M.R.K., and F.A.; formal analysis, M.E.-D.; investigation, M.E.-D., M.R.K., and F.A.; resources, M.E.-D., and F.A.; data curation, M.E.-D., and F.A.; writing—original draft preparation, M.E.-D., and M.R.K.; writing—review and editing, M.E.-D., and M.R.K.; visualization, M.E.-D., M.R.K., and F.A.; funding acquisition, F.A. All authors have read and agreed to the published version of the manuscript.
Funding
This project was funded by the Research and Consulting Institute (RACI), King Abdulaziz University, Jeddah, Saudi Arabia. The author, therefore, gratefully acknowledges RACI’s technical and financial support.
Institutional Review Board Statement
Not applicable.
Informed Consent Statement
Not applicable.
Data Availability Statement
Raw data were generated at King Abdulaziz University, Jeddah, Saudi Arabia. Derived data supporting the findings of this study are available from the first author [M.E.-D.] on request.
Conflicts of Interest
The authors declare no conflict of interest.
Appendix A
This following table lists the collected measurements/data:

| Equipment | Data |
|---|---|
| Kongsberg EM712 multibeam echo sounder | Bathymetric measurements |
| POS–MV System | GNSS and inertial unit measurements |
| Valeport’s sound velocity profiler | Sound velocity measurements |
| KSA-CORS GNSS base station MK99 | GNSS measurements |
| Jeddah tide gauge station | ARAMCO tide table data |
References
- Rice, G.; Riley, J. Measuring the Water Level Datum Relative to the Ellipsoid during Hydrographic Survey; NOAA: Washington, DC, USA, 2011. Available online: https://nauticalcharts.noaa.gov/learn/docs/ellipsoidally-referenced-surveys/rice-riley-measuring-water-level-datum-relative-ers.pdf (accessed on 30 November 2021).
- Mills, J.; Dodd, D. Ellipsoidally Referenced Surveying for Hydrography; FIG: Copenhagen, Denmark, 2014; Available online: https://www.fig.net/resources/publications/figpub/pub62/Figpub62.pdf (accessed on 30 November 2021).
- El-Diasty, M.; Al-harbi, S.; Pagiatakis, S. Development of Saudi continuous chart datum: Arabian Gulf case study. Geomat. Nat. Hazards Risk 2019, 10, 1738–1749. [Google Scholar] [CrossRef]
- Abd-Rahman, M.; Din, A. The Development of Continuous Hydrographic Datum Using Geodetic Based Approaches: A Review. IOP Conf. Ser. Earth Environ. Sci. 2020, 540, 012062. [Google Scholar] [CrossRef]
- Kaloop, M.; Pijush, S.; Rabah, M.; Al-Ajami, H.; Hu, J.; Zaki, A. Improving accuracy of local geoid model using machine learning approaches and residuals of GPS/levelling geoid height. Surv. Rev. 2021, 1–14, In press. [Google Scholar] [CrossRef]
- Handa, E. Tidal datums. In Encyclopedia of Coastal Science; Finkl, C., Makowski, C., Eds.; Springer: Berlin/Heidelberg, Germany, 2019. [Google Scholar]
- Iliffe, J.C.; Ziebart, M.K.; Turner, J.F.; Talbot, A.J.; Lessnoff, A.P. Accuracy of vertical datum surfaces in coastal and offshore zones. Surv. Rev. 2013, 45, 254–262. [Google Scholar] [CrossRef]
- IHO. IHO Standards for Hydrographic Surveys. 2020. Available online: https://iho.int/uploads/user/pubs/Drafts/S-44_Edition_6.0.0-Final.pdf (accessed on 18 December 2021).
- Jeffries, M.; Nudds, S.; Robin, C.; MacAulay, P.; Godin, A.; Boom, B.; Dangerfield, N.; Bartlett, J. The Canadian Continuous Vertical Datum for both Land and Sea; CHC-NSC: Victoria, BC, USA, 2018. [Google Scholar]
- Robin, C.; Nudds, S.; MacAulay, P.; Godin, A.; de Lange, B.; Bartlett, J. Hydrographic Vertical Separation Surfaces (HyVSEPs) for the Tidal Waters of Canada. Mar. Geod. 2016, 39, 195–222. [Google Scholar] [CrossRef]
- Robin, C.; Godin, A.; Macaulay, P.; de Lange, B.; Lefaivre, D.; Herron, T.; Sinnott, D.; Ballantyne, A.; Maltais, L.; Veronneau, M. The Canadian hydrographic continuous vertical datum: Methodology and accuracy. In Proceedings of the CHC 2012 Conference Proceedings, Niagara Falls, ON, Canada, 15–17 May 2012. [Google Scholar]
- Robin, C.; Nudds, S.; MacAulay, P.; Godin, A.; Boom, B.; Bartlett, J.; Maltais, L.; Herron, T.; Fadaie, K.; Craymer, M.; et al. The continuous vertical datum for Canadian waters project: Overview & status report. In Proceedings of the Canadian Hydrographic Conference, Toronto, ON, Canada, 14–17 April 2014. [Google Scholar]
- Gesch, D.; Wilson, R. Development of a Seamless Multisource Topographic/Bathymetric Elevation Model for Tampa Bay. Mar. Technol. Soc. J. 2001, 35, 58–64. [Google Scholar] [CrossRef] [Green Version]
- Pineau-Guillou, L.; Dorst, L. Creation of vertical reference surfaces at sea using altimetry and GPS. Ann. Hydrogr. 2011, 8, 1–7. [Google Scholar]
- Keysers, J.H.; Quadros, N.D.; Collier, P.A. Developing a Method to Establish a Common Vertical Datum before Integrating Land Height Data with Near-Shore Seafloor Depth Data; Report Prepared for the Commonwealth Government of Australia; Department of Climate Change and Energy Efficiency: Canberra, Australia, 2013. [Google Scholar]
- Slobbe, D.C.; Sumihar, J.; Frederikse, T.; Verlaan, M.; Klees, R.; Zijl, F.; Farahani, H.H.; Broekman, R. A Kalman Filter Approach to Realize the Lowest Astronomical Tide Surface. Mar. Geodesy 2018, 41, 44–67. [Google Scholar] [CrossRef] [Green Version]
- CARIS. CARIS HIPS and SIPS Professional: Version 11.0; Teledyne CARIS, Inc.: Fredericton, NB, Canada, 2018. [Google Scholar]
- Adams, R. The development of a vertical reference surface and model for hydrography—A guide. In Proceedings of the XXIII International FIG Conference, Munich, Germany, 8–13 October 2006. [Google Scholar]
- De Lange, B. Vertical datum separation models for the British Columbia coast. In Proceedings of the CHC 2012 Conference, Niagara Falls, ON, Canada, 1–5 September 2012. [Google Scholar]
- Lefaivre, D.; Dodd, D.; Godin, A.; Herron, T.; MacAulay, P.; Sinnott, D. The continuous vertical datum Canadian waters project (beginnings, vision, methods and progress). In Proceedings of the CHC 2010 Conference, Quebec, QC, Canada, 10–16 February 2010. [Google Scholar]
- Torge, W.; Müller, J. Geodesy, 4th ed.; Walter de Gruyter: Berlin, Germany, 2012. [Google Scholar]
- El-Diasty, M. Development of Real-Time PPP-Based GPS/INS Integration System Using IGS Real-Time Service for Hydrographic Surveys. J. Surv. Eng. 2015, 142, 05015005. [Google Scholar] [CrossRef]
- Shamji, V.R.; Vineesh, T.C. Shallow-water tidal analysis at Sharm Obhur Jeddah, Red Sea. Arab. J. Geosci. 2017, 10, 61. [Google Scholar] [CrossRef]
- Al-Kherayef, O. Geodetic Earth Observations Combination for Vertical Reference System Definition—A Case Study for the Kingdom of Saudi Arabia Vertical Datum and Vertical Reference Frame. Ph.D. Thesis, University of Mining and Geology St Ivan Rilski, Sofia, Bulgaria, 2020. [Google Scholar]
Figure 1.
Schematic plot for the separation height estimation using multibeam hydrographic surveying method.
Figure 1.
Schematic plot for the separation height estimation using multibeam hydrographic surveying method.

Figure 2.
Schematic plot for the separation height estimation using the gravimetric/oceanographic method.
Figure 2.
Schematic plot for the separation height estimation using the gravimetric/oceanographic method.

Figure 3.
Methodology for separation model development.
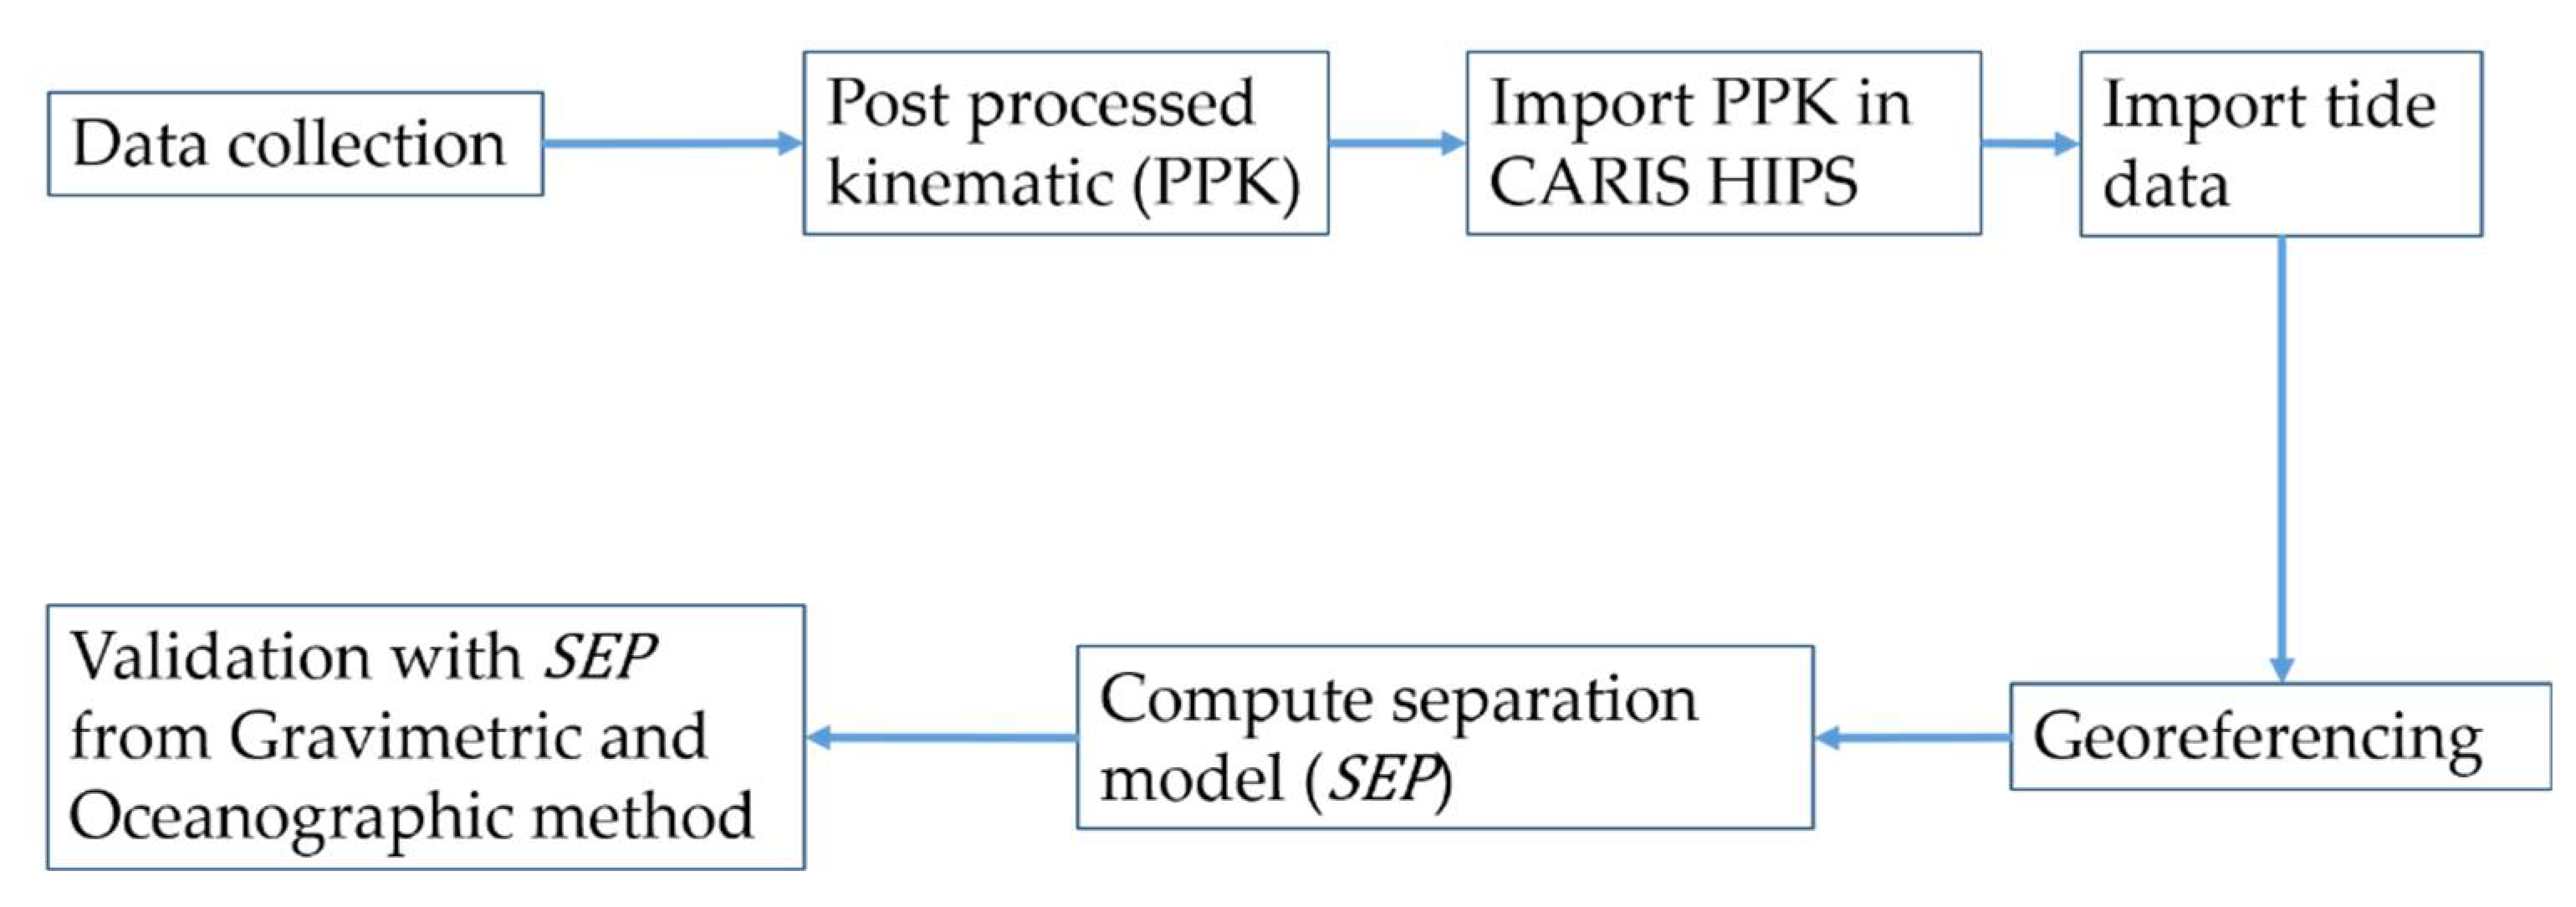
Figure 4.
Test survey track lines (red lines) in the Sharm Obhur study area.

Figure 5.
PPK GNSS/INS-integrated navigation solution for latitude, longitude and ellipsoidal height from POSPac software.
Figure 5.
PPK GNSS/INS-integrated navigation solution for latitude, longitude and ellipsoidal height from POSPac software.
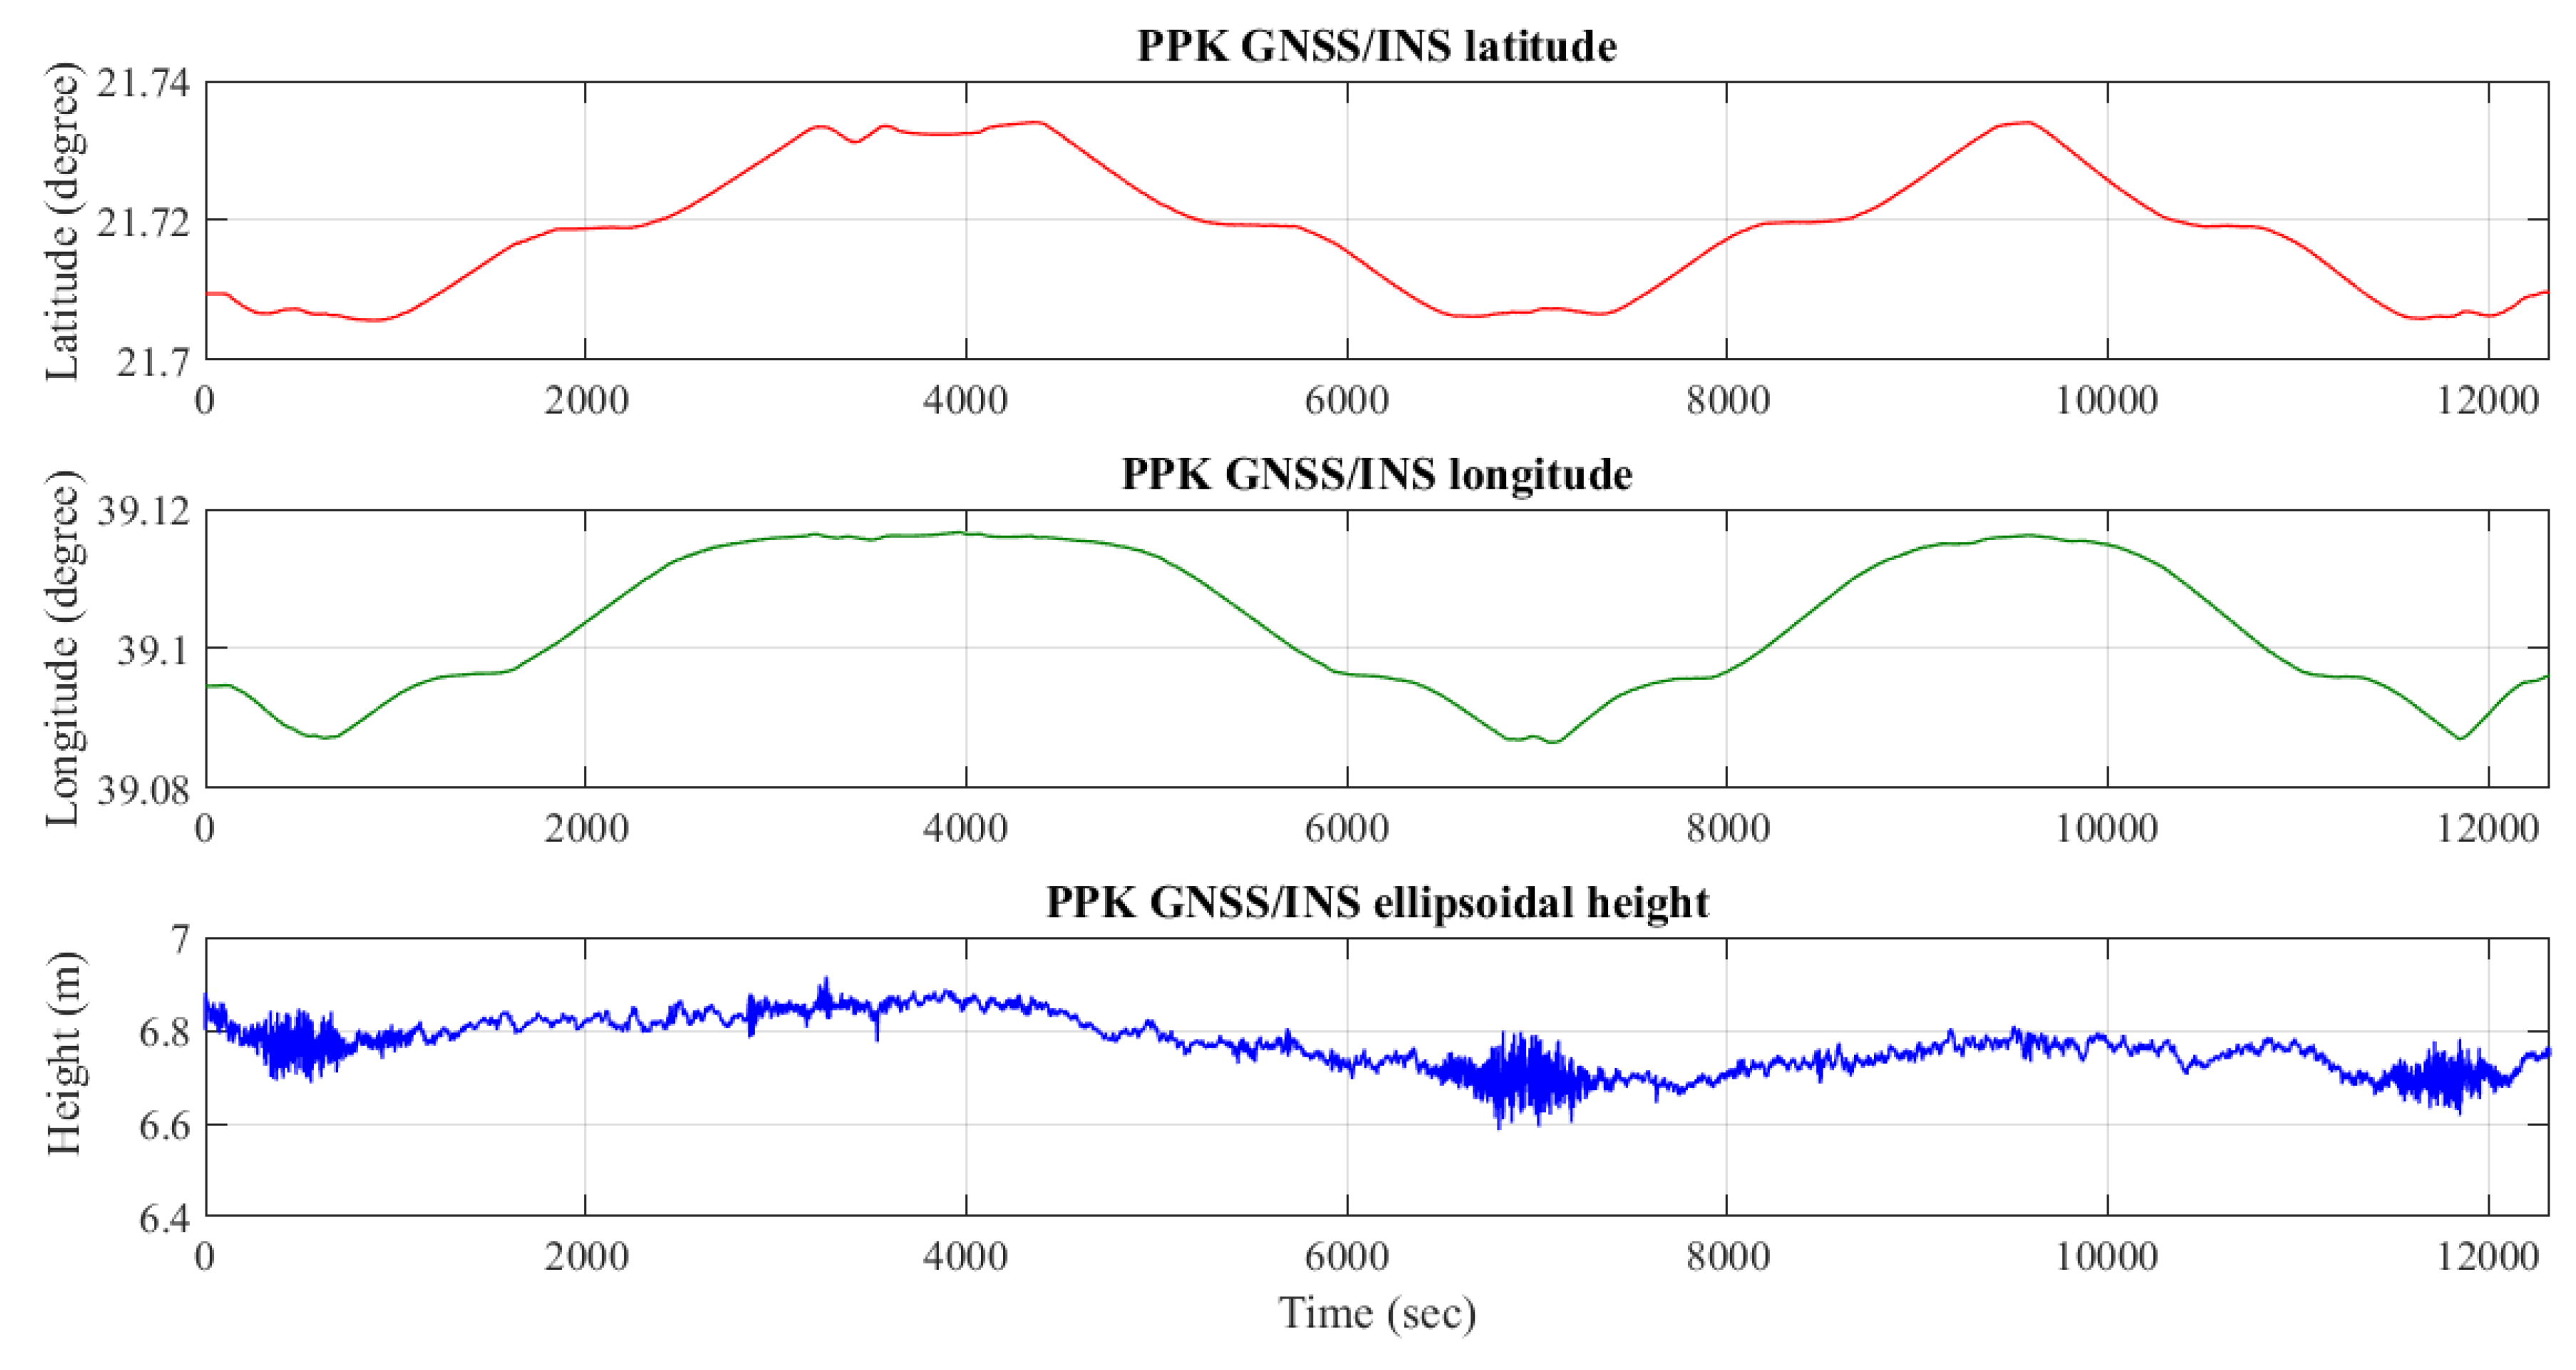
Figure 6.
Accuracy of the PPK navigation solution from POSPac software.
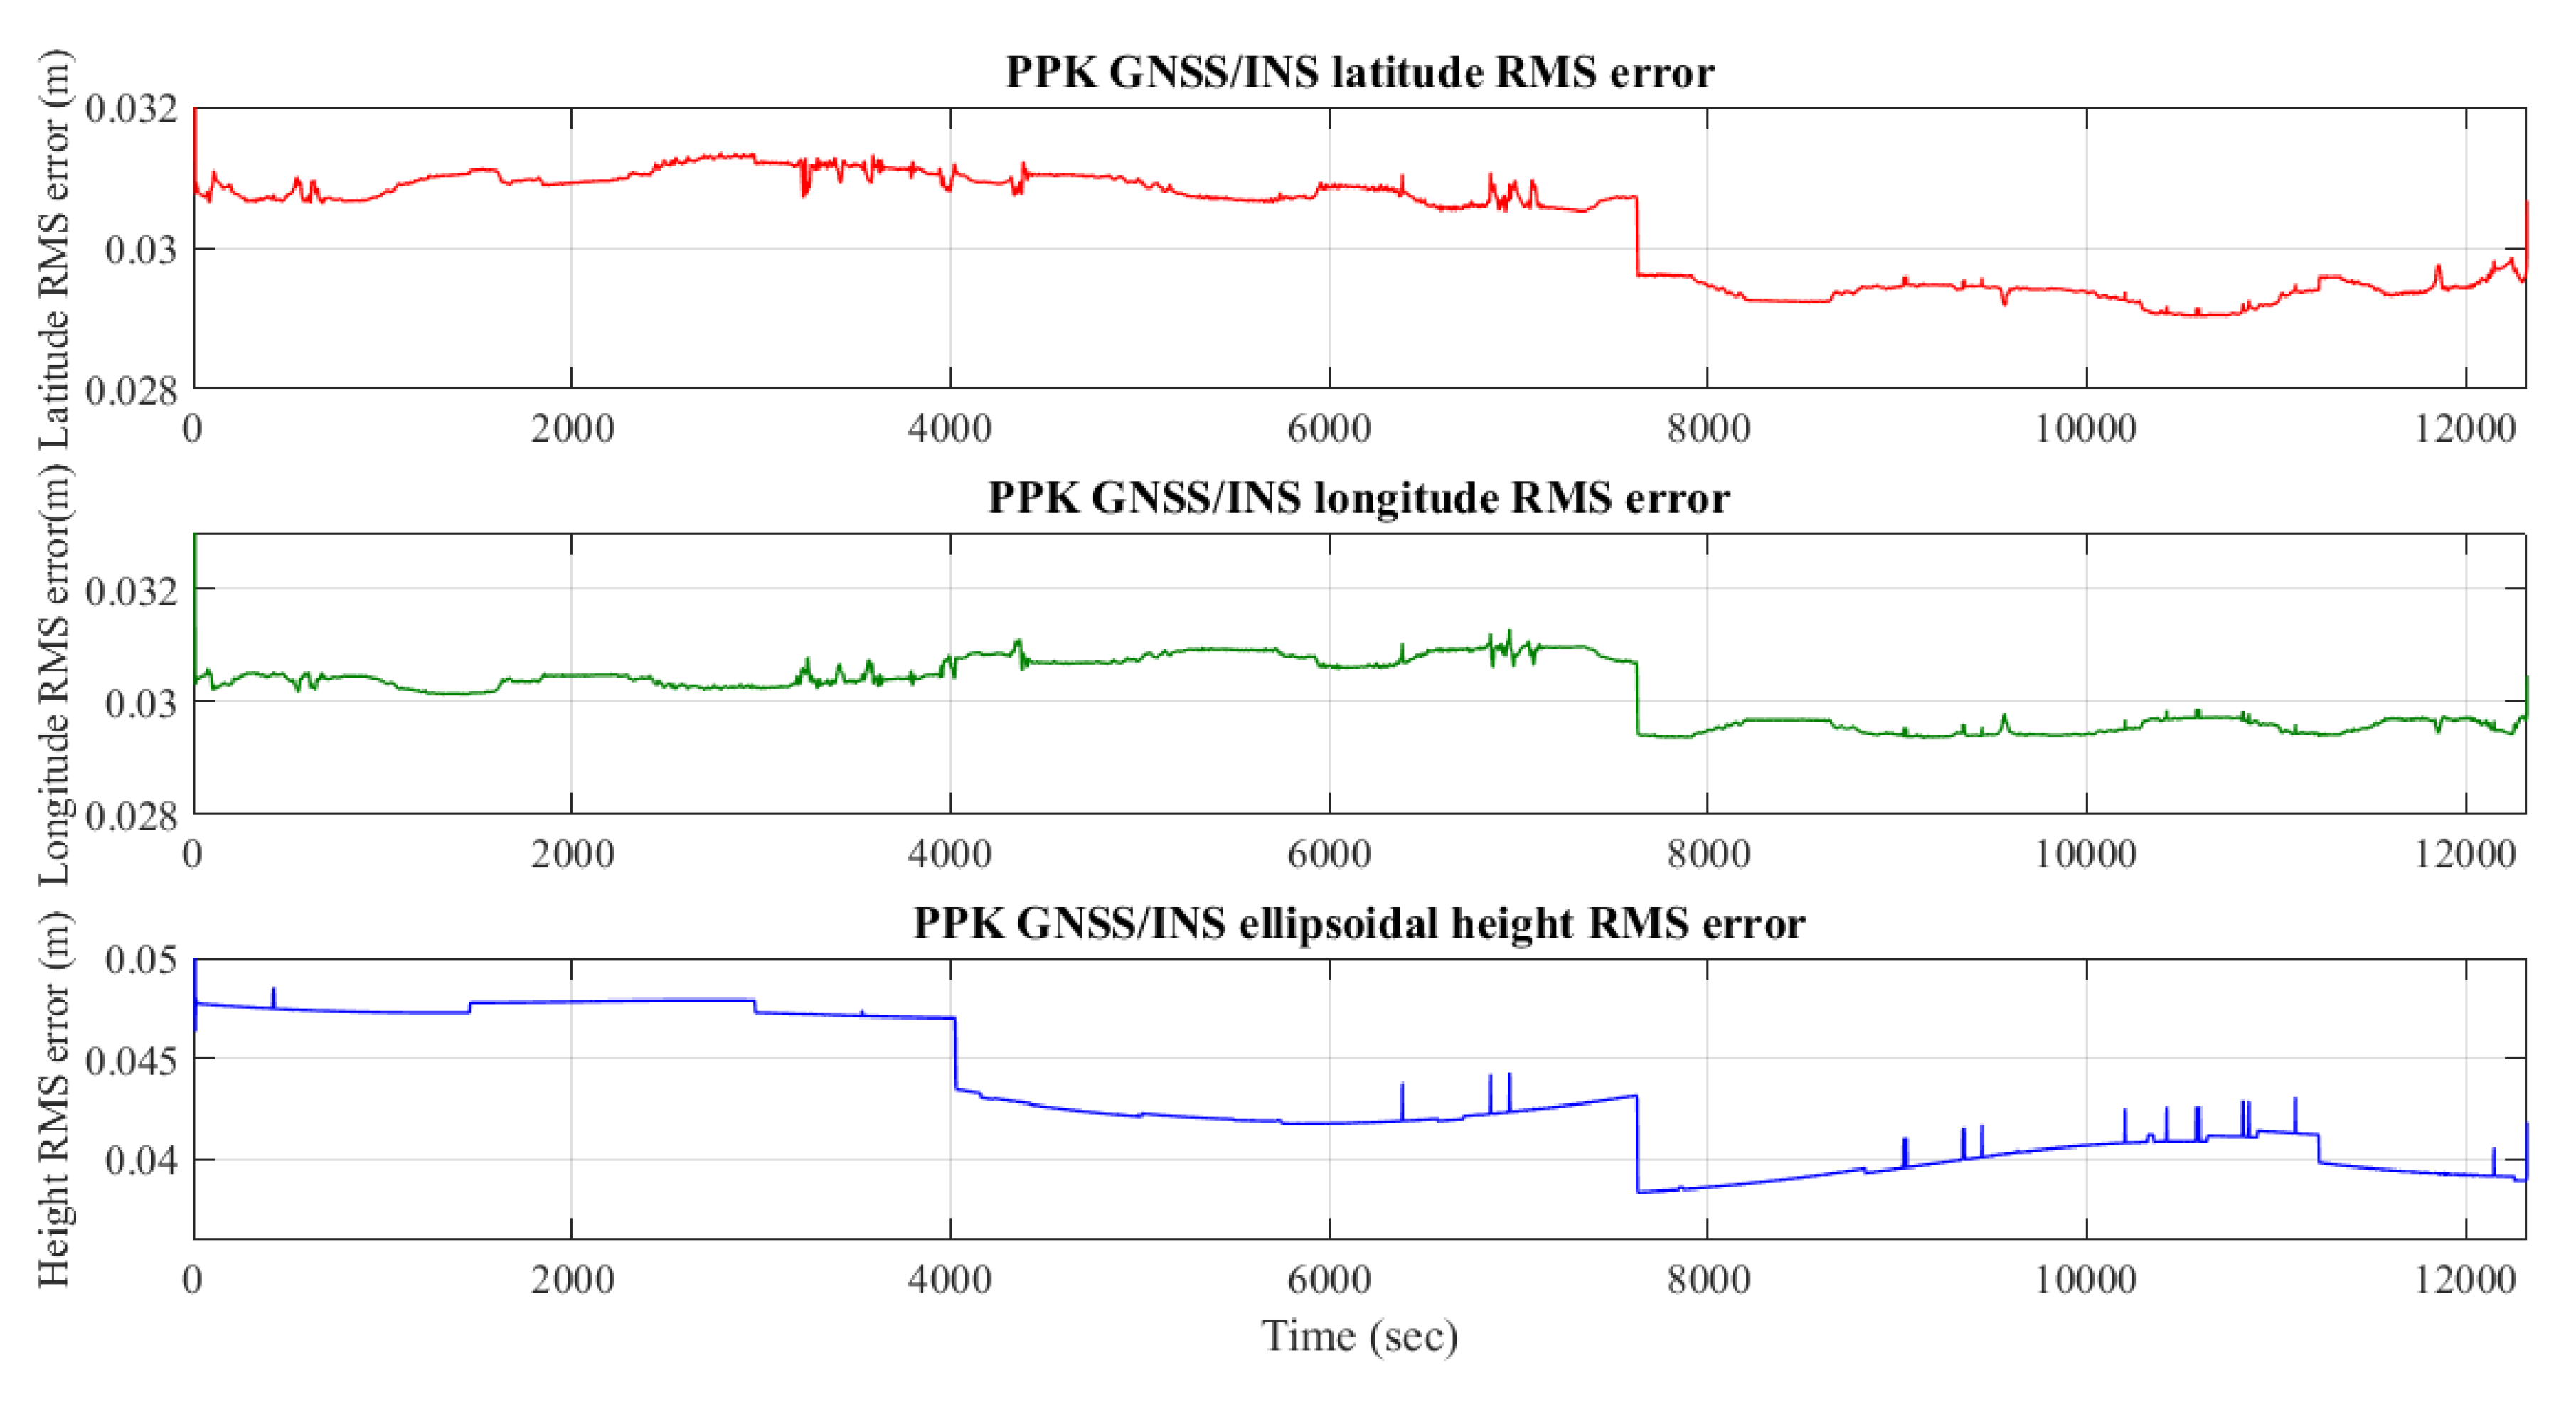
Figure 7.
Tide data from Jeddah station.

Figure 8.
True (delayed) heave and real-time heave from POS–MV system.

Figure 9.
RMS errors for true (delayed) heave and real-time heave from POS–MV system.

Figure 10.
Separation height with real-time heave along with the associated density and standard deviation; where (a) Shows separation height with real time heave; (b) Shows density of separation height estimation with real time heave; (c) Shows Standard deviations of separation height estimation with real time heave.

Figure 11.
Separation height with delayed heave along with the associated density and standard deviation; where (a) shows separation height with delayed heave, (b) shows density of separation height estimation with delayed heave and (c) shows Standard deviations of separation height estimation with delayed heave.

Figure 12.
Schematic plot for SEP estimation from the gravimetric/oceanographic method.

Table 1.
Summary of statistical results of the SEP models using real-time and delayed heave solutions.
Table 1.
Summary of statistical results of the SEP models using real-time and delayed heave solutions.
| Parameter\Solution | SEP with Real-Time Heave | SEP with Delayed Heave |
|---|---|---|
| Maximum SEP | −4.729 m | −4.766 m |
| Minimum SEP | −4.932 m | −4.920 m |
| Mean SEP | −4.841 m | −4.841 m |
| Maximum density | 8627 points | 8627 points |
| Minimum density | 219 points | 219 points |
| Mean density | 4055 points | 4055 points |
| Maximum standard deviation | 0.035 m | 0.023 m |
| Minimum standard deviation | 0.001 m | 0.001 m |
| Mean standard deviation | 0.007 m | 0.005 m |
Publisher’s Note: MDPI stays neutral with regard to jurisdictional claims in published maps and institutional affiliations. |
© 2022 by the authors. Licensee MDPI, Basel, Switzerland. This article is an open access article distributed under the terms and conditions of the Creative Commons Attribution (CC BY) license (https://creativecommons.org/licenses/by/4.0/).
Share and Cite
MDPI and ACS Style
El-Diasty, M.; Kaloop, M.R.; Alsaaq, F. Chart Datum-to-Ellipsoid Separation Model Development for Obhur Creek Using Multibeam Hydrographic Surveying. J. Mar. Sci. Eng. 2022, 10, 264. https://doi.org/10.3390/jmse10020264
AMA Style
El-Diasty M, Kaloop MR, Alsaaq F. Chart Datum-to-Ellipsoid Separation Model Development for Obhur Creek Using Multibeam Hydrographic Surveying. Journal of Marine Science and Engineering. 2022; 10(2):264. https://doi.org/10.3390/jmse10020264
Chicago/Turabian StyleEl-Diasty, Mohammed, Mosbeh R. Kaloop, and Faisal Alsaaq. 2022. "Chart Datum-to-Ellipsoid Separation Model Development for Obhur Creek Using Multibeam Hydrographic Surveying" Journal of Marine Science and Engineering 10, no. 2: 264. https://doi.org/10.3390/jmse10020264
Note that from the first issue of 2016, this journal uses article numbers instead of page numbers. See further details here.