
Decision Support System for Technology Deployment Considering Emergent Behaviors in the Maritime Industry


Abstract
:1. Introduction
2. Technology Trends and Related Studies
2.1. Efforts to Reduce CO2 Emissions
2.2. Simulation Utilization for Decision Making
2.2.1. Simulation for Ship Performance Evaluation
2.2.2. Simulation and Optimization for Ship Operation
2.2.3. Research on Uncertainty Modeling
2.2.4. Examples of Technology Deployment
2.3. Research Approach
3. Proposed Method
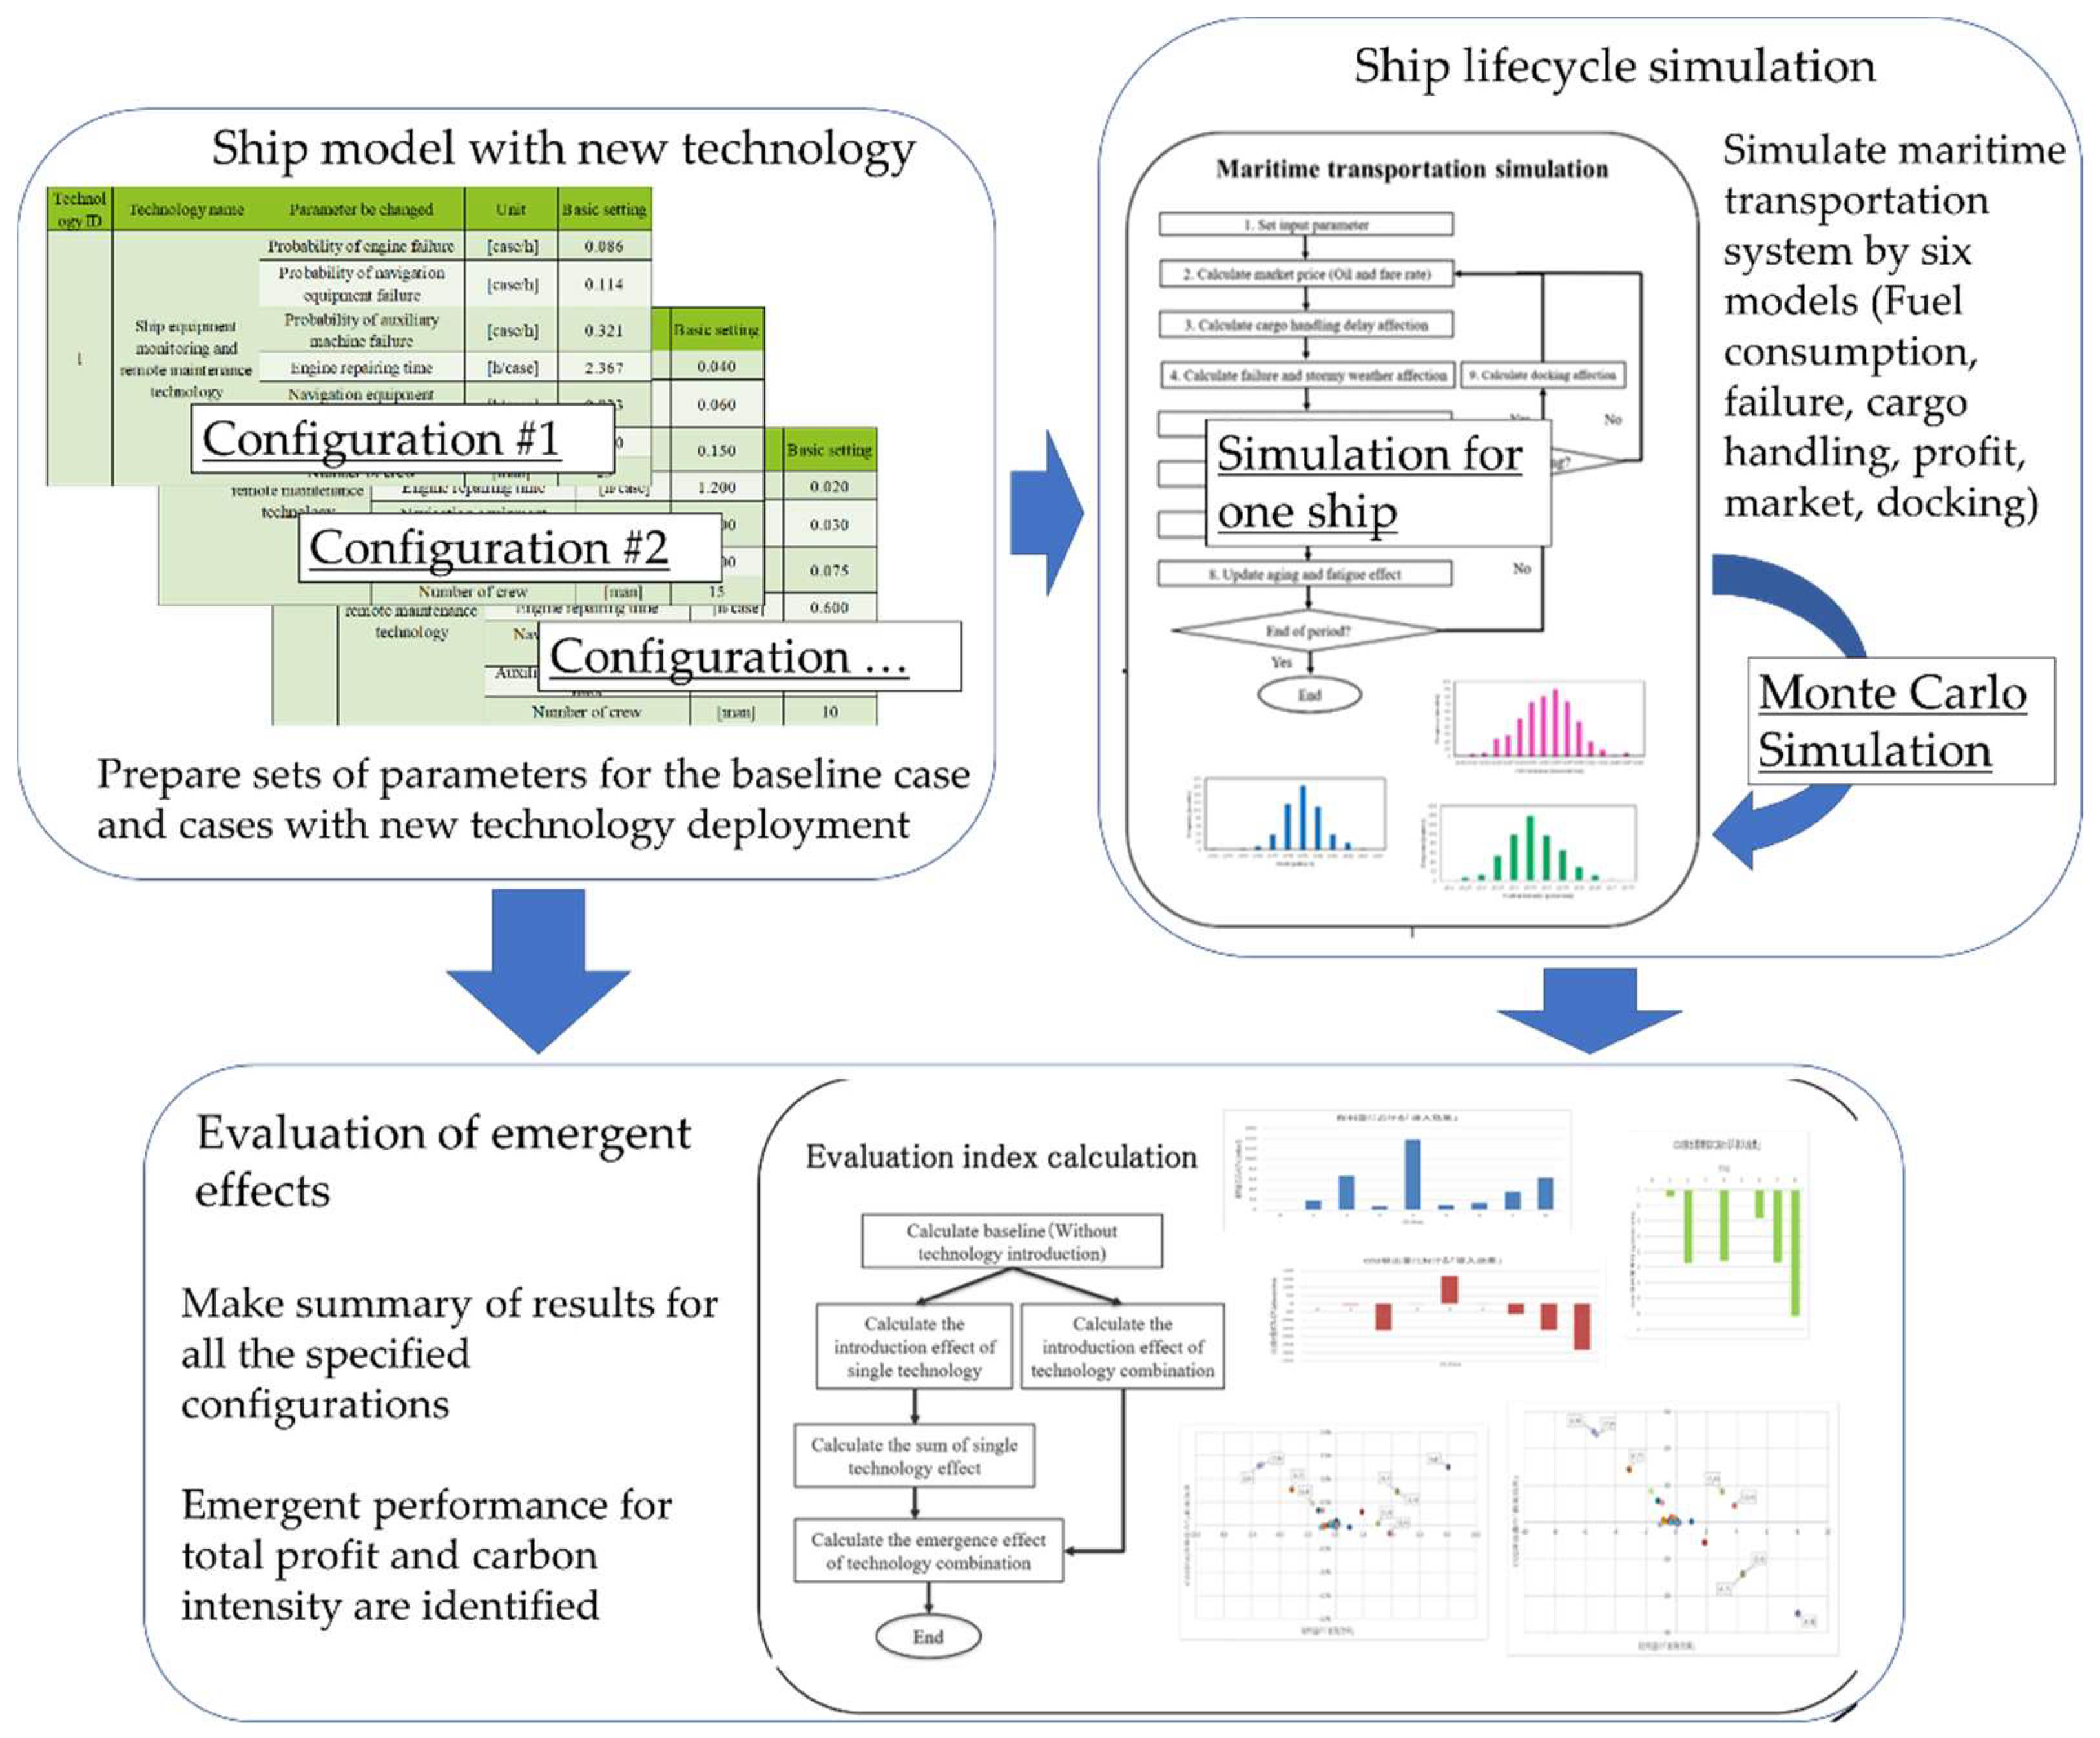
3.1. Overview of the Proposed Method
3.2. Selection and Calculation of Evaluation Indicators
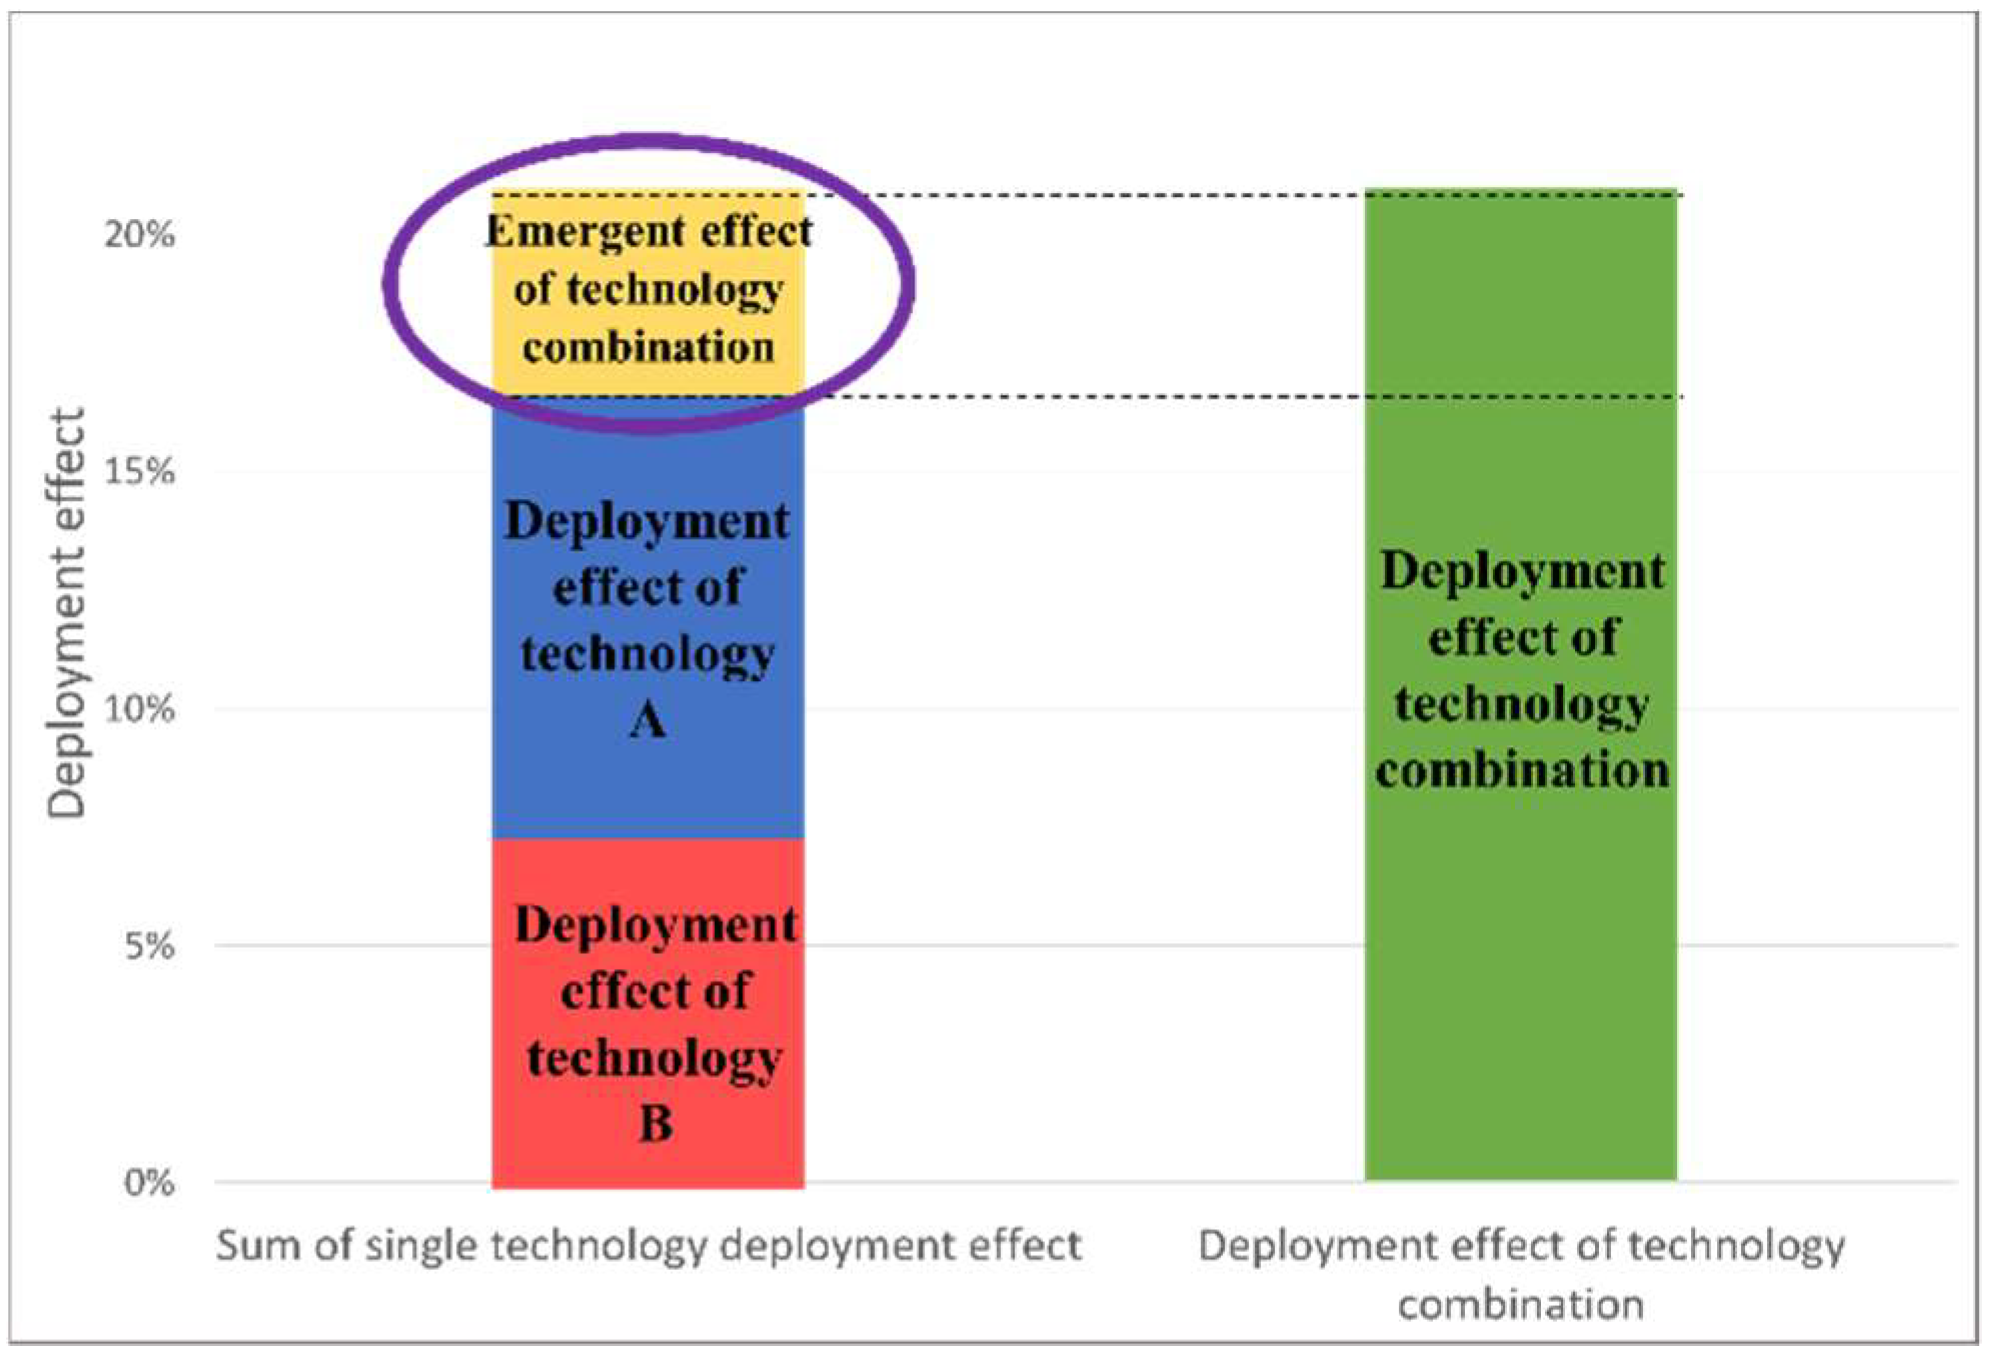
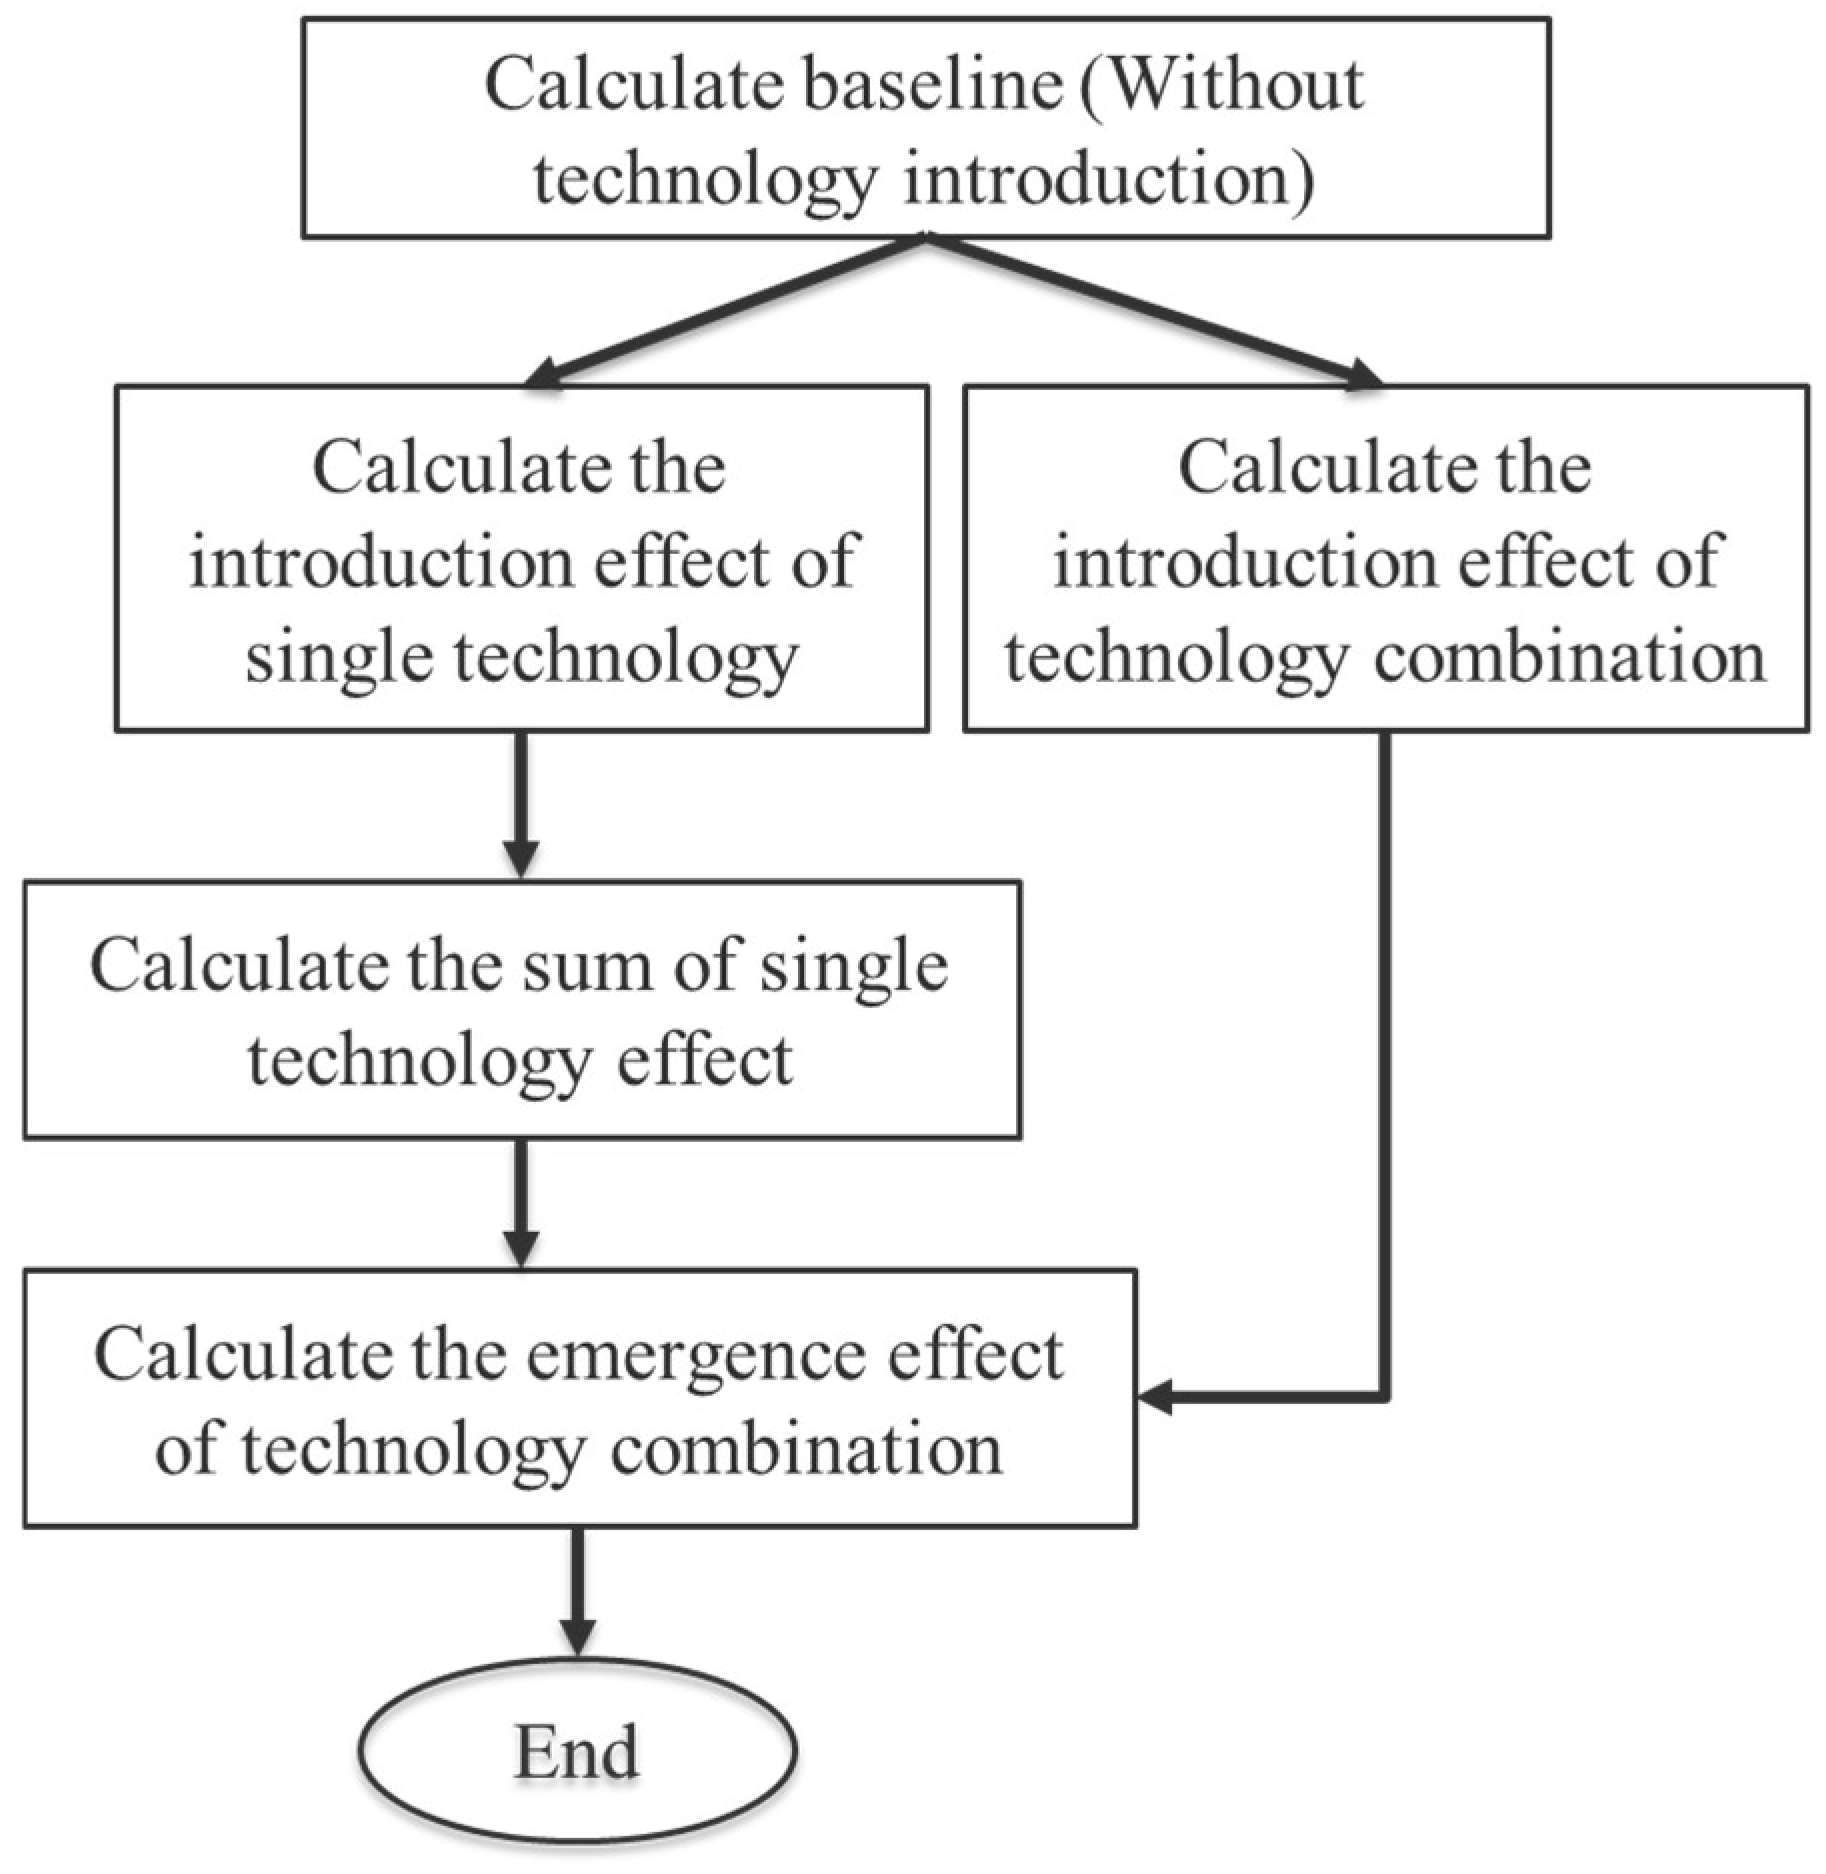
3.3. Calculating for Emergent Effects on Total Profit
- Calculate the baseline, the simulation result without deployment of technology.
- Compute the simulation with the deployment of a single technology.
- Compute the simulation with the simultaneous deployment of multiple technologies.
- Calculate the deployment effect, which is the difference between the results calculated in steps 2 and 3 and the baseline calculated in step 1.
- Calculate the sum of deployment effects, effectcombi, when deploying a combination of multiple technologies simultaneously, along with the deployment effect, effectsingle,i, when deploying multiple technologies independently. The difference between the two, as shown in step 3, is termed the emergent effect, effectcombi.
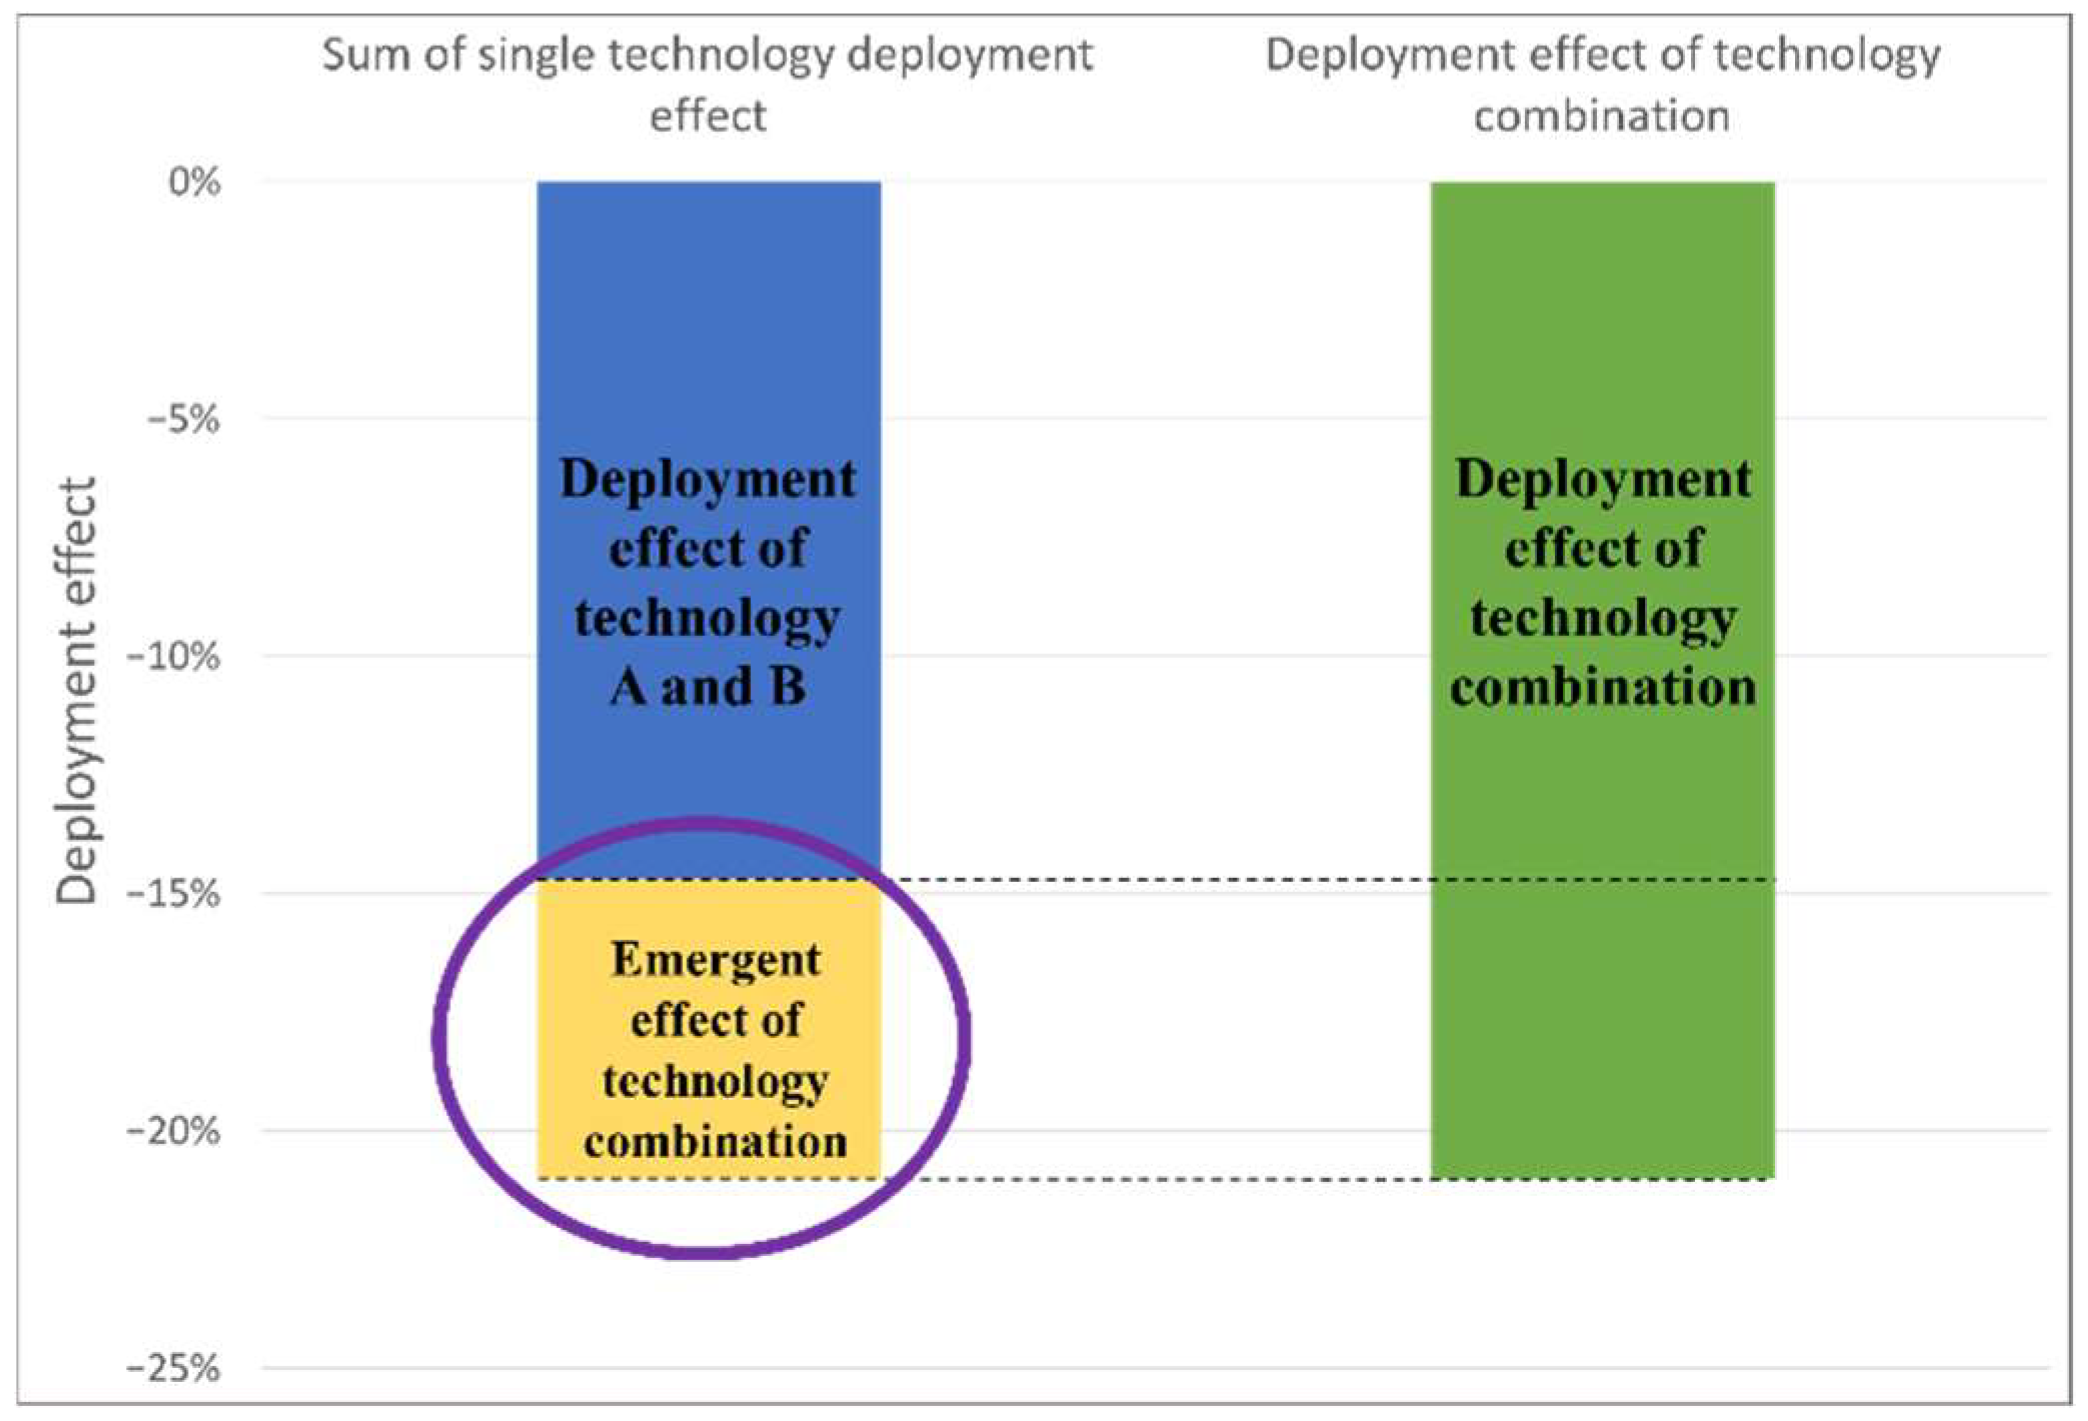
3.4. Calculating Emergent Effects on Carbon Intensity
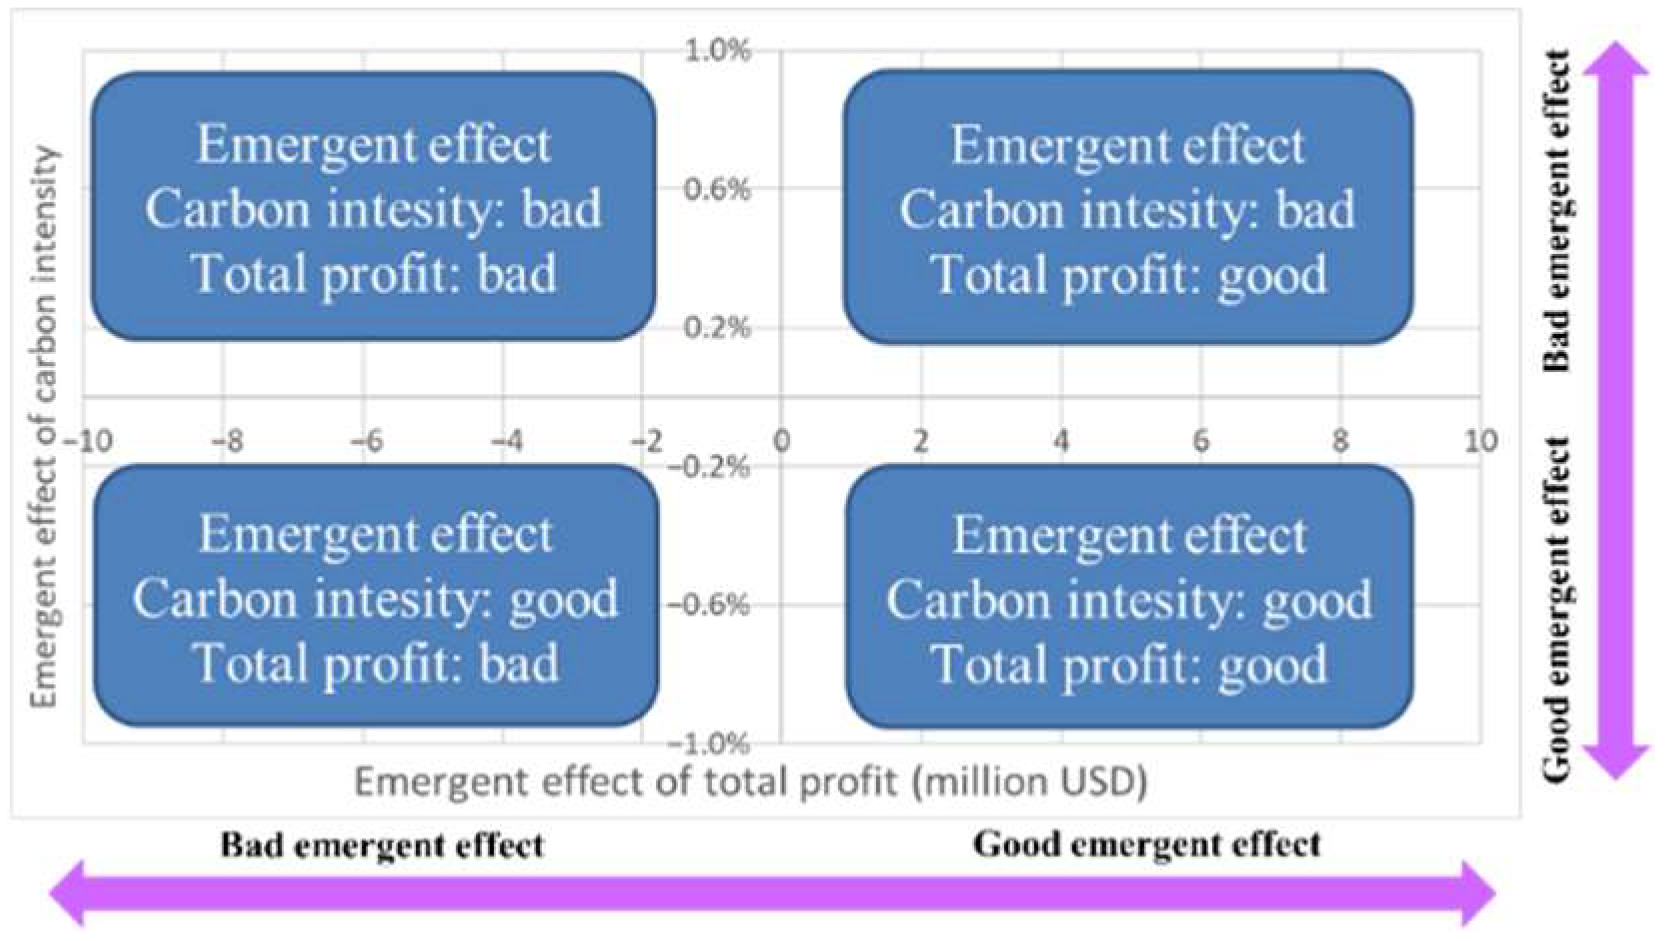
3.5. Visualization of Evaluation Indicators
3.6. Model Creation
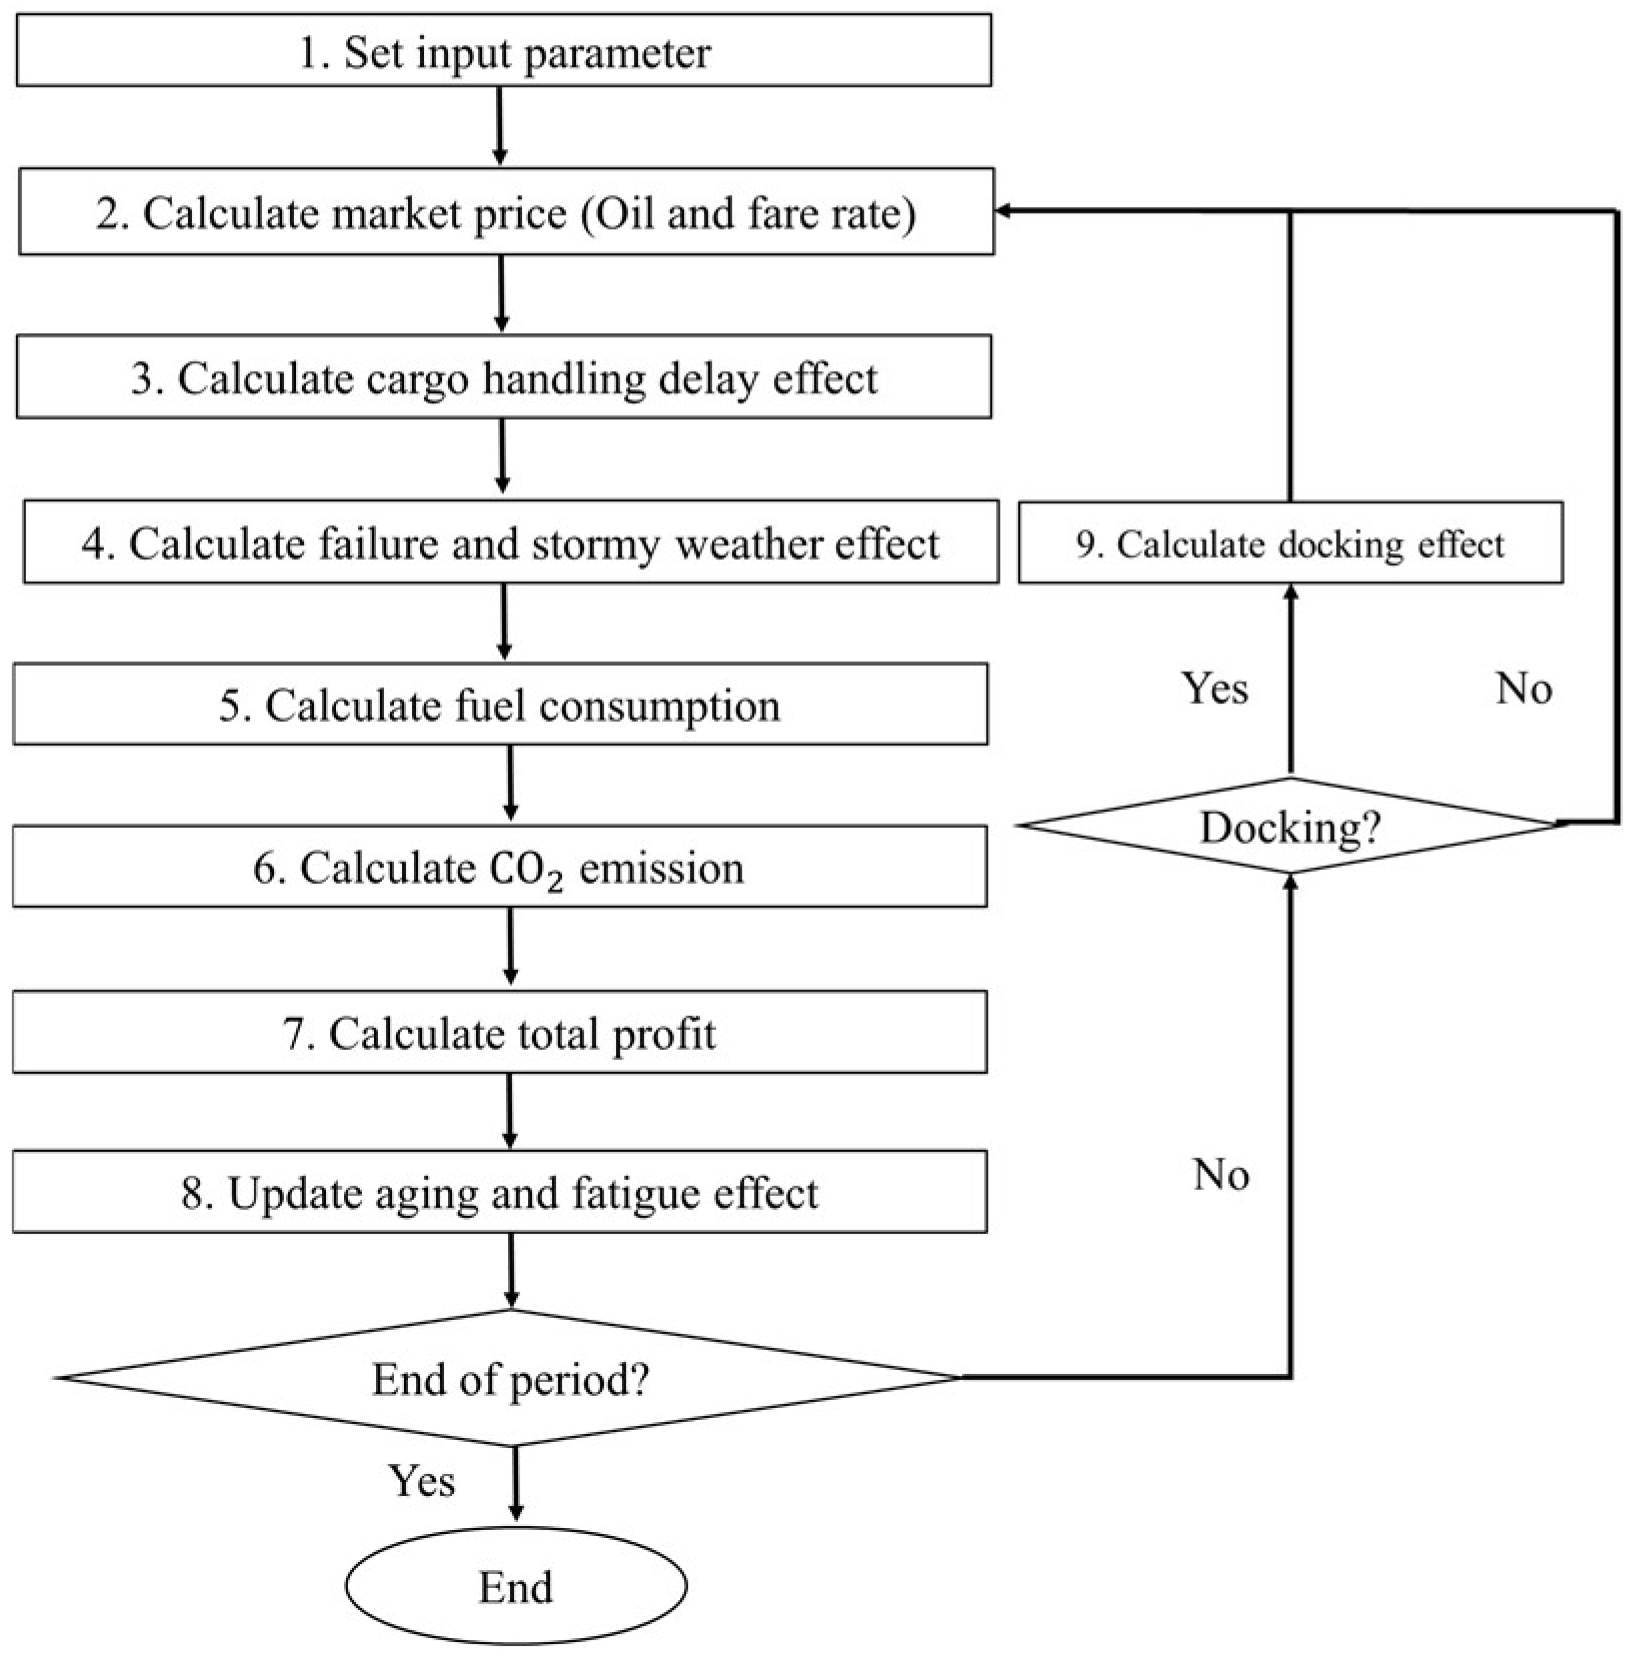
3.7. Simulation
- Initial setting: input each initial setting value and start the simulation.
- Market price calculation: calculate the crude oil price and fare rate predicted from the market model.
- Calculation of cargo handling work impact: calculate the cargo handling equipment failure and cargo handling work delay on the basis of the cargo handling model, and then calculate the associated costs.
- Meteorological and failure impact calculation: calculate the delay time and cost associated with hull and marine equipment failure on the basis of the failure and weather model.
- Calculate the fuel consumption.
- Calculate the carbon intensity.
- Profit calculation: profit is calculated from the income and cost on the basis of the profit model and then the total delay time and navigation time.
- Update of aging and fatigue effect: update the ship propulsion performance based on the aging deterioration effect of the fuel consumption model.
- Calculation of docking impact: Decide the presence or absence of docking.
- End of simulation: If the period exceeds the ship’s life cycle, calculate the total profit and average value of carbon intensity when the simulation is completed.
4. Case Study
4.1. Simulation Settings
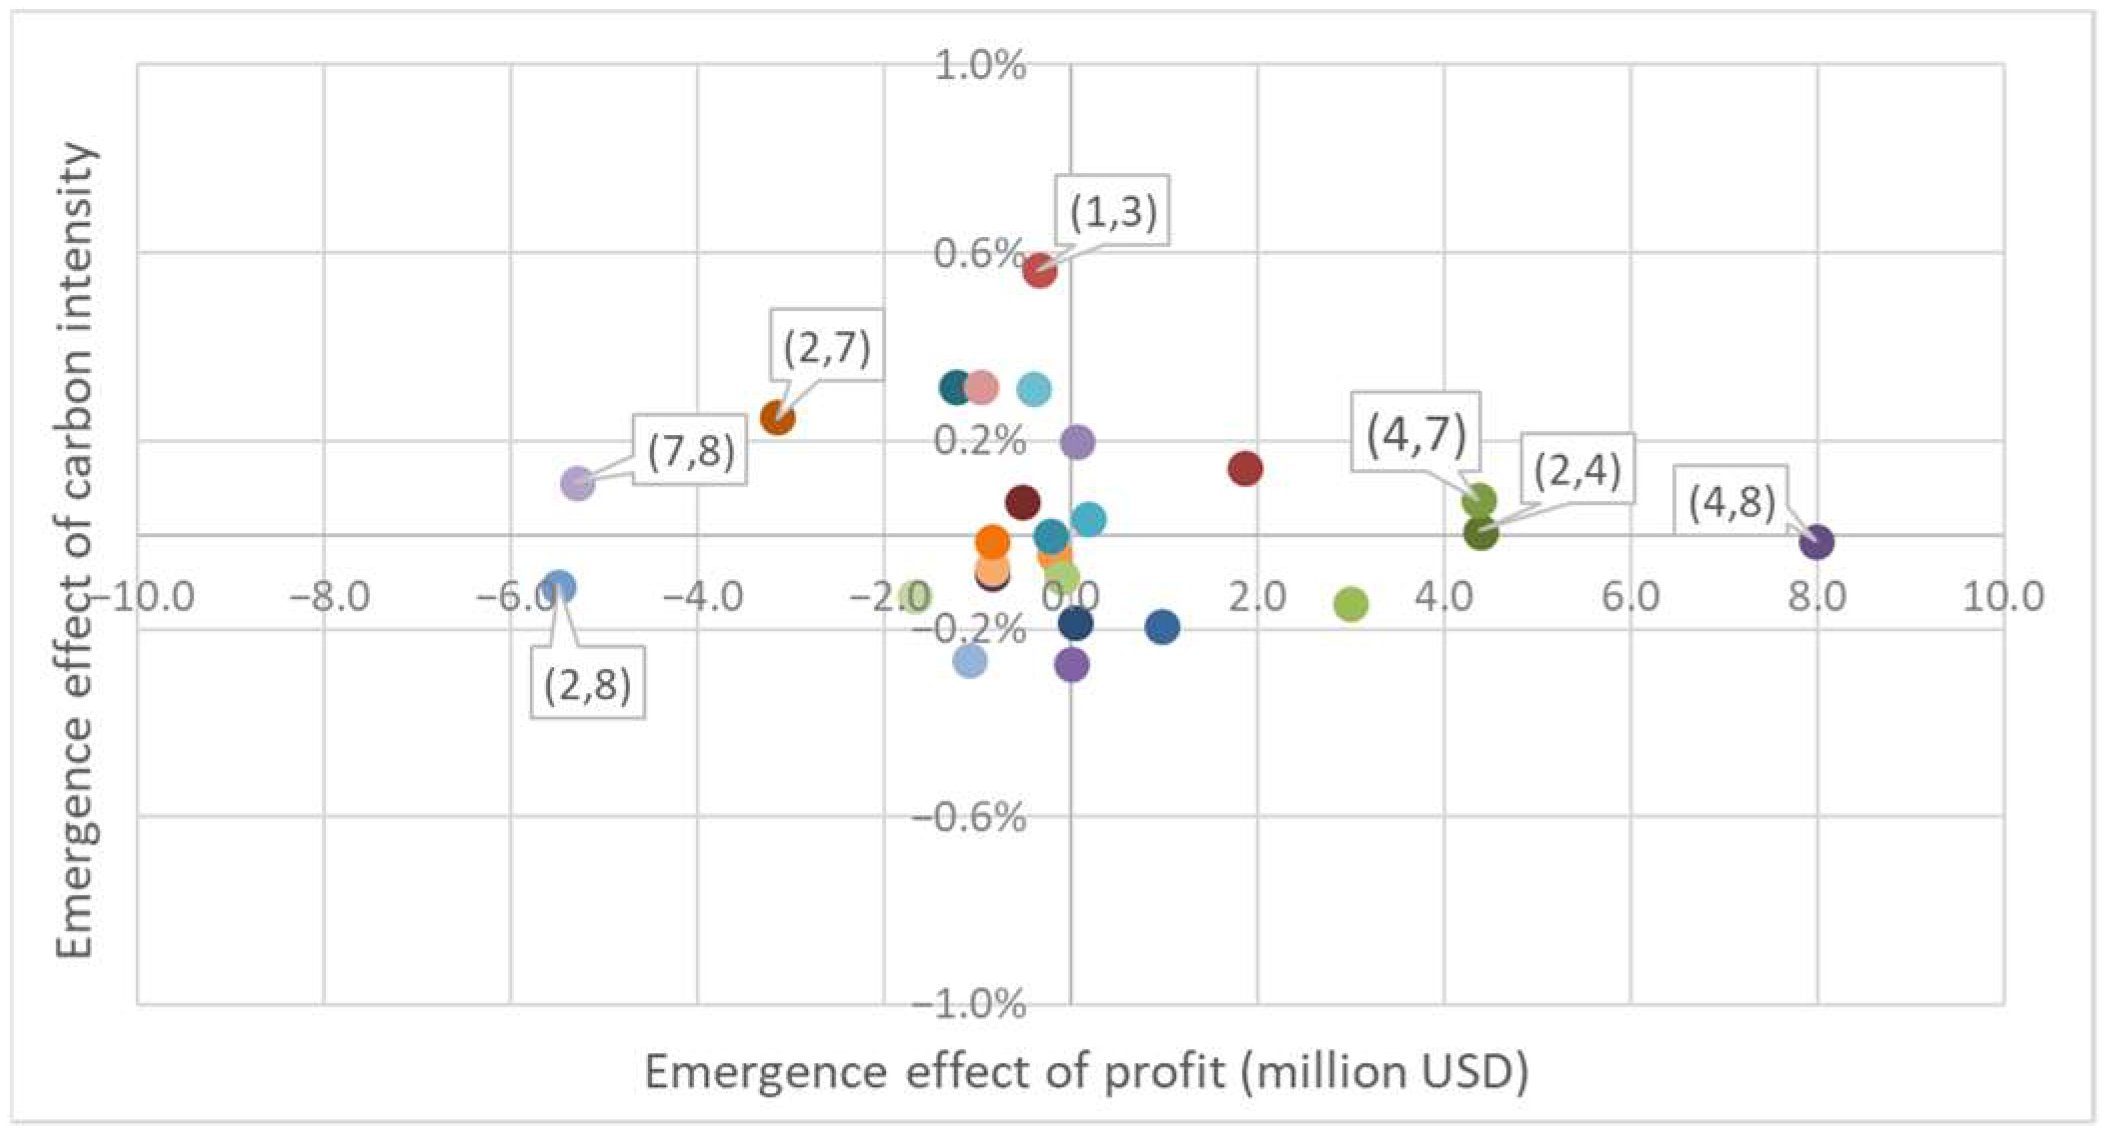
4.2. Confirmation and Analysis of Results
4.2.1. Technology IDs (4, 8)
4.2.2. Technology IDs (1, 3)
4.2.3. Technology IDs (2, 8)
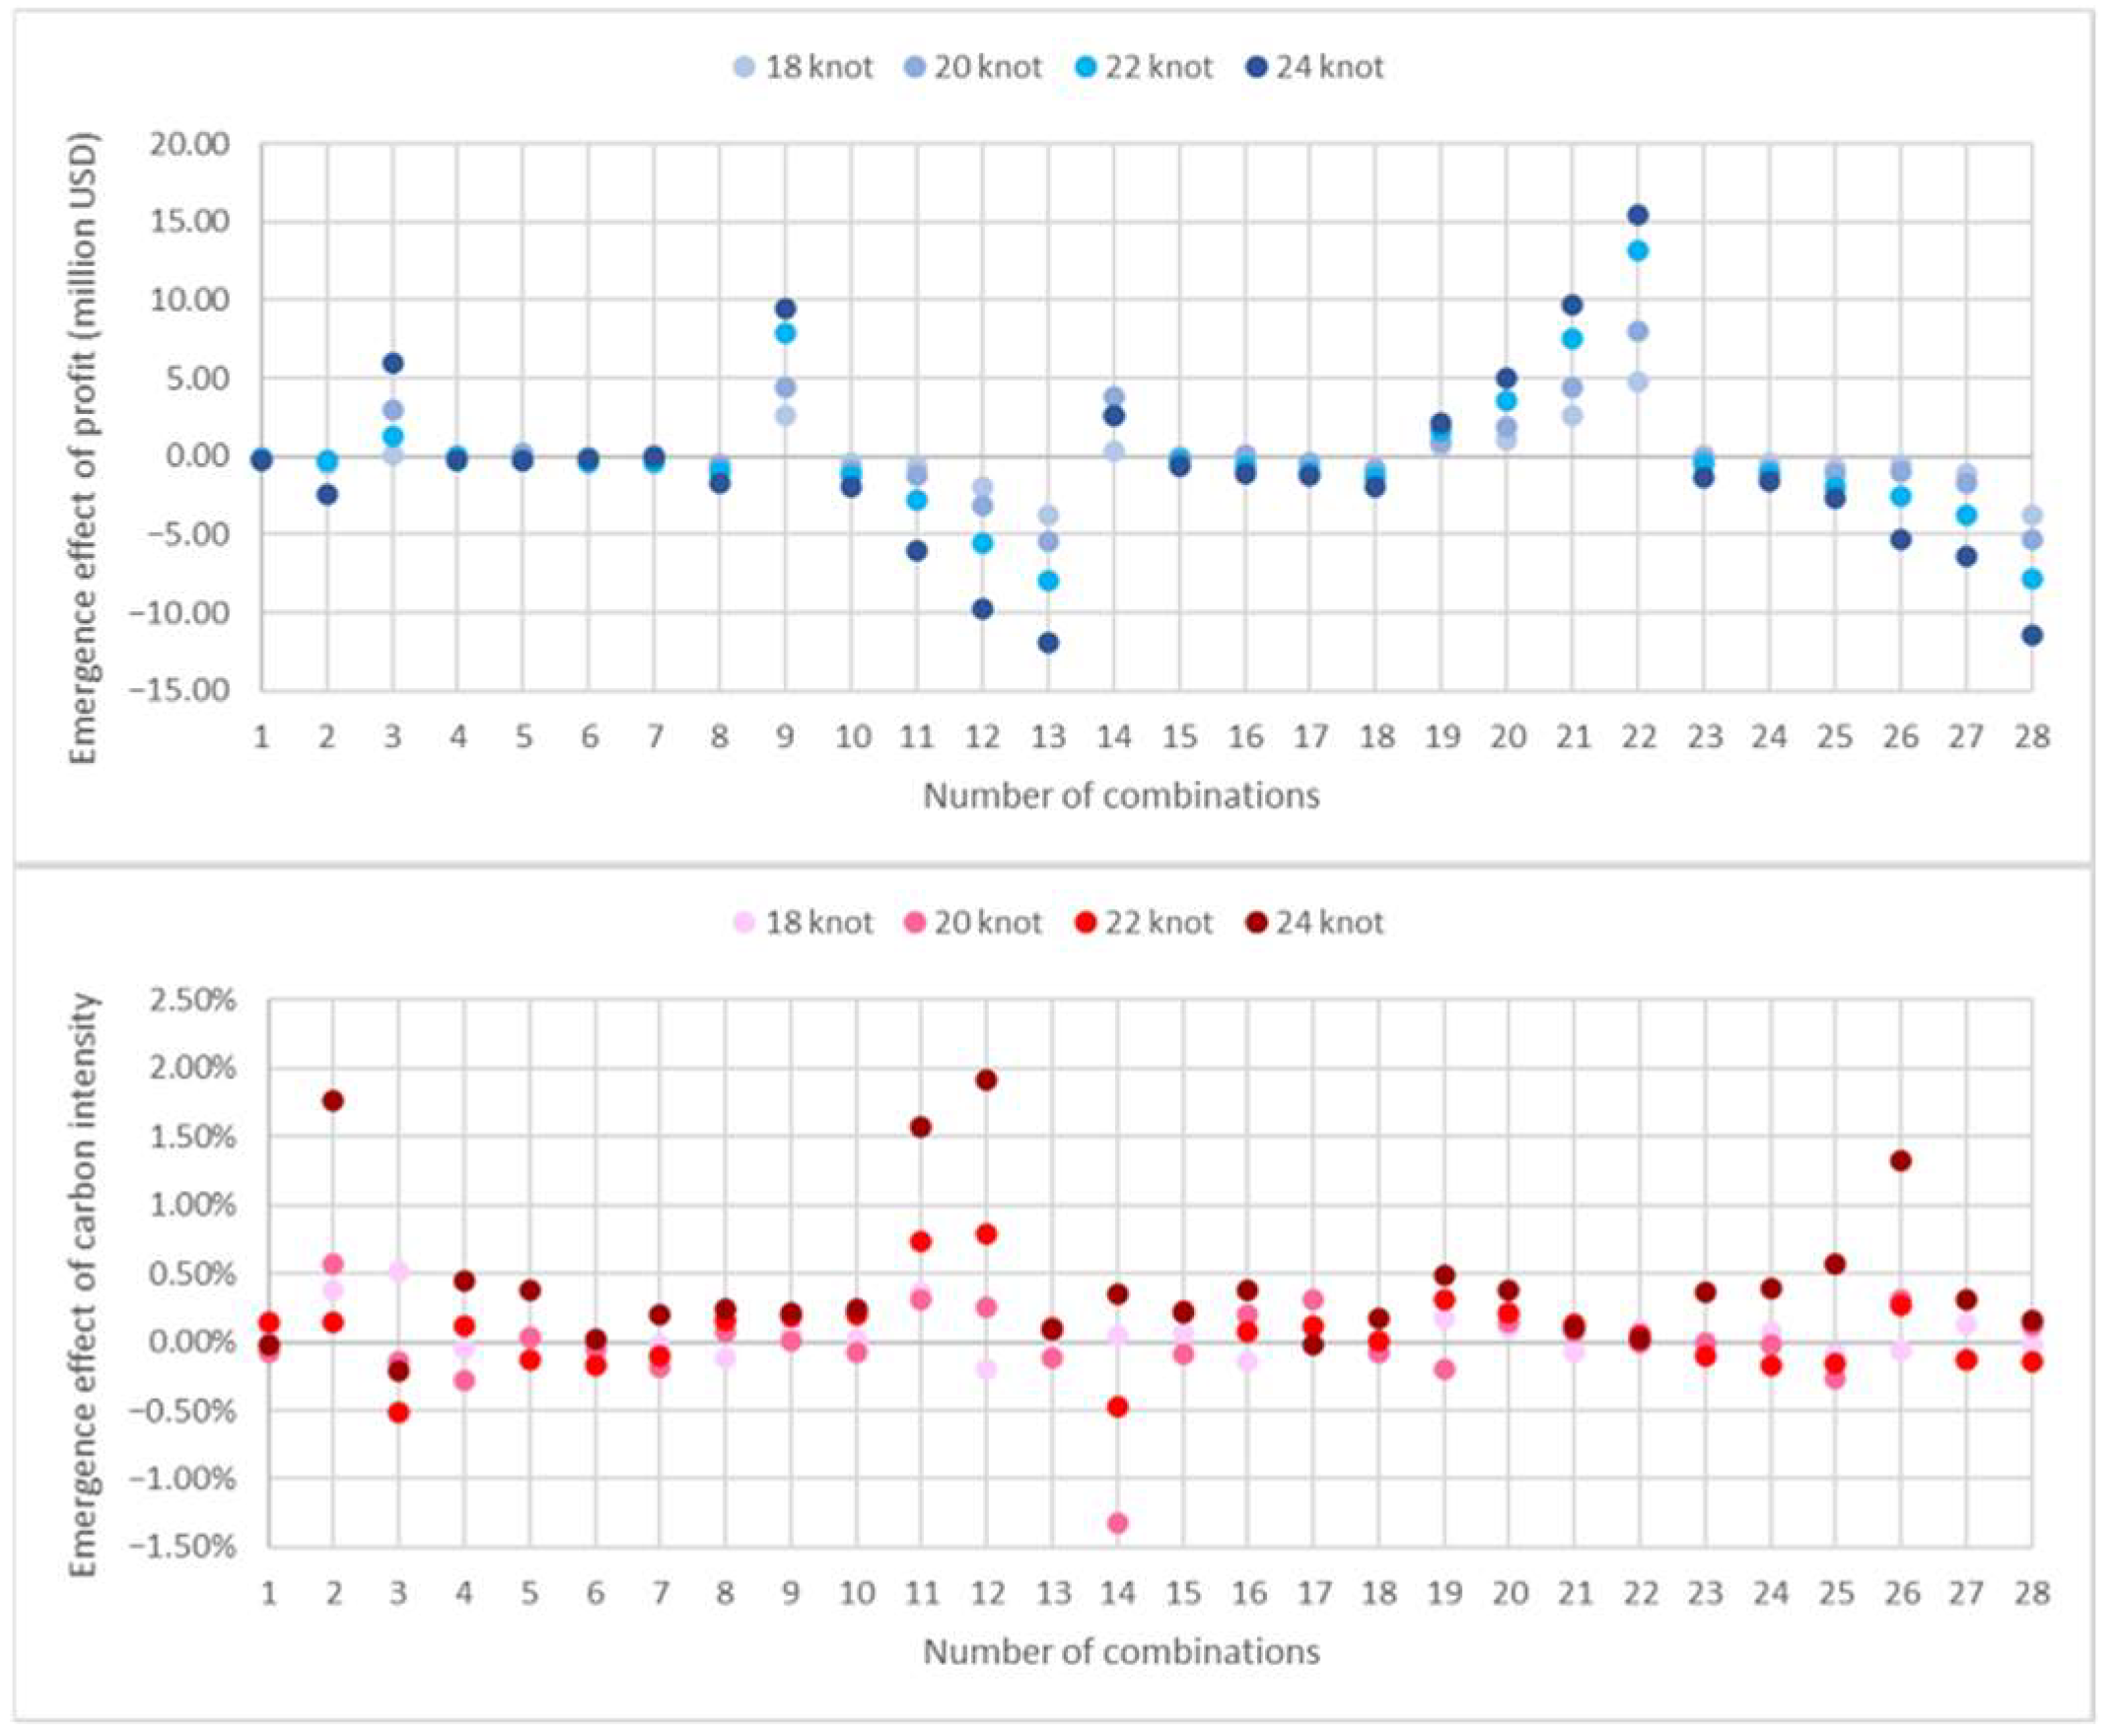
4.3. Sensitivity Analysis
5. Discussion
5.1. Discussion of the Proposed Method
5.2. Discussion of Case Studies
6. Conclusions
- From the perspective of the technology developer, a logical and practical evaluating method as well as the simulation system were established for estimating the performance regarding reducing CO2 emissions and improving the operational profit of different technologies.
- From the perspective of the decision maker, the effect of deploying the technology was quantitatively compared and evaluated on the basis of the two evaluation axes of operating profit and CO2 emissions.
- A sensitivity analysis utilizing the operating speed as the input parameter variable provided decision-making support for an appropriate velocity of the ship during navigation and the combinations of technologies that are worth being deployed at the same time.
Author Contributions
Funding
Institutional Review Board Statement
Informed Consent Statement
Data Availability Statement
Conflicts of Interest
References
- Energy Efficiency Measures. Available online: http://www.imo.org/en/OurWork/Environment/PollutionPrevention/AirPollution/Pages/Technical-and-Operational-Measures.aspx (accessed on 26 July 2021).
- UN Body Adopts Climate Change Strategy for Shipping. Available online: http://www.imo.org/en/MediaCentre/PressBriefings/Pages/06GHGinitialstrategy.aspx (accessed on 26 July 2021).
- Mitsuyuki, T.; Hiekata, K.; Yamato, H. Design of production strategy considering the cutting peak demand of electricity in the shipbuilding industry. J. Mar. Sci. Technol. 2014, 19, 425–437. [Google Scholar] [CrossRef]
- Suzuki, Y.; Yahyaei, M.; Jin, Y.; Koyama, H.; Kang, G. Simulation based process design: Modeling and applications. Adv. Eng. Inform. 2012, 26, 763–781. [Google Scholar] [CrossRef]
- Lepistö, V.; Lappalainen, J.; Sillanpää, K.; Ahtila, P. Dynamic process simulation promotes energy efficient ship design. Ocean Eng. 2016, 111, 43–55. [Google Scholar] [CrossRef]
- Nielsen, J.B.; Sandvik, E.; Pedersen, E.; Asbjørnslett, B.E.; Fagerholt, K. Impact of simulation model fidelity and simulation method on ship operational performance evaluation in sea passage scenarios. Ocean Eng. 2019, 188, 106268. [Google Scholar] [CrossRef]
- Sasa, K.; Terada, D.; Shiotani, S.; Wakabayashi, N.; Ikebuchi, T.; Chen, C.; Takayama, A.; Uchida, M. Evaluation of ship performance in international maritime transportation using an onboard measurement system—In case of a bulk carrier in international voyages. Ocean Eng. 2015, 104, 294–309. [Google Scholar] [CrossRef]
- Alderson, D.L.; Funk, D.; Gera, R. Analysis of the global maritime transportation system as a layered network. J. Transp. Secur. 2019, 13, 291–325. [Google Scholar] [CrossRef]
- Carotenuto, P.; Giordani, S.; Zaccaro, A. A simulation based approach for evaluating the impact of maritime transport on the inventory levels of an oil supply chain. Transp. Res. Procedia 2014, 3, 710–719. [Google Scholar] [CrossRef] [Green Version]
- Zhang, X.; Lin, J.; Guo, Z.; Liu, T. Vessel transportation scheduling optimization based on channel–berth coordination. Ocean Eng. 2016, 112, 145–152. [Google Scholar] [CrossRef]
- Kim, B.; Kim, T.-W. Monte Carlo simulation for offshore transportation. Ocean Eng. 2017, 129, 177–190. [Google Scholar] [CrossRef]
- Alamilla, J.L.; Campos, D.; Ortega, C.; Soriano, A.; Morales, J.L. Optimum selection of design parameters for transportation of offshore structures. Ocean Eng. 2009, 36, 330–338. [Google Scholar] [CrossRef]
- DNV GL. Beyond Condition Monitoring in the Maritime Industry; DNV GL Strategic Research and Innovation Position Paper 6-2014; DNV GL: Oslo, Norway, 2014. [Google Scholar]
- Xisong, D.; Gang, X.; Xiujiang, G.; Yuantao, L.; Yisheng, L. Intelligent Ports Based on Internet of Things, Service Operations and Logistics, and Informatics. In Proceedings of the 2013 IEEE International Conference on Service Operations and Logistics, and Informatics, Dongguan, China, 28–30 July 2013. [Google Scholar]
- Hiekata, K.; Wanaka, S.; Mitsuyuki, T.; Ueno, R.; Wada, R.; Moser, B. Systems analysis for deployment of internet of things (IoT) in the maritime industry. J. Mar. Sci. Technol. 2020, 26, 459–469. [Google Scholar] [CrossRef]


| Tech. ID | Parameter | Basic Value | Changed Value |
|---|---|---|---|
| 1 | Hull weight ratio | 1 | 0.9 |
| 2 | Propeller efficiency | 0.8 | 0.88 |
| 3 | Basic cargo handling time | 48 | 24 |
| Simulation ID | Technology Combination | Parameter Be Changed | Unit | Basic Setting | After Changing |
|---|---|---|---|---|---|
| 1 | Ship equipment monitoring and remote maintenance technology | Probability of engine failure | case/h | 0.086 | 0.040 |
| Probability of navigation equipment failure | case/h | 0.114 | 0.060 | ||
| Probability of auxiliary machine failure | case/h | 0.321 | 0.150 | ||
| Engine repairing time | h/case | 2.367 | 1.200 | ||
| Navigation equipment repairing time | h/case | 0.933 | 0.500 | ||
| Auxiliary machine repairing time | h/case | 2.150 | 1.000 | ||
| Number of crew | man | 25 | 15 | ||
| 2 | Ship weight reduction | The weight ratio of ship | - | 1 | 0.9 |
| 3 | Weather-routing technology | Distribution of probability of encountering stormy weather (Spring) | - | Beta (2, 2) | Beta (2, 5) |
| Distribution of probability of encountering stormy weather (Autumn) | - | Beta (2, 2) | Beta (2, 5) | ||
| 4 | Port management system | Standard cargo-handling time | h | 48 | 24 |
| Distribution of cargo-handling operation delay time | - | Beta (2, 2) | Beta (2, 5) | ||
| Probability of cargo-handling operation delay | case/port | 0.1 | 0.06 | ||
| Probability of port facility failure | case/port | 0.010 | 0.005 | ||
| Port facility repairing time | h/case | 24 | 12 | ||
| 5 | Data analysis in real ship operation | Distribution of fuel consumption increase probability | - | Beta (2, 2) | Beta (2, 5) |
| 6 | Hull performance-improving technology | Wave drag auxiliary coefficient (Cw0, Cw1, Cw2) | - | −1.07 × 10⁻⁴ | −9.07 × 10⁻⁵ |
| - | 7.44 × 10⁻⁶ | 6.32 × 10⁻⁶ | |||
| - | 4.23 × 10⁻⁶ | 3.59 × 10⁻⁶ | |||
| 7 | Propeller performance-improving technology | Propeller ship-behind efficiency | - | 0.8 | 0.88 |
| 8 | Engine performance-improving technology | Fuel consumption rate coefficient (SFOC0, SFOC1, SFOC2) | - | 191.66 | 162.91 |
| - | −45.58 | −38.74 | |||
| - | 25.51 | 2.69 |
| Simulation ID | Technology Combination | Simulation ID | Technology Combination | Simulation ID | Technology Combination |
|---|---|---|---|---|---|
| 1 | 1, 2 | 10 | 2, 5 | 19 | 4, 5 |
| 2 | 1, 3 | 11 | 2, 6 | 20 | 4, 6 |
| 3 | 1, 4 | 12 | 2, 7 | 21 | 4, 7 |
| 4 | 1, 5 | 13 | 2, 8 | 22 | 4, 8 |
| 5 | 1, 6 | 14 | 3, 4 | 23 | 5, 6 |
| 6 | 1, 7 | 15 | 3, 5 | 24 | 5, 7 |
| 7 | 1, 8 | 16 | 3, 6 | 25 | 5, 8 |
| 8 | 2, 3 | 17 | 3, 7 | 26 | 6, 7 |
| 9 | 2, 4 | 18 | 3, 8 | 27 | 6, 8 |
| 28 | 7, 8 |
| Tech. ID | Technology Name |
|---|---|
| 1 | Ship equipment monitoring and remote maintenance technology |
| 2 | Ship weight reduction |
| 3 | Weather routing |
| 4 | Port management system |
| 5 | Data analysis in real ship operation |
| 6 | Hull performance improving technology |
| 7 | Propeller performance improving technology |
| 8 | Engine performance improving technology |
Publisher’s Note: MDPI stays neutral with regard to jurisdictional claims in published maps and institutional affiliations. |
© 2022 by the authors. Licensee MDPI, Basel, Switzerland. This article is an open access article distributed under the terms and conditions of the Creative Commons Attribution (CC BY) license (https://creativecommons.org/licenses/by/4.0/).
Share and Cite
Hiekata, K.; Zhao, Z. Decision Support System for Technology Deployment Considering Emergent Behaviors in the Maritime Industry. J. Mar. Sci. Eng. 2022, 10, 263. https://doi.org/10.3390/jmse10020263
Hiekata K, Zhao Z. Decision Support System for Technology Deployment Considering Emergent Behaviors in the Maritime Industry. Journal of Marine Science and Engineering. 2022; 10(2):263. https://doi.org/10.3390/jmse10020263
Chicago/Turabian StyleHiekata, Kazuo, and Zhinan Zhao. 2022. "Decision Support System for Technology Deployment Considering Emergent Behaviors in the Maritime Industry" Journal of Marine Science and Engineering 10, no. 2: 263. https://doi.org/10.3390/jmse10020263
APA StyleHiekata, K., & Zhao, Z. (2022). Decision Support System for Technology Deployment Considering Emergent Behaviors in the Maritime Industry. Journal of Marine Science and Engineering, 10(2), 263. https://doi.org/10.3390/jmse10020263