Article

Assessing the Environmental Performances of Urban Roundabouts Using the VSP Methodology and AIMSUN

1
Department of Engineering, University of Palermo, Viale delle Scienze ed 8, 90128 Palermo, Italy
2
Centre for Mechanical Technology and Automation (TEMA), Department of Mechanical Engineering, Campus Universitario de Santiago, University of Aveiro, 3810-193 Aveiro, Portugal
3
Faculty of Engineering and Architecture, University of Enna Kore, Viale delle Olimpiadi, 94100 Enna, Italy
4
Department of Transport Systems, Traffic Engineering and Logistics, Faculty of Transport and Aviation Engineering, Silesian University of Technology, Krasinskiego 8 Street, 40-019 Katowice, Poland
*
Author to whom correspondence should be addressed.
Energies 2022, 15(4), 1371; https://doi.org/10.3390/en15041371
Submission received: 28 December 2021 / Revised: 1 February 2022 / Accepted: 10 February 2022 / Published: 14 February 2022

Abstract

:
In line with globally shared environmental sustainability goals, the shift towards citizen-friendly mobility is changing the way people move through cities and road user behaviour. Building a sustainable road transport requires design knowledge to develop increasingly green road infrastructures and monitoring the environmental impacts from mobile crowdsourced data. In this view, the paper presents an empirically based methodology that integrates the vehicle-specific power (VSP) model and microscopic traffic simulation (AIMSUN) to estimate second-by-second vehicle emissions at urban roundabouts. The distributions of time spent in each VSP mode from instantaneous vehicle trajectory data gathered in the field via smartphone were the starting point of the analysis. The versatility of AIMSUN in calibrating the model parameters to better reflect the field-observed speed-time trajectories and to enhance the estimation accuracy was assessed. The conversion of an existing roundabout within the sample into a turbo counterpart was also made as an attempt to confirm the reproducibility of the proposed procedure. The results shed light on new opportunities in the environmental performance evaluation of road units when changes in design or operation should be considered within traffic management strategies and highlighted the potential of the smart approach in collecting big amounts of data through digital communities.

1. Introduction

Urban mobility is going through a time of great change and road user needs are changing with it [1]. Since the Paris Agreement, sustainable urban mobility has become a key concept to achieve the goals set with respect to climate change, economic growth and road safety [2,3]. Owing to their predominant role in promoting the sustainable mobility and transport, road infrastructure issues are of special concern. The new forms of personal micro-mobility on the market, and new technologies in autonomous driving call for road infrastructures suited to meet the industrial challenges posed by the decarbonization and digitalization of the urban transport system [4,5]. The question is now whether the (invisible) network of digital technology systems may really be conceived as the “infrastructure” of the (visible) networks of road infrastructures whose efficiency is increasingly linked to the use of Internet of Things (IoT)-based devices and Information and Communication Technologies (ICT) tools under normal or crises conditions [4]. Despite the perspective of a close link between the invisible network of digital technology in operational systems and the visible networks of road infrastructures, the introduction of the new technologies and services for smart roads and the penetration rate of modern vehicle technologies are still slow; at the same time, the adaptation of vehicle fleet to new emission rules set at national, European and international levels is still proceeding on the basis of the physiological replacement rate of old vehicles by new ones [6]. Nowadays, there is a great potential for the widespread development of computing platforms to support distributed mobile sensing due to the extensive employ of always-connected smartphones and mobile devices as a link between people and things also to monitor the health and environmental impacts of air pollution from vehicles and to analyse risky driving events and road infrastructure conditions [7,8]. Although safer and environmentally friendly management of urban mobility is recognized as crucial for contributing to a greener future, the impact of new engineering solutions which are, individually and in combination, at different levels of maturity is not entirely clear [9]. Hence a sustainable urban mobility strategy has to incorporate a well-balanced set of policies, planning methods and measures to transit to a carbon-neutral status [10,11].
For the reasons given, estimation of exhaust emissions of car engines is still an active field of research. Road-related air quality management has based the estimation of vehicular traffic emissions mainly on average speed-based approaches and instantaneous (modal) models [12,13]. The average speed-based approaches rely on emission functions derived from measurements of the emission rates over a wide range of driving patterns at different levels of speed. Since these approaches do not capture the differences in emissions estimates due to the changes in modal activity, their usual applications concern emission inventories for large geographical areas at the road network level [12]. In turn, the instantaneous (modal) models describe the emissive behaviour of vehicles at the microscale level by relating emission rates to vehicle operation over a short time interval; they usually use vehicle activity parameters to estimate second-by-second emission rates and vehicle fuel consumption [14,15]. The average emission rates derived from vehicles and integrated into commonly used emission models, however, have returned in some experiences great differences between the predicted and field-based measured emissions for individual vehicles [13,16]. Recent experiences in connected eco-driving on signalised arterial corridors have highlighted the advantages of real-time traffic sensing and cloud platforms for applications as well as information services for networked cars and infrastructure with the purpose of reducing emissions and fuel consumption; thus, the integrated use of communications technology can offset current (macroscale or mesoscale) emission models in capturing differences among deceleration, acceleration, idling and cruising modes on the same road unit [17]. Despite the extensive applications of mobile-source emissions models at the macroscopic level (e.g., the Computer Programme to calculate Emissions from Road Transport (COPERT) model [18]; the EMission FACtors (EMFAC) model [19,20], the Transport Emission Model for Line Sources (TREM) [21]), or mesoscopic level (e.g., Signalised and unsignalised Intersection Design and Research Aid software (Sidra Intersection) [22]; Mobile Source Emission Model [23]), the modal emissions models are sensitive to changes in vehicle speed and acceleration and are used to evaluate operational level projects for arterials and intersections [24]. In the case of the Comprehensive Modal Emissions Model (CMEM) [25] second-by-second engine-out emissions, fuel consumption, and tailpipe emissions of carbon monoxide (CO), carbon dioxide (CO2), hydrocarbon (HC), and nitrogen oxides (NOx) can be predicted for different modal operations from driving cycle data of light-duty vehicles in different driving conditions. However, the emission model should be corrected to accurately calculate CO2 emissions on urban roads for a traffic speed below 20 km/h [26]. In turn, the Vehicle Specific Power (VSP) methodology is able of capturing the dependence of emissions on speed and its changes, and the effect of roadway grade on engine power demand [14]. In this view, the EPA’s MOtor Vehicle Emission Simulator (MOVES) estimates emissions for mobile sources at the national-level, county-level and project-level for criteria air pollutants, greenhouse gases and air toxics, and uses VSP and instantaneous speed as basic variables [27]. Other models have been developed for passenger cars with the purpose of linking real-world emissions to driving cycle characteristics at a microscale level and have been already employed for traffic management, control measures, air quality modelling; e.g., [28]. The use of Global Positioning System (GIS) technologies and on-board diagnostics devices in collecting second-by-second trajectory data give now great flexibility to calculate vehicle emissions in the real-world, since the emissions estimates can be allocated spatially [29,30]. Literature also informs on capabilities of microscopic traffic simulation models to produce emissions and fuel consumption data related to dynamic traffic-flow conditions on the road entity or network [31]. However, there is still not enough evidence to suggest that accurate vehicle speed and acceleration data (or their probability distributions) may be provided due to inadequate car-following equations and challenges with modelling the driver behaviour on multi-lane roadways [32]. Nevertheless, research efforts to improve both capability of microsimulation models to replicate realistic traffic behaviour or vehicle trajectory data, and traffic generation accuracy at the network or single node level, can be especially useful for managing traffic safety and environmental issues on urban roads because microsimulation allows the modelling of engineering solutions for road infrastructures and their traffic conditions, sometimes difficult to observe in the real world or not yet implemented in the field.

The Aim of the Paper

Given the role played by the environmental impact assessment in raising awareness of sustainability issues at the road design level, a research project was started having the general objective to develop a methodological approach which combines the employ of the VSP methodology and a microscopic traffic simulation model to estimate vehicle emissions at urban roundabouts.
In this view, the paper investigated the following research question: can fine-tuning adjustments of some vehicle attributes of a traffic model simulation be made to enable a better match of speed profiles experienced through roundabouts and to improve the emission estimations calculated by employing vehicle trajectory data? Trying to answer the above question simultaneously represented the primary objective of the research reported in this paper.
A sample of six roundabouts installed in the road network of Palermo City, Italy, was the starting point to collect vehicle trajectory data and to test the proposed approach also with reference to specific effects of the curvilinear design of the roundabouts on the emissive phenomenon. The novel aspect of the research is that data collection was inspired by a crowdsensing logic [7], where a “sentinel vehicle” here used as a test vehicle travels through the selected road entities to acquire vehicle trajectory data by using a smartphone installed on board. Thus, beyond being an economic data acquisition method, it allows that the collected vehicle trajectory data can be processed immediately to return the observed speed-time profiles and to obtain the vehicle acceleration and deceleration values.
To pursue the objectives outlined above, to start the calibration process of the microscopic traffic simulation model here used and to estimate emissions by applying the VSP methodology [14], speed-time profiles both gathered in the field and simulated in AIMSUN [33] were needed. The comparison between the second-by-second GPS trajectories collected by a smartphone app in a test vehicle and individual second-by-second vehicle speed profiles derived from AIMSUN called for model calibration. In relation to the research objectives defined above, the versatility of the micro-simulation model to explain emissions was explored. Another novel aspect was that the roundabout network models were calibrated using the mean values of the 85th or 95th percentiles of the accelerations and decelerations extracted from all the field observed trajectories regardless of driving direction through the roundabouts.
A further important objective also involved the conversion of an existing roundabout within the sample into a turbo counterpart; this was made as an attempt to confirm the applicability and reproducibility of the proposed procedure. Insights gained from this model validation also included how to assess and compare alternative designs from an environmental perspective.
Thus, the main considerations of the study concern the feasibility of the smart approach which integrated the use of real-world and simulated vehicle activity data to estimate emissions at urban roundabouts.
The paper is structured as follows. Section 2 presents a literature review on current models and methods for estimating emissions at roundabouts, while Section 3 introduces the sampled roundabouts, and traffic and trajectory data collection. Section 4 presents AIMSUN modelling, calibration and results; the last ones will be discussed in Section 5, while Section 6 gives some conclusive considerations.

2. Literature Review

The operating flexibility of roundabouts in urban settings where competing needs of safety, capacity and costs coexist, is due to the aptitude of the curvilinear design to reduce stops and delays compared to other forms of intersection control, and to moderate speeds and to reduce speed changes of vehicles [34]. Planning a roundabout should include potential trade-offs between design, operations, and safety issues based on an economic feasibility study showing that a roundabout may compare favourably with alternative design or control modes of intersection from a cost-benefit perspective [35]. However, a transition toward greener road infrastructures also needs tools to assess the impact of new road infrastructural projects from an environmental perspective; e.g., [36].
Literature reports some studies on the contribution of roundabouts to the emission phenomenon, most of them relate to the employ of existing models using data from a portable emissions monitor on a vehicle instrumented for calculating exhaust emissions; e.g., [16,37,38,39,40]. It should be noted that macroscale-level models are not suitable for testing objects on a microscale level such as roundabouts [16,38]; however, the employ of microscopic traffic simulation models for estimating emissions on roundabouts is still limited.
Hallmark et al. [37] assessed the emission impacts of roundabouts along uncongested corridors using a portable emissions monitor on an instrumented vehicle. Compared to other types of traffic control, roundabouts either as isolated units or multiple schemes increased the time spent in some modal states and the modal events at which emissions were correlated; thus, they did not always provide lower emissions than unsignalised or signalised intersections. Coelho et al. [38] proposed a VSP-based approach to assess emissions at roundabouts. They assessed the role of the entry and exit geometry on differences between the circulating and cruise speeds and found that high rates of acceleration to reach the cruise speed increased the amount of emissions as the values of conflicting traffic volumes increased. Salamati et al. [39] extended the employ of the VSP-based methodology to multi-lane roundabouts. Findings showed higher emission rates in the right lane where faster speeds and sharper acceleration or deceleration rates occurred at values less than 700 vph for the sum of entry and circulating flows; as demand increased, however, balanced between the entry lanes, longer stop-and-go cycles suffered by entering vehicles from the left lanes provided higher emission rates. However, the differences in emission estimates between the left- and right-lanes should be redefined with greater depth with reference to more homogeneous roundabout samples. Fernandes et al. [40] also employed the VSP distributions derived from speed-travel time profiles detected throughout an arterial road where roundabouts operated as isolated sites. Besides hotspots where high speeds caused high emissions, acceleration, and deceleration events, and then emissions were mainly affected by a high enough spacing between roundabouts rather than by the entry geometry. They highlighted the need for further study to better characterize the spatial distribution of emissions also in the cases of low or extremely high spacing between subsequent roundabouts. Discrete models were also developed by [24] to relate distinct speed profiles of vehicles driving through turbo or multilane roundabouts, and traffic conditions; however, there was the need to gather further data on different roundabout configurations to perform real-world testing for validation purposes. Jaworski et al. [16] proposed a methodology for creating an exhaust emission model for roundabouts based on emission data from the Portable Emissions Monitoring System (PEMS) for real driving cycles of various types of vehicles. They obtained results of emission calculations on roundabouts which may be used to introduce and to prepare new roundabout design guidelines concerning emission data. Guerrieri et al. [41] used the COPERT IV® software to assess environmental performances at roundabouts with right-turn bypasses under increasing entering traffic volumes. Although roundabouts may be a cost-effective solution, the macroscale level tools used did not allow us to investigate in greater depth the dependence of emissions on driver behaviour. To optimize roundabout modelling, Lakuari et al. [42] employed numerical simulation to predict CO2 emissions. Repeated changes in vehicle speed in the ring resulted in greater CO2 emission rates than at entry or exit lanes, whereas CO2 emissions reduced where many circulating vehicles slowed down or stopped because of the vehicles entering the roundabout without a safe gap to the vehicles in the circulating lane. However, emissions caused by frequent stops-and-go in high traffic conditions could be reduced by using traffic lights at entries. Other experiences concerned the employ of a hierarchical Bayesian regression analysis to model speed profiles of different drivers at roundabouts which can be useful in determining individual or group-wise emissions estimates [43]. However, the above papers concerned the emission testing at roundabouts based on previously developed general emission models. Thus, given the specific characteristics of geometry and traffic on roundabouts, there is still a need to develop emission models for exhaust gases for roundabouts based on real data.
The literature also informs on a few studies that have studied the environmental effects on roundabouts using microscopic traffic simulation models. Ahn et al. [44] applied INTEGRATION and Verkehr In Städten – SIMulationsmodell (VISSIM) software [45] to generate speed-time profiles through a roundabout along a high-speed road, and employed microscopic energy and emission models to estimate emissions and vehicle fuel consumption. Despite a greater reduction in queue lengths and delays at roundabouts than other intersection control strategies under free-flowing traffic, vehicle emissions and fuel consumption increased as demand increased under unbalanced entering traffic flows, reaching higher levels than a two-way stop-controlled or a traffic light-controlled alternative. However, the case study only allowed to test the capability of the microscopic traffic simulation models to reproduce high-speed driving patterns as input for the employed emission models and stressed the usefulness of combining traffic microsimulation models with other emission models to assess design alternatives or traffic control strategies from the perspective of environmental sustainability. Recent studies used the VSP model to estimate emissions starting from on-field observed and simulated vehicle trajectories on a corridor level. In this regard, Anya et al. [46] have explored the potential for calibration of microsimulation models with a view to improve emissions estimates from simulated vehicle activity for mixed corridors of traffic signals and roundabouts. Adjusting the parameters allowed the model to capture emissions hotspots along the routes more accurately than under the model parameters with default values. Attempts to simulate emissions driving along one mixed roundabout/traffic light/stop-controlled intersections corridor were also made by [47] using microscopic traffic modelling and VSP methodology. Their study showed that roundabouts could achieve lower emissions, however depending on the pollutant, than the traffic light; they also searched for the optimal spacing for intersections along a corridor, but the results can only be referred to the case examined. Thus, more experience should be carried out both to generalize the results and to test the transferability of the proposed methodology into other environmental contexts. In other case studies, operational and environmental impacts of turbo-roundabouts were also analysed both as isolated intersections [48,49] and along corridors [50]. Improvements in the estimates of CO2 emissions and fuel consumption on arterial roads have been achieved coupling dynamic micro traffic models with instantaneous emissions models; however, the large computation times especially for large-scale urban networks is a drawback of this kind of combination [51]. In turn, Stogios et al. [52] examined the effects of driving settings with Automated Vehicles (AVs) on greenhouse gas emissions (GHG) at urban corridors by combining traffic microsimulation and emissions modelling. The results highlighted that there is potential for up to 24 percent in GHG emission reduction when the effects of vehicle powertrain technology are included; no significant reductions of GHG emission were found when AVs alone characterized driving settings. Thus, the value of the study is to open interesting scenarios on autonomous driving impacts on traffic.
Based on the above, this paper would like to address some gaps in the prior studies that are related to the data collection, and to the employ of microscopic traffic simulation models for estimating emissions with reference to urban roundabouts. As introduced in Section 1, data collection here performed is inspired by a crowdsensing logic [7], where a “sentinel vehicle” used as a test vehicle travelled through the sampled roundabouts to acquire second-by-second vehicle trajectory data by using a smartphone installed on board.
Starting from the literature review as above reported, there is the clear need for more economical and user-friendly systems of collecting instantaneous vehicle trajectory data to make smart both the use of the available resources and then the subsequent data process and analysis. In this regard, it should be noted as a further novel aspect that the calibration process of the model parameters of AIMSUN used field data in order to ensure that emissions were predicted accurately from simulated trajectories through the sampled roundabouts.
The research also includes the following societal and scientific contributions:
(1)
Societal—It allows to send the collected trajectory in a central management platform able of processing a considerable amount of data, converting them into digital information to estimate traffic emissions from the mobile source, and then, returning data to the community of users equipped with their smartphones to collectively share information, for instance, about hotspot emission locations at urban roundabouts;
(2)
Scientific—It identifies certain parameters of driving behaviour using a traffic modelling approach aimed at accurately analysing and comparing road units (i.e., road segments or road intersections, and so on) when changes in design or operation are considered from an environmental point of view as the life cycle thinking approaches strongly require.
At last, the further objective of the conversion of an existing roundabout of the sample into a turbo counterpart as introduced in Section 1. represents as an attempt to test the reproducibility of the empirically-based methodology here proposed, that integrates the VSP model and AIMSUN to estimate vehicle emissions at urban roundabouts.

3. Materials and Methods

In accordance with the aim of the paper as introduced in Section 1, the field data collection and the VSP methodology will be introduced below, before the section on the infrastructure modelling in AIMSUN developed to generate the speed-time profiles for the sampled roundabouts and to perform the calibration of the model. The reasons behind the assumptions and choices made will also be described, as well as the obtained results and the conclusions that were then drawn also in view of future research developments. Figure 1 shows an overview of the proposed methodology.

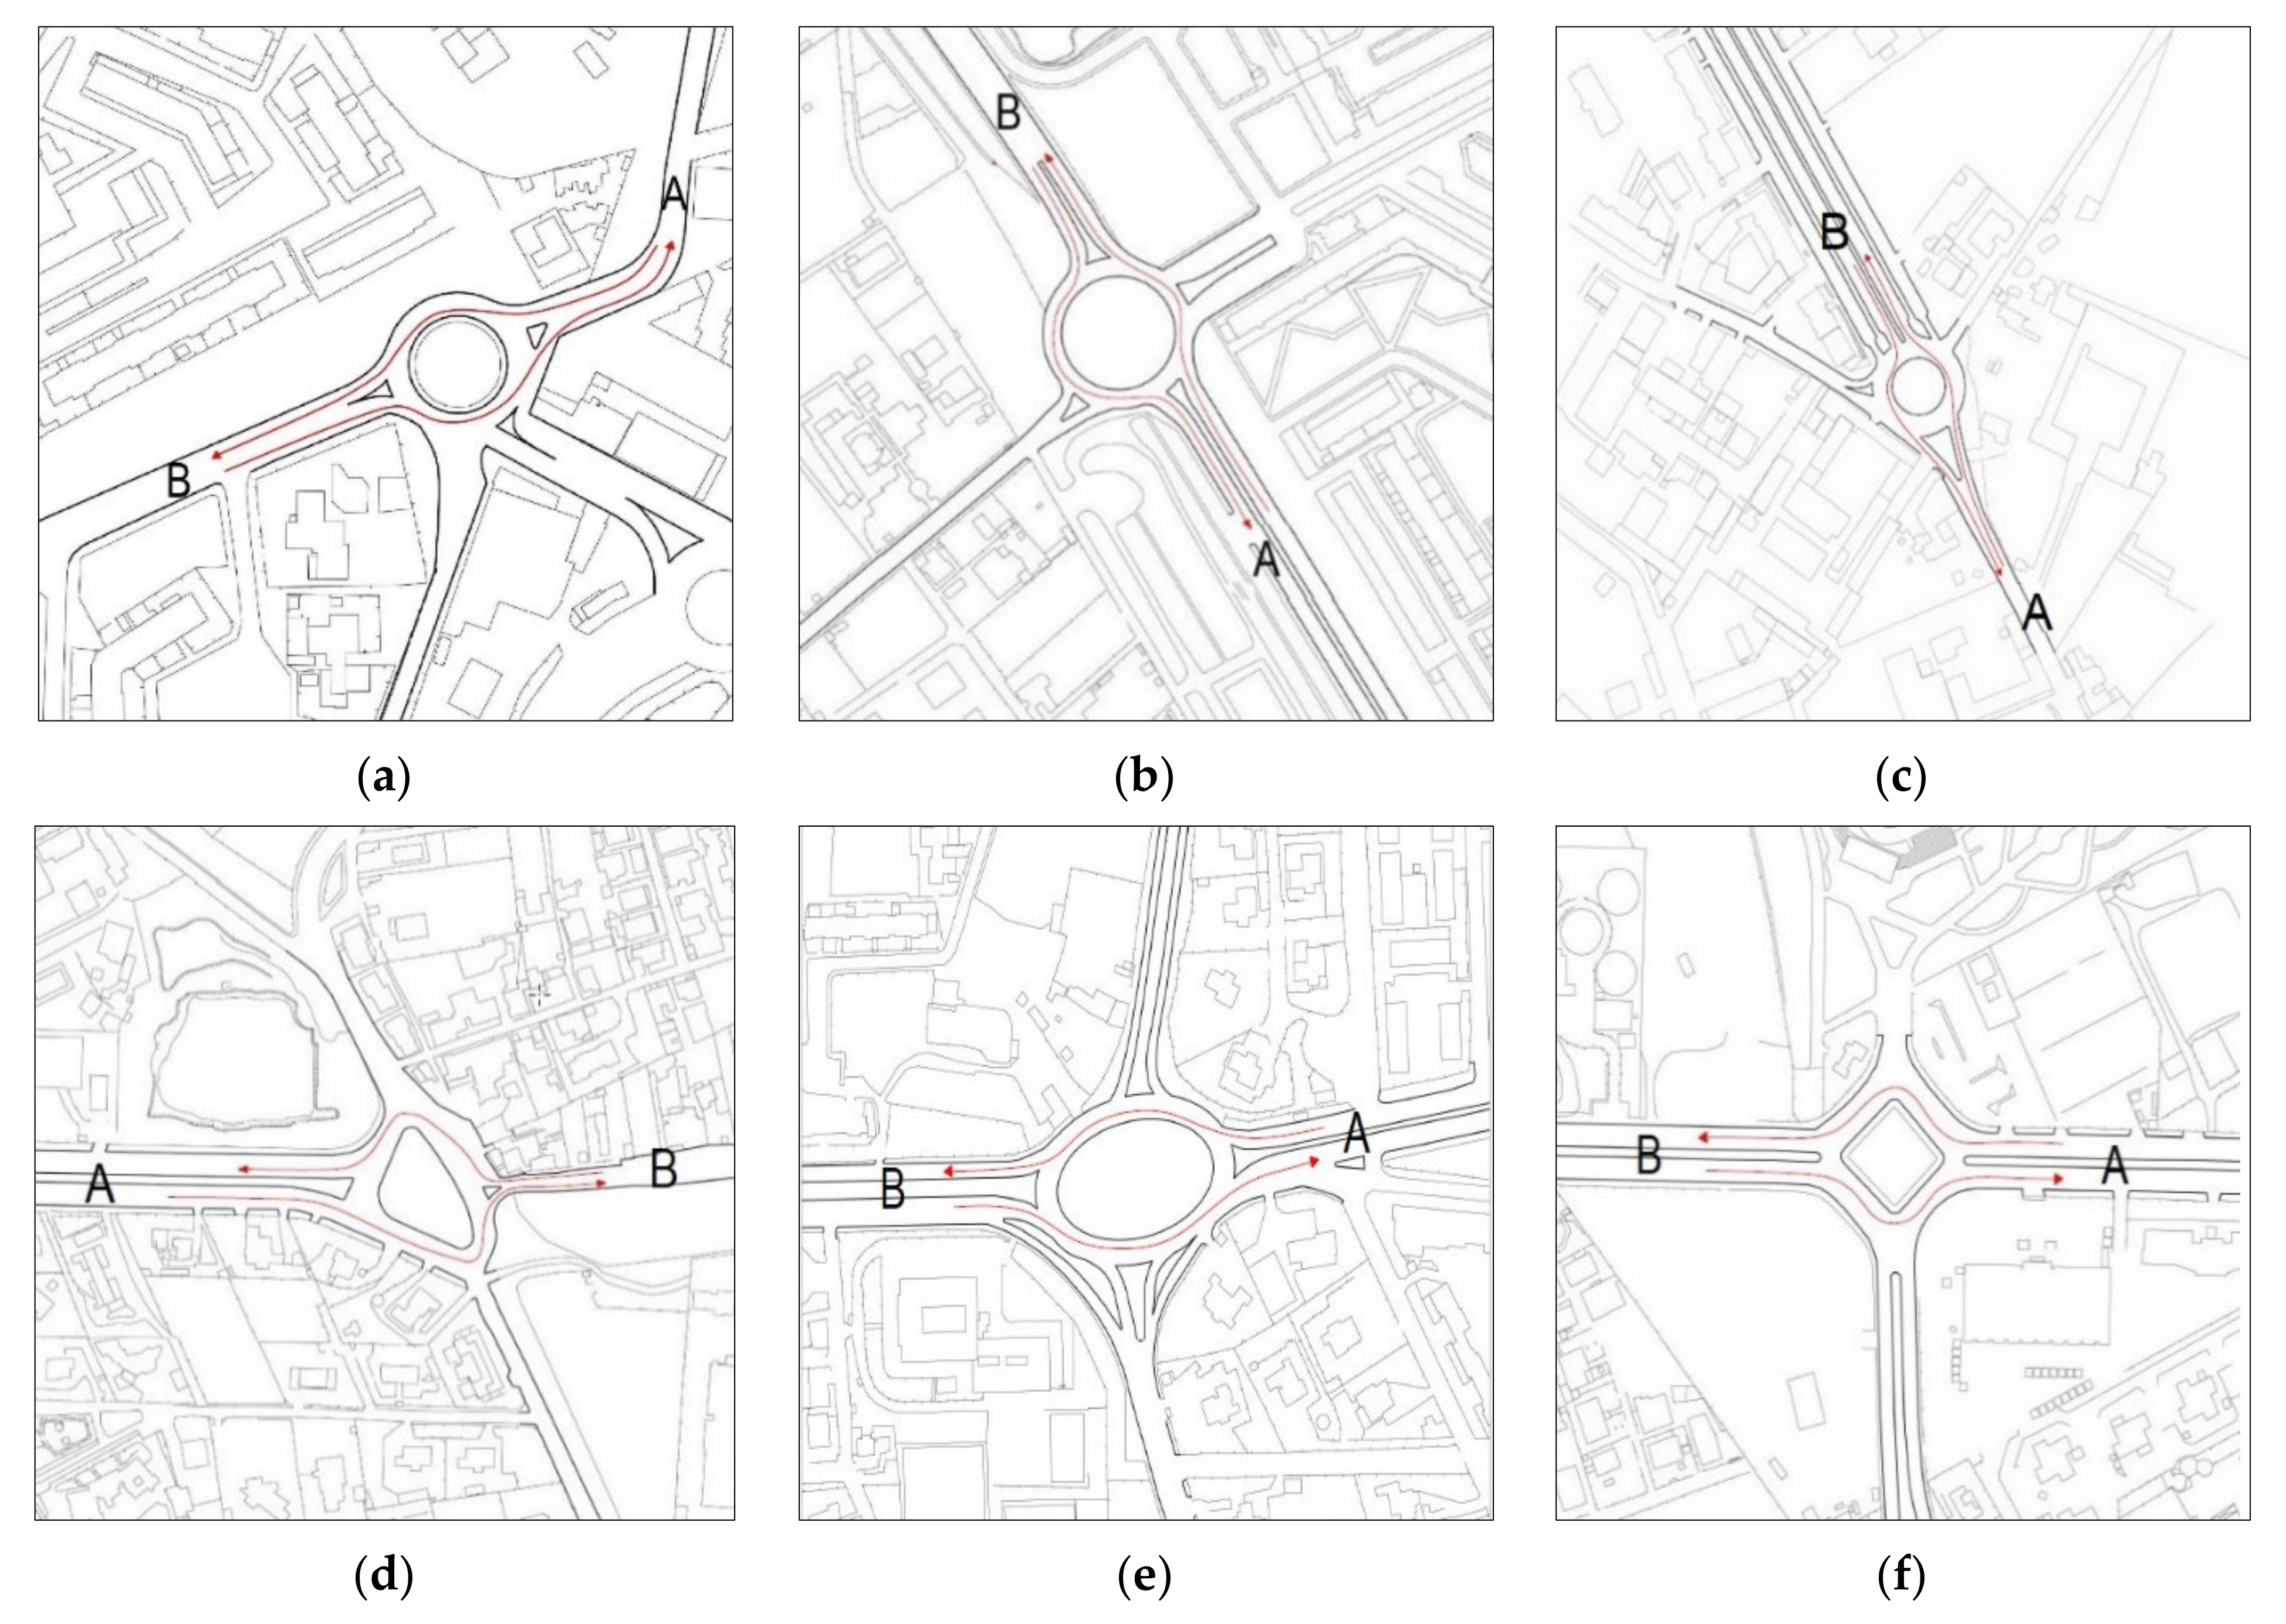
3.1. Field Data Collection

A sample of six roundabouts installed in the road network of the City of Palermo, Italy, was selected for this pilot study. Although the examined roundabouts are sited in areas different from the urbanistic point of view, they were selected for the similar operating conditions observed in the field (i.e., no commercial area, similar entry traffic distribution between major and minor roads, analogy among the curvilinear paths experienced by the test vehicle in the two driving directions through each roundabout). Geometric dimensions were obtained from a combination of design plans and field measurements. Figure 2 shows the schematic drawings of the sampled sites, whereas Table 1 summarizes the main sites’ geometric characteristics and details on the speed and traffic data. The geometry of entry (exit) lane, circulatory roadway width and deflection angles were consistent with the Italian standards on geometric design of interchanges and intersections [53]. The roundabouts were classified as conventional roundabouts for an outer diameter below 50 m, while large-diameter multilane roundabouts were recognized in the other cases. Despite the constraints of existing roadway alignments or buildings on roundabout design, and the large size of the outer diameter of some sampled roundabouts, speed control objectives could still be met. Entry design provided appropriate view angles to users and deflection angles on the whole comparable among the sites; however, the higher the deflection angle, especially over 41 degrees, the higher the reduction in approach speeds [34]. In the cases where the approach alignments are offset to the left of the roundabout centre, entry deflection and the exit radius on the same approach increased slightly, thus reducing the control of exit speeds and acceleration; e.g., Figure 2b,d (Roundabouts 2 and 4, respectively). Field observations confirmed that all the two-lane entries operated with a shared through-right lane in the right lane and a shared left-through lane in the left lane; both the inside lane and outside lane at entries often had sporadic queuing under traffic conditions observed during surveys. In this regard, the geometric alignment of the entry relative to the circulatory roadway encouraged drivers to handle the left-turns, right-turns, and through-movements under balanced entry lane-use patterns, and to avoid path overlap between adjacent lanes, thus reducing uncertainty in exiting from the circulatory roadway. Neither the spacing between subsequent intersections nor the destinations downstream of each roundabout influenced the lane choice behaviour at the entry so that each sampled roundabout operated as an isolated intersection. Since each roundabout is installed in a flat area where the grade is less than 2 percent, the effect of this parameter was neglected when the VSP methodology was applied (see next section).
Field surveys were done to record traffic counts and vehicle trajectory data. Traffic flow data were videotaped on each entry and exit within the viewable area of each roundabout; this investigation was also integrated by manual counts simultaneously done by two operators to create a complete picture of traffic flows and driving behaviour where observations were difficult to be detected. The traffic flow data were recorded at each roundabout by driving direction, classified by manoeuvre and then computerized for processing as the input Origin-Destination (O-D) matrixes so as to allow for their subsequent simulation on each network model of roundabout built in AIMSUN (see Section 4). Hourly patterns of traffic flows often showed a marked similarity having only two peaks in the morning and the late afternoon without a significant peak at noon or in the late evening. Traffic flow measurements were done during the morning (7:00–8:30 a.m.) and afternoon peak hours (6:00–7:30 p.m.) on weekdays (Tuesday to Friday) from October 2018 to February 2019. In most cases the morning peak was reached over a longer time period than the afternoon peak whose duration suddenly dropped to its lowest point; thus, the peak hours observed during afternoons have not been considered in the subsequent analysis compared to data recorded during the morning peak hours. Table 1 also shows the average values of entering and circulating traffic volumes observed for the morning peak period (7:00–8:30 a.m.) at the sampled roundabouts. Since effects of pedestrian impedance on the vehicular entry capacity as a function of driver yielding behaviour were insignificant in the surveyed time periods, pedestrian flows were neglected in the subsequent analysis [54]; in turn, heavy traffic did not exceed 10 percent at each roundabout during surveys and it was also neglected. Data collection also covered the recording and retaining of vehicle trajectory data through each sampled roundabout during 7:00 to 8:30 a.m. peak periods on weekdays. According to the aim of the paper (see Section 1), reference was made only to the trajectory data of the test vehicle. Specifically, vehicle trajectory data were measured in sampling values per second at 1Hz frequency using the Speedometer GPS PRO for Android smartphone, installed on a diesel light-duty vehicle complying with the Euro IV emission standards and the specifications employed for deriving emissions rates for the VSP modes [55,56]. Second-by-second GPS trajectories experienced by the test vehicle entering each roundabout from the left lane covered about 15 km in 12 h of on-road surveys. Based on [24,57], the number of runs per roundabout counted 7 to 10 replications per site and travel direction for a total of 94 travel runs of through movements; it has been deemed adequate to have appropriate results from the data collection. Longitudinal acceleration (or deceleration) values have been determined from second-by-second GPS speed data collected in the field using the following equation:
a t 2 = v t 2 v t 1 t 2 t 1
where a t 2 is the acceleration or deceleration (m/s2) at time t2 (s), while v1 is the speed (m/s) at time t1 (s), and v2 is the speed (m/s) at time t2 (s) [58]. According to [59], acceleration manoeuvre ended in the event that the increment in speed between two consecutive data points was less than 0.1 m/s2 for the next 5 s. Similarly, deceleration values have been determined from the time onwards where its absolute values from Equation (1) were greater than or equal to 0.1 m/s2 for 5 consecutive seconds [58,60]. The observed speed profiles of all the sampled roundabouts were divided into two subsets depending on the driving direction where the corresponding trajectories were experienced in the field (see directions AB and BA in Figure 2). An analogy among the curvilinear paths of the test vehicle in the two driving directions has been found. To test whether the direction AB was the same as BA, statistical tests were performed to compare the two corresponding subsets of data. The two-sample t-test was done to determine if the means of the two subsets of data were significantly different from each other. The two-tailed F-test was also done to answer the question whether the variances of the two samples were equal against the alternative that they were not (see Table 2 and Table 3 for the summary statistics). Based on the p-values in the tables, it cannot conclude that a significant difference exists between the two driving directions in all the sampled roundabouts; in turn, the F-test results show that there is not enough evidence to reject the null hypothesis that the two sample variances are equal at the 0.05 significance level.

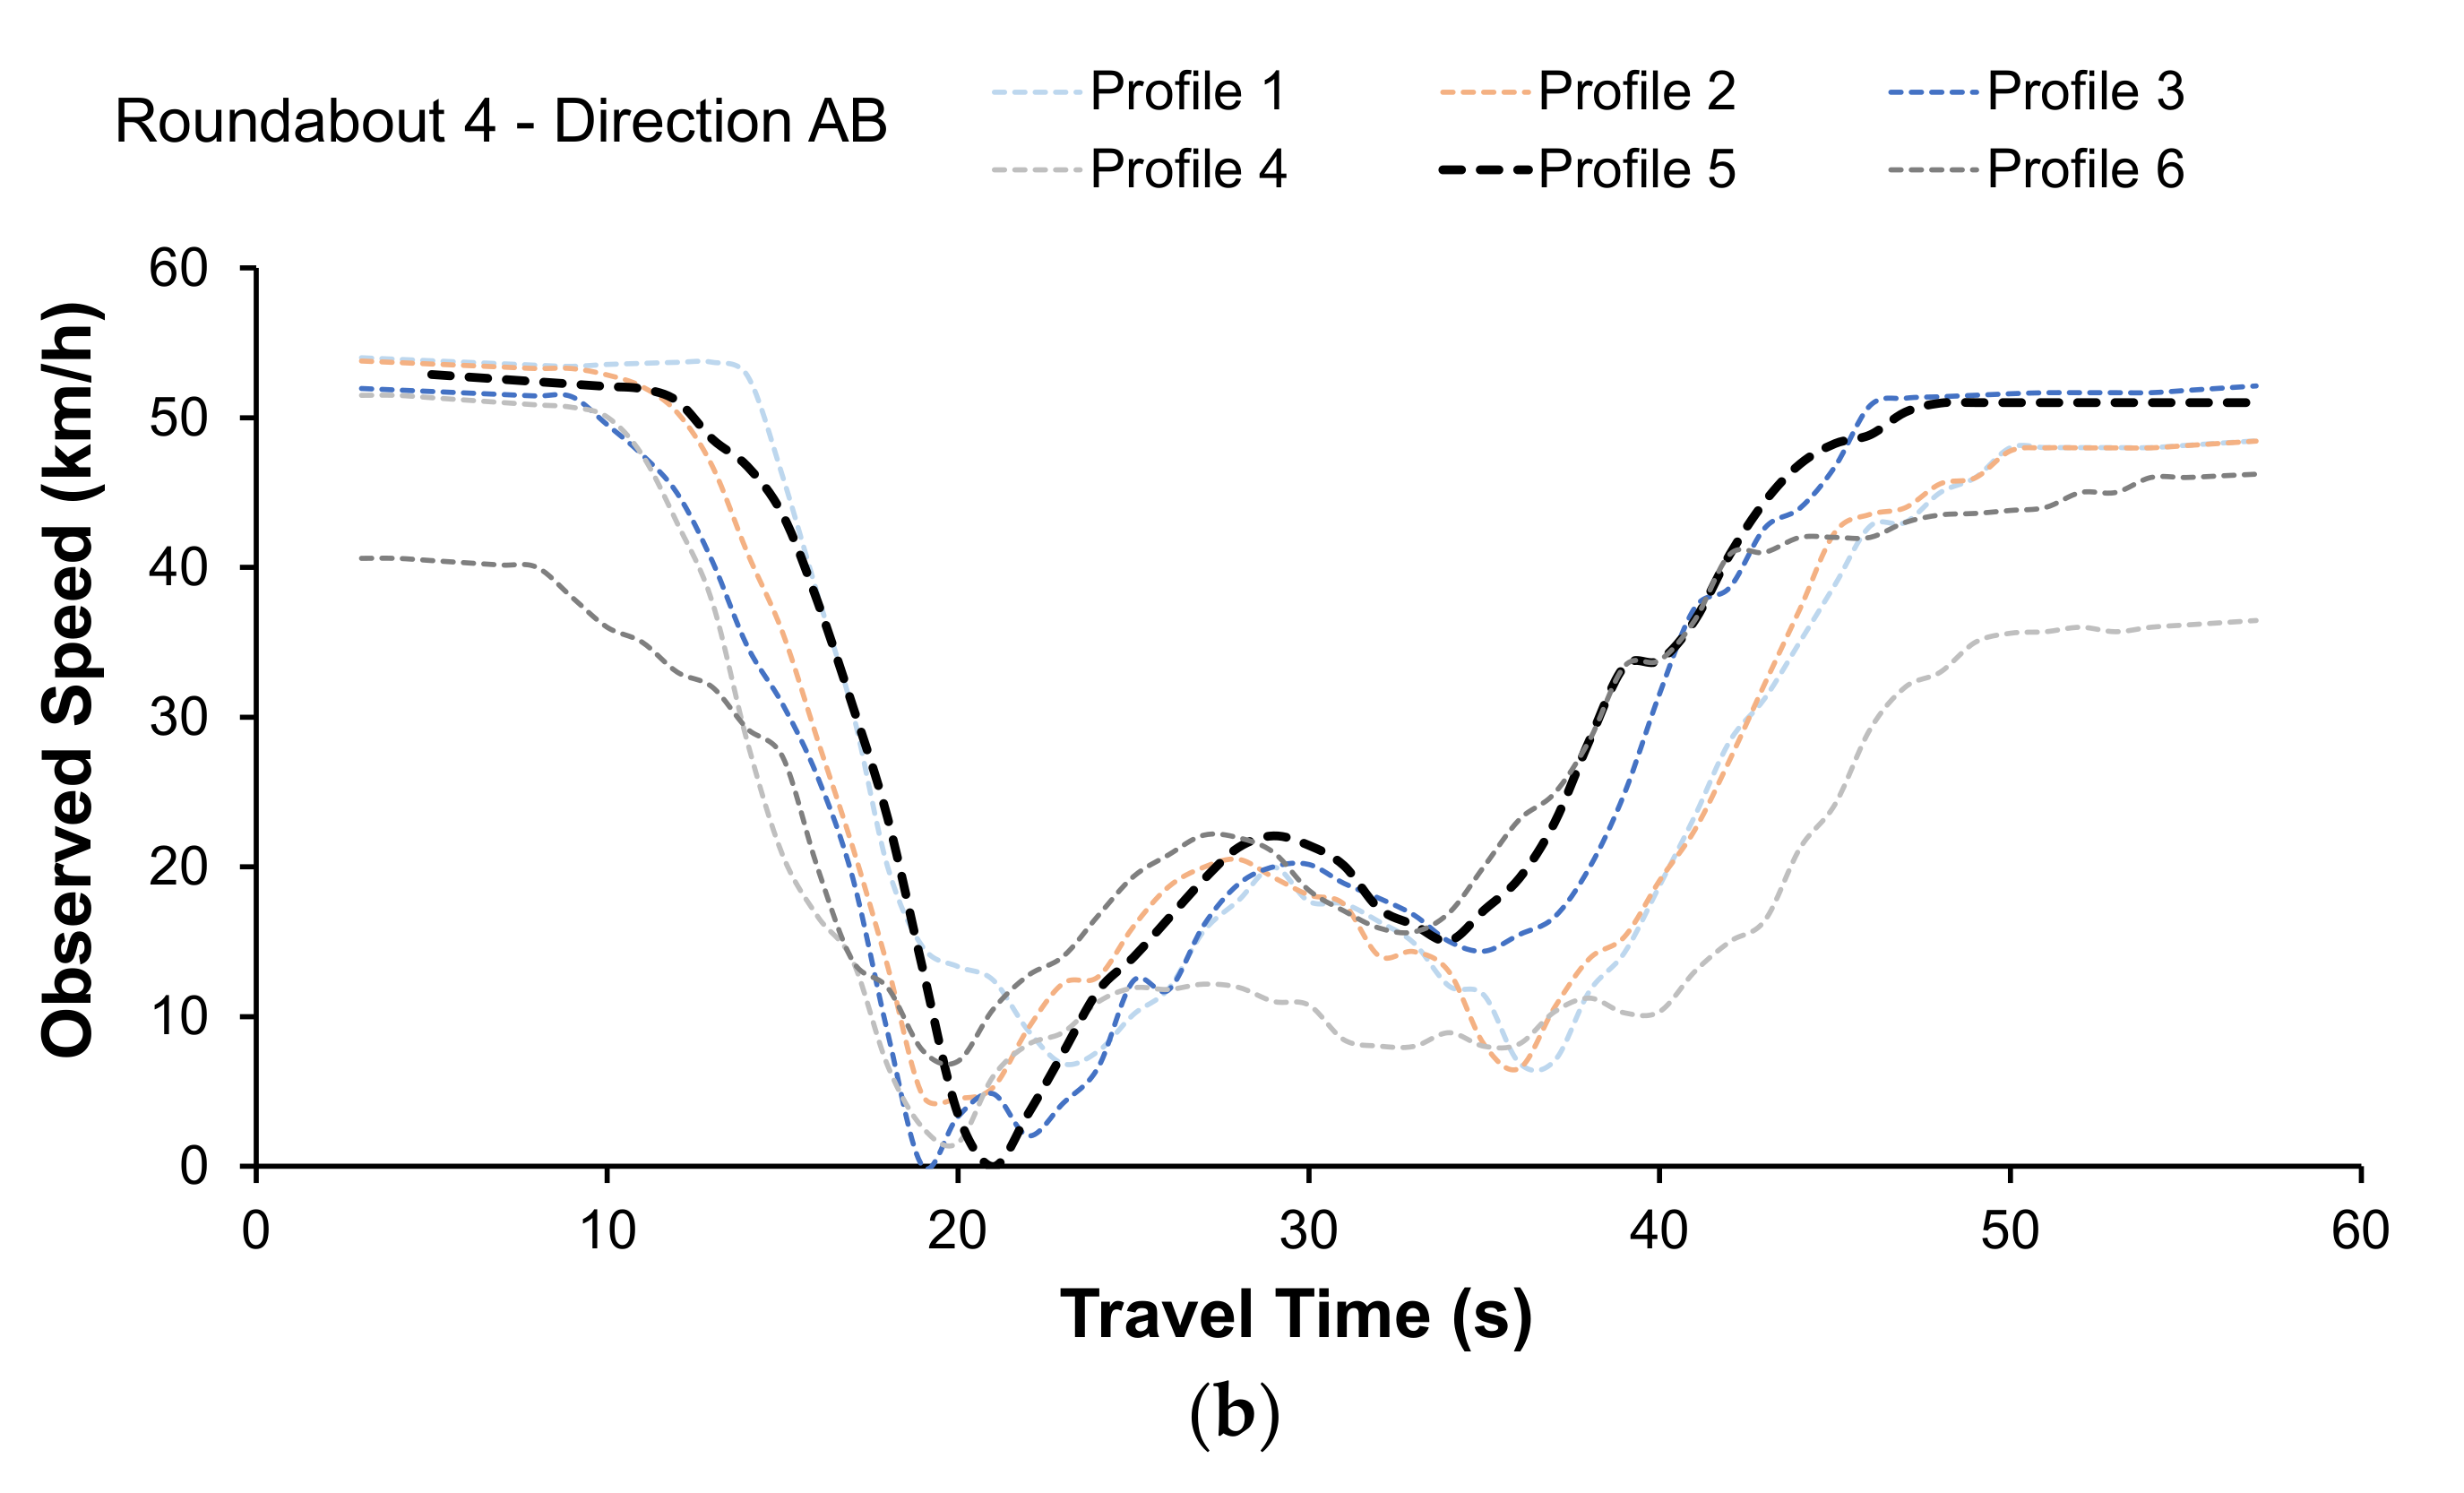
3.2. Characterisation of the Speed-Time Profiles

The speed profiles collected in the field were classified in three main groups whose probability of occurrence was closely depending on the traffic level [24,38,61,62]: (1) speed profiles without stopping and yielding to circulating traffic, where the test vehicle entered the roundabout, negotiated the circulating area and accelerated back to cruise speed as it exited the roundabout; (2) speed profiles with one stop experienced by the test vehicle before finding a useful headway to enter the roundabout, accelerated to move along the ring and exited the roundabout; (3) speed profiles with multiple stops during queueing on the entry approach before the test vehicle entered the roundabout, faced the circulating traffic and then accelerated to exit. In this study, the speed profiles with or without one complete stop were considered, while those with multiple stopping on the entry approach were removed due to their low relative occurrence (less than 5% of the cases) under the observed traffic conditions ranging from free flow traffic to a saturation degree of 0.85 to 0.90. Characterization of the speed profiles obtained from processing GPS data collected for roundabouts in Palermo City, Italy, is reported in [62] to which we refer. During traffic surveys it was observed that the number of cases of the driver negotiating the roundabout without a stop decreased as the sum of entry and circulating flows (the total traffic flow) increased: for values of the total traffic flow below about 800 vph, the greater the probability of the driver that enters the roundabout without a stop; for higher values of the total traffic flow, the greater the probability for at least one stop. The result is consistent with what was detailed in [24]. Each speed profile extracted from the raw data was trimmed and adjusted as having about 60 data points distributed along the trajectory; thus, a direct and punctual comparison of the profiles has been done by referring to their order numbers. In order to have consistency among the speed profiles and then extract a contribution to the emissive phenomenon comparable among the sampled roundabouts, an average influence area of 250 m [24,62], corresponding to around three times the diameter was chosen for each roundabout; the influence area included the deceleration distance of the vehicle from the cruise speed to the entry line of the roundabout, and the acceleration distance of the exiting vehicle up to the section where the cruise speed is about to be reached again. A representative speed profile was chosen for each roundabout within the average influence area as introduced above. By way of example, Figure 3 shows all second-by-second speed-time profiles through Roundabout 2 in Figure 2b and Roundabout 4 in Figure 2d where the dashed black line identified the representative profile employed to compare the speed-time profiles then simulated in AIMSUM. There was a large number of profiles that seemed to be somewhere between the two forms identified above (i.e., speed profiles with or without a stop), especially in the case of atypical layout where not all the profiles fitted the identified shapes perfectly (see Figure 3b). Consistent with the objectives set above for this paper, one single sentinel vehicle interacted with other vehicles in traffic; the driving style was consistent with the characteristics of curvilinear design dominated by slight speed changes and intentional speed corrections by the driver to maintain his desired speed [63]. The vehicle adopted different initial speeds before entering due to differences in the upstream geometry or operational conditions at each sampled roundabout.

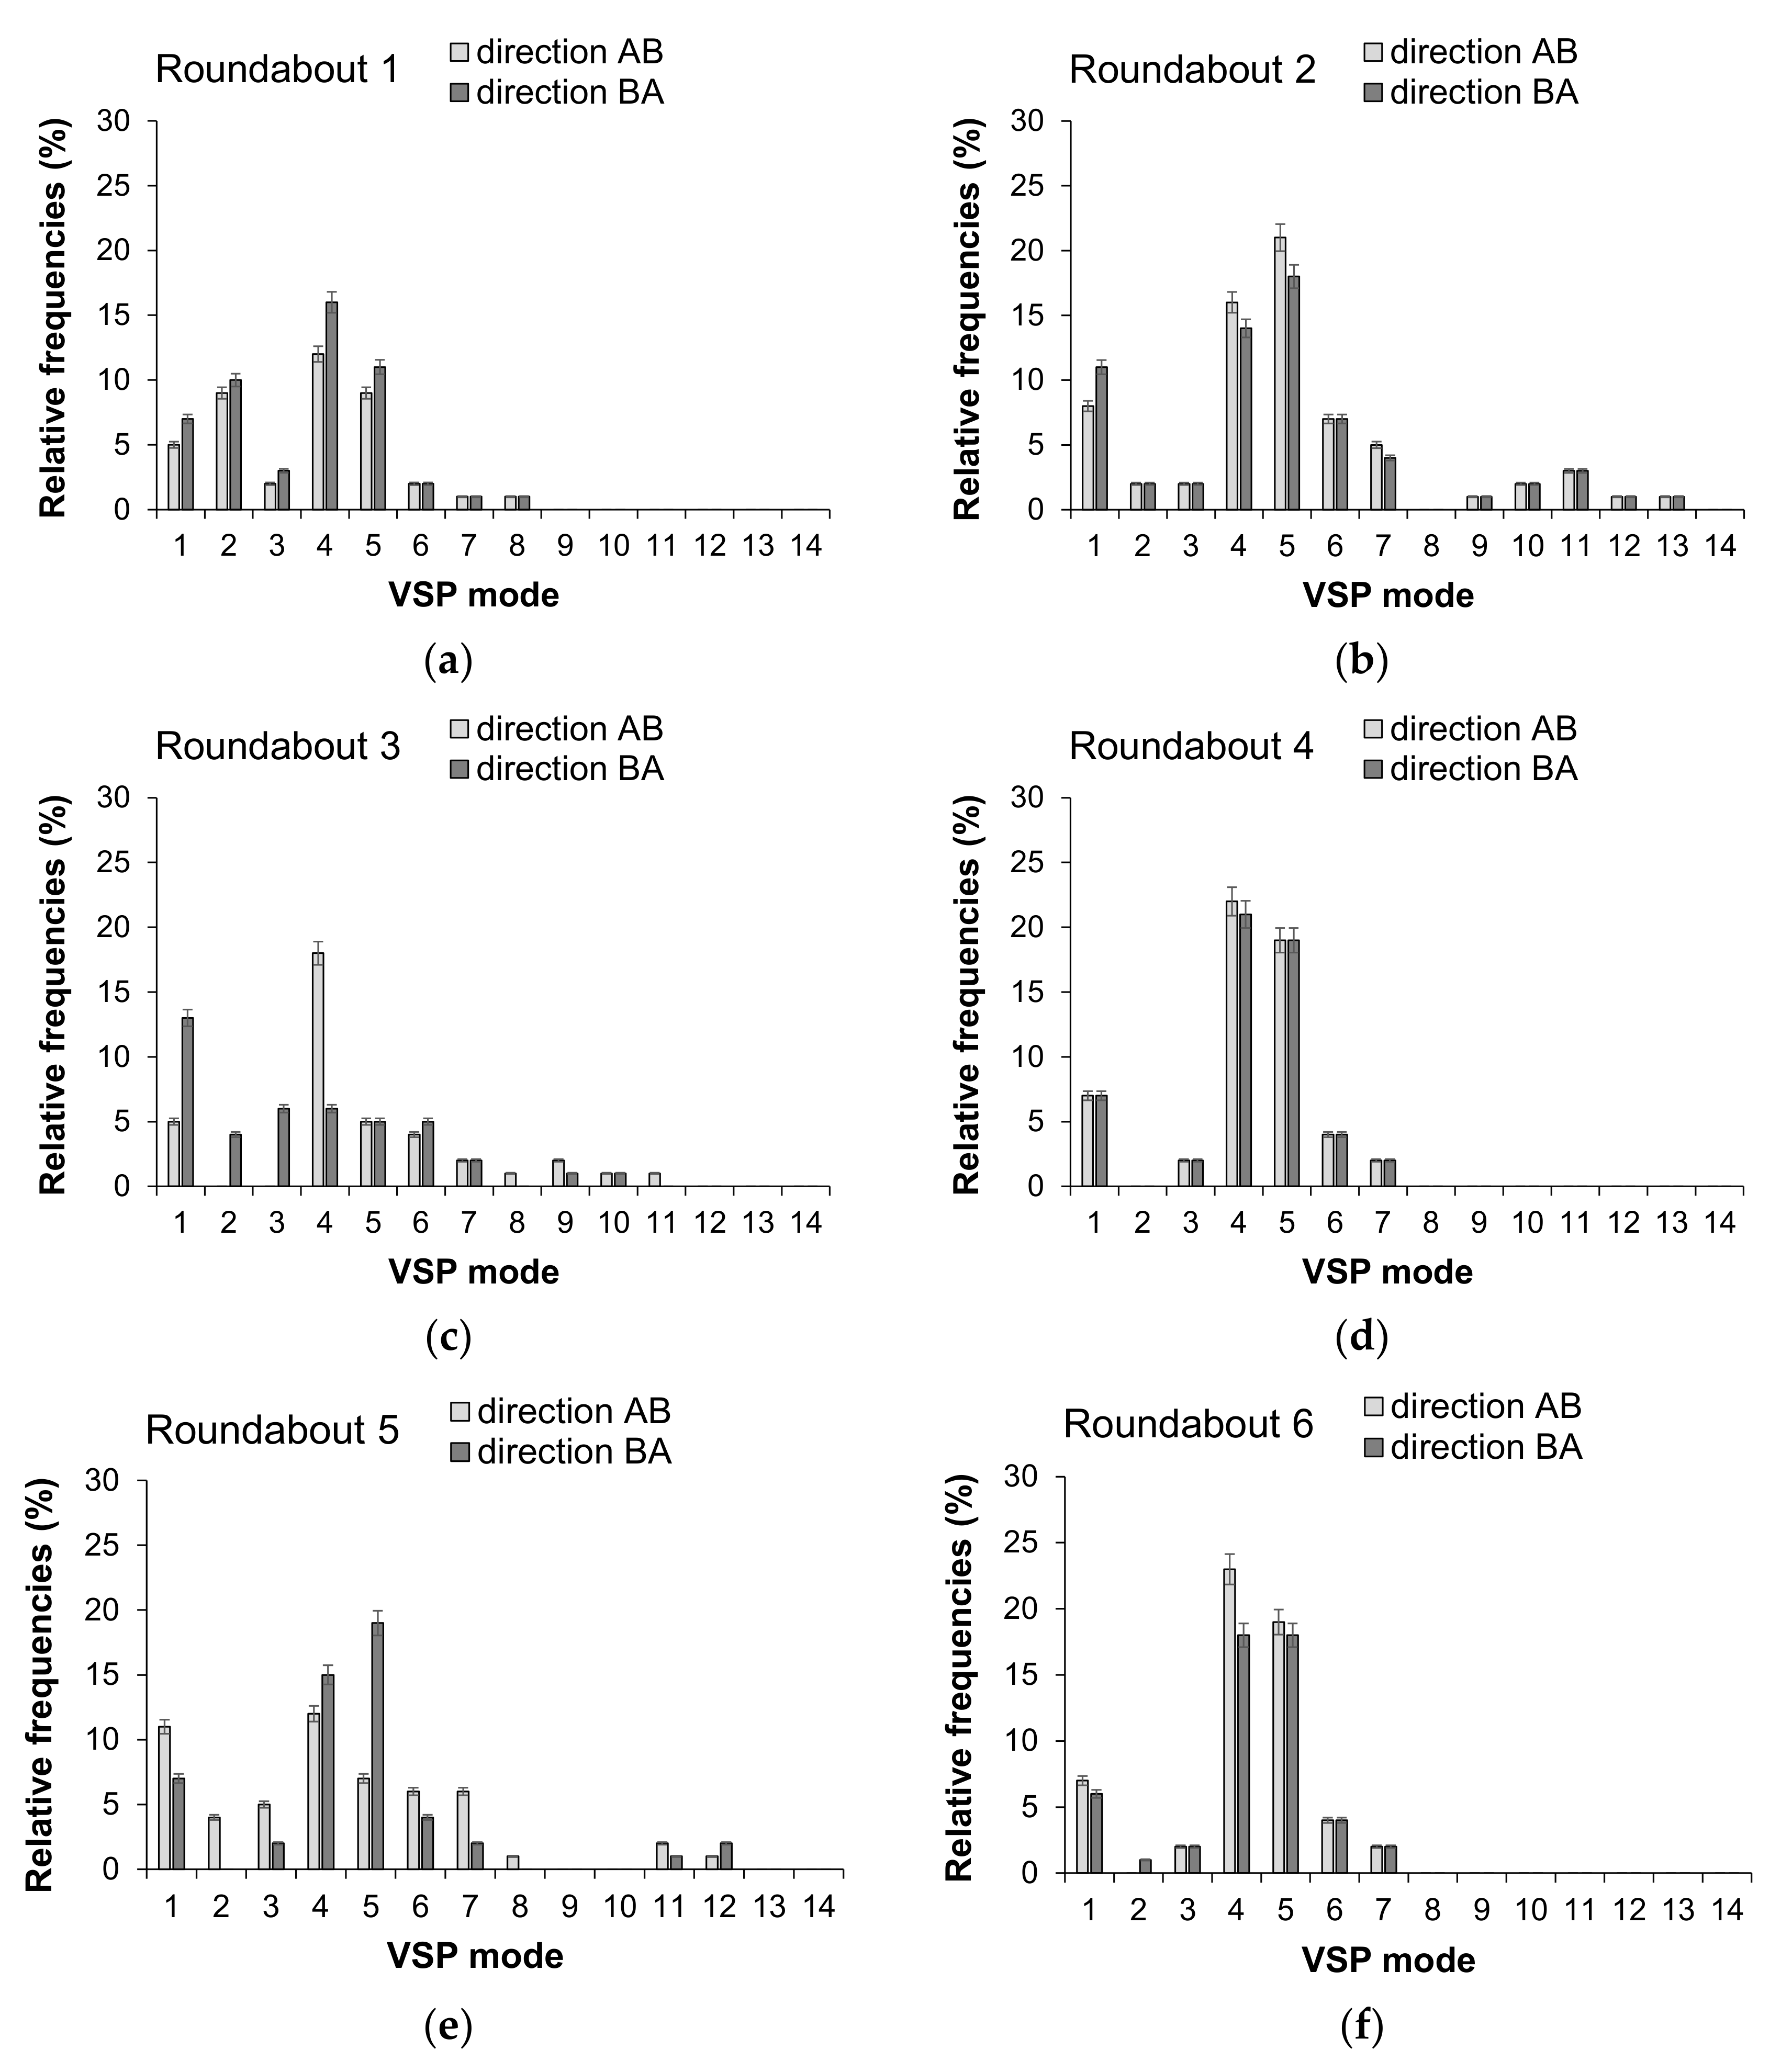
3.3. The VSP Methodology

In order to characterize vehicle driving profiles by using real-world data, the VSP methodology has been employed [14]. This methodology was selected since its suitability on emission estimation at roundabout level analysis [24,38,61]. Equation (2) expresses the instantaneous power that is generated by the engine and is used to overcome the rolling resistance Fr and aerodynamic drag Fa, and to increase the potential Pe and kinetic energies Ke of the vehicle as follows [14]:
V S P = d d t · K e + P e + F r · v + F a · v m
where m and v are the mass, in metric tons, and the speed of the vehicle, in m/s, respectively. The US Environmental Protection Agency (USEPA) modal emissions model MOVES [27] employs a simplified form of Equation (2) where the VSP is calculated as a function of the vehicle’s speed, acceleration, and grade:
V S P = 1 m · A · v + B · v 2 + C · v 3 + a + g · s i n θ · v
where VSP is expressed in kW/t; v is the instantaneous vehicle speed (m/s), a is the vehicle acceleration (m/s2); A is the coefficient associated with tire rolling resistance (kW·s/m), and B is the coefficient associated with the mechanical rotating friction and higher-order rolling resistance losses both expressed (kW·s2/m2); C is the coefficient associated with the aerodynamic drag (kW s3/m3); m expresses the mass for the specific vehicle type in metric ton; g is the acceleration due to gravity; sin θ is the road grade. Thus, the VSP can be equal to zero under zero vehicle speed or idling, while the VSP is positive (or negative) during acceleration (or deceleration). Given the impact of various factors influencing VSP and the variability in instantaneous vehicle emissions on road segments of different types of roads, there is the need to promote the development of a binning process in order to reduce variability found in the cases examined [15].
A further simplified form of the VSP equation has been developed for a typical light passenger vehicle as follows [64]:
V S P = v · 1.1 · a + 9.81 · s i n a r c t a n g r a d e + 0.132 + 0.000302 · v 3
where grade is the road grade (decimal fraction), while VSP, v and a are as introduced above. For light-duty vehicles, each second of driving is categorized into 14 modes that represent the different driving regimes [64]. While VSP modes 1 to 2 correspond to deceleration modes or downhill road, VSP mode 3 represents idling or low-speed situations. Finally, VSP modes 4 to 14 correspond to cruising, acceleration modes or uphill road sections [64]. Although a 14 mode VSP-based approach is not unique in its ability to predict tailpipe emissions, it allows us to simplify the design of a modelling system in comparison to other emission methods [65]. Each mode is associated with an emission factor of CO2, CO, NOx, and HC that is fixed for a specific vehicle type (regulation class, fuel, model, year, mileage, or weight). Since a Light Passenger Diesel Vehicle (LPDV) was used as a test vehicle in this study, Table 4 depicts each interval of power requirements corresponding to each 14 VSP mode, and CO2, CO, NOx, and HC emission factors by VSP mode for diesel powertrain [24,55]; the emission rates for light passenger gasoline vehicles and light commercial diesel vehicles can be found in [24]. Figure 4 shows the relative frequencies of time spent in each VSP mode for representative speed-time profiles experienced by the “sentry” test vehicle through the sampled roundabouts. The time percentages in both driving directions have been shown to be broadly consistent with each other both in the VSP modes 1 to 2 (deceleration) and 4 to 5 (acceleration); the vehicle spent a high proportion of time in VSP mode 4 or 5 as it exited the roundabout to reach the cruise speed, while the proportion of time sensibly appears to reduce from VSP mode 5 onward. In some cases, a low proportion of time still appears in 10 to 13 VSP modes denoting high acceleration events. Based on the speed-time profiles and the distribution of time spent in each VSP mode, emissions by source pollutant were estimated [24]:
E i j = k = 1 N k F k j
where Eij is the total emission for the speed-time profile i and pollutant j (g); k is the label for second of travel (s); Fkj is the emission factor for each pollutant j in label for second k (g/s); Nk is the total seconds (s). Equation (5) was used to calculate second-by-second emission rates for each speed-time profile experienced by the test vehicle; the total emission by pollutant at each roundabout can be calculated as average of emissions for each pollutant and speed-time profile [62].
By way of example, Figure 5 shows the cumulative percentages of CO2 emissions from the time spent in each VSP mode and the second-by-second emission rates for the speed profiles through the Roundabouts 2 and 4 in Figure 2 along the entire distance travelled on the field. The distributions of CO2 emissions for the other roundabouts exhibited similar patterns. The relative increase in the percentage of CO2 emissions with the distance from the entry resulted highest in acceleration and short stop-and-go events, the slope being the steepest. In this regard, Figure 5a shows that the test vehicle while interacting with the other vehicles in traffic experienced short stop-and-go and produced high percentages of total CO2 emissions during the acceleration from zero to the cruise speed. Repeated speed changes in the circulatory roadway caused greater CO2 emission rates than at entries. The relative increase of CO2 emissions percentage with the distance was higher in the acceleration mode especially when the test vehicle got in the circulatory roadway with a minimum speed and started accelerating to reach the desired speed to exit (see Figure 5b). According to previous experiences on roundabouts in Palermo City, Italy [62] acceleration events in the circulating and exiting areas contributed to more than 25 percent of the emissions for a given speed profile.

4. AIMSUN Modelling

The AIMSUN software was employed to model the sampled roundabouts and to investigate their contribution to the emission phenomenon [33]. Currently, it is known that AIMSUN allows to code the roundabout model among different roundabout types within its project window; this ensures simulated driving behaviour and lane usage corresponding as much as possible to the area under examination and real levels of traffic flow [66]. In the implementation stage of AIMSUN the roundabouts in Figure 2 were converted into the corresponding abstract network models, each of them represented by a system of links and connectors suited for microscopic simulation. Since roundabouts can have multiple turning movements, subpaths between each entry and exit were built to identify the roundabout turns and then extract the manoeuvres to be examined [33]. The urban speed limit of 50 km/h was set as the maximum speed at which each roundabout can be travelled under free-flow conditions. The traffic demand was given as a total O-D matrix of the traffic counts; thus, centroids were defined for each roundabout model. In order to build the traffic demand scenario and then feed each roundabout network model, two further matrices, one for cars and another for heavy vehicles were extracted from each O-D matrix. The vehicle attributes of AIMSUN were set by a class of vehicles and O-D pairs of through movements so as at extracting speed-time profiles of an individual vehicle quite similar to the test vehicle driven during surveys [33]. Traffic scenarios were built considering the same morning peak-hour data collected in the field. Each dynamic scenario was located into the 7:30–8:30 a.m. slot with a single replication of 5400 s and warm-up time of 1800 s. Once carried out the i-th replication in AIMSUN, imposing a resolution time scan per second, trajectory data useful for building the speed-time profiles were stored in the output database (with *.sqlite extension); the usable information was referred to the previously selected O-D pair and to the class of vehicles which have travelled the roundabout in a given time interval [33]. The vehicle trajectory data from AIMSUN were aggregated based on 30 replications by through movement and driving direction on all the roundabout network models; they were plotted as a curve with speed on the Y-axis and travel time on the X-axis. By way of example, Figure 6 shows the observed speed-time profiles and those simulated under default parameters for Roundabout 1 (movement AB in Figure 2a) and Roundabout 3 (movement BA in Figure 2c). The comparison between the speed-time profiles experienced in the field and those simulated under default parameters of AIMSUN was made to figure out whether (or not) adjusting the model parameters was needed to better reflect the field data and then obtain greater accuracy in emission estimates.

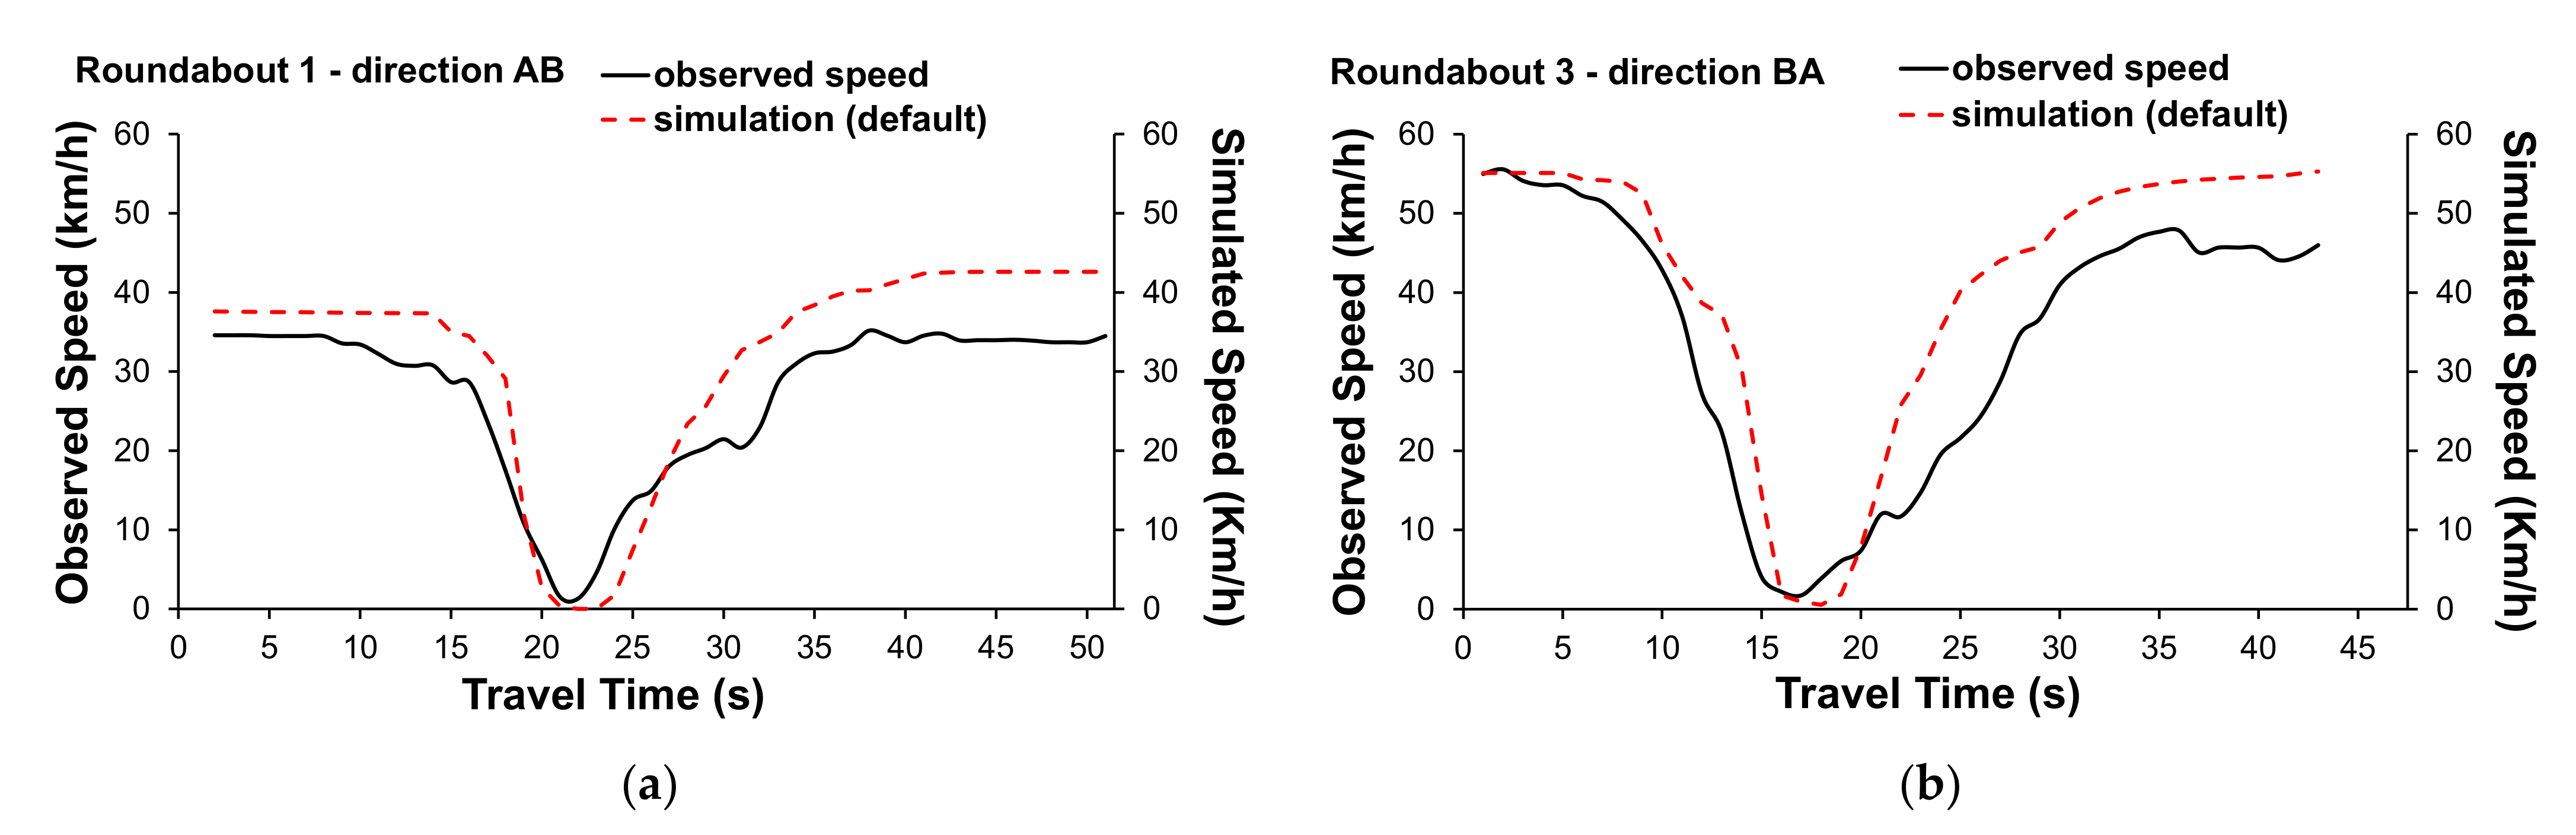
4.1. AIMSUN Calibration

The comparison between the GPS trajectories collected in the field and speed-time profiles simulated in AIMSUN under default parameters required model calibration. According to the calibration procedures proposed by [46,67], a vehicle attribute calibration was made to enable the model to better match the field measurements and to estimate emissions with better accuracy. Two vehicle attributes of AIMSUN were selected: the maximum acceleration having a default value of 3 m/s2, and normal deceleration having a default value of 4 m/s2. A sensitivity analysis explored the effects of different combinations of model parameters on the modelled outputs so that they matched or were comparable with the real-world observations. Calibration under the mean values of the 85th or 95th percentiles of accelerations and decelerations extracted from all the field-observed trajectories travelled through the sampled roundabouts regardless of the driving direction best fitted the observed data (see Table 3); it also provided VSP distributions closer to field data than the distribution under default parameters. No distributions of 85th or 95th percentile desired speeds were defined since the maximum speeds from empirical data appropriately represented the maximum speeds desired by drivers under normal circumstances. By way of example, Figure 7a shows the comparison between the observed and simulated speed profiles for Roundabout 5 in Figure 2e under default parameters and calibration with 85th and 95th percentile parameters. Figure 7b shows, in turn, an example of scattergram analysis done to compare the observed versus simulated speeds under calibration with the 95th percentile parameters extracted from all the field-observed trajectories experienced by the test vehicle through the roundabouts regardless of driving direction. The same figure shows the regression lines of observed versus simulated speeds at the detection stations plotted along with the 95% prediction interval; the R2 values and the fact that only a few points fall outside the confidence band in both graphs imply that the model could be accepted as significantly close to the reality. The results confirmed improvements in vehicle speed after calibration, while traffic volumes resulted slightly modified. Encouraging results under calibrated parameters were also obtained in terms of Geoffrey E. Havers’ statistic (GEH) [31]. With reference to Figure 7b, the GEH values of 100% for each driving direction meant that the deviation of the simulated speed values under calibrated parameters with respect to the corresponding measurements resulted in less than 5 in 100% of the cases and the model could be accepted.
A two-sample t-test was done to see if the means (i.e., µobs and µsim) are equal for the two samples made by VSP distributions based on the observed and simulated speed-time profiles for the movements AB (or BA) through each roundabout; the null hypothesis that the two means are equal is rejected if |t| > t1-α/2,N, where t1-α/2,N is the critical value of the t distribution with N degrees of freedom at the significance level of α = 0.05. Table 5 shows the results of the t-test for the observed and simulated VSP distributions in the driving direction AB through each roundabout in Figure 2. Specifically, it can be deduced that there is no significant difference in the two distributions of the observed and simulated VSP values by driving direction; analogous results have been also obtained for the opposite direction BA.
Figure 8 shows, by way of example, the distributions of time spent in the VSP modes both under the default parameters of AIMSUN and the parameters calibrated with the mean values of the 85th or 95th percentiles of the accelerations and decelerations extracted from all trajectories experienced by the test vehicle through the roundabouts 2 and 4 in Figure 2. Figure 8a shows that the distribution of time spent in VSP modes under parameters calibrated with the mean values of the 95th percentiles of the acceleration and deceleration matched the VSP distribution from empirical data more closely than the distribution under default parameters or under calibration with the mean values of the 85th percentiles of the acceleration and deceleration. The simulated vehicle appears to spend a high proportion of time in VSP mode 4 under the default parameters; the proportion of time sensibly appears to reduce from VSP mode 5 onward, but it still appears in VSP modes 11 to 13 denoting high acceleration events. Under the default parameters of AIMSUN, simulated vehicle activity from roundabouts was not representative of real-world vehicle activity.
Since emissions are strongly associated with vehicle speed and acceleration, the process of high speed and aggressive acceleration can produce higher emissions than the process of braking [42]. Under the parameters calibrated with the mean values of 95th percentiles of acceleration and deceleration with reference to the sampled roundabouts, the time percentages were more realistic in the VSP modes 1 to 2 (deceleration), mode 3 (idle) and modes 4 to 7 (acceleration and cruising). Similar considerations can be drawn from Figure 8b where the more pronounced curvature of the trajectories, together with an atypical design of Roundabout 4, accentuated the effect of speed moderation; however, compared to scheme with a more typical design (see Figure 8a), greater variability of the relative frequencies by VSP mode was observed even in relation to short stop-and-go cycles on entry or in the acceleration phase.
According to Anya et al. [46], sampling from the 85th percentile distribution of accelerations and decelerations measured in the field limited the maximum values of the accelerations or decelerations obtainable in AIMSUN. Based on data observed in the field, 85 percent of the accelerations were below about 1.0 m/s2 (that is the mean value of the distribution of the 85th percentile accelerations observed in the field); thus, there would be modelling no realistic scenario for a vehicle entering the simulated roundabout network model, if it could not achieve any instantaneous accelerations greater than 1.0 m/s2 when travelling unconstrained below the speed limit. Among other things, the vehicles took a longer time to travel the circulatory roadway without significant changes in speed. Calibrating the model with 95th percentile values of the relevant parameters observed in the field at the existing roundabouts, in turn, tended to be more effective in producing VSP distributions enough consistent with what was drawn from the observed trajectory data. However, in this study, the absolute values of emissions were not of much concern given the potential for differences depending on the test vehicle characteristics; among the other things, the intent of this paper was not to derive definitive emission inventories but to explain the relative emission differences associated with various values of acceleration and deceleration.

4.2. Results

The speed-time profiles detected in the field by smartphone through the existing roundabouts and those simulated by AIMSUN were the starting point for estimating emissions of CO2, CO, NOx and HC. Emissions for each source pollutant and representative speed profile by driving direction were calculated employing Equation (5) based on the time spent by the test vehicle in each VSP mode and the second-by-second emission rates in Table 4.
A two-sample t-test was performed for comparing average emissions between the observed and simulated data (default, 85th and 95th) by pollutant and by driving direction through the sampled roundabouts. Table 6 shows the results which confirmed that there is no significant difference between the emissions calculated using observed and simulated data in directions AB and BA through the roundabouts; the results also confirmed the need of calibrating the model to improve the accuracy of emission estimates.
The calculated emissions were then averaged in the two driving directions AB and BA for each relevant speed-time profile as introduced before, to obtain the total emissions for source pollutant and roundabout (see Figure 9).
The results concerning CO2 emissions in Figure 9a show that the percentage variations between the observed data and those simulated with the default parameters of AIMSUN were significantly higher than 5% (in the case of Roundabouts 1, 3 and 4 even higher than 15%); under simulation with the 85th percentiles of the acceleration and deceleration, the simulated values underestimated the observed ones and also showed percentage reductions greater than or equal to 5% (Roundabouts 1, 2, 4, 5). Emission values simulated with the 95th percentiles of the acceleration and deceleration were close to the observed ones (Roundabouts 1 and 6) and showed percentage increases less than 5%; only a percentage reduction of 1% resulted on Roundabout 2, however less than the reduction percentage found under 85th percentiles of the acceleration and deceleration (approximately equal to 11% on the same roundabout).
Concerning CO emissions in Figure 9b, the percentage variations between the observed data and those simulated with the default parameters resulted significantly higher than 5% (but higher than 15% on Roundabouts 1 and 4); under simulation with the 85th percentiles of the acceleration and deceleration, the percentage reductions between observed and simulated data were greater than or equal to 5% (intersections 1, 2, 5, 6), while under simulation with the 95th percentiles of the acceleration and deceleration, the simulated values met the observed data (Roundabouts 4, 5 and 6), with percentage increases less than 3% on the other roundabouts. In turn, Figure 9c shows the aggregated results for (NOX + HC) emissions: under simulation with the default parameters of AIMSUN, the percentage increases between the observed and simulated data were significantly higher than 25%, while under simulation with the 85th percentile values of the acceleration and deceleration, the percentage reductions were greater than or equal to 5% (Roundabouts 2, 4, 5) or the percentage increase was around 7% for Roundabout 6. In turn, under simulation with the 95th percentiles of the acceleration and deceleration, the simulated values showed a certain variability by roundabout where they were close to the observed data or having slight percentage reductions (e.g., on Roundabouts 2 and 4), however less than under simulation with the 85th percentile values of the relevant parameters on the same roundabouts. In order to ensure the validity of the methodological approach proposed in this paper and to confirm its applicability and reproducibility, the conversion of the Roundabout 2 in Figure 2b into a turbo counterpart was conceptualized based on [68]. This roundabout was chosen as an example with reference to its typical design. Speed profiles were collected again at Roundabout 2 during the morning (7:00–8:00 a.m.) and afternoon peak hours (6:00–8:00 p.m.) on weekdays (Tuesday to Friday) in July 2020.
Traffic flow data were recorded by travel direction and classified by manoeuvre so that they can be identified in the roundabout network models built in AIMSUN. Speed profiles were simulated for the existing roundabout and the turbo roundabout based on the procedure developed by [69]. Table 7 shows the elements of the geometric design of the turbo roundabout here designed and used as a term of comparison; by way of example, Figure 10 shows the outcome of the comparison between the CO2 emissions for the two roundabout layouts which will be discussed in the next section.

5. Discussion

The research is referred to a case study of six roundabouts installed in the road network of Palermo, Italy, where pre-existing conditions of the built environment may have constrained the entry and exit geometry, or approach alignment, and consequently driving behaviour through the roundabouts. Examination of the speed profiles as shown in Figure 3 highlighted that each type of situation had a quite distinctive shape but, not all the profiles completely fitted the typical shapes as literature presents [38]. There was a large group of profiles that appear to be somewhere “in between” the two typical shapes. After identification of the main characteristics of trajectories driven through the sampled roundabouts, the data were interpreted in terms of representative speed profiles provided by the test vehicle by roundabout to use them in the subsequent simulation, and in indirect estimation of emissions based on the VSP methodology. The comparison between individual GPS trajectories collected in the field and second-by-second speed profiles derived from AIMSUN as shown in Figure 6 called for model calibration. The speed-time profiles simulated under calibrated model parameters exhibited a better match with the second-by-second trajectories experienced in the field than those ones simulated under default values of AIMSUN. In turn, the comparison in Figure 9 showed that accuracy in emission estimates tended to be improved under calibration with the 95th percentiles of the acceleration and deceleration values extracted from vehicle trajectory data collected in the field. Consistent with literature [46], sampling from the 85th percentile distribution of accelerations and decelerations measured in the field limited the maximum values of the accelerations or decelerations obtainable in AIMSUN. In turn, calibrating the model parameters with 95th percentile values showed to be effective in producing VSP distributions more consistent with the VSP distributions derived from field-collected vehicle activity data (see Figure 8).
The results in Figure 9 also confirmed the versatility of AIMSUN in estimating emissions employing instantaneous speed-time profiles. Improvements in the predictive capacity of AIMSUN can be observed under calibration with the 95th percentiles of accelerations and decelerations; in this case, indeed, the simulated emissions resulted closer to the observed emissions with differences between the simulated values of CO2 and CO emissions lower than other cases. Specifically, the results concerning CO2 and CO emissions in Figure 9a,b show that the percentage variations between the observed data and those ones simulated with the default parameters of AIMSUN were significantly higher than 5%, and in some cases even higher than 15% (Roundabouts 1, 3 and 4 for CO2 and Roundabouts 1 and 4 for CO). Under simulation with the 85th percentiles of the acceleration and deceleration, the percentage reductions between observed and simulated data were greater than or equal to 5% (Roundabouts 1, 2, 4, 5 in the case of CO2; Roundabouts 1,2, 5,6 in the case of CO). Simulation with the 95th percentiles of the acceleration and deceleration provided simulated values close to those observed (Roundabouts 1, 2 and 6 in the case of CO2 and Roundabouts 4, 5 and 6 in the case of CO) with increases from about 1 to 3%. The results for (NOx + HC) emissions, in turn, showed a certain variability by roundabout where simulations with the 95th percentiles of the acceleration and deceleration have returned both slight percentage increases and reductions between observed and simulated data, but, in the complex, smaller in absolute value than simulation under the 85th percentile values of the relevant parameters. However, the results may have been influenced by the selected test vehicle driven in the field, the geometric design of the sampled roundabouts not always corresponding to typical layouts, or the calibration process done to adjust those parameters which allowed the model to better match the observed emissions.
Having in mind the purpose to validate the methodological approach proposed in this paper and to confirm its applicability and reproducibility, the conversion of the roundabout 2 into a turbo counterpart was conceptualized [68]. For validation purposes, the values of the calibrated parameters were employed again to quantify the similarity between the observed and simulated trajectory data. In this regard, Figure 10a compares the simulated speed-time profiles under calibration with the 95th percentile values of the relevant parameters for both roundabouts within the influence area of 250 m identified by the vertical dashed lines; the speed profile from field data concerned the existing roundabout and was introduced just as a term of comparison. In turn, Figure 10b shows the simulated CO2 emissions only through the existing roundabout and turbo roundabout. According to the literature [70], the results showed that higher time was spent in acceleration through the turbo roundabout than the roundabout as typical standard for turbo roundabouts. However, under the low traffic volume conditions surveyed in the field, the conversion of a two-lane roundabout to a turbo roundabout gave a comparable amount of emissions; thus, the two-lane roundabout still remains as the more appropriate layout in the context of installation under examination. In general, the turbo roundabout option still represents the best solution from a safety point of view when a two-lane roundabout instead of a single-lane roundabout should be designed unless a multi-lane roundabout remains the preferred option if a maximum output of capacity is expected [71].

6. Conclusions

The paper gives a contribution that covers the topic of estimating the vehicle emissions on urban roundabouts based on the integrated use of vehicle trajectory data collected in the field by a smartphone app, the VSP methodology, and AIMSUN.
Data collection was inspired by a crowdsensing logic, where a “sentinel vehicle” namely the test vehicle travelled through the sampled roundabouts to acquire vehicle trajectory data by using a smartphone installed on board. This system of collecting instantaneous vehicle trajectory data, beyond being economic and user-friendly, made smart both the use of the available resources and the subsequent data process and analysis. Thus, the collected vehicle trajectory data were processed immediately to return the observed speed-time profiles and to obtain the vehicle acceleration and deceleration values then used in the calibration process. In addition to this, two further aspects have been also met: (a) using measures of kinematic parameters from vehicle trajectories collected in the field in order to calibrate the modelling parameters of AIMSUN; (b) using individual vehicle trajectories simulated in AIMSUN under calibrated parameters in order to increase the accuracy in the emission estimation. In this view, since the paper is focused in demonstrating the versatility of AIMSUN in estimating emissions on roundabouts, the application of the VSP methodology can be considered as supplemental to the methods of calibration already used in practice. For validation purposes, the paper also introduced the conversion of an existing roundabout into a turbo roundabout giving insights into how to assess the impacts of alternative roundabout designs from an environmental perspective. In spite of the research efforts done to pursue the stated objectives, limitation of the implemented methodology cannot be denied and can be associated with:
(1)
The selected test vehicle driven in the field;
(2)
Interactions with pedestrians or cyclists;
(3)
Variability in driving behaviour profiles experienced in the field;
(4)
Comparison of emissions just for one diesel car;
(5)
Roundabouts located in flat roads;
(6)
The selected driving movements here considered.
Although the pilot study here reported reflects local conditions, it can be repeated in the simulation environment.
A few suggestions can be also outlined regarding future research:
  • the chance to expand the roundabout sample in order to afford the general validation of the proposed methodology and to make a correlation between the prevailing geometric characteristics and the results obtained in terms of emissions; this is closely linked both to the use of more sentinel vehicles to better characterize the speed profiles experienced through the road units, given that the relative occurrence of each possible profile may be sensitive to the prevailing traffic levels or entry demand;
  • the calibration process that should also include the “global parameters” or further “local parameters” of AIMSUN for their possible effects on the simulated vehicle activity, however in combination with the “vehicle attributes” that were here fine-tuned based on the percentile values extracted from the parameter distributions surveyed in the field;
  • the transferability of the methodology should be tested with reference to other design alternatives to assess the environmental effects due to the conversion of an existing layout to another with similar space footprint, and to estimate the life-cycle costs of intersection design alternatives before the installation in the real world.
However, the study underlines the potential of new attitudes in the performance evaluation of road units in order to align infrastructural projects with the long-term ambitions about low-emission urban mobility. The proposed methodological approach has also proved to be friendly in collecting data via smartphone and in the subsequent data analysis and addressed novel opportunities to collect large-scale data through digital communities of users equipped with their smartphones to collectively share data and to derive some conclusions on any processes of common interest in order to optimize their current and future conditions of mobility.

Author Contributions

Conceptualization, A.G., T.G. and F.A.; methodology, F.A., M.C.C., and P.F.; software, F.A.; calibration and goal, F.A.; formal analysis, A.G., T.G. and F.A.; investigation, A.G., T.G. and F.A.; resources, A.G., T.G. and E.M.; data curation, F.A.; writing—original draft preparation, A.G., T.G. and F.A.; writing—review and editing, F.A., A.G., T.G., M.C.C., E.M. and P.F.; visualization, F.A., A.G., T.G., M.C.C., E.M. and P.F.; supervision, A.G., T.G., M.C.C., P.F. and E.M.; funding acquisition, A.G., and T.G. All authors have read and agreed to the published version of the manuscript.

Funding

This research was partially funded by CROWDSENSE project (POFESR2014-20_Sicily—Sicilian Region—PO FESR 2014–2020), Department of Engineering, University of Palermo, Italy. The authors also acknowledge the support of the projects: UIDB/00481/2020 and UIDP/00481/2020—Fundação para a Ciência e a Tecnologia; and CENTRO-01-0145-FEDER-022083—Centro Portugal Regional Operational Programme (Centro2020), under the PORTUGAL 2020 Partnership Agreement, through the European Regional Development Fund; DICA-VE (POCI-01-0145-FEDER-029463) and Driving2Driverless (POCI-01-0145-FEDER-031923) projects, co-funded by COMPETE2020, Portugal2020-Operational Program for Competitiveness and Internationalization (POCI) and European Union’s ERDF (European Regional Development Fund); and “PAC Portugal AutoCluster for the Future” project, funded by PORTUGAL 2020 Partnership Agreement.

Institutional Review Board Statement

Not applicable.

Informed Consent Statement

Not applicable.

Data Availability Statement

Data are available after kind request to the corresponding author.

Acknowledgments

The authors would like to gratefully acknowledge the reviewers who provided helpful comments and insightful suggestions on the draft of the manuscript. Special thanks also go to the Organizing Committees of the 17th Scientific and Technical Conference TSTP 2021 and CIGOS 2021 where an earlier version of this work, as drawn from the PhD thesis [49], was presented in 2021.

Conflicts of Interest

The authors declare no conflict of interest that could influence the work reported in this paper.

References

  1. Martins, V.; Anholon, R.; Quelhas, O. Sustainability Transportation Methods. In Encyclopedia of Sustainability in Higher Education; Filho, W.L., Ed.; Springer Nature: Cham, Switzerland, 2019; pp. 1–7. [Google Scholar]
  2. The Paris Agreement. 2016 United Nations Framework Convention on Climate Change (UNFCCC). Available online: https://unfccc.int/sites/default/files/resource/parisagreement_publication.pdf (accessed on 20 November 2021).
  3. Communication from the Commission: The European Green Deal. Available online: https://eur-lex.europa.eu/legal-content/EN/TXT/?qid=1588580774040&uri=CELEX:52019DC0640 (accessed on 20 November 2021).
  4. Horan, T.; Rae Zimmerman, R. Digital Infrastructures: Enabling Civil and Environmental Systems through Information Technology; Networked Cities Series; Routledge: London, UK, 2004; 272p. [Google Scholar]
  5. Litman, T. Autonomous Vehicle Implementation Predictions: Implications for Transport Planning; Victoria Transport Policy Institute: Victoria, BC, Canada, 2020. [Google Scholar]
  6. Frey, H.C. Trends in on-road transportation energy and emissions. J. Air Waste Manag. Assoc. 2018, 68, 514–563. [Google Scholar] [CrossRef]
  7. Abdelrahman, A.; El-Wakeel, A.S.; Noureldin, A.; Hassanein, H.S. Crowdsensing-Based Personalized Dynamic Route Planning for Smart Vehicles. IEEE Netw. 2020, 34, 216–223. [Google Scholar] [CrossRef]
  8. Castignani, G.; Derrmann, T.; Frank, R.; Engel, T. Driver Behavior Profiling Using Smartphones: A Low-Cost Platform for Driver Monitoring. IEEE Intell. Transp. Syst. Mag. 2015, 7, 91–102. [Google Scholar] [CrossRef]
  9. Rapa, M.; Gobbi, L.; Ruggieri, R. Environmental and Economic Sustainability of Electric Vehicles: Life Cycle Assessment and Life Cycle Costing Evaluation of Electricity Sources. Energies 2020, 13, 6292. [Google Scholar] [CrossRef]
  10. Monzon, A.; Wang, Y. Toward Sustainable and Low Carbon Road Transportation: Policies, Tools, and Planning Methods. Sustainability 2019, 11, 1709. [Google Scholar] [CrossRef] [Green Version]
  11. Hamadneh, J.; Esztergár-Kiss, D. The Influence of Introducing Autonomous Vehicles on Conventional Transport Modes and Travel Time. Energies 2021, 14, 4163. [Google Scholar] [CrossRef]
  12. Lyu, P.; Wang, P.S.; Liu, Y.; Wang, Y. Review of the studies on emission evaluation approaches for operating vehicles. J. Traffic Transp. Eng. (Engl. Ed.) 2021, 8, 493–509. [Google Scholar] [CrossRef]
  13. Fernandes, P.; Macedo, E.; Bahmankhah, B.; Tomas, R.F.; Bandeira, J.M.; Coelho, M.C. Are internally observable vehicle data good predictors of vehicle emissions? Transp. Res. Part D Transp. Environ. 2019, 77, 252–270. [Google Scholar] [CrossRef]
  14. Jiménez-Palacios, J.L. Understanding and Quantifying Motor Vehicle Emissions with Vehicle Specific Power and TILDAS Remote Sensing. Ph.D. Thesis, Massachusetts Institute of Technology, Department of Mechanical Engineering, Cambridge, MA, USA, 1999. [Google Scholar]
  15. Wyatt, D.W.; Li, H.; Tate, J.E. The impact of road grade on carbon dioxide (CO2) emission of a passenger vehicle in real-world driving. Transp. Res. Part D Transp. Environ. 2014, 32, 160–170. [Google Scholar] [CrossRef] [Green Version]
  16. Jaworski, A.; Mądziel, M.; Lejda, K. Creating an emission model based on portable emission measurement system for the purpose of a roundabout. Environ. Sci. Pollut. Res. Int. 2019, 26, 21641–21654. [Google Scholar] [CrossRef] [Green Version]
  17. Oh, G.; Peng, H. Eco-driving at Signalized Intersections: What is Possible in the Real-World? In Proceedings of the 21st International Conference on Intelligent Transportation Systems (ITSC), Maui, HI, USA, 4–7 November 2018; pp. 3674–3679. [Google Scholar]
  18. Ntziachristos, L.; Gkatzoflias, D.; Kouridis, C.; Samaras, Z. COPERT: A European Road Transport Emission Inventory Model. In Information Technologies in Environmental Engineering. Environmental Science and Engineering; Athanasiadis, I.N., Rizzoli, A.E., Mitkas, P.A., Gómez, J.M., Eds.; Springer: Berlin/Heidelberg, Germany, 2009; pp. 491–504. [Google Scholar]
  19. EMFAC 2017 Volume I—User’s Guide V1.0.2 Mobile Source Analysis Branch, Air Quality Planning & Science Division, California Air Resource Board Sacramento, CA 2018. Available online: https://www.arb.ca.gov/msei/downloads/emfac2017-volume-i-users-guide.pdf (accessed on 6 December 2021).
  20. EMFAC-HK Vehicle Emission Calculation. Available online: https://www.epd.gov.hk/epd/english/environmentinhk/air/guide_ref/emfac-hk.html (accessed on 6 December 2021).
  21. Tchepel, O.; Costa, A.M.; Amorim, J.H.; Miranda, A.; Borrego, C. Transport emission model and dispersion study for Lisbon air quality at local scale. In Proceedings of the 11th International Symposium, Transport and Air Pollution, Graz, Austria, 19–21 July 2002; Volume I, pp. 109–116. [Google Scholar]
  22. Akçelik, R.; Smit, R.; Besley, M. Recalibration of a vehicle power model for fuel and emission estimation and its effect on assessment of alternative intersection treatments. In Proceedings of the 4th International Roundabout Conference, Seattle, WA, USA, 16–18 April 2014. [Google Scholar]
  23. Transportation Research Board and National Research Council. Modeling Mobile-Source Emissions; The National Academies Press: Washington, DC, USA, 2000. [Google Scholar] [CrossRef]
  24. Fernandes, P.; Pereira, S.R.; Bandeira, J.M.; Vasconcelos, L.; Bastos Silva, A.; Coelho, M.C. Driving around turbo-roundabouts vs. conventional roundabouts: Are there advantages regarding pollutant emissions? Int. J. Sustain. Transp. 2016, 10, 847–860. [Google Scholar] [CrossRef]
  25. National Academies of Sciences, Engineering, and Medicine. Predicting Air Quality Effects of Traffic-Flow Improvements: Final Report and User’s Guide; The National Academies Press: Washington, DC, USA, 2005. [Google Scholar] [CrossRef]
  26. Ryu, B.Y.; Jung, H.J.; Bae, S.H. Development of a corrected average speed model for calculating carbon dioxide emissions per link unit on urban roads. Transp. Res. Part D 2015, 34, 245–254. [Google Scholar] [CrossRef]
  27. US EPA. Population and Activity of On-Road Vehicles in MOVES2014; United States Environmental Protection Agency (US EPA): Washington, DC, USA, 2016.
  28. Smit, R.; Smokers, R.; Schoen, E. VERSIT+ LD: Development of a new emission factor model for passenger cars linking real-world emissions to driving cycle characteristics. In Proceedings of the 14th Symposium Transport and Air Pollution, Graz, Austria, 1–3 June 2005; Volume 1, pp. 177–186. [Google Scholar]
  29. Zeng, W.; Miwa, T.; Morikawa, T. Prediction of vehicle CO2 emission and its application to eco-routing navigation. Transp. Res. Part C 2016, 68, 194–214. [Google Scholar] [CrossRef]
  30. Hao, P.; Boriboonsomsin, K.; Wu, G.; Barth, M.J. Modal Activity-Based Stochastic Model for Estimating Vehicle Trajectories from Sparse Mobile Sensor Data. IEEE Trans. Intell. Transp. Syst. 2017, 18, 701–711. [Google Scholar] [CrossRef]
  31. Barceló, J. Fundamentals of Traffic Simulation, 1st ed.; Springer: London, UK, 2010. [Google Scholar]
  32. Rahimi, A.M.; Dulebenets, M.A.; Mazaheri, A. Evaluation of Microsimulation Models for Roadway Segments with Different Functional Classifications in Northern Iran. Infrastructures 2021, 6, 46. [Google Scholar] [CrossRef]
  33. AIMSUN, Version 8 Dynamic Simulator User Manual; TSS-Transport Simulation Systems: Barcelona Spain, 2011.
  34. National Academies of Sciences, Engineering, and Medicine. Roundabouts: An Informational Guide, 2nd ed.; The National Academies Press: Washington, DC, USA, 2010. [Google Scholar] [CrossRef]
  35. Giuffrè, O.; Granà, A.; Giuffrè, T.; Acuto, F.; Lo Pinto, A. Life-Cycle Costing Decision-Making Methodology and Urban Intersection Design: Modelling and Analysis for a Circular City. In Methods in Modern Urban Transportation Systems and Networks; Macioszek, E., Sierpiński, G., Eds.; Springer Nature: Cham, Switzerland, 2021; pp. 59–86. [Google Scholar]
  36. Parikka-Alhola, K.; Nissinen, A. Environmental impacts of transport as award criteria in public road construction procurement. Int. J. Constr. Manag. 2014, 12, 35–49. [Google Scholar] [CrossRef]
  37. Hallmark, S.L.; Wang, B.; Mudgal, A.; Isebrands, H. On-Road Evaluation of Emission Impacts of Roundabouts. Transp. Res. Rec. 2011, 2265, 226–233. [Google Scholar] [CrossRef]
  38. Coelho, M.C.; Farias, T.L.; Rouphail, N.M. Effect of roundabout operations on pollutant emissions. Transp. Res. Part D Transp. Environ. 2006, 11, 333–343. [Google Scholar] [CrossRef]
  39. Salamati, K.; Coelho, M.; Fernandes, P.; Rouphail, N.M.; Frey, H.C.; Bandeira, J. Emission Estimation at Multilane Roundabouts: Effect of Movement and Approach Lane. Transp. Res. Rec. 2014, 2389, 12–21. [Google Scholar] [CrossRef] [Green Version]
  40. Fernandes, P.; Salamati, K.; Rouphail, N.; Coelho, M. Identification of emission hotspots in roundabouts corridors. Transp. Res. Part D Transp. Environ. 2015, 37, 48–64. [Google Scholar] [CrossRef]
  41. Guerrieri, M.; Corriere, F.; Rizzo, G.; Casto, B.L.; Scaccianoce, G. Improving the Sustainability of Transportation: Environmental and Functional Benefits of Right Turn By-Pass Lanes at Roundabouts. Sustainability 2015, 7, 5838–5856. [Google Scholar] [CrossRef] [Green Version]
  42. Lakouari, N.; Oubram, O.; Bassam, A.; Pomares Hernandez, S.E.; Marzoug, R.; Ez-Zahraouy, H. Modeling and simulation of CO2 emissions in roundabout intersection. J. Comput. Sci. 2020, 40, 101072. [Google Scholar] [CrossRef]
  43. Mudgal, A.; Hallmark, S.; Carriquiry, A.; Gkritza, K. Driving behavior at a roundabout: A hierarchical Bayesian regression analysis. Transp. Res. Part D Transp. Environ. 2014, 26, 20–26. [Google Scholar] [CrossRef]
  44. Ahn, K.; Kronprasert, N.; Rakha, H. Energy and Environmental Assessment of High-Speed Roundabouts. Transp. Res. Rec. 2009, 2123, 54–65. [Google Scholar] [CrossRef]
  45. PTV. VISSIM Version 5, User Manual; Planung Transport Verkehr AG: Karlsruhe, Germany, 2008. [Google Scholar]
  46. Anya, A.R.; Rouphail, N.M.; Frey, H.C.; Schroeder, B. Application of AIMSUN Microsimulation Model to Estimate Emissions on Signalized Arterial Corridors. Transp. Res. Rec. 2014, 2428, 75–86. [Google Scholar] [CrossRef]
  47. Fernandes, P.; Coelho, M.C.; Rouphail, N.M. Assessing the impact of closely-spaced intersections on traffic operations and pollutant emissions on a corridor level. Transp. Res. Part D Transp. Environ. 2017, 54, 304–320. [Google Scholar] [CrossRef]
  48. Mądziel, M.; Campisi, T.; Jaworski, A.; Kuszewski, H.; Woś, P. Assessing Vehicle Emissions from a Multi-Lane to Turbo Roundabout Conversion Using a Microsimulation Tool. Energies 2021, 14, 4399. [Google Scholar] [CrossRef]
  49. Acuto, F. Integrating Vehicle specific Power Methodology and Microsimulation in Estimating emissions on Urban Roundabouts. Ph.D. Thesis, Department of Engineering, University of Palermo, Palermo, Italy, 2021. [Google Scholar]
  50. Fernandes, P.; Rouphail, N.M.; Coelho, C.M. Turboroundabouts along Corridors: Analysis of Operational and Environmental Impacts. Transp. Res. Rec. J. Transp. Res. Board 2017, 2627, 46–56. [Google Scholar] [CrossRef]
  51. Samaras, C.; Tsokolis, D.; Toffolo, S.; Magra, G.; Ntziachristos, L.; Samaras, Z. Improving fuel consumption and CO2 emissions calculations in urban areas by coupling a dynamic micro traffic model with an instantaneous emissions model. Transp. Res. Part D Transp. Environ. 2018, 65, 772–783. [Google Scholar] [CrossRef]
  52. Stogios, C.; Saleh, M.; Ganji, A.; Tu, R.; Xu, J.; Roorda, M.J.; Hatzopoulou, M. Determining the Effects of Automated Vehicle Driving Behavior on Vehicle Emissions and Performance of an Urban Corridor. In Proceedings of the TRB 97th Annual Meeting, Washington, DC, USA, 7–11 January 2018. [Google Scholar]
  53. Ministero delle Infrastrutture e dei Trasporti [Ministry of Infrastructure and Transport]. Available online: http://www.mit.gov.it/mit/mop_all.php?p_id=13799 (accessed on 18 December 2021).
  54. Schroeder, B.J.; Rouphail, N.; Salamati, K.; Bugg, Z. Effect of Pedestrian Impedance on Vehicular Capacity at Multilane Roundabouts with Consideration of Crossing Treatments. Transp. Res. Rec. J. Transp. Res. Board 2012, 2312, 14–24. [Google Scholar] [CrossRef]
  55. Coelho, M.C.; Frey, C.H.; Rouphail, N.M.; Zhai, H.; Pelkmans, L. Assessing methods for comparing emissions from gasoline and diesel light-duty vehicles based on microscale measurements. Transp. Res. Part D 2009, 14, 91–99. [Google Scholar] [CrossRef]
  56. Zhai, Z.; Song, G.; Lu, H.; He, W.; Yu, L. Validation of temporal and spatial consistency of facility- and speed-specific vehicle-specific power distributions for emission estimation: A case study in Beijing, China. J. Air Waste Manag. Assoc. 2017, 67, 949–957. [Google Scholar] [CrossRef] [PubMed]
  57. Li, S.; Zhu, K.; van Gelder, B.; Nagle, J.; Tuttle, C. Reconsideration of sample size requirements for field traffic data collection with global positioning system devices. Transp. Res. Rec. 2002, 1804, 17–22. [Google Scholar] [CrossRef]
  58. Bokare, P.S.; Maurya, A.K. Acceleration-Deceleration Behaviour of Various Vehicle Types. Transp. Res. Procedia 2017, 25, 4733–4749. [Google Scholar] [CrossRef]
  59. Wang, J.; Dixon, K.; Li, H.; Ogle, J. Normal acceleration behavior of passenger vehicles starting from rest at all-way stop-controlled intersections. Transp. Res. Rec. 2004, 1883, 158–166. [Google Scholar] [CrossRef]
  60. Wang, J.; Dixon, K.; Li, H.; Ogle, J. Normal deceleration behavior of passenger vehicles at stop sign controlled intersections evaluated within-vehicle global positioning system data. Transp. Res. Rec. 2005, 1937, 120–127. [Google Scholar] [CrossRef]
  61. Fernandes, P.; Tomás, R.; Acuto, F.; Pascale, A.; Bahmankhah, B.; Guarnaccia, C.; Granà, A.; Coelho, M.C. Impacts of roundabouts in suburban areas on congestion-specific vehicle speed profiles, pollutant and noise emissions: An empirical analysis. Sustain. Cities Soc. 2020, 62, 102386. [Google Scholar] [CrossRef]
  62. Giuffrè, O.; Granà, A.; Giuffrè, T.; Acuto, F.; Tumminello, M.L. Estimating pollutant emissions based on speed profiles at urban roundabouts: A pilot study. In Smart and Green Solutions for Transport Systems, Advances in Intelligent Systems and Computing; Sierpiński, G., Ed.; Springer: Heidelberg, Germany, 2020; Volume 1091, pp. 184–200. [Google Scholar]
  63. Jurecki, R.S.; Stanczyk, T.L. A Methodology for Evaluating Driving Styles in Various Road Conditions. Energies 2021, 14, 3570. [Google Scholar] [CrossRef]
  64. US EPA. Methodology for Developing Modal Emission Rates for EPA’s Multi-Scale Motor Vehicle & Equipment Emission System, Report number EPA420-R-02-027; United States Environmental Protection Agency (US EPA): Washington, DC, USA, 2002.
  65. Frey, H.C.; Unal, A.; Chen, J.J.; Song, L. Evaluation and Recommendation of a Modal Method for Modeling Vehicle Emissions. Corpus ID: 292981. 2003. Available online: https://www3.epa.gov/ttnchie1/conference/ei12/mobile/frey.pdf (accessed on 20 November 2021).
  66. Giuffrè, O.; Granà, A.; Tumminello, M.L.; Sferlazza, A. Capacity-based calculation of passenger car equivalents using traffic simulation at double-lane roundabouts. Simul. Model. Pract. Theory 2018, 81, 1–30. [Google Scholar] [CrossRef]
  67. Acuto, F.; Giuffrè, T.; Granà, A. Environmental Performance Evaluation at Urban Roundabouts. In Emerging Technologies and Applications for Green Infrastructure; Ha-Minh, C., Tang, A.M., Bui, T.Q., Vu, X.H., Huynh, D.V.K., Eds.; Lecture Notes in Civil Engineering; Springer: Singapore, 2022; Volume 203, pp. 1613–1621. [Google Scholar]
  68. Royal Haskoning DHV. Roundabouts—Application and Design. A Practical Manual. Available online: https://nmfv.dk/wp-content/uploads/2012/06/RDC_Netherlands.pdf (accessed on 20 November 2021).
  69. Acuto, F.; Giuffrè, T.; Granà, A. Environmental Performance Assessment of Urban Roundabouts. In Intelligent Solutions for Cities and Mobility of the Future; Lecture Notes in Networks and Systems; Sierpiński, G., Ed.; Springer: Cham, Switzerland, 2022; Volume 352, pp. 27–45. [Google Scholar]
  70. Vasconcelos, L.; Silva, A.B.; Seco, Á.M.; Fernandes, P.; Coelho, M.C. Turboroundabouts: Multicriterion Assessment of Intersection Capacity, Safety, and Emissions. Transp. Res. Rec. J. Transp. Res. Board 2014, 2402, 28–37. [Google Scholar] [CrossRef] [Green Version]
  71. Granà, A.; Giuffrè, T.; Macioszek, E.; Acuto, F. Estimation of Passenger Car Equivalents for Two-Lane and Turbo Roundabouts Using AIMSUN. Front. Built Environ. 2020, 6, 86. [Google Scholar] [CrossRef]
Figure 1. Overview of the proposed methodology.
Energies 15 01371 g001
Figure 2. Schematic aerial view of Auto-Cad figures for the sampled roundabouts in the road network of Palermo City, Italy, each of them named as follows: (a) Roundabout 1; (b) Roundabout 2; (c) Roundabout 3; (d) Roundabout 4; (e) Roundabout 5; (f) Roundabout 6. Note: each image contains the origin or destination (A, B) of through movements travelled by the test vehicle in the driving directions from A to B and from B to A.
Energies 15 01371 g002
Figure 3. Second-by-second speed-time profiles of through movement observed in direction AB: (a) profile without stopping at Roundabout 2 in Figure 2b; (b) profile with one stop at Roundabout 4 in Figure 2d.
Energies 15 01371 g003aEnergies 15 01371 g003b
Figure 4. Relative frequencies of time spent in VSP modes at the sampled roundabouts in Figure 2 as follows: (a) Roundabout 1; (b) Roundabout 2; (c) Roundabout 3; (d) Roundabout 4; (e) Roundabout 5; (f) Roundabout 6. Note: direction AB means the through movement from A to B in Figure 2; direction BA means the through movement from B to A in Figure 2.
Energies 15 01371 g004
Figure 5. Spatial distribution of CO2 emissions based on speed profiles for: (a) Roundabout 2 in Figure 2b and (b) Roundabout 4 in Figure 2d.
Energies 15 01371 g005
Figure 6. Observed vs. simulated speed-time profiles at: (a) Roundabout 1 (movement AB) in Figure 2a; (b) Roundabout 3 (movement BA) in Figure 2c.
Energies 15 01371 g006
Figure 7. Observed vs. simulated data at Roundabout 5 (directions AB and BA in Figure 2e): (a) speed profiles; (b) regression line of observed vs. speeds simulated under calibration with 95th percentile parameters. Note: observed stands for observed data; simulation (default) stands for default data; simulation (85th percentile) or simulation (95th percentile) stand for simulation under parameters calibrated with the mean values of the 85th or 95th percentiles of the values of acceleration and deceleration observed in the field.
Energies 15 01371 g007
Figure 8. The relative frequencies of time spent in VSP modes under simulation with the default parameters and calibration with 85th or 95th percentile values of the selected vehicle attributes of AIMSUN for: (a) Roundabout 2, movement AB, in Figure 2b; (b) Roundabout 4, movement AB, in Figure 2d. Note: simulation (default) stands for default data; simulation (85th) or simulation (95th) stand for simulation under parameters calibrated with the mean values of the 85th or 95th percentiles of the values of acceleration and deceleration observed in the field.
Energies 15 01371 g008
Figure 9. Observed versus simulated emissions at sampled roundabouts (through movements): (a) CO2; (b) CO; (c) NOx + HC.
Energies 15 01371 g009aEnergies 15 01371 g009b
Figure 10. Turbo roundabout versus roundabout: (a) speed-time profiles; (b) simulated CO2 emissions for through movements.
Energies 15 01371 g010aEnergies 15 01371 g010b
Table 1. Summary of geometric, kinematic and traffic data of the sampled roundabouts.
NoEntry (Exit)Outer Diameter [m]Entry (Exit) Lane Width 1 [m]Ring Width [m]Entry Traffic 2 [vph]Conflicting Traffic 3 [vph]Entry (Exit) Speed 4 [km/h]Circulating Speed [km/h]
13 (4)48.03.50 (3.50)7.001576 150822.1 (30)18.2
24 (4)80.04.50 5 (4.50)8.003984319625.9 (36)23.1
34 (4)50.03.50 (3.50)9.002336190423.3 (31)19.9
44 (4)60.04.75 6 (4.75)10.001306137229.8 (42)24.8
54 (4)80.04.00 (5.00 7)9.003992297125.1 (35)23.1
64 (4) 80.05.00 (4.50)10.0098897230.0 (38)25.5
1 Entry width before widening the entry roadway or before the by-pass for right turns. 2 Average values of traffic volumes (in vehicles per hour—vph) from the right and left lanes videotaped during the morning peak period (7:00–8:30 a.m.) where the entry traffic distribution of 60-40 between major and minor roads was observed. 3 Average values of traffic volumes (all circulating lanes) observed for the morning peak period (7:00–8:30 a.m.). 4 Average values of speeds at the entry and exit lines. 5 5.00 m (4.00 m) for the one-lane entry (exit) on minor street. 6 3.50 m for the one-lane entry (exit) on minor street. 7 4.50 m for the one-lane exit on minor street.
Table 2. Summary statistics for the distributions of key kinematic parameters collected in the field.
ParameterMaximum Speed [m/s]Maximum
Acceleration [m/s2]
Maximum
Deceleration [m/s2]
μAB 1 (s.e.)14.459 (0.384)1.770 (0.077)2.498 (0.108)
μBA 1 (s.e.)14.117 (0.357)1.553 (0.074)2.417 (0.111)
95% c.i. for difference in means(−0.700, 1.385)(0.004, 0.430)(−0.227, 0.390)
t0.05,92 value 2 0.6522.0230.522
t-critical value 1.9861.9861.986
p-Value (α = 0.05)30.5160.050.603
F0.05,46,46 value 41.1581.1020.946
F-critical value1.7961.7961.796
F-probability0.6200.7400.850
1 µAB and µBA stand for the mean values of the samples of the observations of each parameter in AB and BA directions; 2 t-value is the result of the two-sample t-test done to compare the equality of the means (µAB and µBA) of samples from two populations with equal sample size: reject the null hypothesis that the two means are equal if |t| > t1-α/2,N where t1-α/2,N is the critical value of the t distribution with N degrees of freedom at the significance level α = 0.05); 3 α is the significance level; 4 F-value is the result of the two-tailed F-test done to answer the question whether two samples come from populations with equal variances (the hypothesis that the two variances were equal is rejected if F > F α / 2 ,   N 1 1 , N 2 1 , where F α / 2 , N 1 1 , N 2 1 is the critical value of the F distribution with N1-1 and N2-1 degrees of freedom at the significance level of α = 0.05).
Table 3. Summary statistics for the distributions of the 85th or 95th percentile accelerations and decelerations observed in the field.
Parameter85th Percentile Acceleration [m/s2]95th
Percentile
Acceleration [m/s2]
85th Percentile
Deceleration [m/s2]
95th Percentile
Deceleration [m/s2]
μAB 1 (s.e.)0.916 (0.030)1.286 (0.039)1.423 (0.082)2.054 (0.089)
μBA 1 (s.e.)0.868 (0.025)1.195 (0.042)1.251 (0.059)1.882 (0.085)
95% c.i. for difference in means(−0.031, 0.126)(−0.024, 0.205)(−0.022, 0.381)(−0.073, 0.417)
t0.05,92 value 2 1.2051.561.761.393
t-critical value 1.9861.9861.9861.986
p-Value (α = 0.05) 30.2310.1210.100.167
F0.05,46,46 value 41.3621.181.761.081
F-critical value1.7961.7961.7961.796
F-probability0.300.600.100.80
1 µAB and µBA stand for the mean values of the samples of the observations of each parameter in AB and BA directions; 2 t-value is the result of the two-sample t-test done to compare the equality of the means (µAB and µBA) of samples from two populations with equal sample size: reject the null hypothesis that the two means are equal if |t| > t1-α/2,N where t1-α/2,N is the critical value of the t distribution with N degrees of freedom at the significance level of α = 0.05); 3 α is the significance level; 4 F-value is the result of the two-tailed F-test done to answer the question whether two samples come from populations with equal variances (the hypothesis that the two variances were equal is rejected if F > F α / 2 , N 1 1 , N 2 1 , where F α / 2 , N 1 1 , N 2 1 is the critical value of the F distribution having N1-1 and N2-1 degrees of freedom at the significance level of α = 0.05).
Table 4. The VSP modes, power requirements and mean emission rates by VSP mode for LPDV 1.
VSP ModeKw/ton 2Mean Modal Emission Rates (g/s)
CO2CONOx,HC
1VSP < −20.210.000030.00130.00014
2−2 ≤ VSP < 00.610.000070.00260.00011
30 ≤ VSP < 10.730.000140.00340.00011
41 ≤ VSP < 41.500.000250.00610.00017
54 ≤ VSP < 72.340.000290.00940.00020
67 ≤ VSP < 103.290.000690.01250.00023
710 ≤ VSP < 134.200.000580.01550.00024
813 ≤ VSP < 164.940.000640.01780.00023
916 ≤ VSP < 195.570.000610.02130.00024
1019 ≤ VSP < 236.260.001010.03250.00028
1123 ≤ VSP < 287.400.001150.05580.00037
1228 ≤ VSP < 338.390.000960.07430.00042
1333 ≤ VSP < 399.410.000770.10420.00040
14VSP ≥ 3910.480.000730.14590.00042
1 LPDV stands for Light Passenger Diesel Vehicles; 2 as calculated by Equation (5).
Table 5. The results of the two-sample t-test for the observed vs. simulated VSP distributions for the sampled roundabouts (direction AB in Figure 2).
VSPμobs 1
(s.e.)
μsim 1
(s.e.)
95% c.i. for
Difference in Means
t(α = 0.05)
(d.f) 2
t-Critical p-Value
(α = 0.05) 3
Roundabout 1
obs. vs. default1.90 (0.80)3.15 (1.48)(−4.628, 2.135)0.73 (55)2.0040.46
obs. vs. 85th percentile0.98 (0.60)1.80 (1.09)(−3.313, 1.667)0.66 (71)1.9930.51
obs. vs. 95th percentile1.67 (0.77)1.96 (1.24)(−3.228, 2.654)0.20 (55)2.0040.85
Roundabout 2
obs. vs. default3.52 (3.06)5.11 (2.69)(−9.747, 6.571)0.39 (58)2.0020.69
obs. vs. 85th percentile3.56 (2.36)2.54 (1.23)(−2.340, 8.371)1.13 (53)2.0050.27
obs. vs. 95th percentile3.09 (2.02)2.80 (1.30)(−3.135, 7.366)0.39 (64)1.9970.43
Roundabout 3
obs. vs. default1.60 (1.75)3.31 (2.57)(−7.969, 4.557)0.55 (49)2.0090.58
obs. vs. 85th percentile1.52 (1.69)2.40 (1.47)(−5.372, 3.621)0.39 (57)2.0020.69
obs. vs. 95th percentile1.14 (1.48)1.44 (1.58)(−4.630, 4.019)0.14 (68)1.9950.88
Roundabout 4
obs. vs. default1.60 (1.57)5.99 (2.66)(−10.51, 1.942)1.39 (46)2.0140.17
obs. vs. 85th percentile1.75 (1.32)0.82 (1.05)(−4.288, 2.420)0.55 (72)1.9930.58
obs. vs. 95th percentile2.47 (0.85) 2.32 (1.09)(−2.607, 2.899)0.10 (88)1.9800.91
Roundabout 5
obs. vs. default2.08 (1.21)3.67 (3.33)(−8.749, 5.573)0.44 (39)2.0230.66
obs. vs. 85th percentile2.75 (0.79)1.73 (0.80)(−1.220, 3.259)0.90 (104)1.9830.37
obs. vs. 95th percentile2.46 (0.96)1.77 (1.71)(−3.242, 4.606)0.35 (68)1.9950.73
Roundabout 6
obs. vs. default1.98 (1.21)1.09 (1.58)(−3.089, 4.881)0.45 (74)1.9940.65
obs. vs. 85th percentile2.01 (1.22)0.22 (1.22)(−1.722, 5.294)1.01 (74)1.9920.31
obs. vs. 95th percentile1.86 (1.28)0.98 (1.67)(−3.331, 5.080)0.41 (70)1.9960.68
1 µobs and µsim stand for the mean values of the samples of the observed vs. simulated VSP distributions for each roundabout in direction AB; 2 |t|value of the two-sample t-test done to compare the equality of the means of samples of two populations with equal sample size; 3 α = 0.05 is the significance level.
Table 6. The results of the two-sample t-test for comparing average emissions between observed and simulated data (default, 85th and 95th) by pollutant and by driving direction AB and BA.
PollutantsμAB 1
(s.e.)
μBA 1
(s.e.)
95% c.i. for Difference in Meanst(α = 0.05)
(d.f) 2
t-Critical p-Value
(α = 0.05) 3
CO2
default (AB)66.54 (4.89)69.41 (4.17)(−17.20; 11.46)0.45 (10)2.2280.66
default (BA)76.85 (8.78)74.64 (3.87)(−19.19; 23.60)0.23 (7)2.3640.82
85th percentile (AB)66.54 (4.89)64.27 (6.77)(−16.36; 20.90)0.27 (9)2.2620.80
85th percentile (BA)76.85 (8.78)65.99 (6.05)(−12.92; 34.63)1.01 (9)2.2620.34
95th percentile (AB)66.54 (4.89)71.26 (6.66)(−23.14; 13.70)0.57 (9)2.2620.60
95th percentile (BA)76.85 (8.78)67.80 (5.66)(−14.24; 32.33)0.86 (9)2.2620.42
CO
default (AB)0.011 (0.001)0.012 (0.001)(−0.005; 0.002)0.76 (10)2.2280.46
default (BA)0.010 (0.001)0.011 (0.001)(−0.003; 0.001)0.84 (10)2.2280.42
85th percentile (AB)0.011 (0.001)0.010 (0.001)(−0.003, 0.004)0.44 (10)2.2280.67
85th percentile (BA)0.010 (0.001)0.010 (0.001)(−0.002; 0.003)0.36 (10)2.2280.73
95th percentile (AB)0.011 (0.001)0.012 (0.001)(−0.004; 0.003)0.23 (10)2.2620.82
95th percentile (BA)0.010 (0.001)0.010 (0.001)(−0.002; 0.003)0.15 (10)2.2620.88
NOx
default (AB)0.29 (0.03)0.41 (0.04)(−0.247, 0.009)2.06 (9)2.2620.07
default (BA)0.27 (0.04)0.38 (0.04)(−0.233, 0.013)1.99 (10)2.2280.07
85th percentile (AB)0.29 (0.03)0.26 (0.03)(−0.064, 0.133)0.78 (10)2.2280.45
85th percentile (BA)0.27 (0.04)0.26 (0.03)(−0.093; 0.114)0.22 (9)2.2620.83
95th percentile (AB)0.29 (0.03)0.28 (0.04)(−0.108, 0.117)0.10 (10)2.2280.93
95th percentile (BA)0.27 (0.04)0.27 (0.03)(−0.098; 0.109)0.12 (9)2.2620.90
HC
default (AB)0.007 (0.001)0.006 (0.001)(−0.001; 0.003)0.87 (8)2.3060.41
default (BA)0.006 (0.001)0.005 (0.001)(−0.001, 0.002)0.85 (8)2.3060.42
85th percentile (AB)0.007 (0.001)0.006 (0.001)(−0.003; 0.003)0.27 (10)2.2280.80
85th percentile (BA)0.006 (0.001)0.007 (0.001)(−0.002; 0.0006)1.23 (10)2.2280.25
95th percentile (AB)0.007 (0.001)0.006 (0.001)(−0.002; 0.003)0.46 (9)2.2620.65
95th percentile (BA)0.006 (0.001)0.006 (0.001)(−0.001; 0.0012)0.03 (9)2.2620.98
1 µAB and µBA stand for the mean values of the samples of the observed and simulated emissions for each pollutant and driving directions AB and BA; 2 |t|value of the two-sample t-test done to compare the equality of the means of samples of two populations with equal sample size; 3 α = 0.05 is the significance level.
Table 7. Geometric conceptualization of the turbo roundabout.
Cross Section[m]
Radius of the inside roadway, inner edge R115.00
Radius of the inside roadway, outer edgeR2 120.40
Radius of the outside roadway, inner edgeR3 220.70
Radius of the outside roadway, outer edgeR4 325.95
Inner or outer edge line offset0.45
Inside lane4.35
Divider inner or outer line offset0.20
Divider0.30
Outside lane4.25
Inside roadway width5.50
Outside roadway width5.25
Shift 1—inside to middle5.15
Shift 2—middle to outside4.95
Bias 1 for R1 (Bias 2 for other radii)2.58 (2.48)
Arc centre bias for R1 (Bias 2 for other radii)2.60 (2.45)
1 R2 = R1 + inside roadway width-bias difference (differences match roadway widths); 2 R3 = R2 + divider width; 3 R4 = R3 + outside roadway width.
Publisher’s Note: MDPI stays neutral with regard to jurisdictional claims in published maps and institutional affiliations.

