Article

A Detailed Hydrodynamic Study of the Split-Plate Airlift Reactor by Using Non-Invasive Gamma-Ray Techniques

by
Laith S. Sabri
1,2,*,
Abbas J. Sultan
1,2,
Hasan Shakir Majdi
3,
Shadha K. Jebur
1,2 and
Muthanna H. Al-Dahhan
1,4
1
Multiphase Flow and Reactors Engineering and Application Laboratory (mReal), Chemical and Biochemical Engineering Department, Missouri University of Science and Technology, Rolla, MO 65409, USA
2
Chemical Engineering Department, University of Technology-Iraq, Baghdad 10066, Iraq
3
Chemical and Petroleum Industries Engineering Department, Al-Mustaqbal University College, Hillah 51001, Iraq
4
Technology Development Cell, Mohammed VI Polytechnic University, Ben Guerir 43150, Morocco
*
Author to whom correspondence should be addressed.
ChemEngineering 2022, 6(1), 18; https://doi.org/10.3390/chemengineering6010018
Submission received: 12 December 2021 / Revised: 21 January 2022 / Accepted: 25 January 2022 / Published: 10 February 2022

Abstract

:
This study focused on detailed investigations of selected local hydrodynamics in split airlift reactor by using an unconventional measurements facility: computed tomography (CT) and radioactive particle tracking (RPT). The local distribution in a cross-sectional manner with its radial’s profiles for gas holdup, liquid velocity flow field, shear stresses, and turbulent kinetic energy were studied under various gas velocity 1, 2 and 3 cm/s with various six axial level z = 12, 20, 40, 60, 90 and 112 cm. The distribution in gas–liquid phases in the whole split reactor column, the riser and downcomer sides, including their behavior at the top and bottom sections of the split plate was also described. The outcomes of this study displayed an exemplary gas–liquid phases dispersion approximately in all reactor’s zones and had large magnitude over the ring of the sparger as well as upper the split plate. Furthermore, the outcomes pointed out that the distribution of this flow may significantly impacts the performance of the split reactor, which may have essential influence on its performance particularly for microorganisms culturing applications. These outcomes are dependable as benchmark information to validate computational fluid dynamics (CFD) simulations and other models.

1. Introduction

A split airlift reactor is a multiphase contactor for many industrial processes involving gas–liquid or gas–solid–liquid systems [1,2]. It consists of three distinct regions, riser, degassing, and the downcomer region. These distinguish regions are created by placing a separating plate at the center of this reactor, which forms a path for circulating the liquid inside the reactor.
This split airlift reactor is characterized by a natural circulation flow pattern, which occurs by bubbling air or gas into the liquid by using a gas sparger located at the bottom of the riser section [3]. These formed bubbles (i.e., gassed liquid) move up in the riser section and once they reach the degassing region (i.e., sudden widening), the air bubbles velocity reduce and thus the bubbles escape from the liquid at the top [4]. As a result, the degassed liquid (i.e., denser liquid) flows downward to the downcomer section. This happens as a result of the presence of a difference between their densities (i.e., gassed and degassed liquids) [5].
This natural liquid circulation, low shear stress environment, high heat and mass transfer rates, and low energy consumption features make the split airlift reactor a preferred option over other reactors in many processes such as fermentation process, microorganisms cell cultures, and wastewater treatment [6,7,8,9,10]. However, the split airlift reactor delivers a reliable use in the many applications such as microalgae culture industry because it offers a better production of biomass for such a system than other reactors such as draft tube airlift and bubble columns [11,12]. This high productivity of biomass is achieved in this reactor because it allows algae cells to be exposed to more light (i.e., which is necessary for photosynthesis of microalgae) by continuously circulating them in the dark and light areas, providing flashing light for microalgae cells to grow [13,14,15].
Consequently, the liquid circulation (i.e., moving cells) governs the biomass productivity and thus the behavior of such kinds of reactors. As is well known, circulation the liquid is governed by the hydrodynamics of the reactor such as gas holdup, liquid velocity, cell’s trajectory, turbulent kinetic energy and Reynold shear stress. Therefore, the performance of the split airlift reactor is significantly influenced by the details of the hydrodynamics parameters. Knowing the detailed hydrodynamic parameters allow operators on this split airlift reactor to optimize their process and consequently lead to enhanced and improved product quality and quantity.
There are considerable literature contributions for studying the hydrodynamics of the airlift reactors that have been reported in recent years [14,16,17,18,19,20,21,22,23,24,25]. These contributions are focused on the draft tube airlift rather than split airlift reactors. Detailed hydrodynamics investigations in split airlift reactors are quite rare in the open literature. Amongst these hydrodynamics investigations in a split-cylinder airlift reactor, the significant hydrodynamic studies were done by intrusive techniques include the work of Molina et al. [26], Moraveji et al. [27], Albdiri et al. [28], Ojha and Al Dahhan [29]. Most of these reported investigations have tended to focus on local gas holdup and bubble properties rather than details hydrodynamics.
In many multiphase systems, the intrusive techniques may not be practical or even possible. For example, these studies were limited to performing localized measurements at specific points along the diameter or height of the column. Additionally, inserting the intrusive techniques such as probes could alter the fluid flow and bubble behavior inside the reactor.
Moreover, depending on these points measurements that were achieved at particular locations, further measurements may be required in order to address the influence of any operating conditions, which may require extensive experimental work and cost. This only can be achieved by using non-intrusive techniques such as gamma-ray techniques. With these techniques, one can non-intrusively provide detailed data of hydrodynamics and allow investigators to understand the fundamental of this reactor better and thereby improve and optimize their process.
The only remarkable experimental work was accomplished by Luo et al. [30]. Their experimental work was focused on studying the feasibility of using a gamma-ray radioactive particle tracking (RPT) facility for measuring cell’s trajectories, liquid velocity, irradiance intensity pattern, and circulation time distribution in a non-intrusively manner. Despite that, the investigation of Luo et al. provides useful and valuable information; however, it was limited to specific conditions such as the measurements were performed under superficial gas velocities of 1 and 5 cm/s) and a fully developed region. Additionally, turbulent kinetic energy and the shear stress were not quantified in their work.
Therefore, this work aims to extend the current knowledge of hydrodynamic in split airlift reactor by visualizing and quantifying the hydrodynamic details such as cross-sectional distribution for turbulent kinetic energy, gas holdup, liquid velocity field, and Reynold shear stress. All these parameters studied along with the height and entire cross-sectional area of split airlift reactor under bubbly flow by applying state-of-the-art gamma-ray facilities such computed tomography (CT) and radioactive particle tracking (RPT) which are work in non-invasive manner.
By using these advanced gamma-ray facilities (i.e., CT and RPT), one can non-intrusively visualize and quantify the detailed hydrodynamic parameters under different operating conditions. This allows investigators to observe and measure the parameters in inaccessible locations inside the reactor, in which these parameters would not be seen or be measured with other intrusive techniques.
Obtaining the detailed hydrodynamics parameters for the split airlift reactors from the current study, along with the previous studies in this field, is essential for the industry development for several reasons. This includes but is not limited to; advancing the knowledge and fundamental understanding of this split airlift reactor, providing benchmark data for assessment and validation of simulation models, facilitating the design and scaleup of this reactor, improved mechanistic modeling development for process optimization and performance prediction.

2. Experimental Work

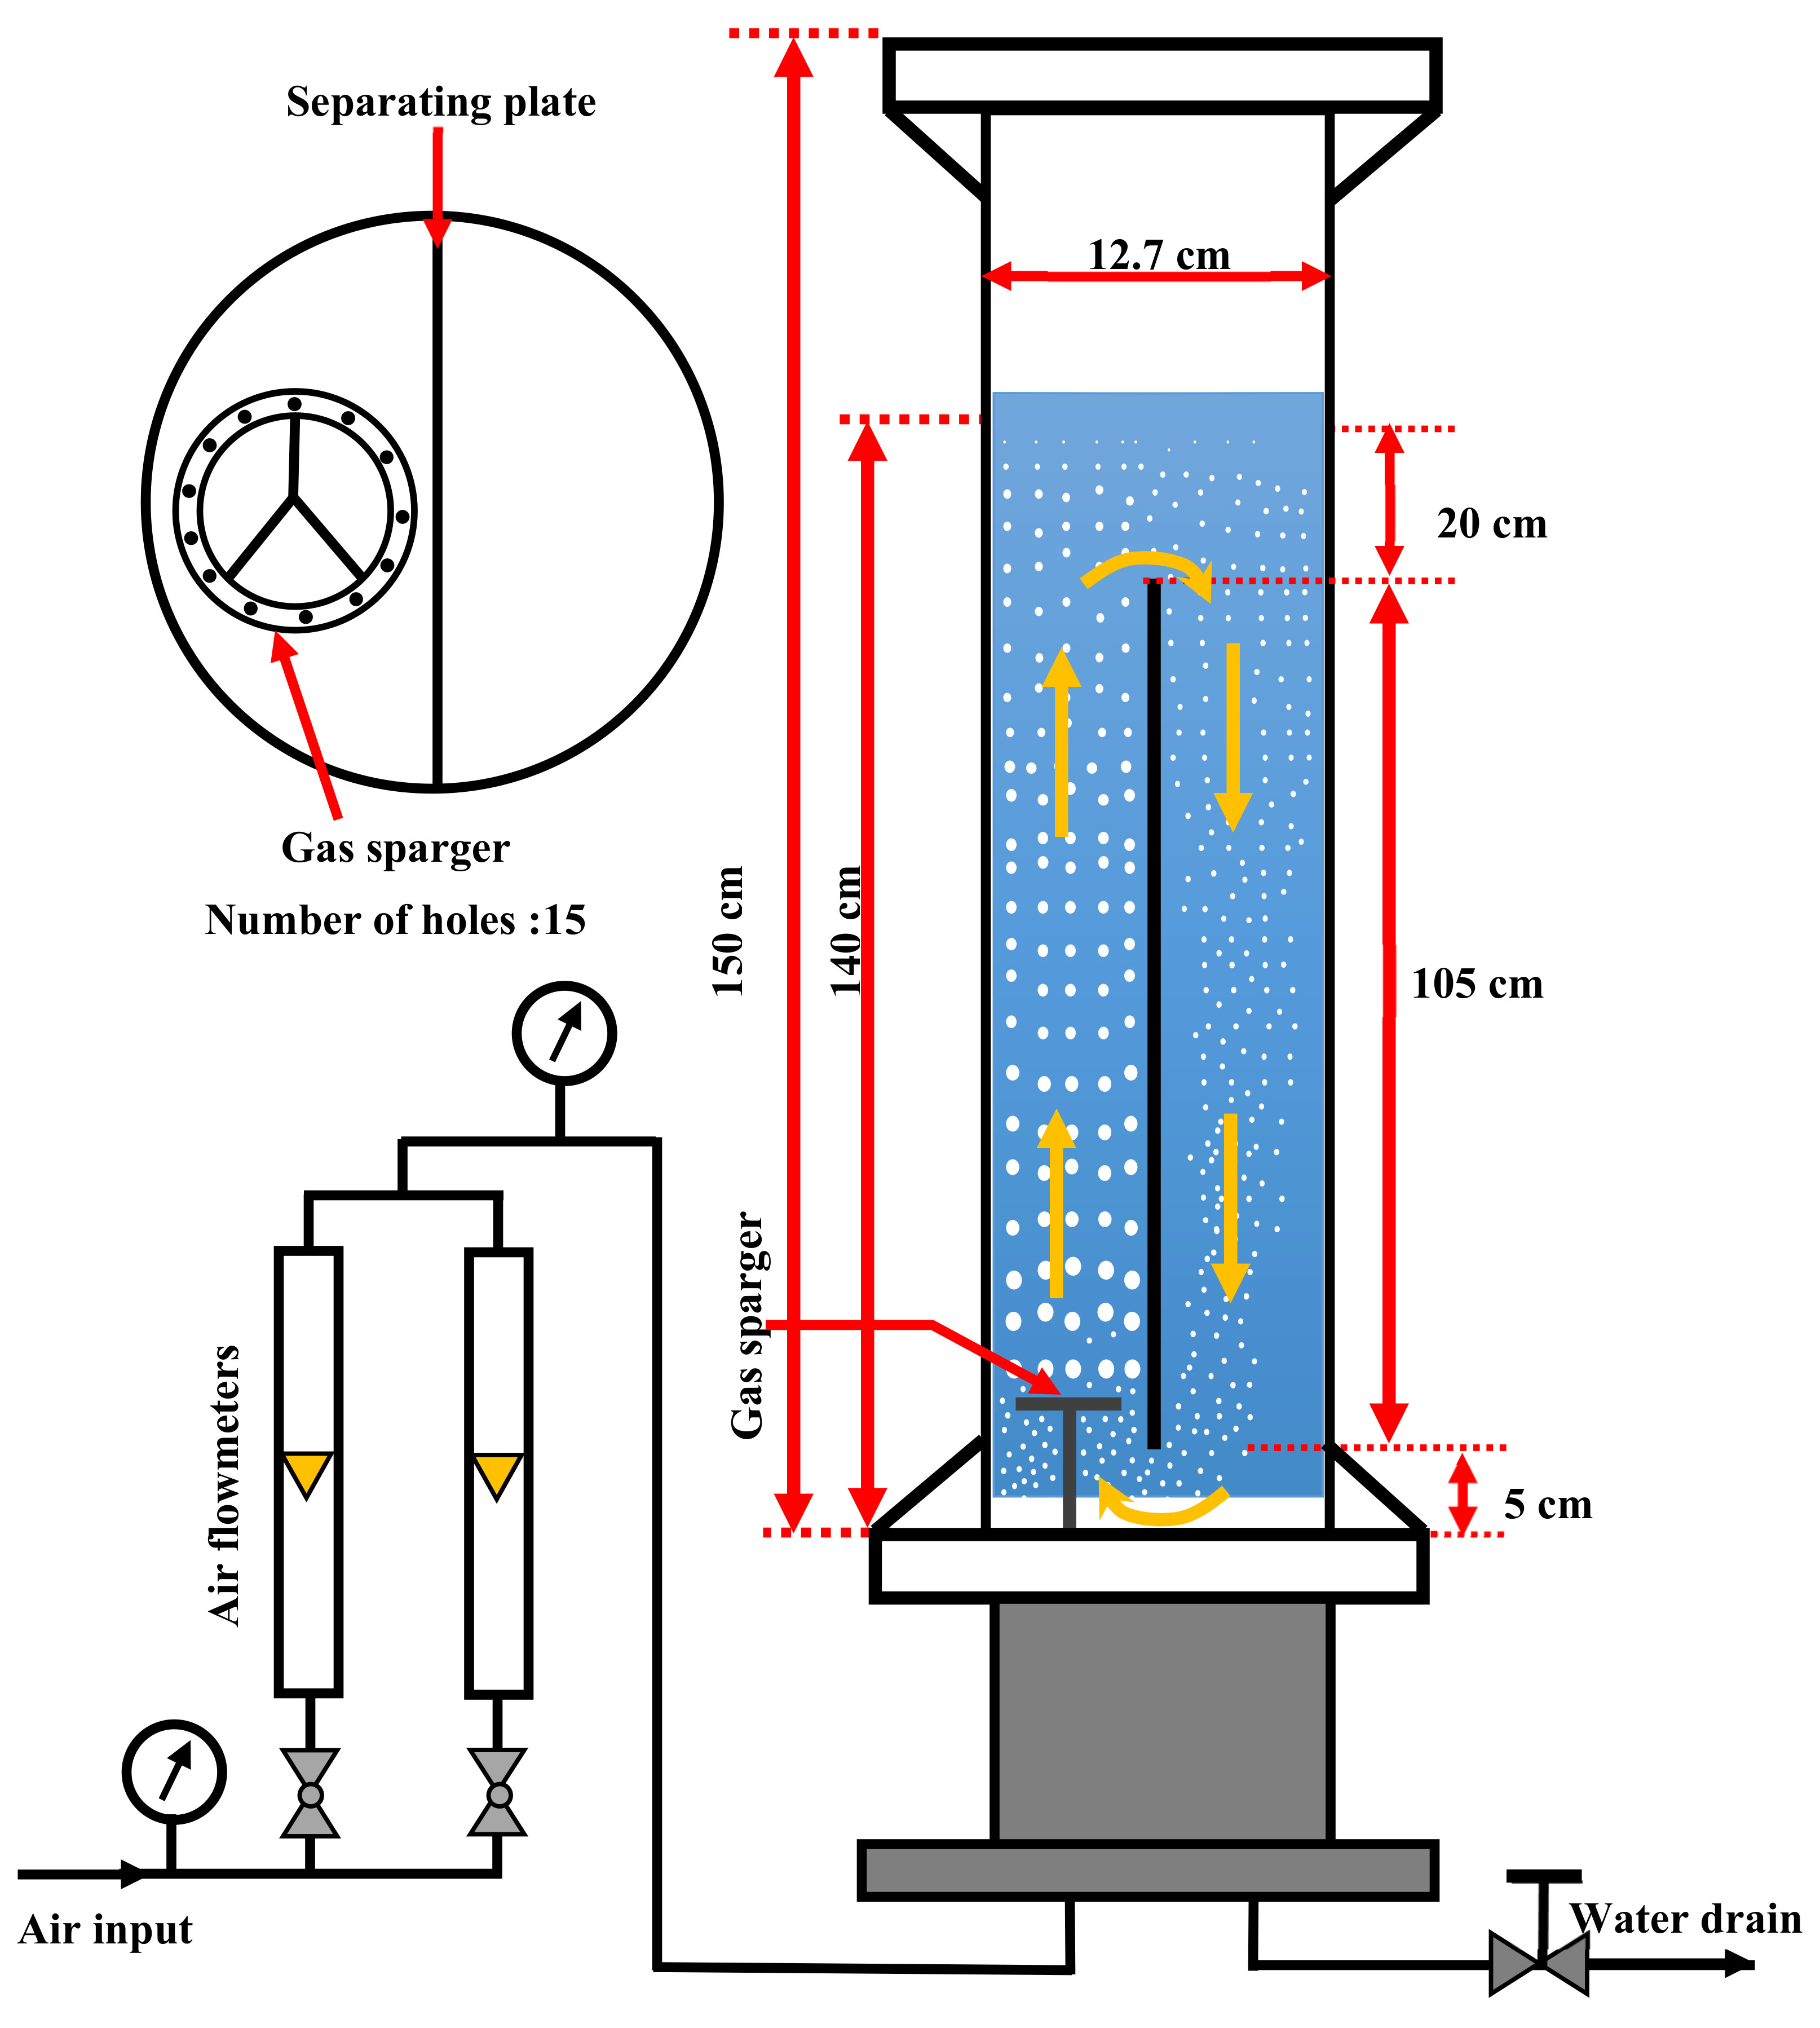
2.1. Split-Plate Airlift Reactor

The used split-plate airlift reactor in this work consisted of the plexiglass cylindrical column with a separating plate located at the center of the column. This separating plate was designed to divide the column two equal cross-sections areas riser and downcomer. The height of this column is 150 cm, with an inside diameter of 12.7 cm. Figure 1 demonstrates a schematic diagram of this split-plate airlift reactor. The air feed to this reactor is introduced using a ring sparger situated at the bottom of the riser section.
The air sparger is made of stainless steel and contains 15 holes of 1 mm size evenly distributed on the top surface of the sparger. The gas used in this study was a compressed air that was supplied continuously from an industrial compressor with capacity up to 1250 m3/hr and 200 Psig. The provided air was dried and regulated by utilizing an air dryer and a pressure regulator before entering the airflow control system. The airflow control system has consisted of two calibrated air flowmeters, two pressure gauges, and two valves.
The air feed to the split airlift reactor was measured and controlled using the airflow control system. All experiments for measuring hydrodynamic parameters were performed under ambient temperature and pressure in a semi-batch mode where the column was fed continuously with the gas phase (i.e., air) while the liquid phase (i.e., water) was used as a batch.
The hydrodynamic parameters were measured under three different gas velocities of 1, 2, and 3 cm/s that covering the bubbly flow regime. These superficial gas velocities were chosen in this study to mimic operating conditions that used in the industrial process (algae culturing). During all experiments of this study, the dynamic (expanded) level for gas–liquid system was kept consistent at 140 cm (with Hight/Diameter = 10) away from the bottom of the column, that was observed utilized a measuring tape attached to the outside wall surface of the plexiglass column.
Maintaining the dynamic level of the gas–liquid system was achieved by varying the initial static level of liquid according to the studied superficial gas velocity to make sure that the measured hydrodynamic parameters are not influenced by the dynamic height of the gas–liquid system. The measurements of hydrodynamic parameters were conducted at six different levels along with the height of the column at 3, 12, 40, 60, 90, and 112 cm from the bottom of the split airlift reactor. These heights for measurement were selected to capture the hydrodynamic behavior of a split-plate airlift reactor under different regions (riser, top, downcomer, and bottom). Measuring the hydrodynamic parameters in these five levels will provide a lot of valuable data that will fill the researchers’ need for model validations.

2.2. Measurement Techniques

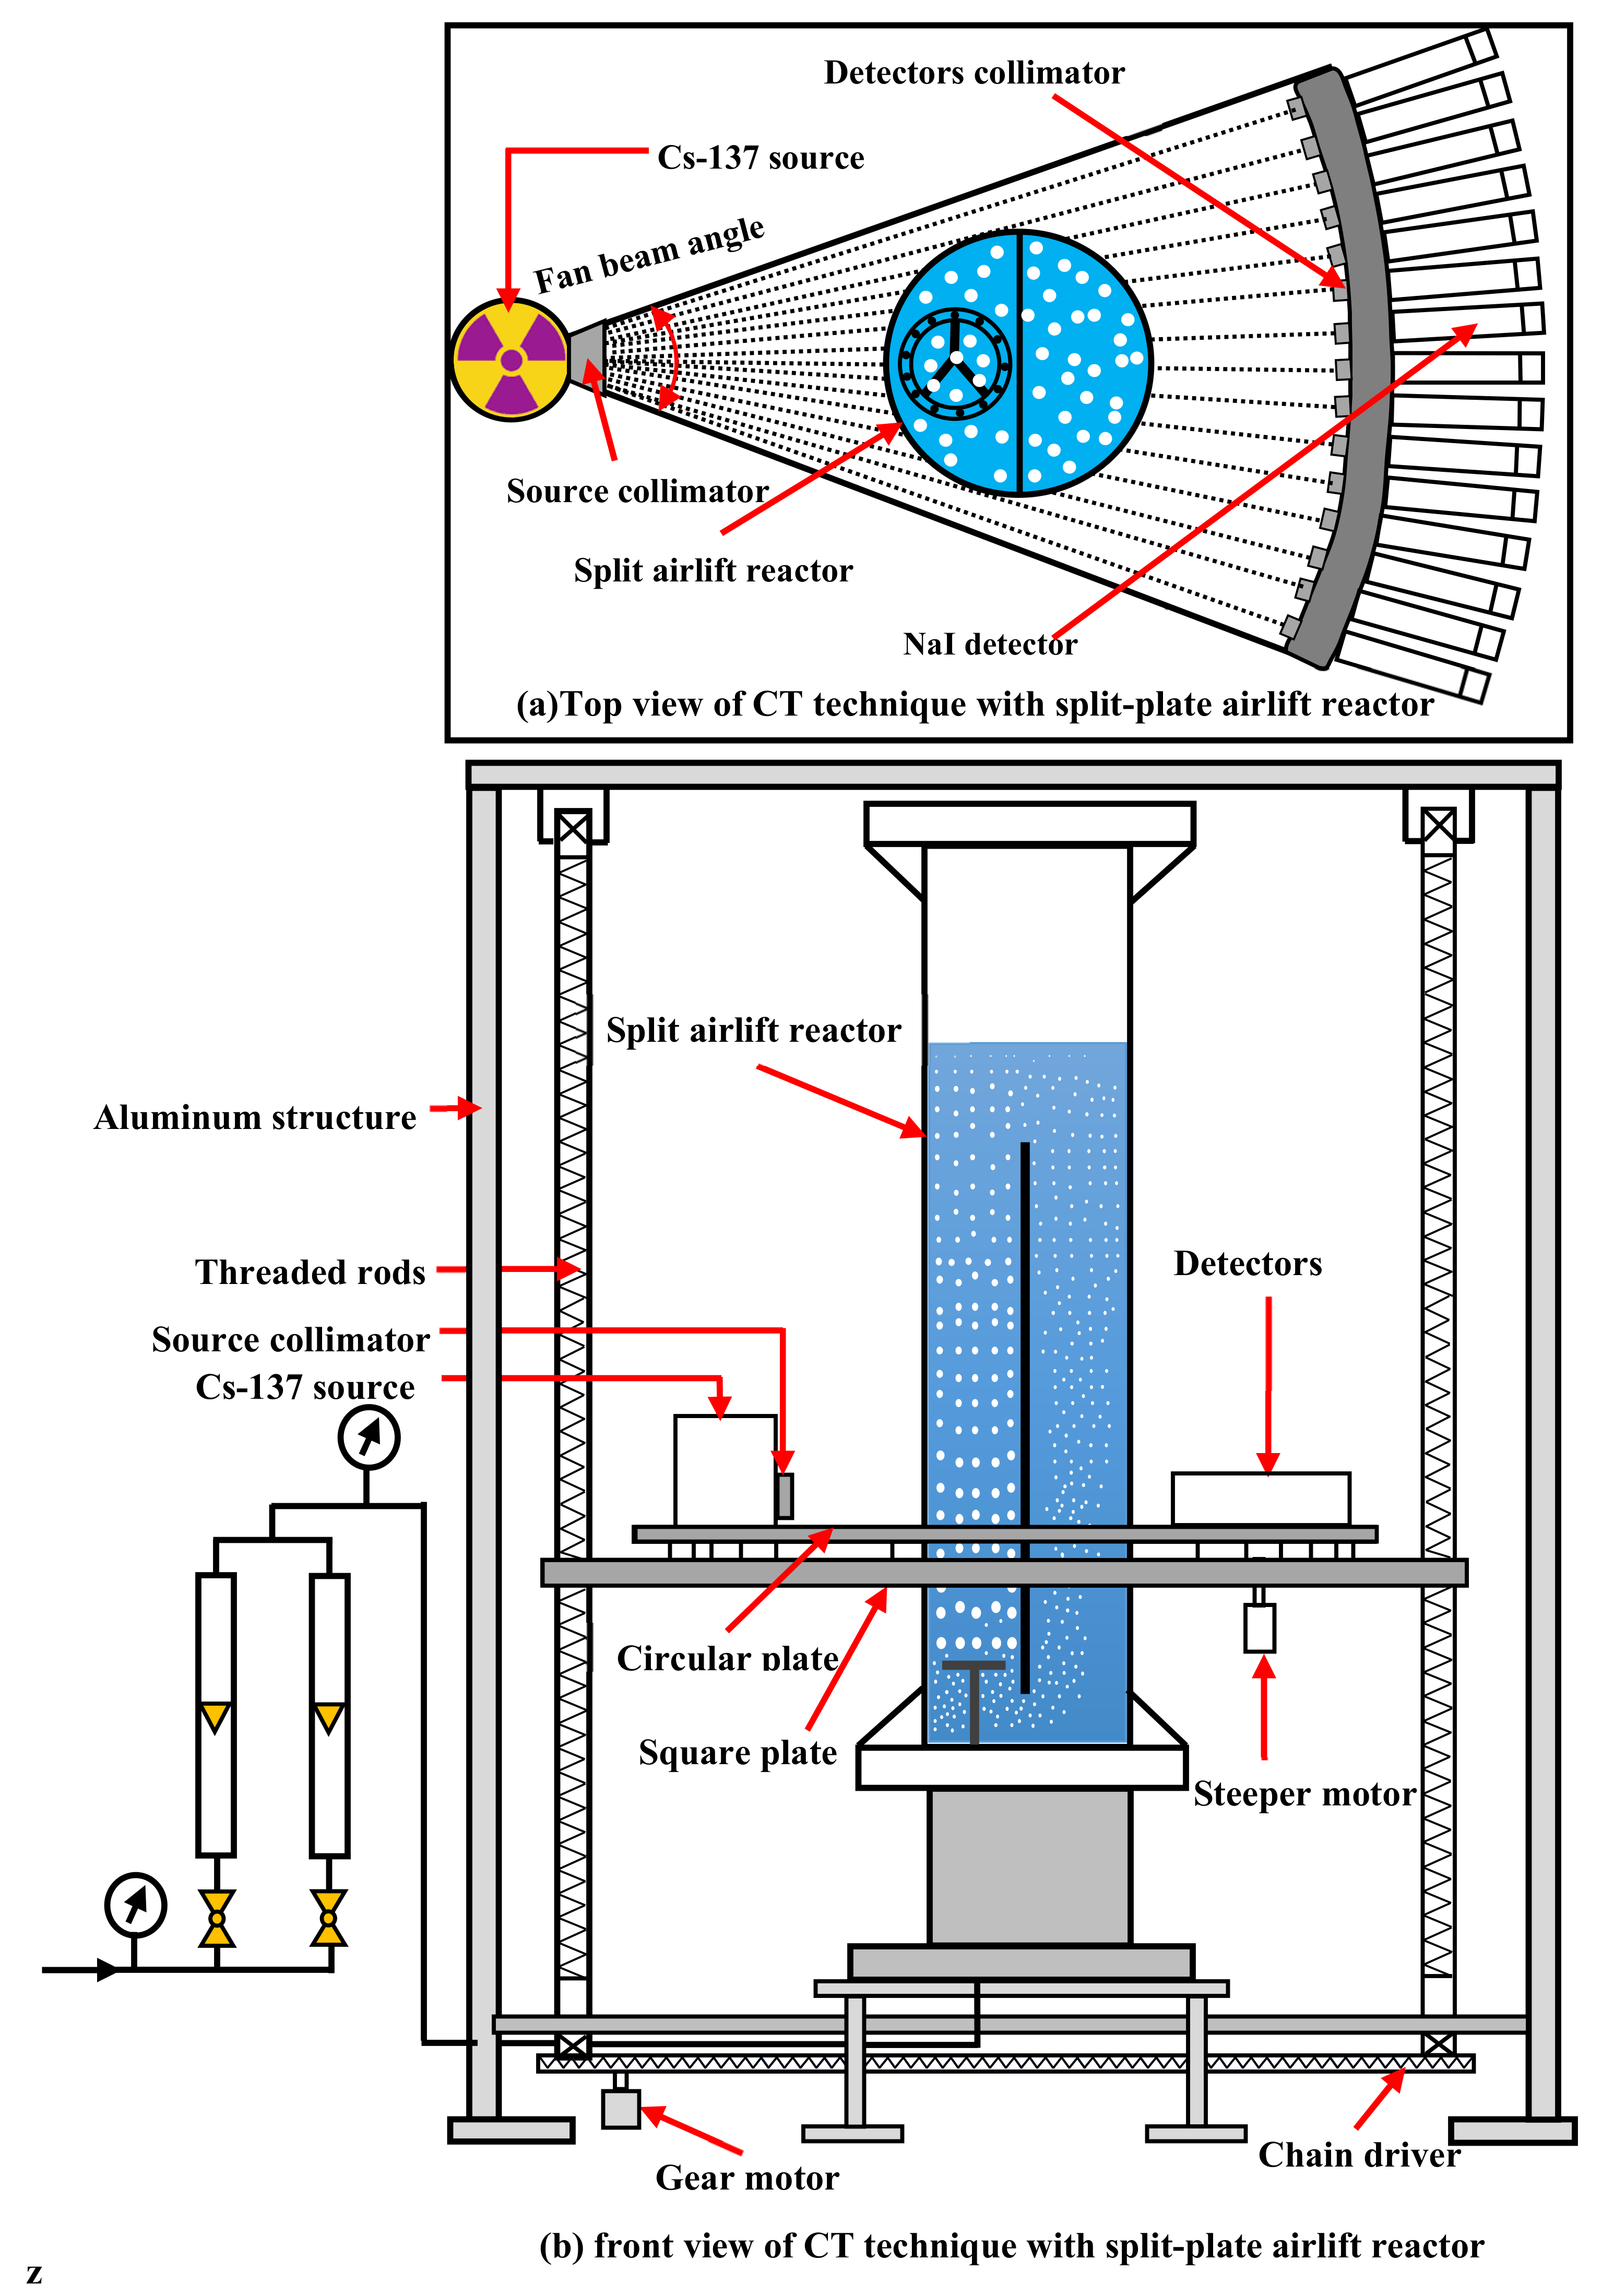
2.2.1. Computed Tomography (CT) Technique

CT technique is a non-intrusive device that enables the investigators to visualize and quantify the phase distribution accurately inside various kinds of multiphase flow systems or reactors under different running status. The CT technique that used in this study has already been employed successfully to measure the gas phase distribution in bubble column reactors [31,32], liquid phase distributions in a packed bed [33,34], and solid-phase distribution in fluidized, spouted, and pebble bed reactors [35,36,37,38]. Figure 2 shows a picture of the CT technique with the split-plate airlift reactor.
The current CT technique, located in the Multiphase Reactors Engineering and Applications Laboratory (mReal) in the Department of Chemical and Biochemical Engineering at the Missouri University of Science and Technology, consists of two gamma-ray sources: Caesium-137 (CS-137) and Cobalt-60 (CO-60). This CT with two sources was designed to image and measure the phase distribution when three-phases are moving dynamically inside the multiphase reactors. However, in this study, the CS-137 source was enough to measure the gas holdup in the split-plate airlift reactor because only two phases are involved in this reactor. This CS-137 source, with an initial activity of ~300 mCi, was housed and sealed inside a lead shielded container.
This lead shield has an opening for gamma-ray to come out when it is needed in the CT scanning. The opening of the shield was collimated by lead collimator to provide a fan shape of gamma-ray, as shown schematically in Figure 3. For each gamma-ray source (i.e., CS-137 and CO-60), there is an array of 15 sodium iodide scintillation detectors directed towards the center of the opening of the source. Fifteen lead collimators have an aperture of dimensions of 2 × 5 mm were placed in front of each detector to guarantee only lines of gamma rays received by detectors (i.e., reducing the scattering of gamma-ray).
The gamma-ray sources and their detectors are placed on a motorized circular stainless-steel plate that attached to a fixed square stainless-steel plate (i.e., base plate) through circular rack and pinion. The circular and square plates have a circular opening with a diameter of 76 cm, which was dedicated to the objects to be scanned. The square plate is connected to four vertical ball screws, and these ball screws are linked to the aluminum frame from the top and the bottom. At the base of each ball screw, there is a pinion, and these four pinions are connected by a chain, which in turn is connected to the gear motor.
These arrangements of ball screws, pinions, chain, and gear motor enable the square plate to move up or down to scan the studied objects at different axial heights. It is worth noting here that the current CT can scan columns up to a height of 2.75 m. Before the split airlift reactor is scanned, it was centered and aligned well in the middle of the opening of the circular and square plates. After the reactor has reached a steady-state of the studied conditions, the collimator of CS-137 source was opened to allow gamma radiation to be emitted from this source with a fan-beams of 42 degrees toward the airlift reactor, as depicted in the top view of the schematic diagram of the CT technique. For a complete CT scan, the circular plate moves 197 times by using a programmable stepping motor, thereby generating 197 views of the CS-137 source. For each view (position) of the CS-137 source, the array of detectors moves 21 steps by using another programmer stepping motor. With each step of this array, the detectors receive 15 gamma-ray projections and hence 315 projections of gamma-ray for 21 steps.
As a result, 62,055 (315 projections times 197 views) of gamma-ray projections are received by detectors and transferred to the computer in the form of counts. Obtaining a two-dimensional image of the gas holdup distribution for this reactor at a specific condition requires several scanning, such as scanning the empty reactor, scanning the filled reactor with water only, and scanning the reactor with the air-water system (i.e., operating under the studied condition). The received counts of different cases of scans (empty reactor, reactor filled with water only, the reactor contains air-water system) will then be processed by using alternating minimization algorithm for image reconstruction [39,40]. The CT scan takes approximately 8.30 h for each scan. It is worth noting here that the current CT technique was newly validated in our laboratory by scanning the phantom for different cases. The validation results confirmed the reliability of the CT technique to image and measure the phase distributions in any multiphase reactors with high accuracy. More details about this validation can be found in our previous paper [41]. Further details of the CT technique, experimental procedure for scanning, and calculation of gas holdup distribution are available in our earlier publications [42,43,44].

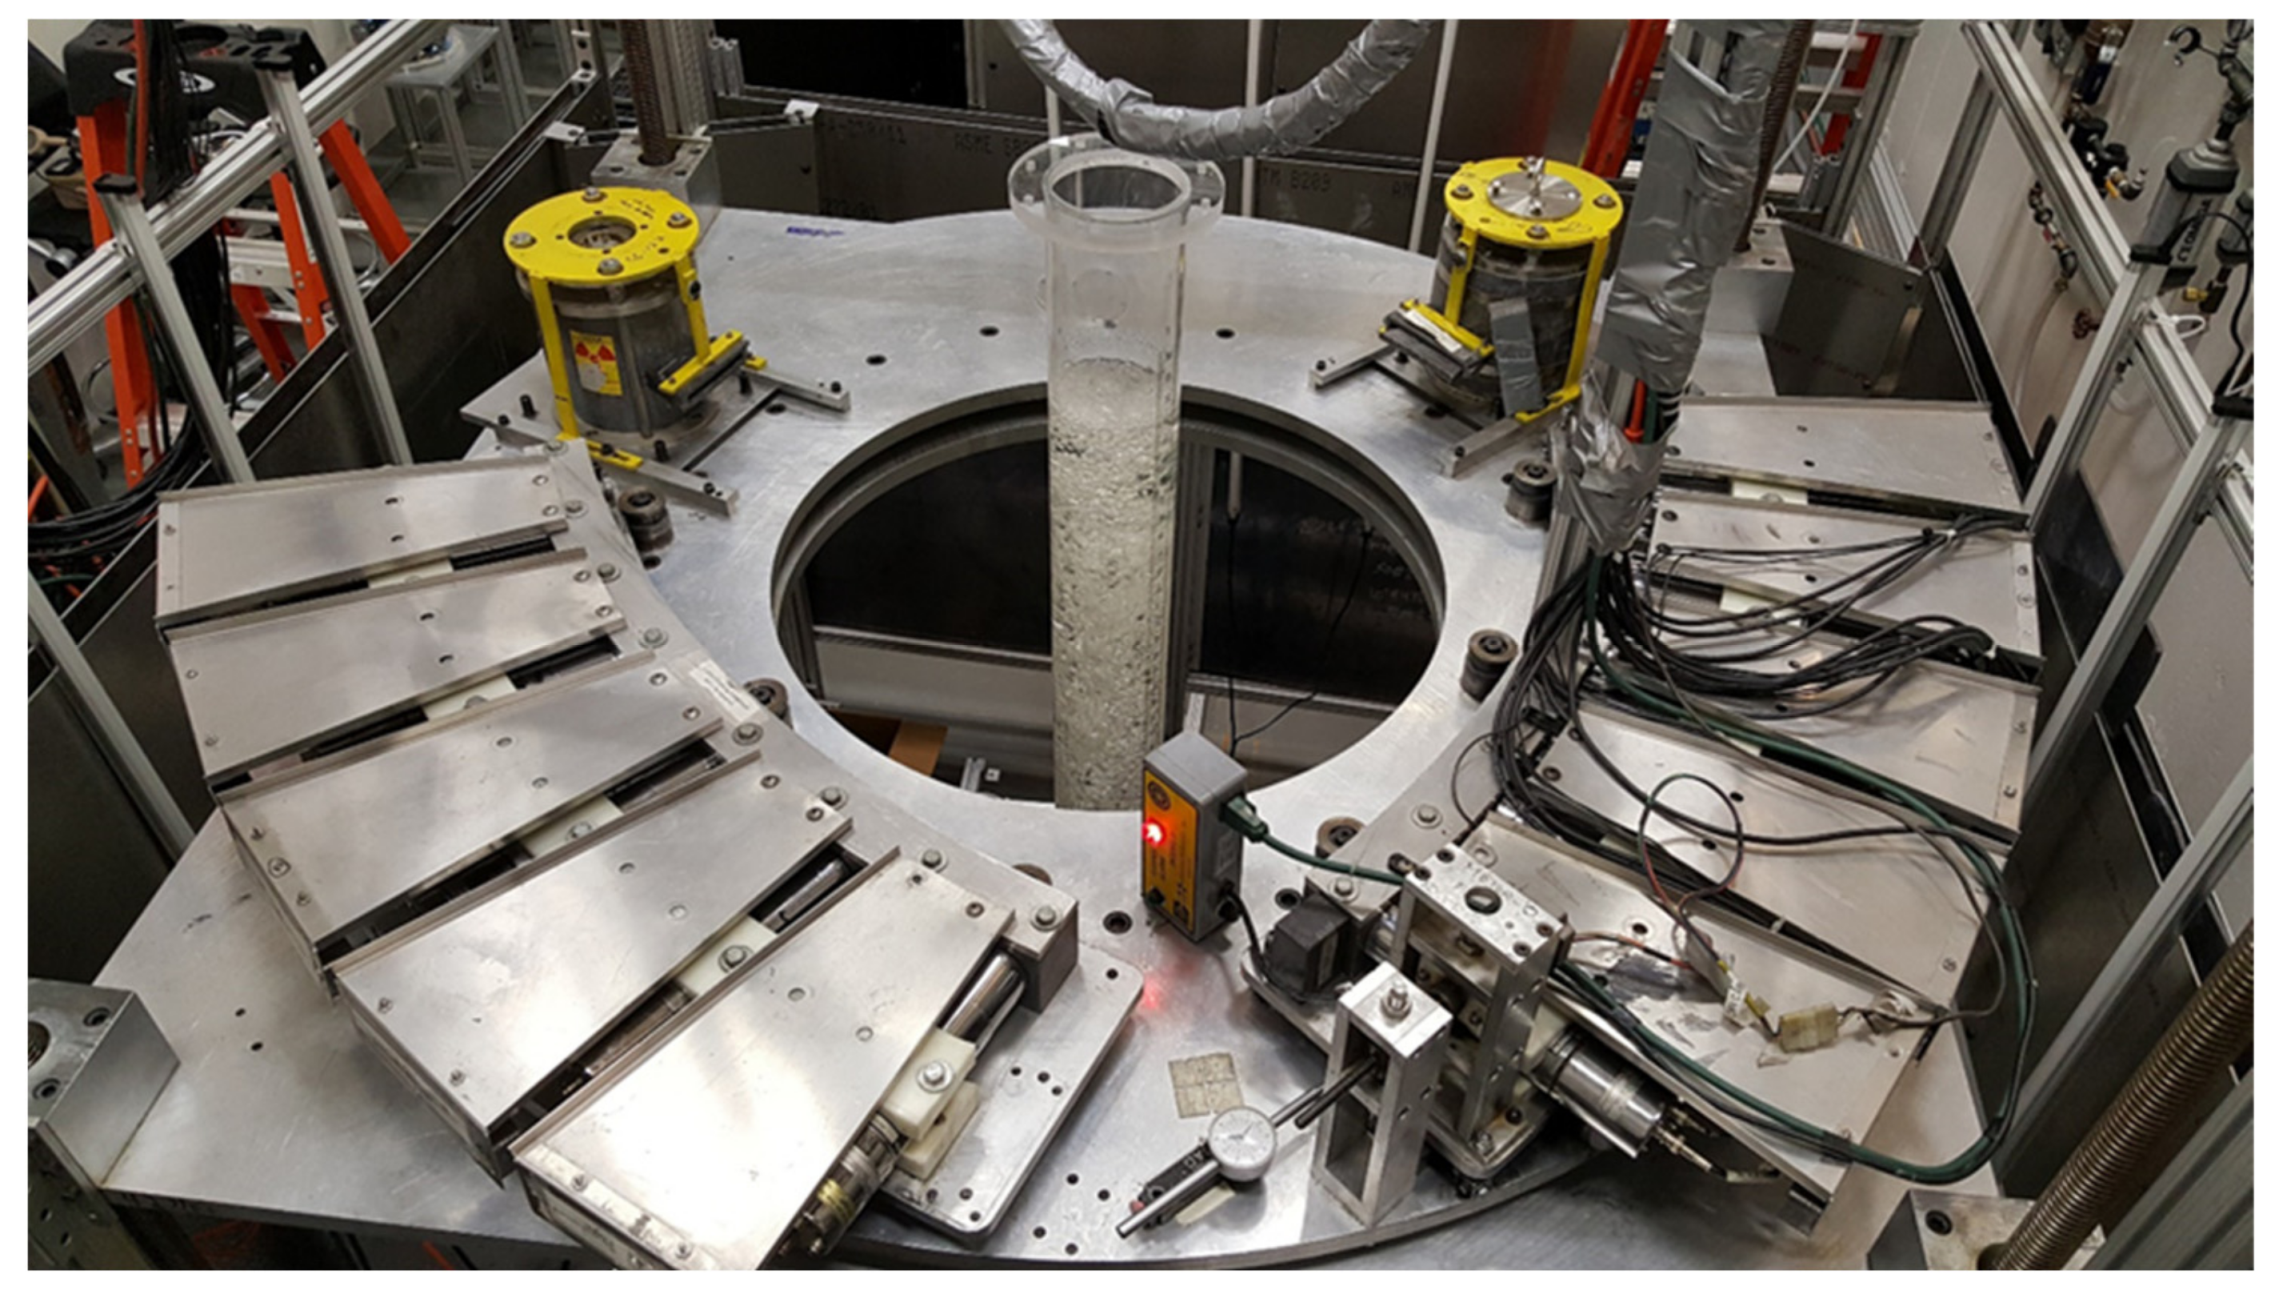
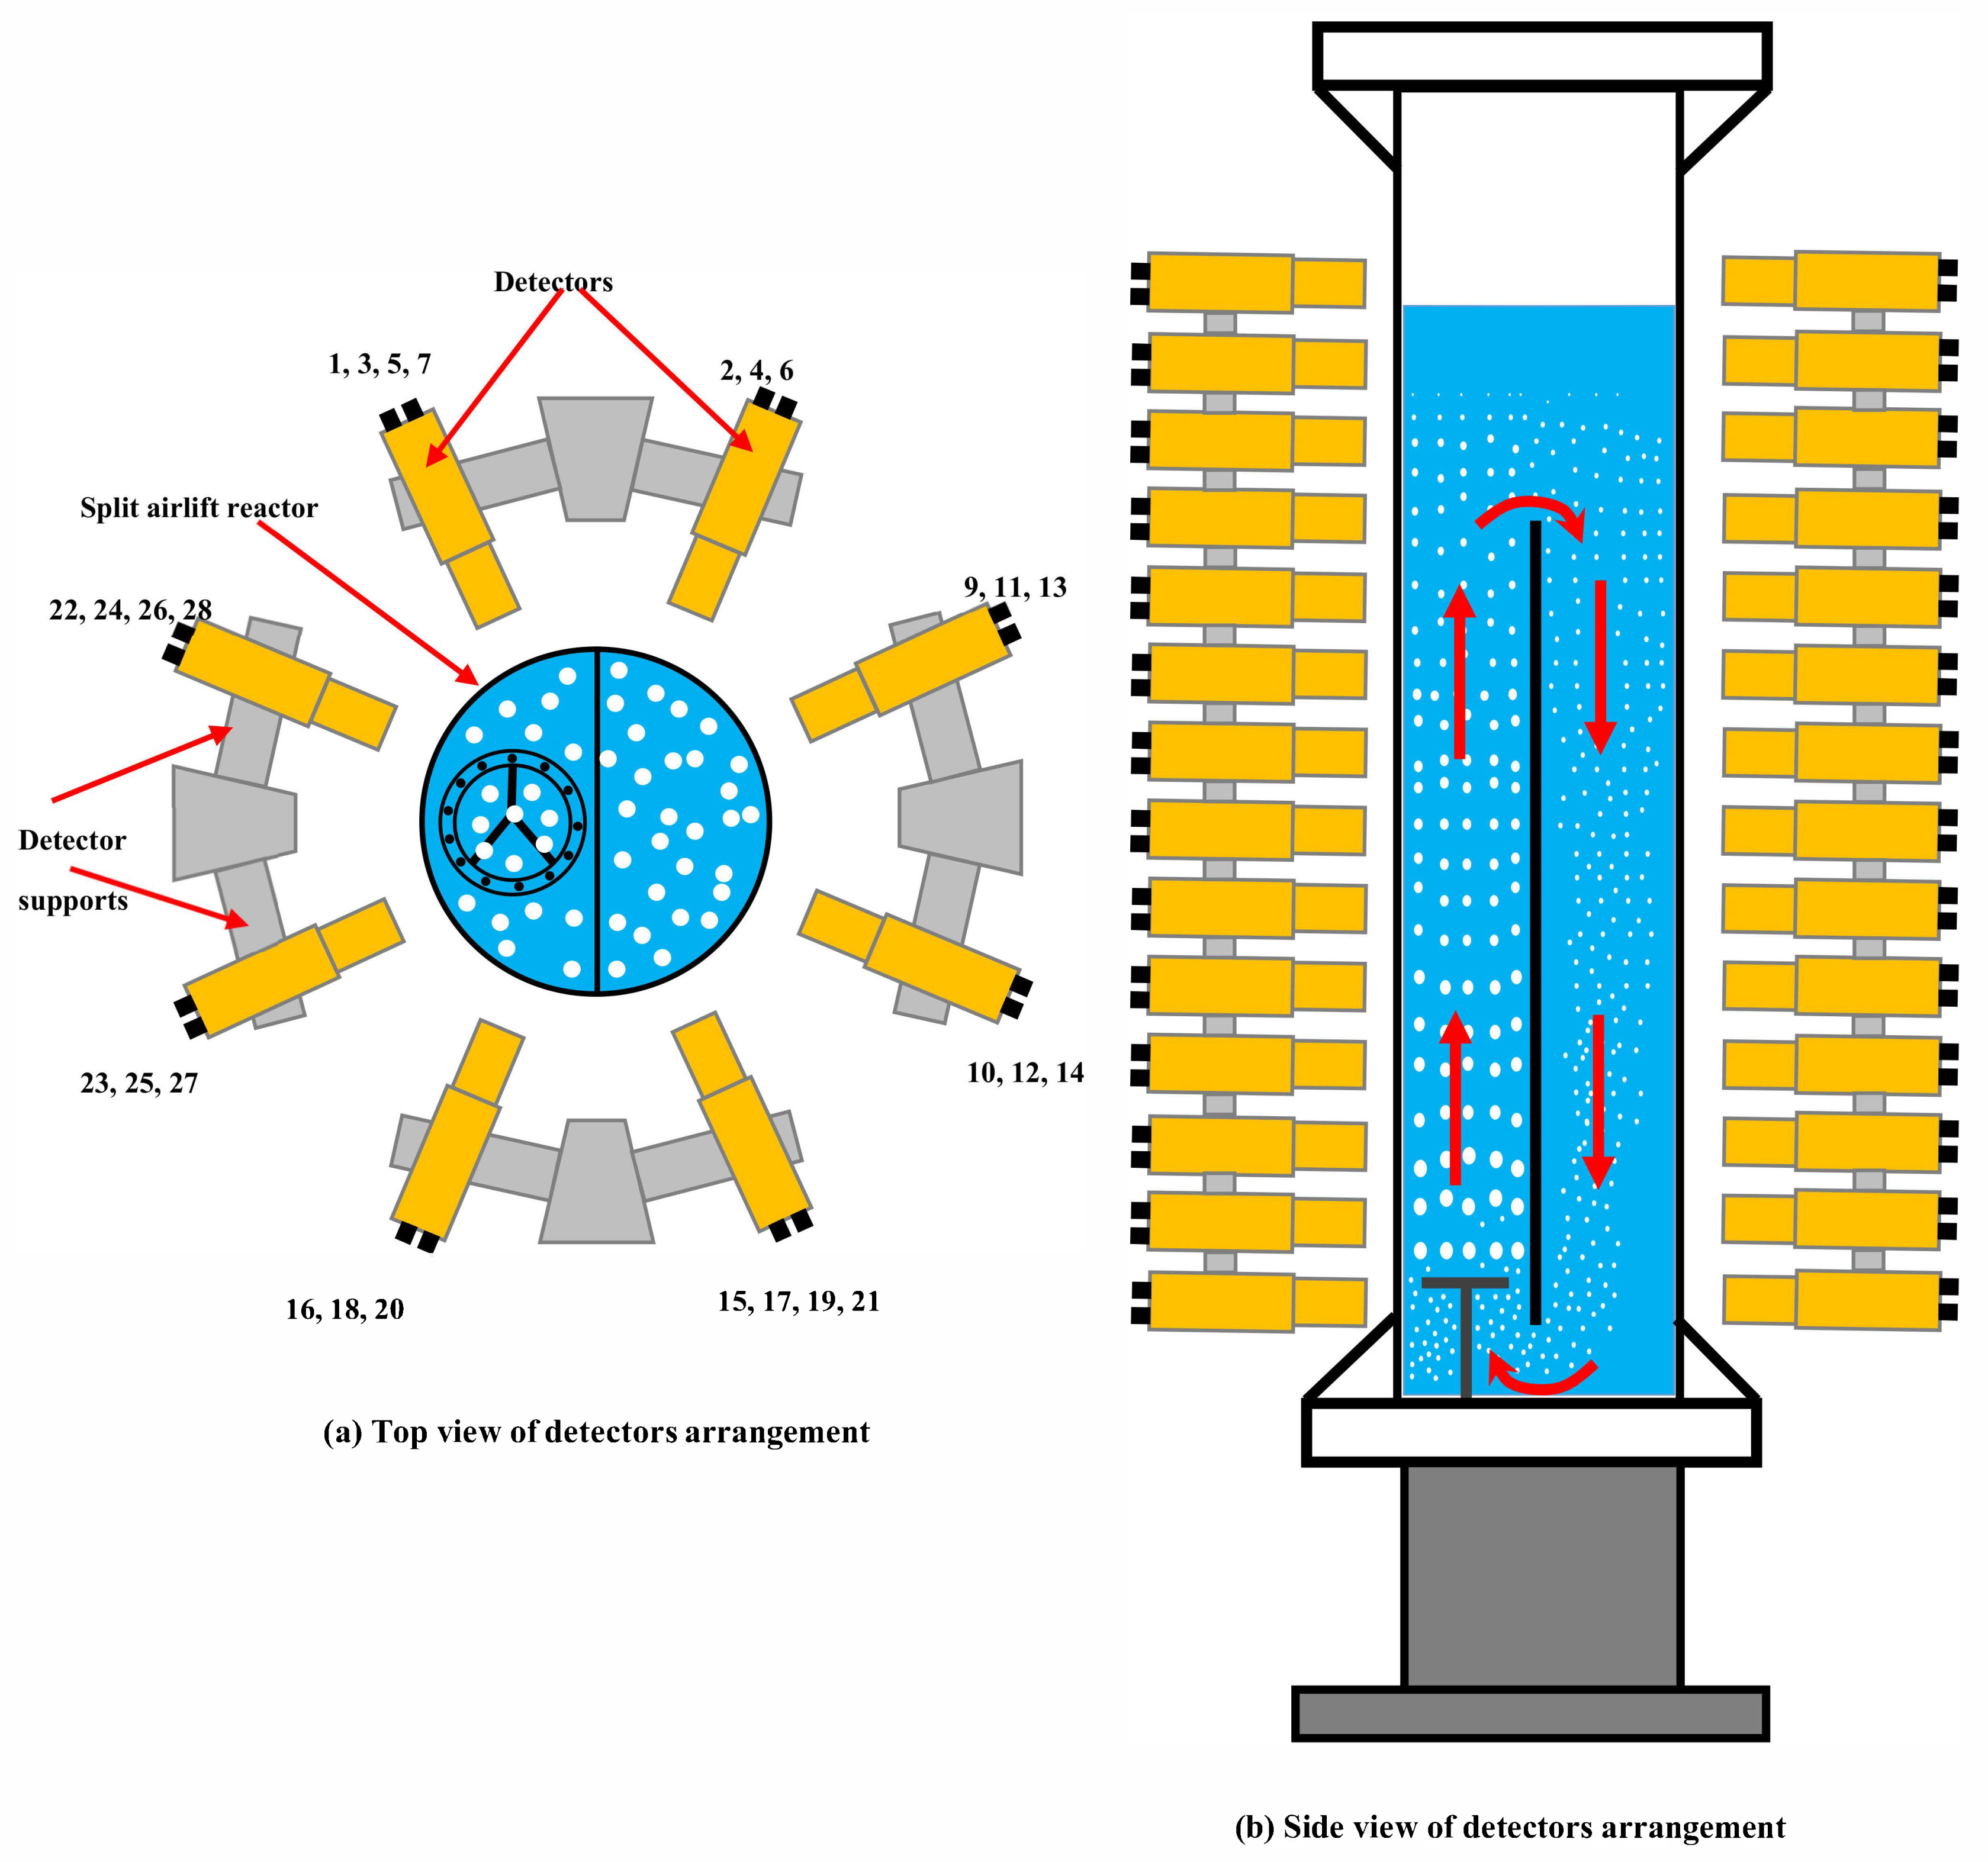
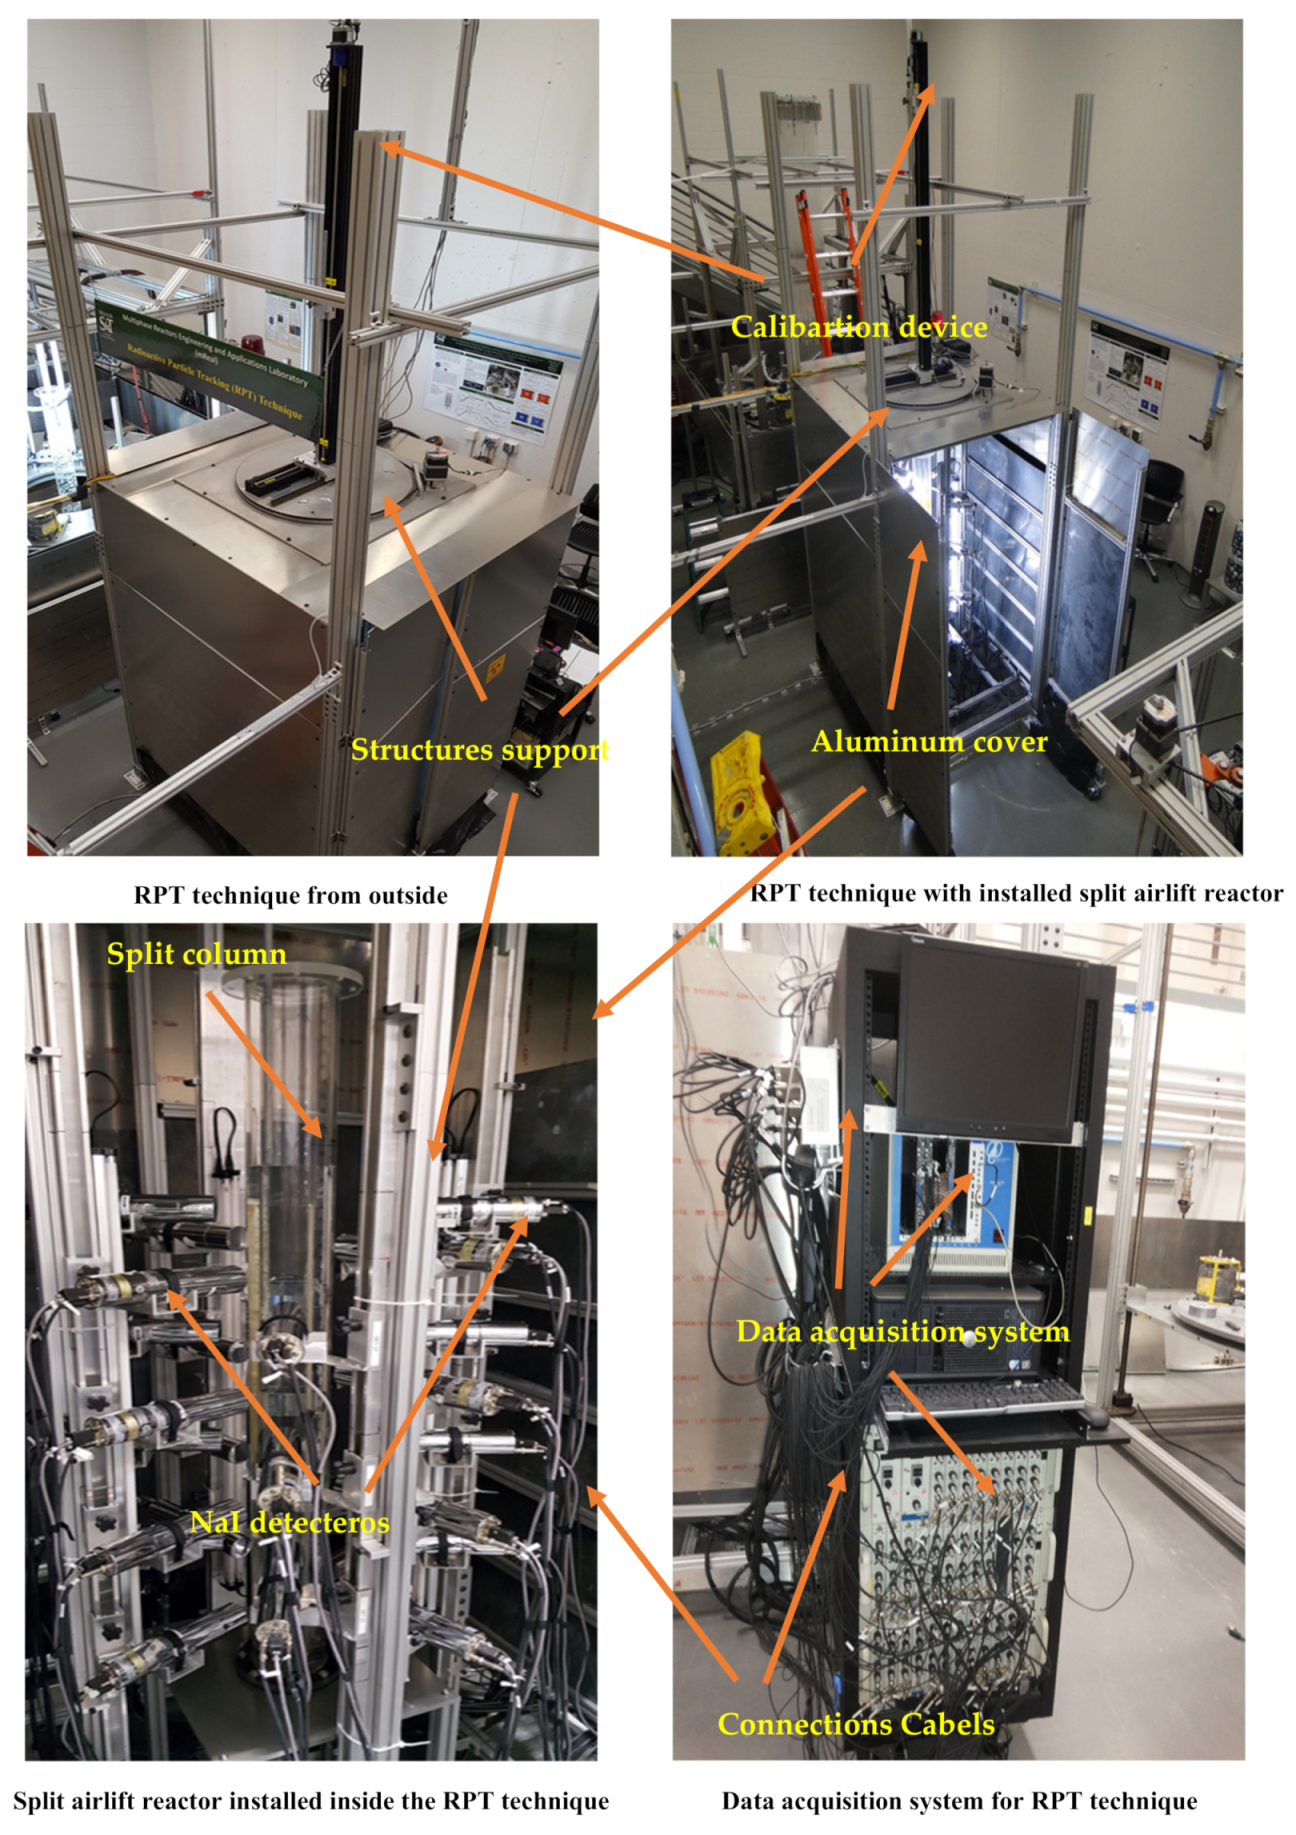
2.2.2. Radioactive Particle Tracking (RPT) Technique

The radioactive particle tracking (RPT) technique is a state-of-the-art non-intrusive facility designed to provide detailed information about fluid dynamics such as trajectories, velocity filed, turbulent kinetic energy, Reynold shear stress and many others. This RPT technique offers a window into the opaque multiphase reactors by enabling investigators to accurately visualize and quantify the details of hydrodynamic parameters inside any multiphase reactors. This detailed hydrodynamic information can be achieved with this RPT technique by monitoring a single radioactive particle (i.e., its density is similar to the density of the phase to be measured) movement inside the reactor by a detection system. Figure 4 displays a photos RPT technique with the split-plate airlift reactor.
The detection system of the current RPT technique consists of 28 Sodium Iodide scintillation detectors, which were arranged strategically around the split plate airlift reactor. These 28 detectors were distributed around the split plate airlift reactor in 14 levels starting from the lower level to the height of 120 cm of the reactor column with 7 cm clearance between two levels. This arrangement of these doctors was chosen to cover all the domains of liquid flow inside the split plate airlift reactor. Figure 5 presents the schematic illustration for the configuration of the detectors around the reactor.
The radioactive particle used in the RPT experiments of this work was a 600 μm in diameter irradiated Cobalt-60 (Co-60) with an activity of 200 μCi. This Co-60 radioactive particle was encapsulated inside a 2 mm diameter of polypropylene ball to produce a radioactive tracer particle, which should have a density similar to the density of the water. The process of making a tracer particle with a density similar to the density of water is the key to conducting RPT experiments correctly. Therefore, considerable attention and efforts were paid to manufacture a neutrally buoyant tracer particle to the liquid phase. The manufacturing process of the tracer particle was involved in drilling a hole in a polypropylene ball with 1 mm in diameter and 1 mm in depth. After that, the radioactive material (i.e., Co-60) was inserted into the designated hole very carefully, with the help of tweezers and a microscope, which was connected to the LCD screen. Finally, the hole was sealed with epoxy, and excess of this epoxy was removed to maintain the uniform appearance of the tracer particle.
The manufactured tracer particle was then painted with red paint to make it wettable and to ensure that bubbles do not stick to the tracer particle, especially when the split plate airlift reactor operating in the bubbly flow regime. Additionally, it was pained to make it distinct when it was circulating inside the split plate airlift reactor. Before conducting the RPT experiments, the density of the manufactured tracer particle was checked to ensure that its density was equal to the density of the water to be tracked. This was done by falling the manufactured tracer particle in a graduated cylinder filled with water and calculating the terminal velocity for the particle. Then Stoke’s law was applied to calculate precisely density of the manufactured tracer particle, and it was found that its density is very close to the density of water (0.999 g/cm3). After succeeding in making the tracer e particle has a neutral buoyancy through the liquid phase and aligned all detectors well around the split plate airlift reactor, the RPT experiments were initiated.
The RPT experiments were included two main steps. The first step is called the calibration step wherein this step the tracer particle was housed inside the tapered end of cylinder Teflon piece with 0.5 cm diameter and 3 cm length. This Teflon cylindrical piece was connected to a stainless-steel rod, which in turn was attached to a fully automated calibration device. During the calibration step, the tracer particle was moved by the automated calibration device in known locations inside the split plate airlift reactor, which was operating under the studied condition. At each know location, all the detectors measure the intensity counts, which was emitted by the tracer particle. In this study, photon counts were recorded for more than 1000 know locations inside the split airlift reactor to cover all the domain of liquid flow inside this reactor. At the end of the calibration step, huge data was collected for all these detectors. From this data, a calibration curve was obtained, which represents the relation between the intensity counts measured by the detector and the distance of particle tracer from this detector.
The second step of these experiments was involved allowing the radioactive particle to move inside the split airlift reactor freely for 24 h for each experiment. During this free movement of the radioactive particle inside the reactor, the detectors record the photon counts emitted from this tracer particle under a frequency of 50 Hz. Using the obtained information from the calibration step (i.e., calibration curves of all detectors) and received photon counts during the real experiments (i.e., second step), instantaneous particle positions were generated by using an in-house developed reconstruction algorithm.
Once the instantaneous positions were reconstructed, the liquid velocity, Reynold shear stress, and turbulent kinetic energy were obtained from applying the method that explained in our previous works. Figure 5 shows the illustration of data acquiring and processing this data. All these parametrs have been estimated by using the equations which discussed in Supplementary Materials attached.

2.3. Reproducibility of Measurement Techniques

To examine the reproducibility of the RPT and CT techniques, the distribution of the liquid velocity and gas holdup in cross-sectional manner with their radial profile in split airlift reactor column were replicated. These replications were conducted with 3 cm/s of gas velocity and three different axial levels, middle section (z = 40 cm), bottom section (z = 3 cm), and top section (z = 112 cm). The cross-sectional distributions of gas holdup and liquid velocity shows that the results (tests 1 and 2) had comparable consequences. The reproducibility of the CT scan (2D images and redial profiles) and more information about it were represented in Sabri et al. (2018).
Furthermore, the reproducibility of the cross-sectional local liquid velocity distribution was conducted under 3 cm/s of gas velocity at three different axial levels, middle section (z = 40 cm), bottom section (z = 3 cm), and top section (z = 112 cm). The 2D visual results of liquid velocity distribution as shown in Figure 6 in tests 1 and 2 have similar behavior. Additionally, the radial profiles of the liquid velocity field which taken by having the semi-azimuthal averages were estimated by averaging the half-circumference of the pixels of cross-sectional results (images results) to compute the difference between the profiles of the liquid velocity.
Moreover, Figure 7 explain the liquid velocity profiles in three different levels for test 1 and test 2 under the same operating conditions are very much alike in magnitude for most column diameter locations in the split reactor column. Along the riser and downcomer lengths, the tests 1 and 2 created a comparable results, which signifying the dependability and high accuracy of these measurments techniques outcomes. By using the equation bellow, we compute the average absolute relative difference (AARD):
A A R D = 1 N i = 1 N ( x 1 r x 2 r ) / x 1 r
The x 1 r is the experiment of test 1 and x 2 r is the experiment of test 2, both are demonstrated the liquid velocity values. N is the number of data points which shows over the cross-sectional distribution (column diameter).
The values of AARD which determined in two profiles at 3 cm/s (gas velocity) was found to be 5.35% at the top position, 2.53% at the bottom position, 2.93% at the middle position.
To demonstrate the substantial impacts of the replication test (experimental tests 1 and test 2) on the accuracy of the RPT, One-way analysis of variance (ANOVA), in level of significance: p < 0.05 was used as statistical analyze by using Origin Lab 2017. The results shows that there is no considerable variations between the replicated outcomes in all levels, at the top p = 0.86, middle p = 0.78, and bottom p = 0.62. Furthermore, the AARD and ANOVA values for the liquid velocity flow fields displayed the RPT techniques that are highly reproducible and highly precise.

3. Results and Discussion

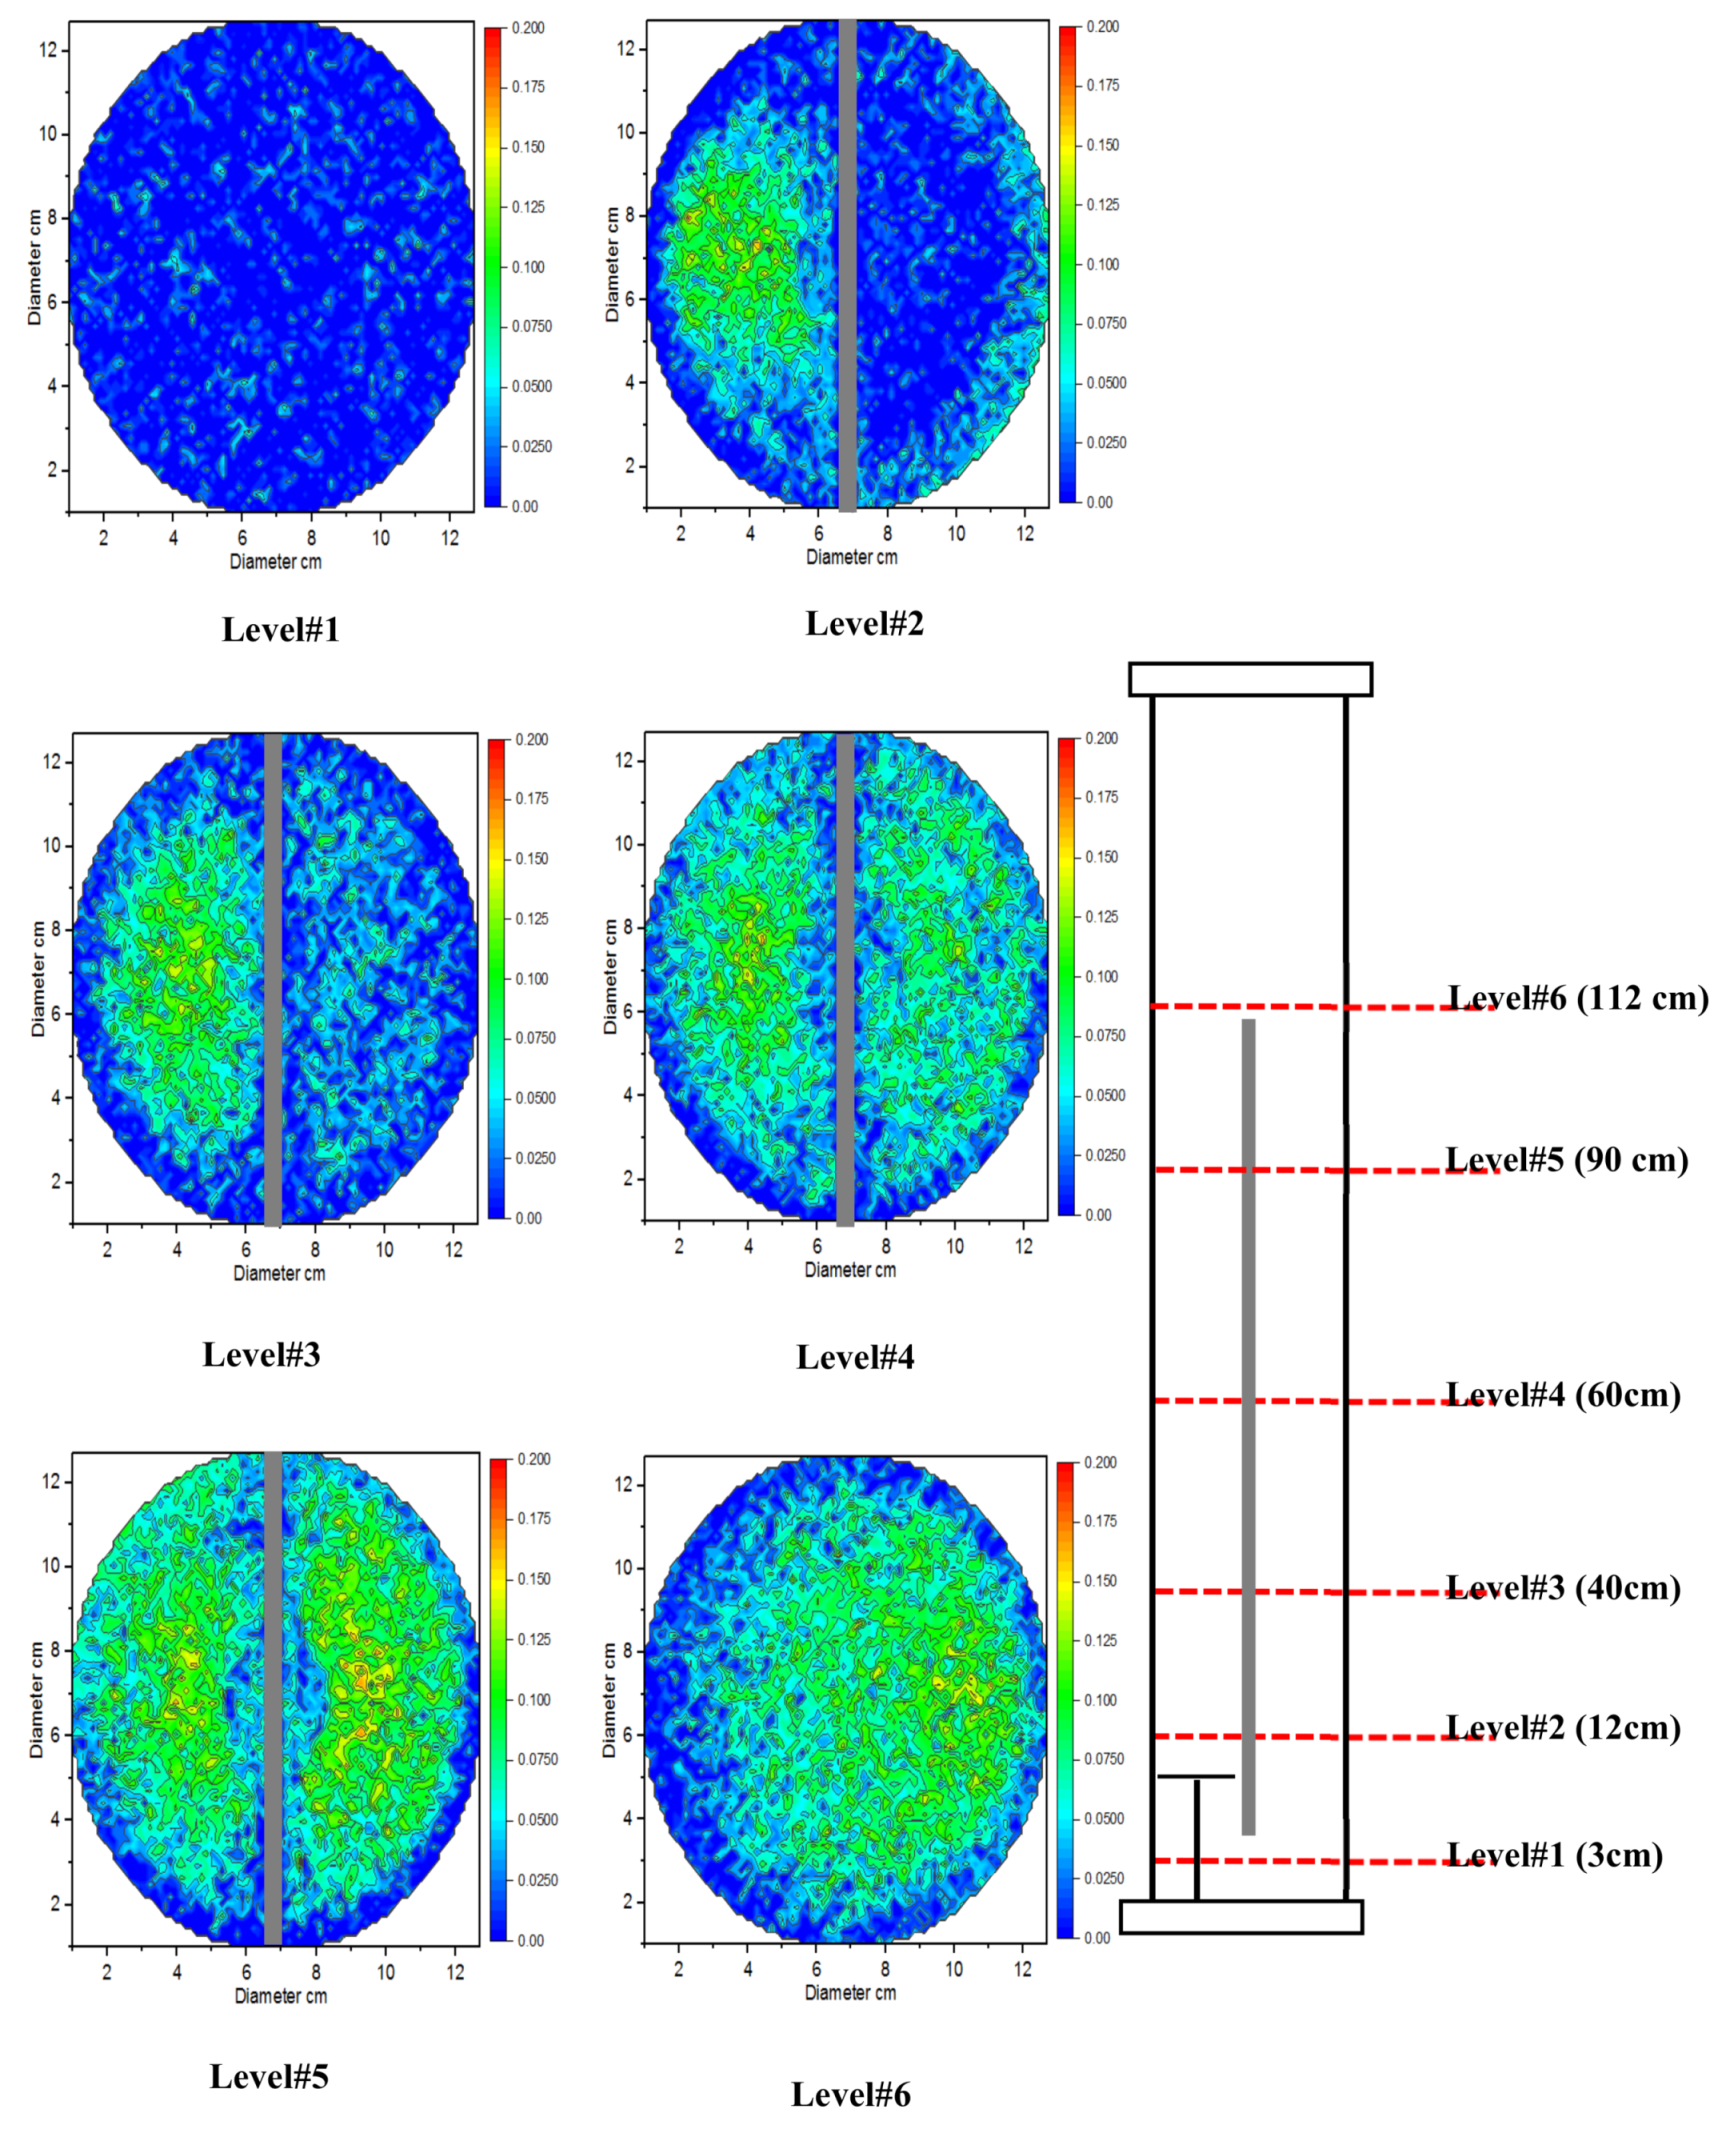
3.1. Cross-Sectional Gas Holdup Distributions

The visualization and quantification of local gas holdup distribution are essential for designing, scaling up, and performing simulations for the split airlift reactor. In this reactor, the importance of the gas holdup distribution comes from the fact that the governs hydrodynamics characteristics due to the difference in gas holdup between the riser and the downcomer sides, which drives the circulation of the liquid through the reactor column. Therefore, in this investigation, CT scans were conducted across the split-plate airlift reactor at six axial heights (i.e., 3, 12, 40, 60, 90, and 112 cm above the reactor base) and under three gas velocities (superficial manner) of 1, 2, and 3 cm/s to visualize and quantify the gas hold up over the entire height and cross-sectional area of the column.
Figure 8, Figure 9 and Figure 10 displays the axial evolution of the local gas holdup distributions for all three gas velocities. these images colors show in each pixel the magnitude of the local distribution for gas holdup, where the blue color marks less gas holdup while the red color indicates more gas (i.e., less liquid holdup). the CT scan results (images) clearly visualized and quantified the variation in distribution in gas holdup at different axial heights and gas velocities.
The gas holdup distribution images at the axial height of 3 cm from the reactor base (i.e., under the split plate and gas sparger, level #1) display uniform gas-phase distributions, and the magnitude of gas holdup values in this axial level are almost identical despite the changing in the magnitude of the gas velocity (i.e., 1–3 cm/s). To quantify such behavior in this level, the gas holdup magnitude was obtained by azimuthally averaging it values as presented in Figure 11 (level #1). This figure is clearly representing the profiles of gas holdup which are almost has same amount. For instance, the variation in percentage of average gas holdup amounts under gas velocities of 1 and 2 cm/s is 10.6%, while the variation in 1 and 3 cm/s gas velocity is 7.3%.
This convergence of the gas holdup values at this axial level is due to the availability of more liquid in this region as compared to others region of the split column where the liquid is pushed vigorously to the riser region as a result of the short distance between the end of the split plate and the column base. On the other hand, the distribution images for gas holdup at axial height of 112 cm (i.e., above the split plate, level #6) show nonuniform gas holdup distribution where more gas tended to the right side (i.e., downcomer region of the column) than the left side (i.e., rise region of the column) which is the sign of liquid circulation. This can be explained by that part of gas bubbles separate from the liquid phase at the top of the split plate (i.e., left side) and moves to the right and then to the downcomer region. Such behavior was also reported by other researchers [4,6,29].
The reason behind this nonuniformity of the distribution in gas holdup at this level is the high liquid velocity which enforces the gas bubbles to move toward the wall of the column. Additionally, the magnitude of gas holdup values increases significantly with the increase in the magnitude of superficial gas velocities in this axial level, as displayed in Figure 11 (level #6). For instance, the variation in average percentage of the gas holdup profiles with gas velocity 1 and 3 cm/s is 137.3%. The CT scan images at axial height 12 cm (i.e., above the gas sparger, level #2) visualize clearly how the gas and liquid distributed in the region of gas sparger (i.e., left side of the column, riser region) and downcomer region (right side column). It is clear from these images (i.e., at axial level 2 and under gas velocities 1, 2, and 3 cm/s) that the gas sparger has the ability to release the gas phase almost uniformly and more gas concentrated at the middle of the riser region while less gas holdup in downcomer side. Such behavior was clearly quantified and shown in gas hold shapes with various gas velocities (i.e., Figure 11, level #2)
Along the split reactor column height, the gas holdup distribution images obviously captured the development of gas–liquid distributions in the riser and downcomer regions. Similar gas-phase distribution behaviors but different magnitudes were observed under different ranges of superficial gas velocities, as demonstrated in Figure 8, Figure 9 and Figure 10. It is interesting to observe that the CT scan technique was eligible to remark the fully developed flow region, which at the axial levels of 60 and 90 cm (level #4 and level #5) where the gas and liquid were uniformly distributed in these regions.
Moreover, the gas holdup profiles under the studied superficial gas velocities, as displayed in Figure 11, clearly show that the gas holdup profiles were dependent on column height except in the fully developed flow region. Obtaining the distributions in gas holdup along the split airlift reactor and its cross-sectional area will pave the way for developing hydrodynamic models and simulations through validating these models and simulations with this newly obtained experimental data. The validated models or simulations will help the engineers to design and scale up or even analyze the performance of this kind of reactor toward developing the microalgae culture industry, which considers the split airlift reactor the choice for this application.

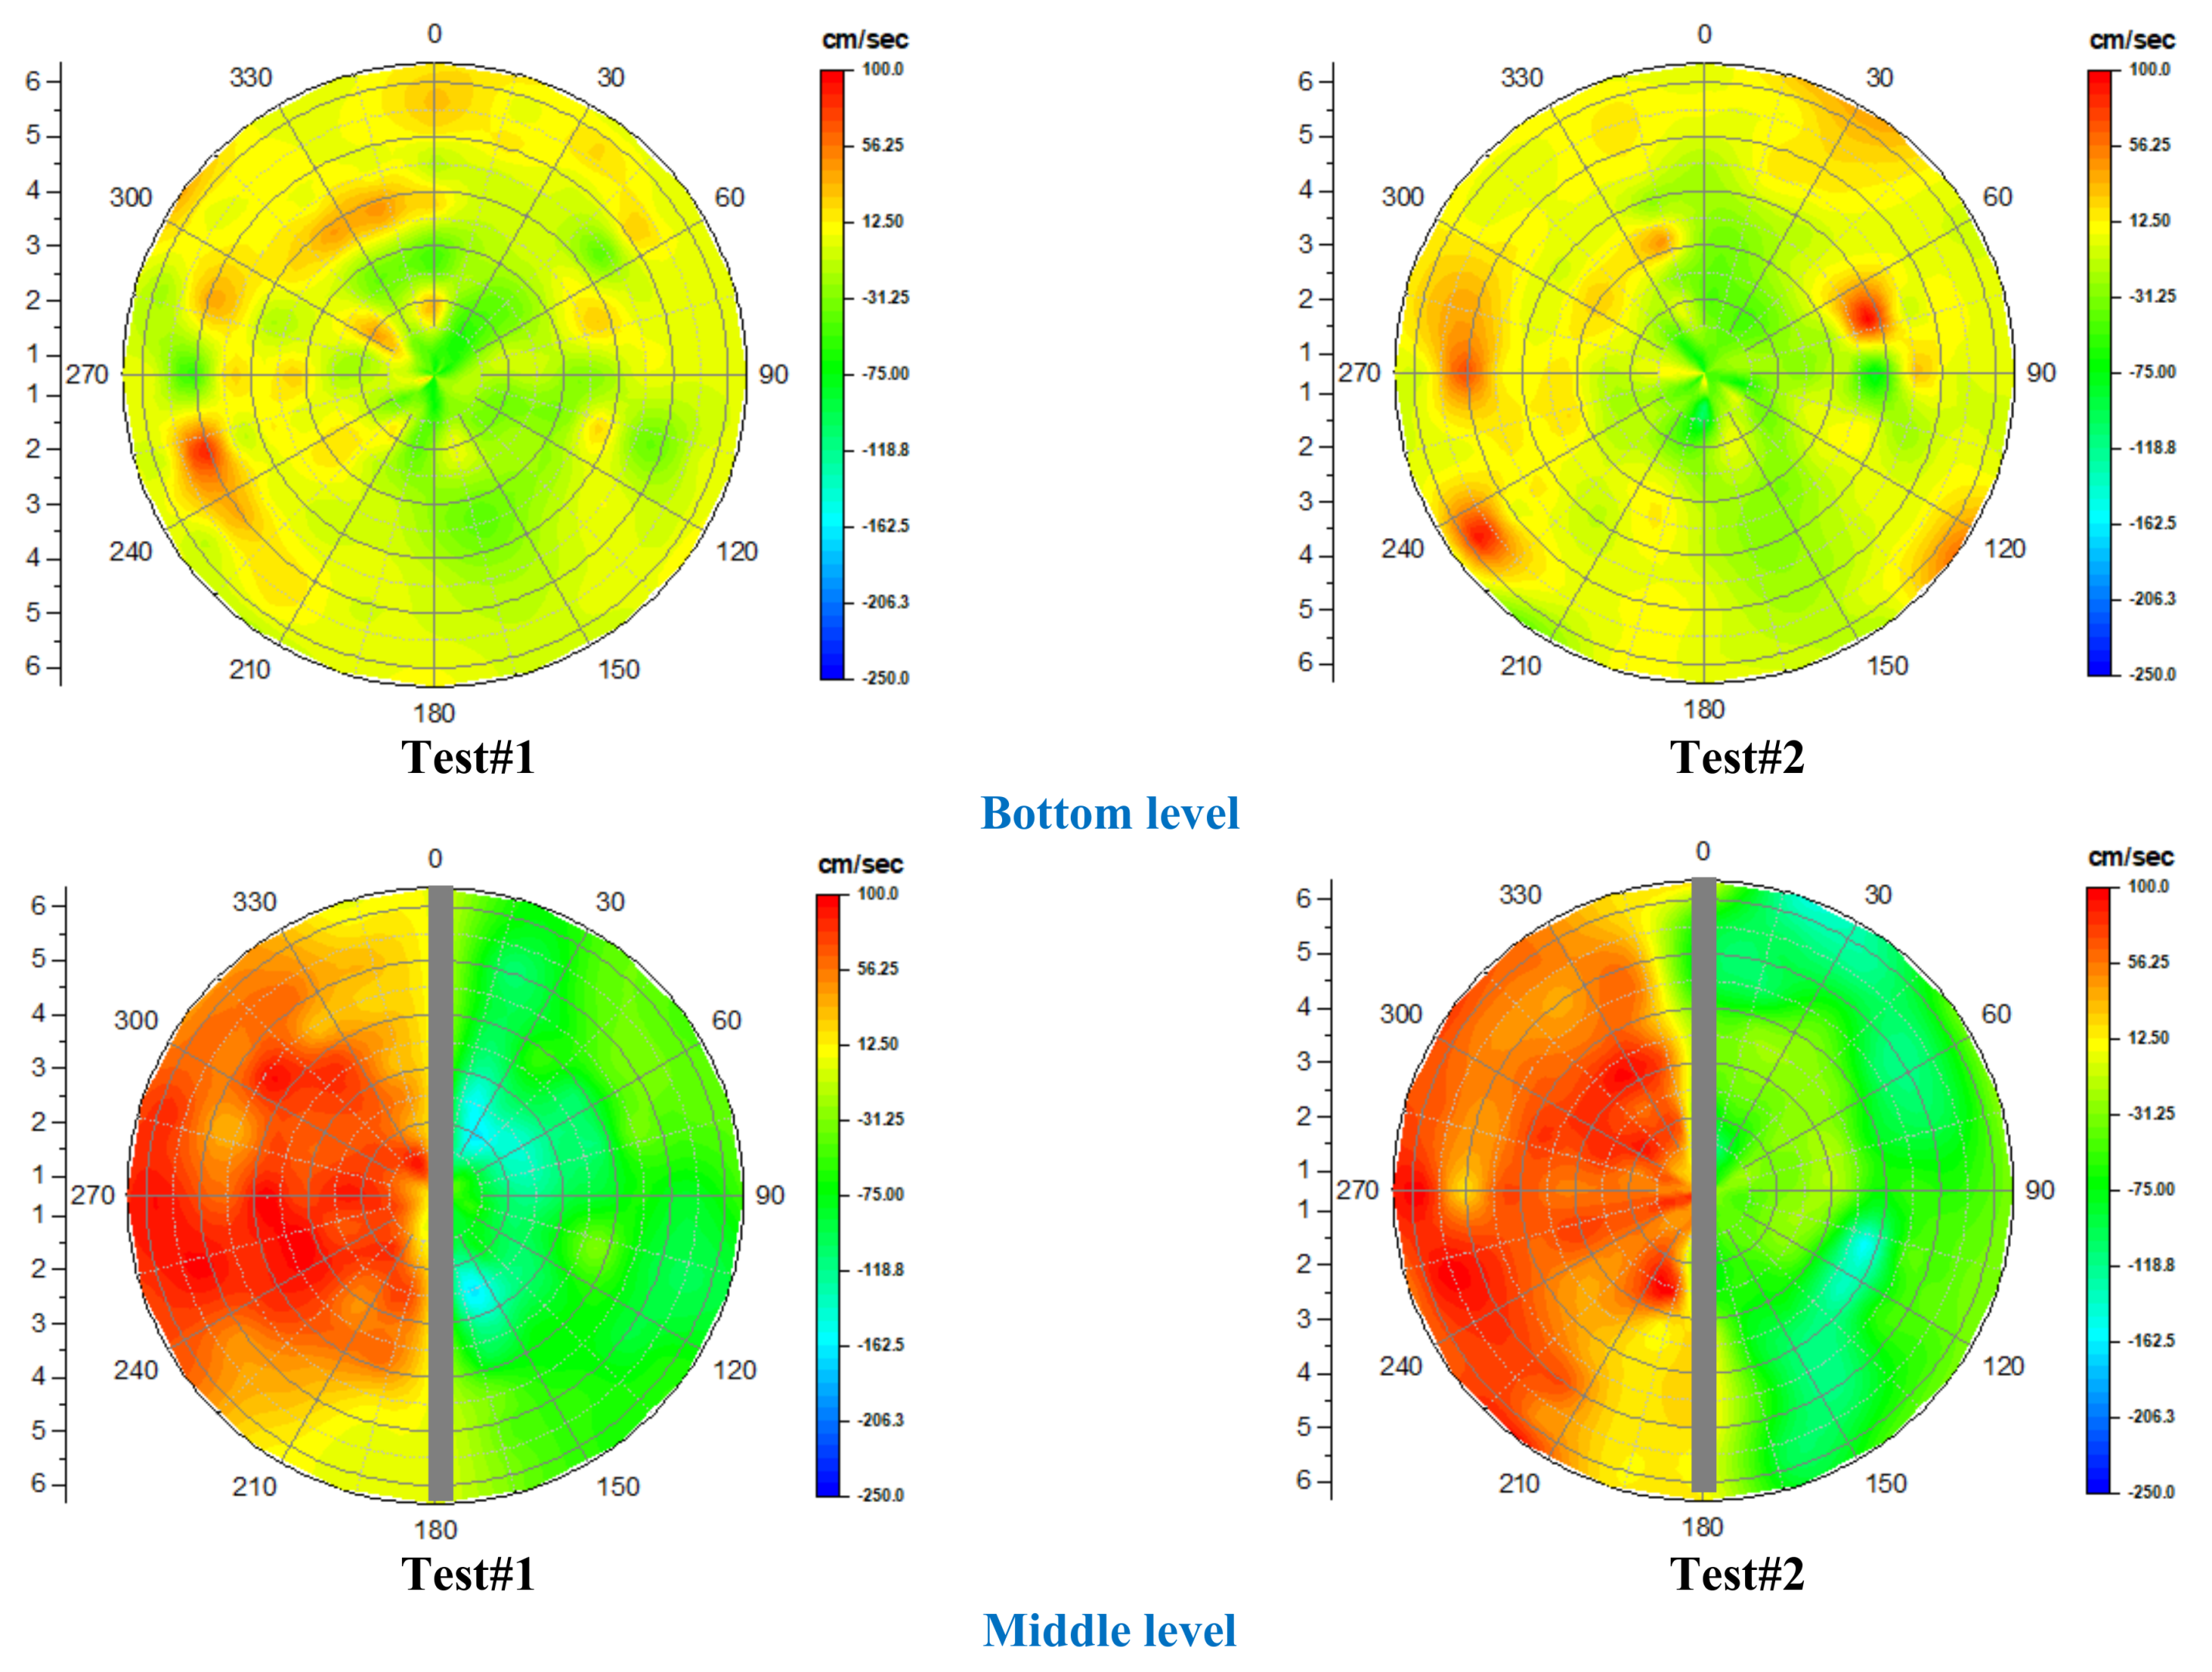
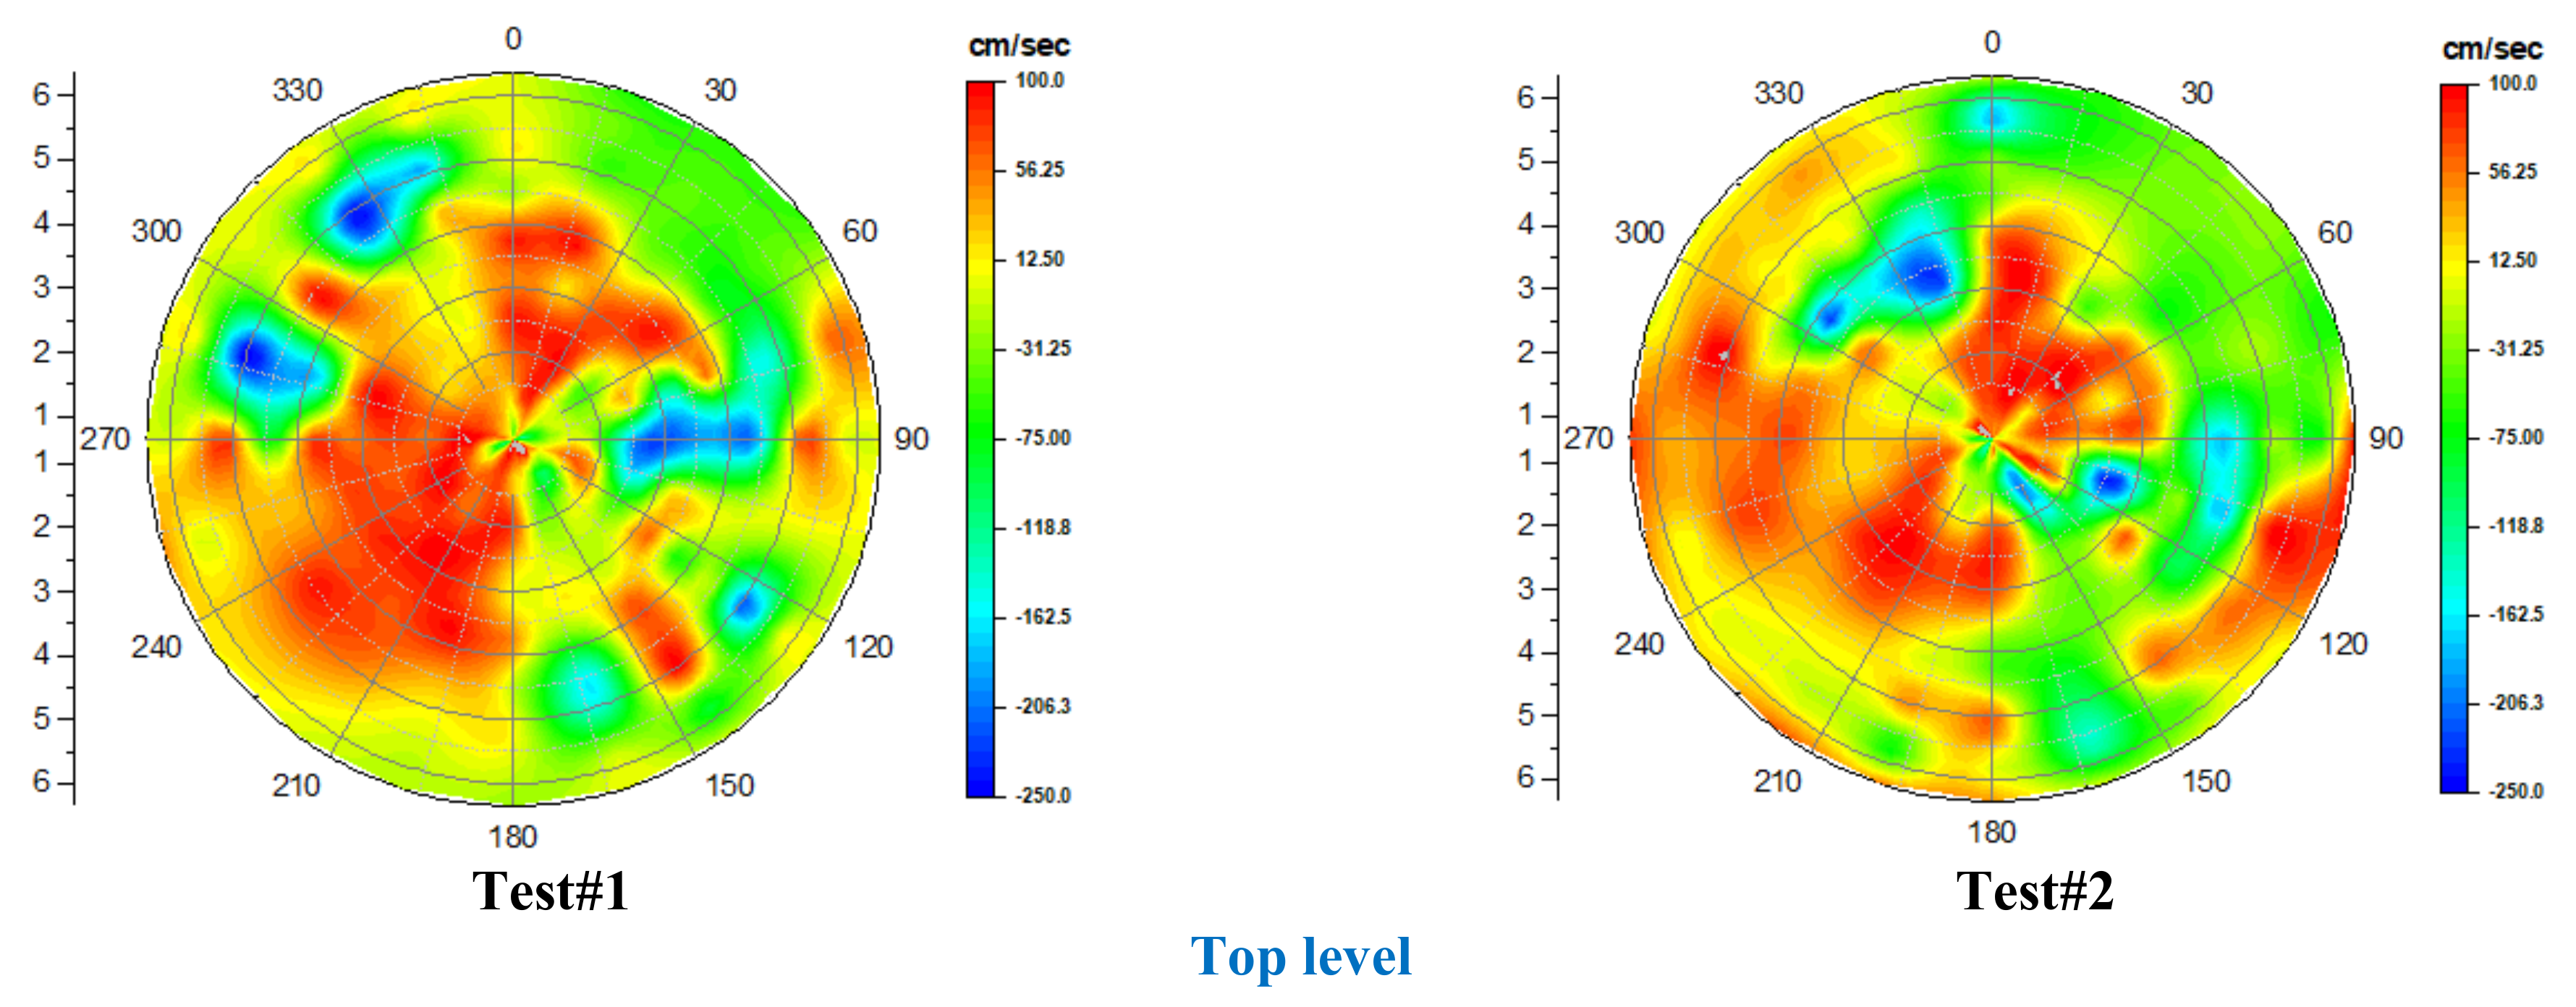
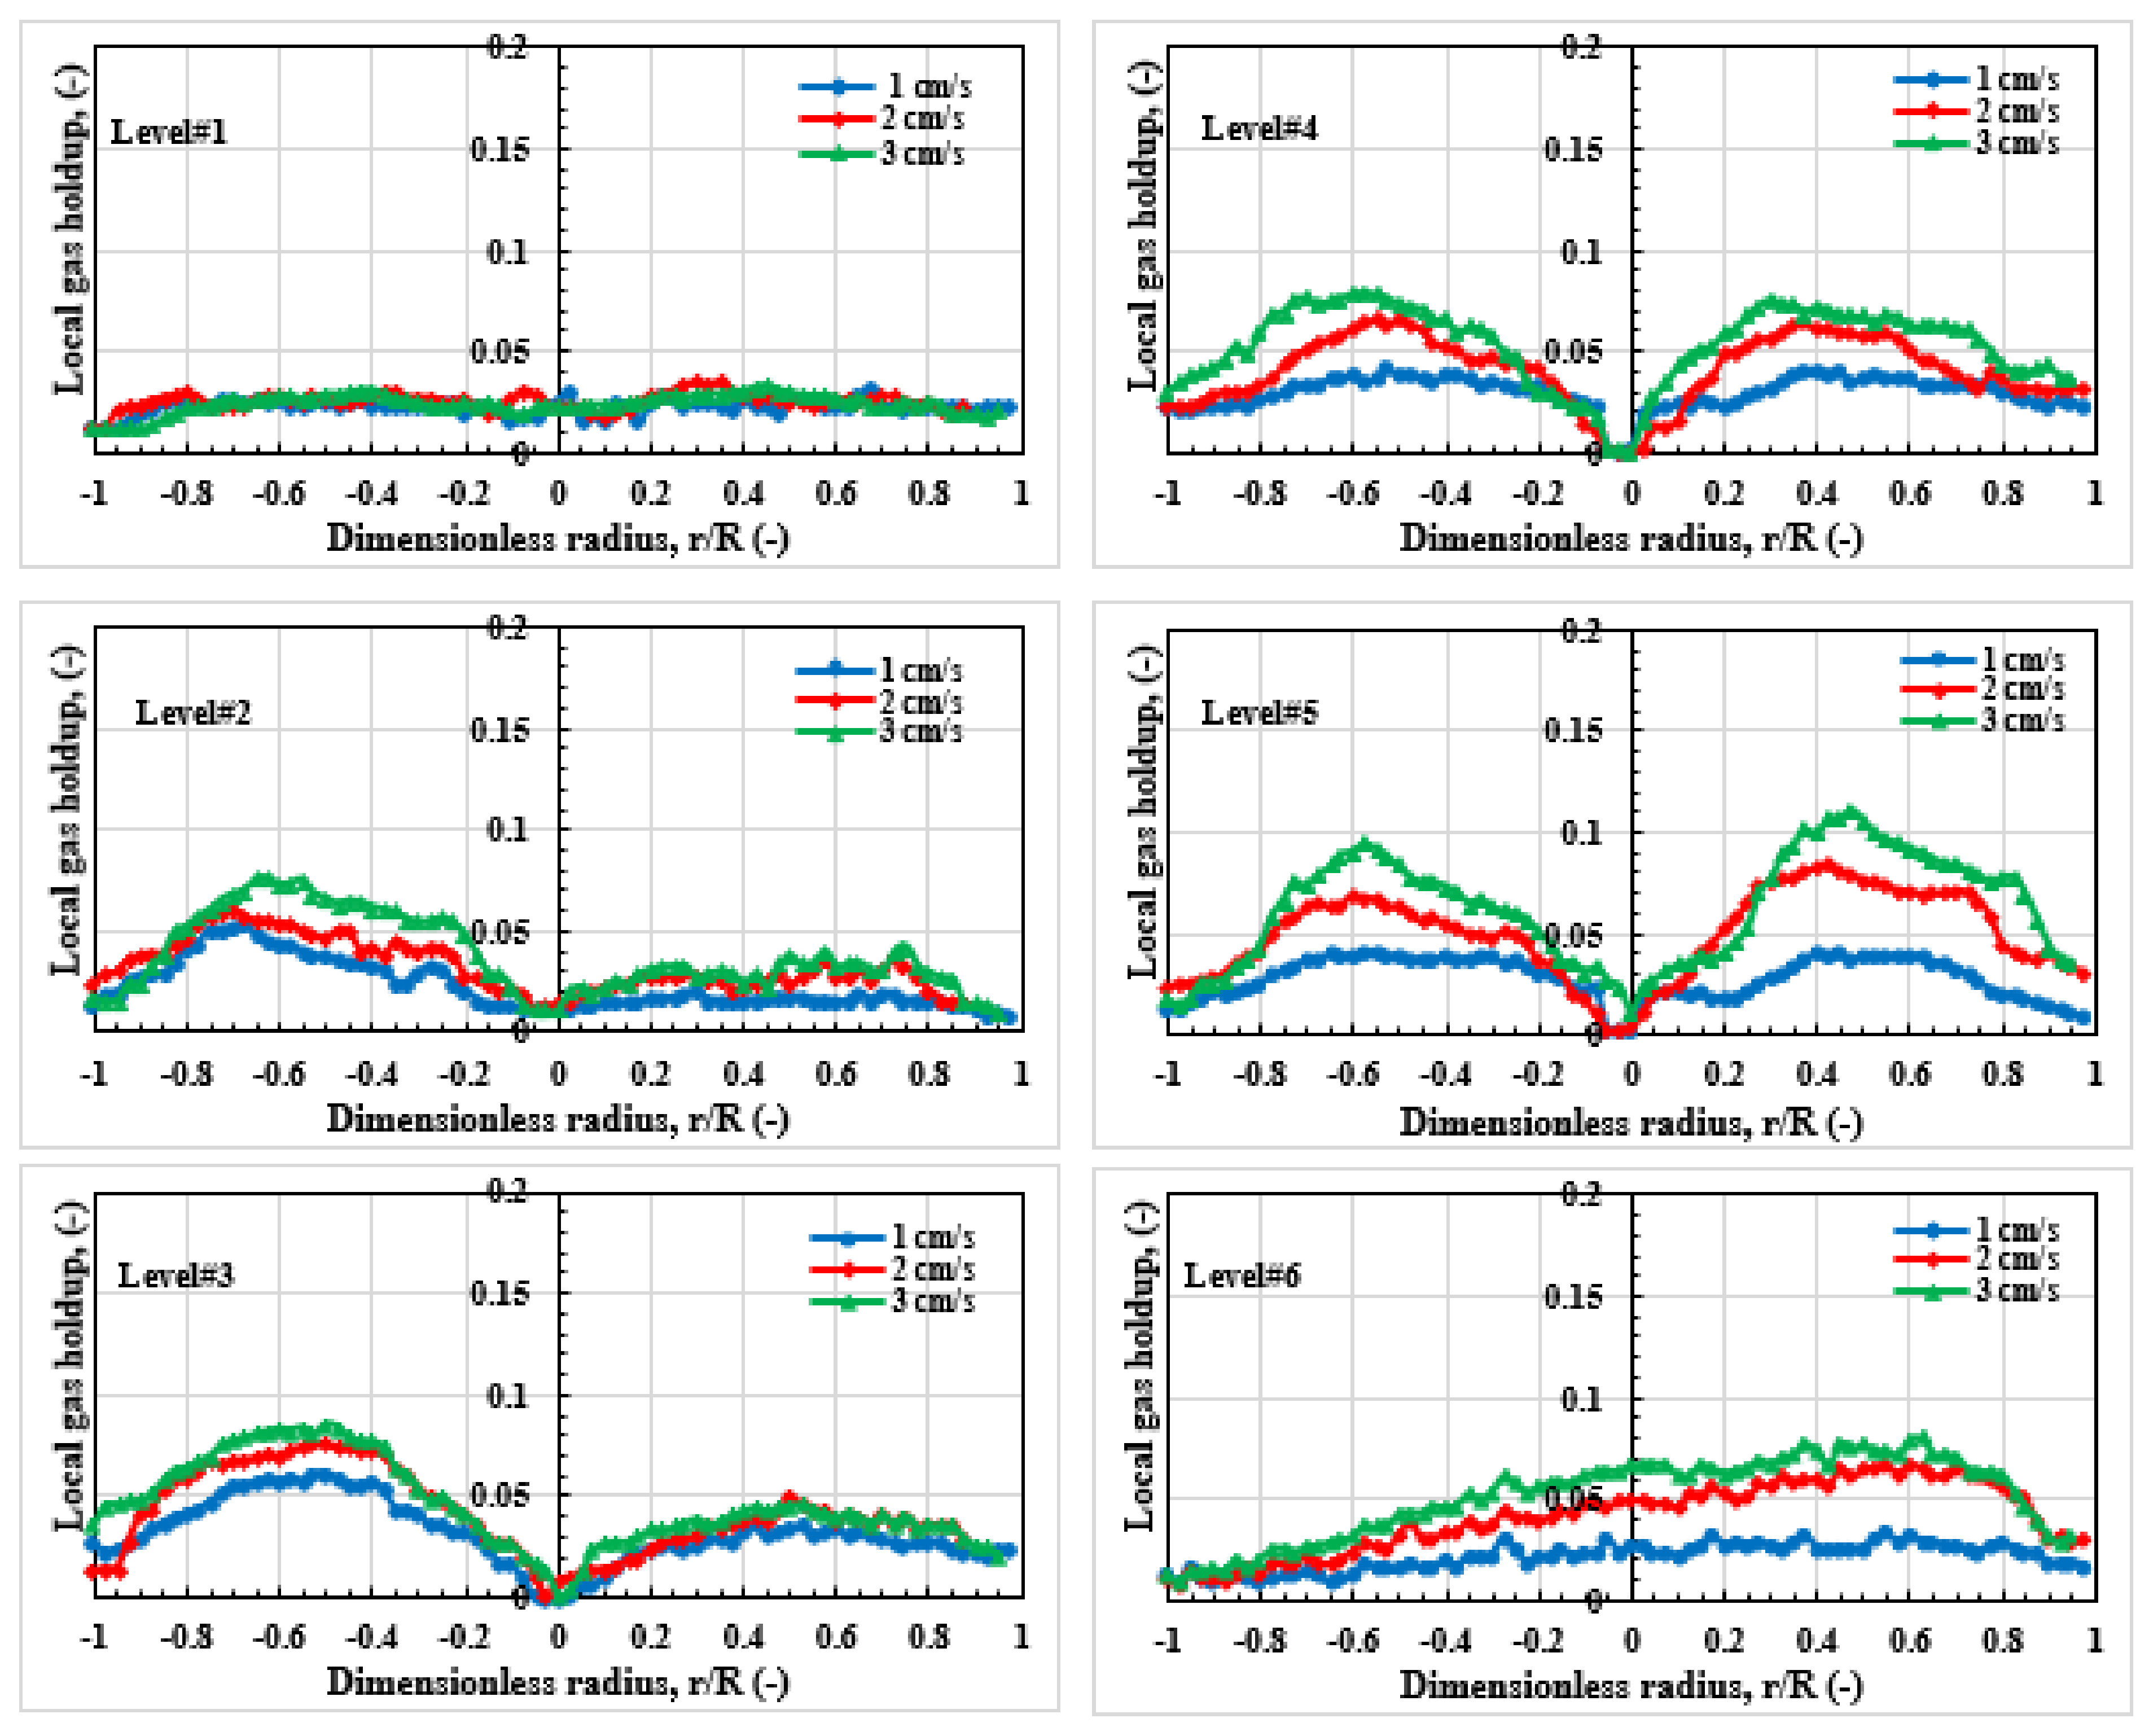
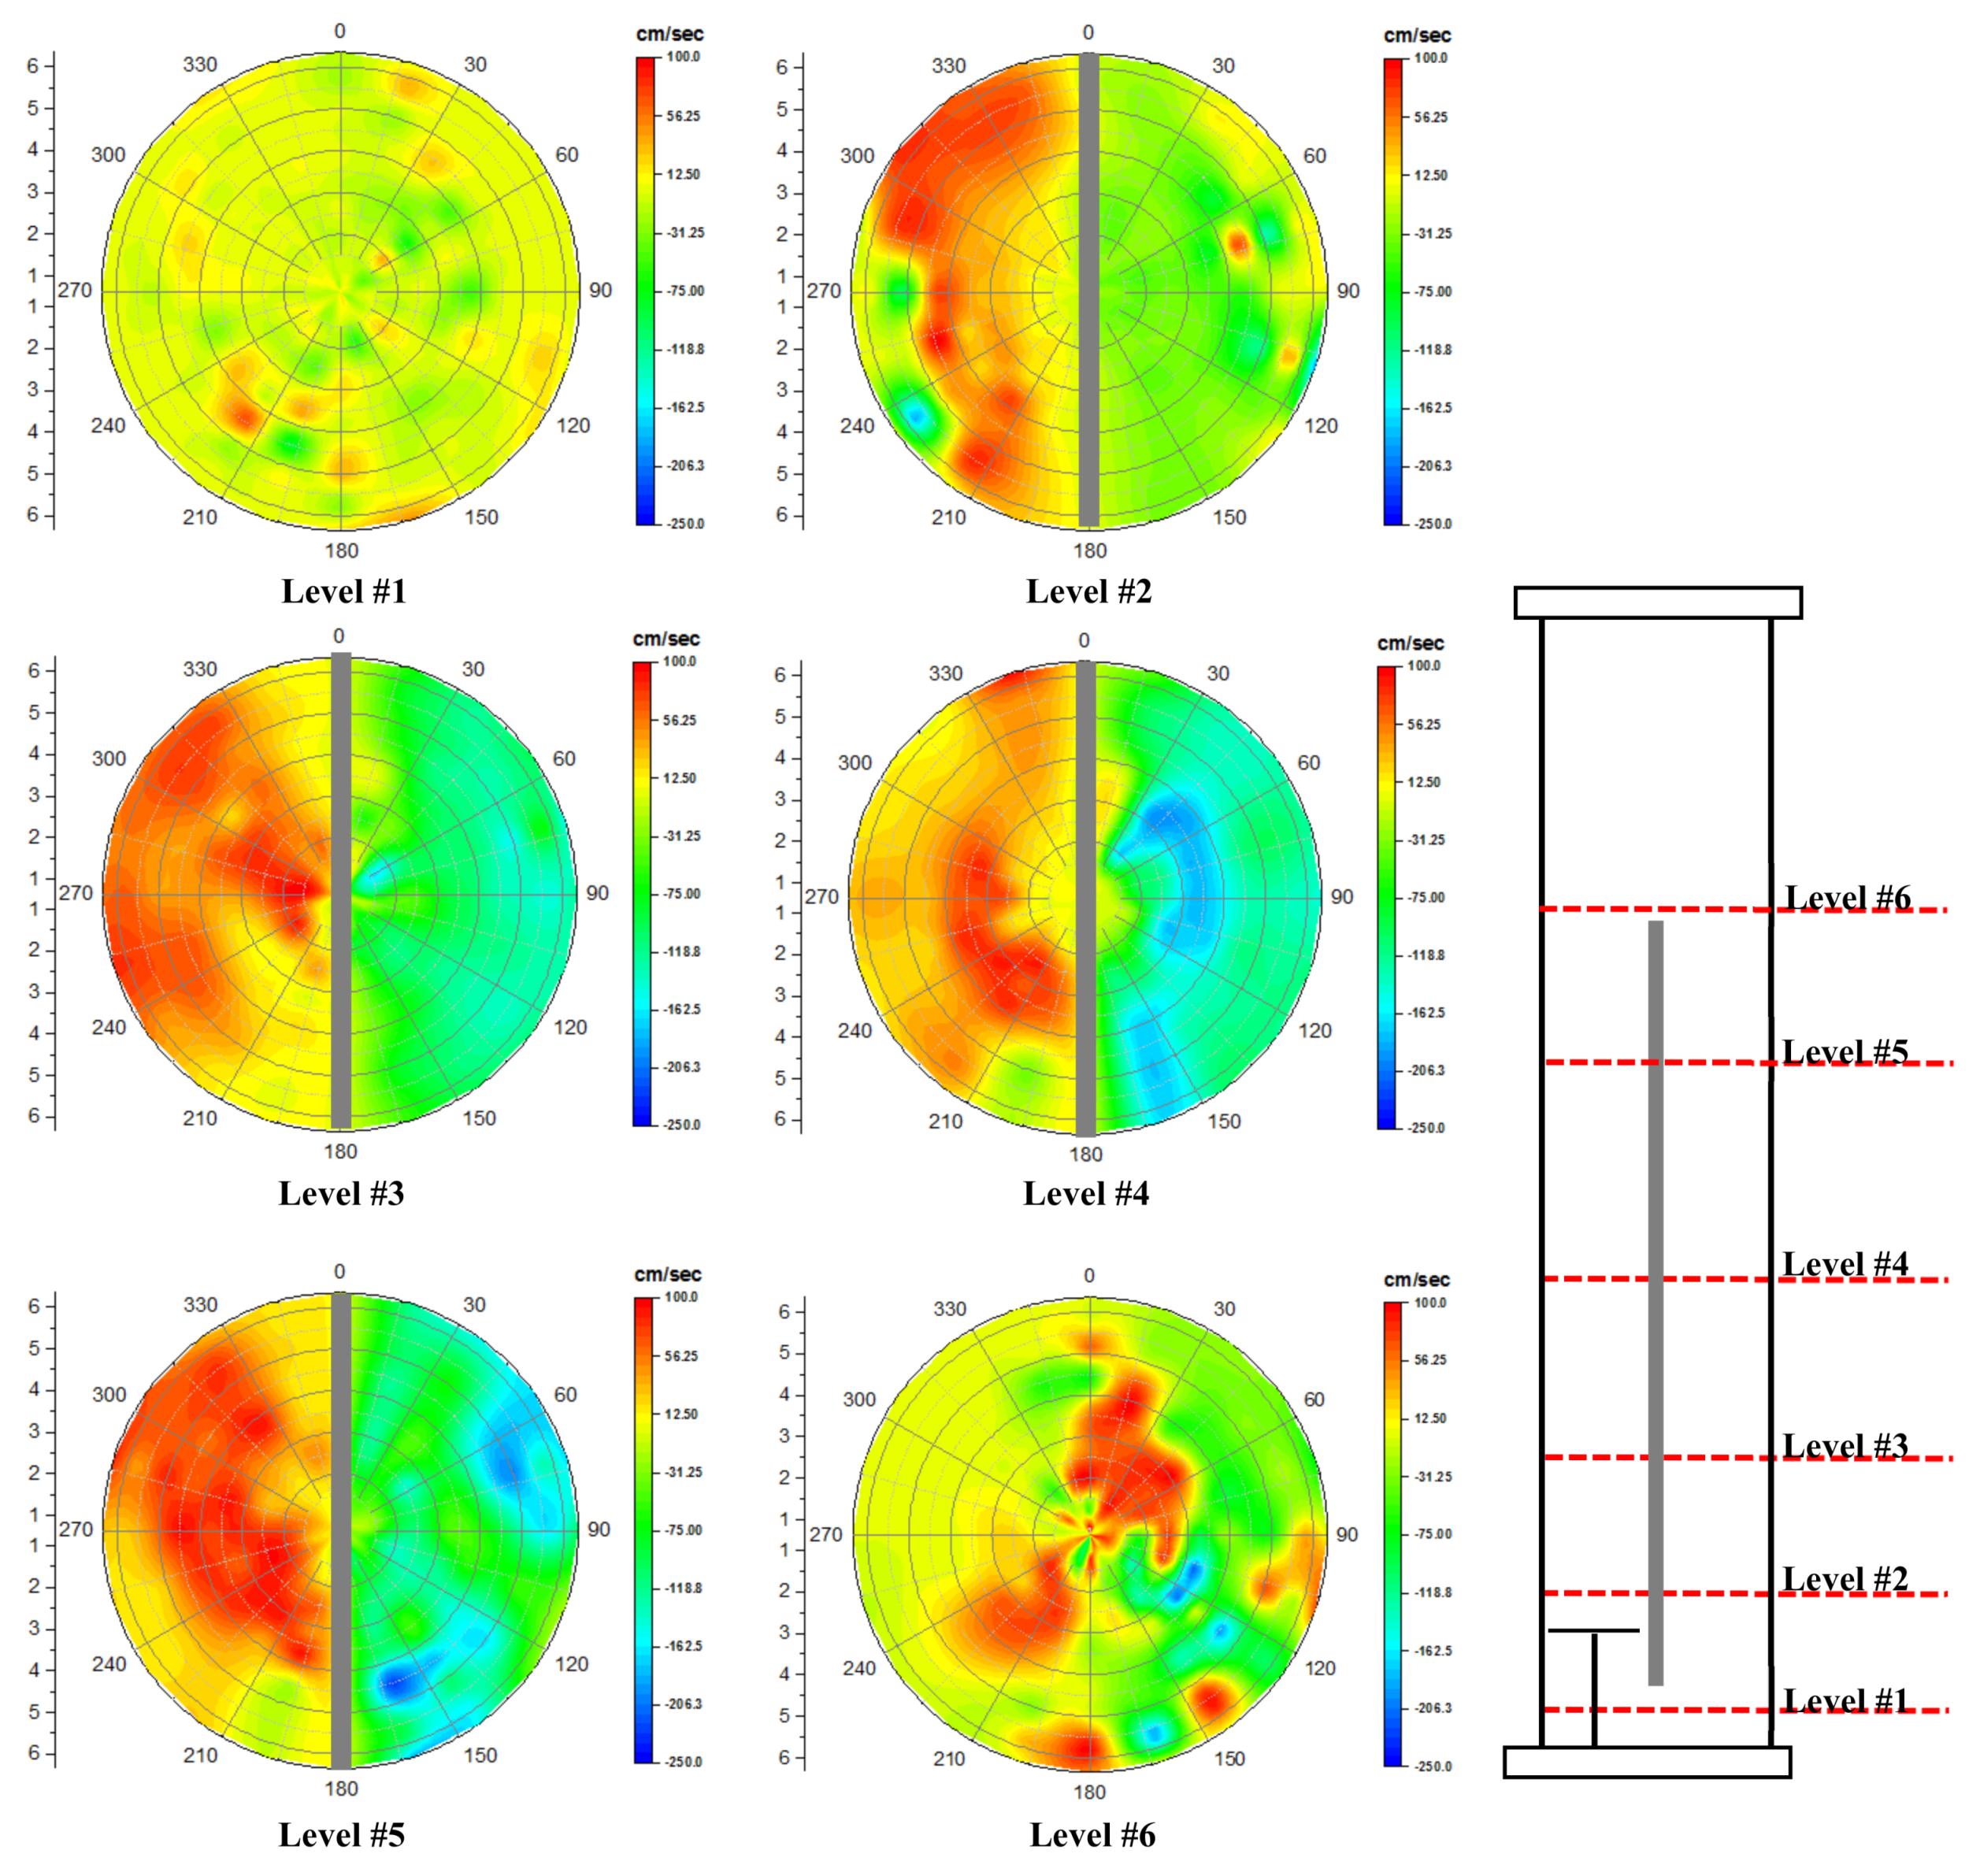
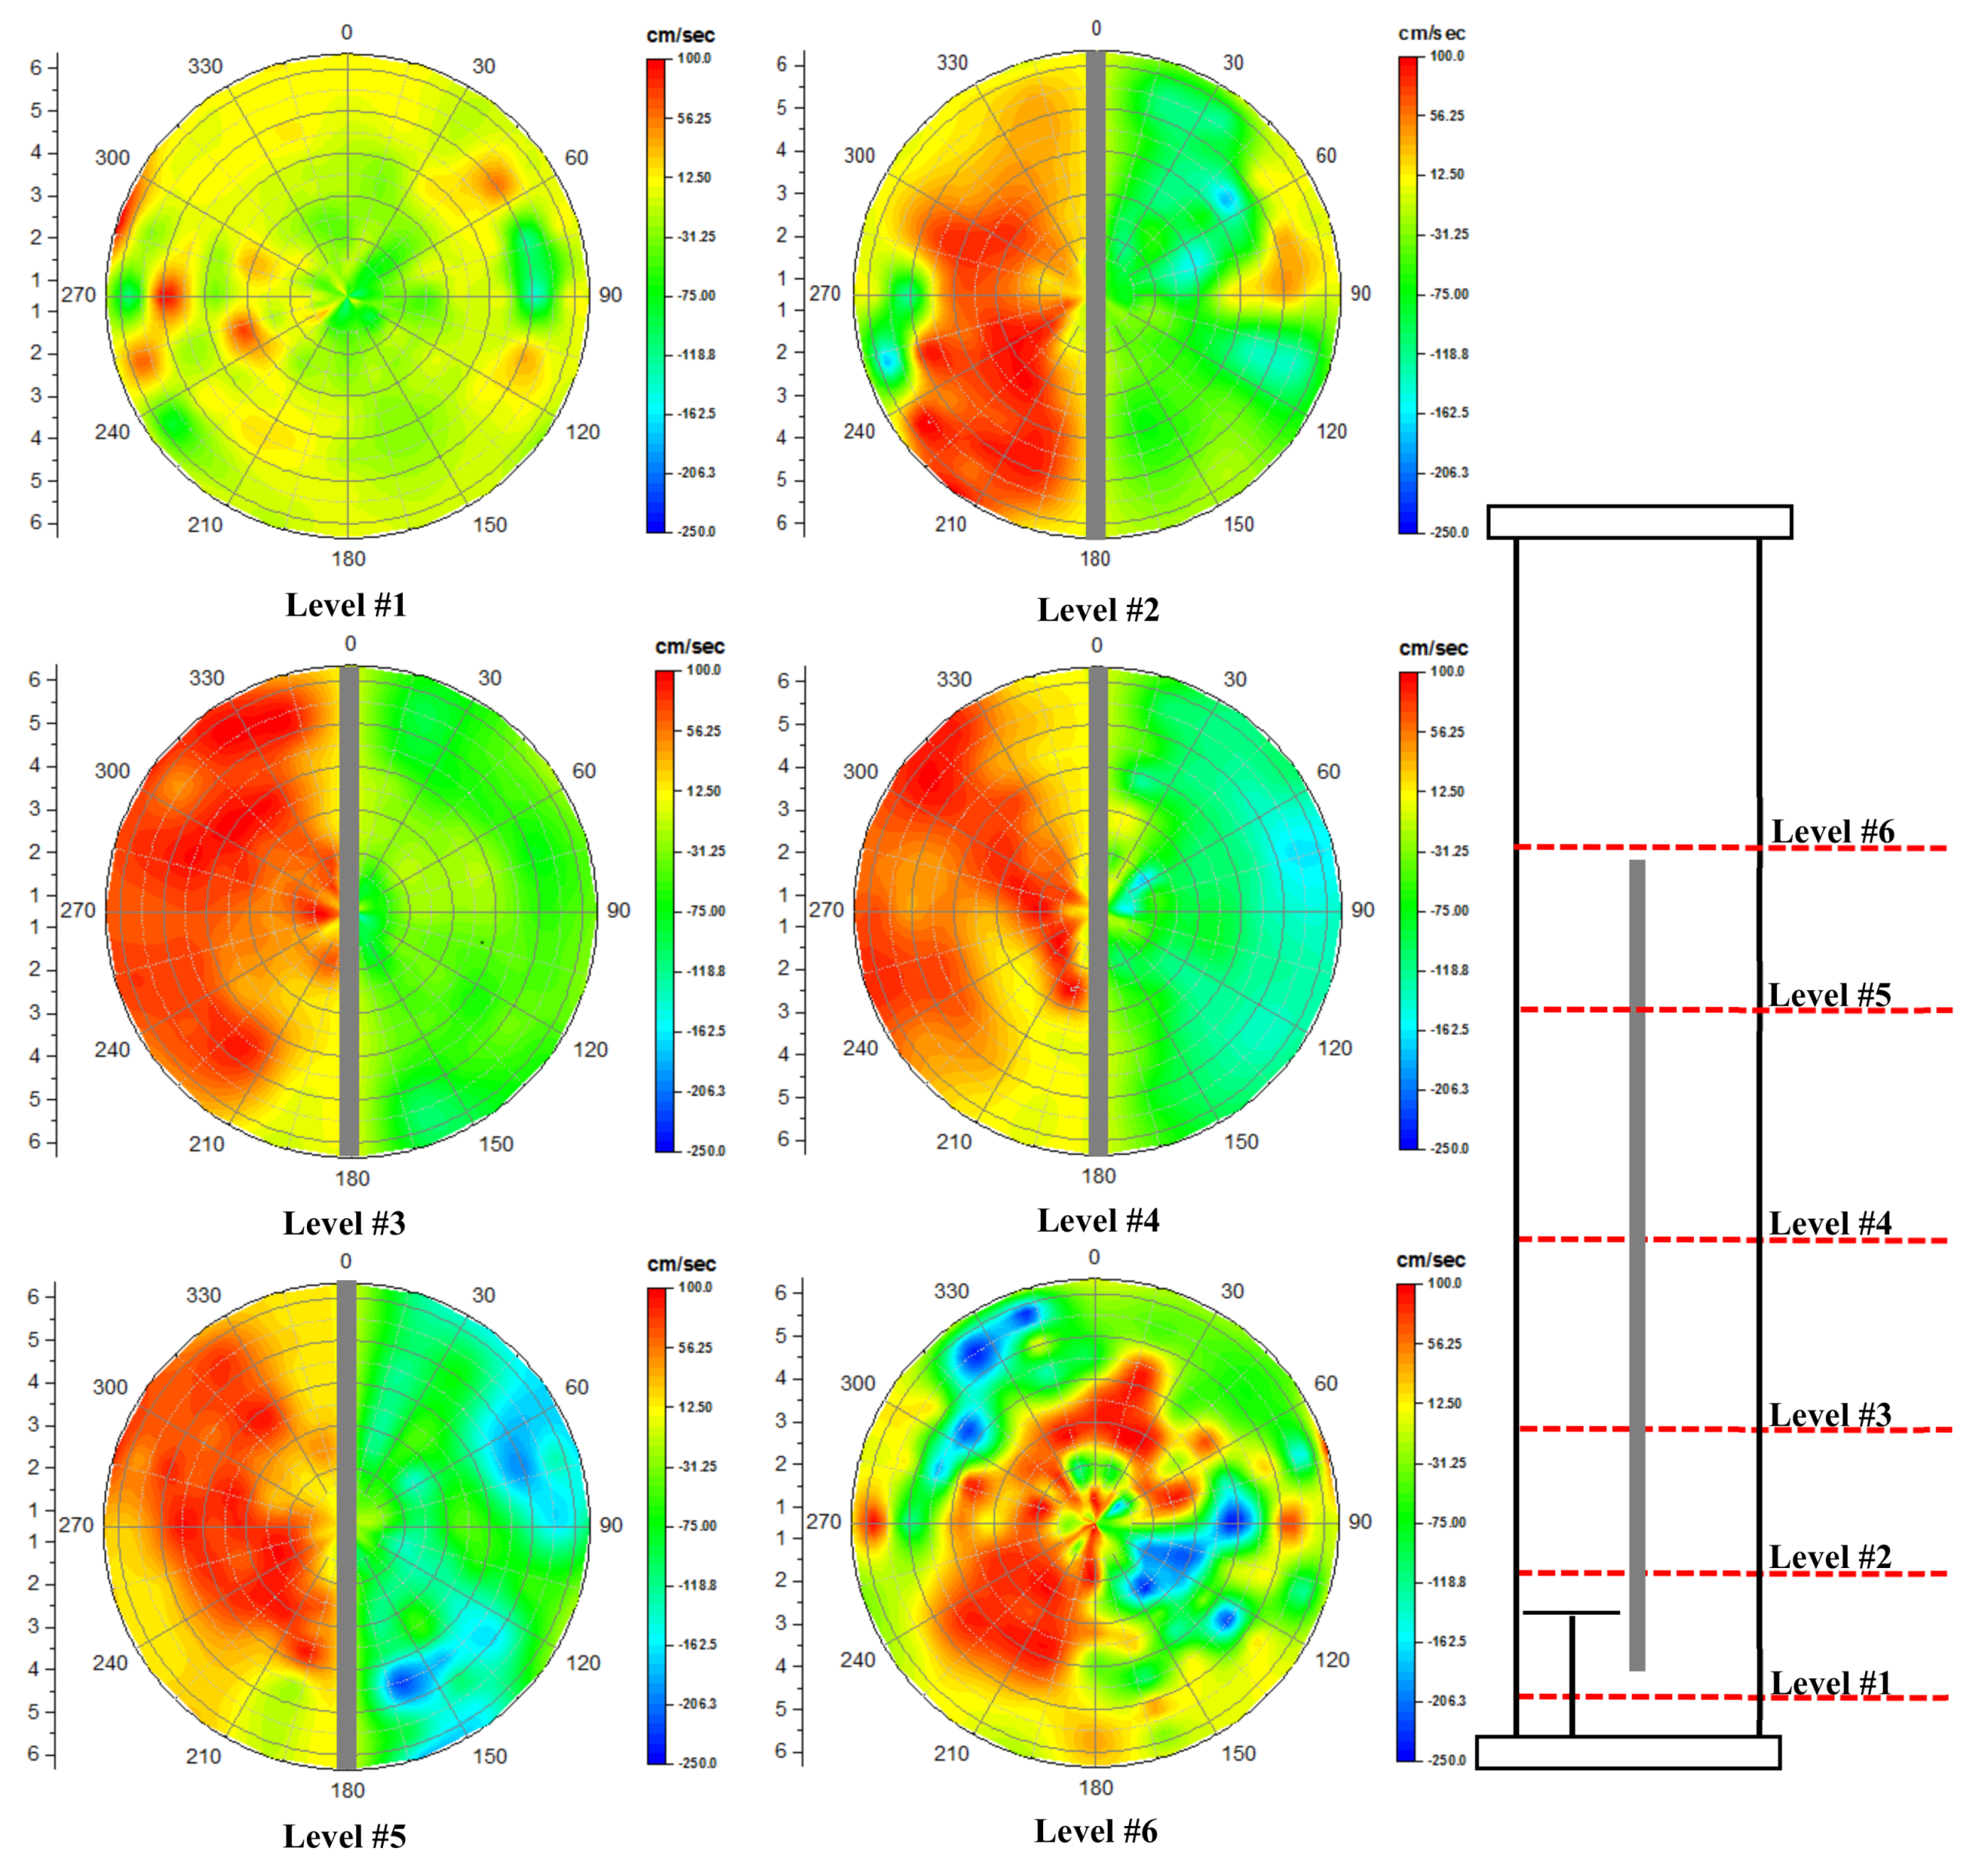
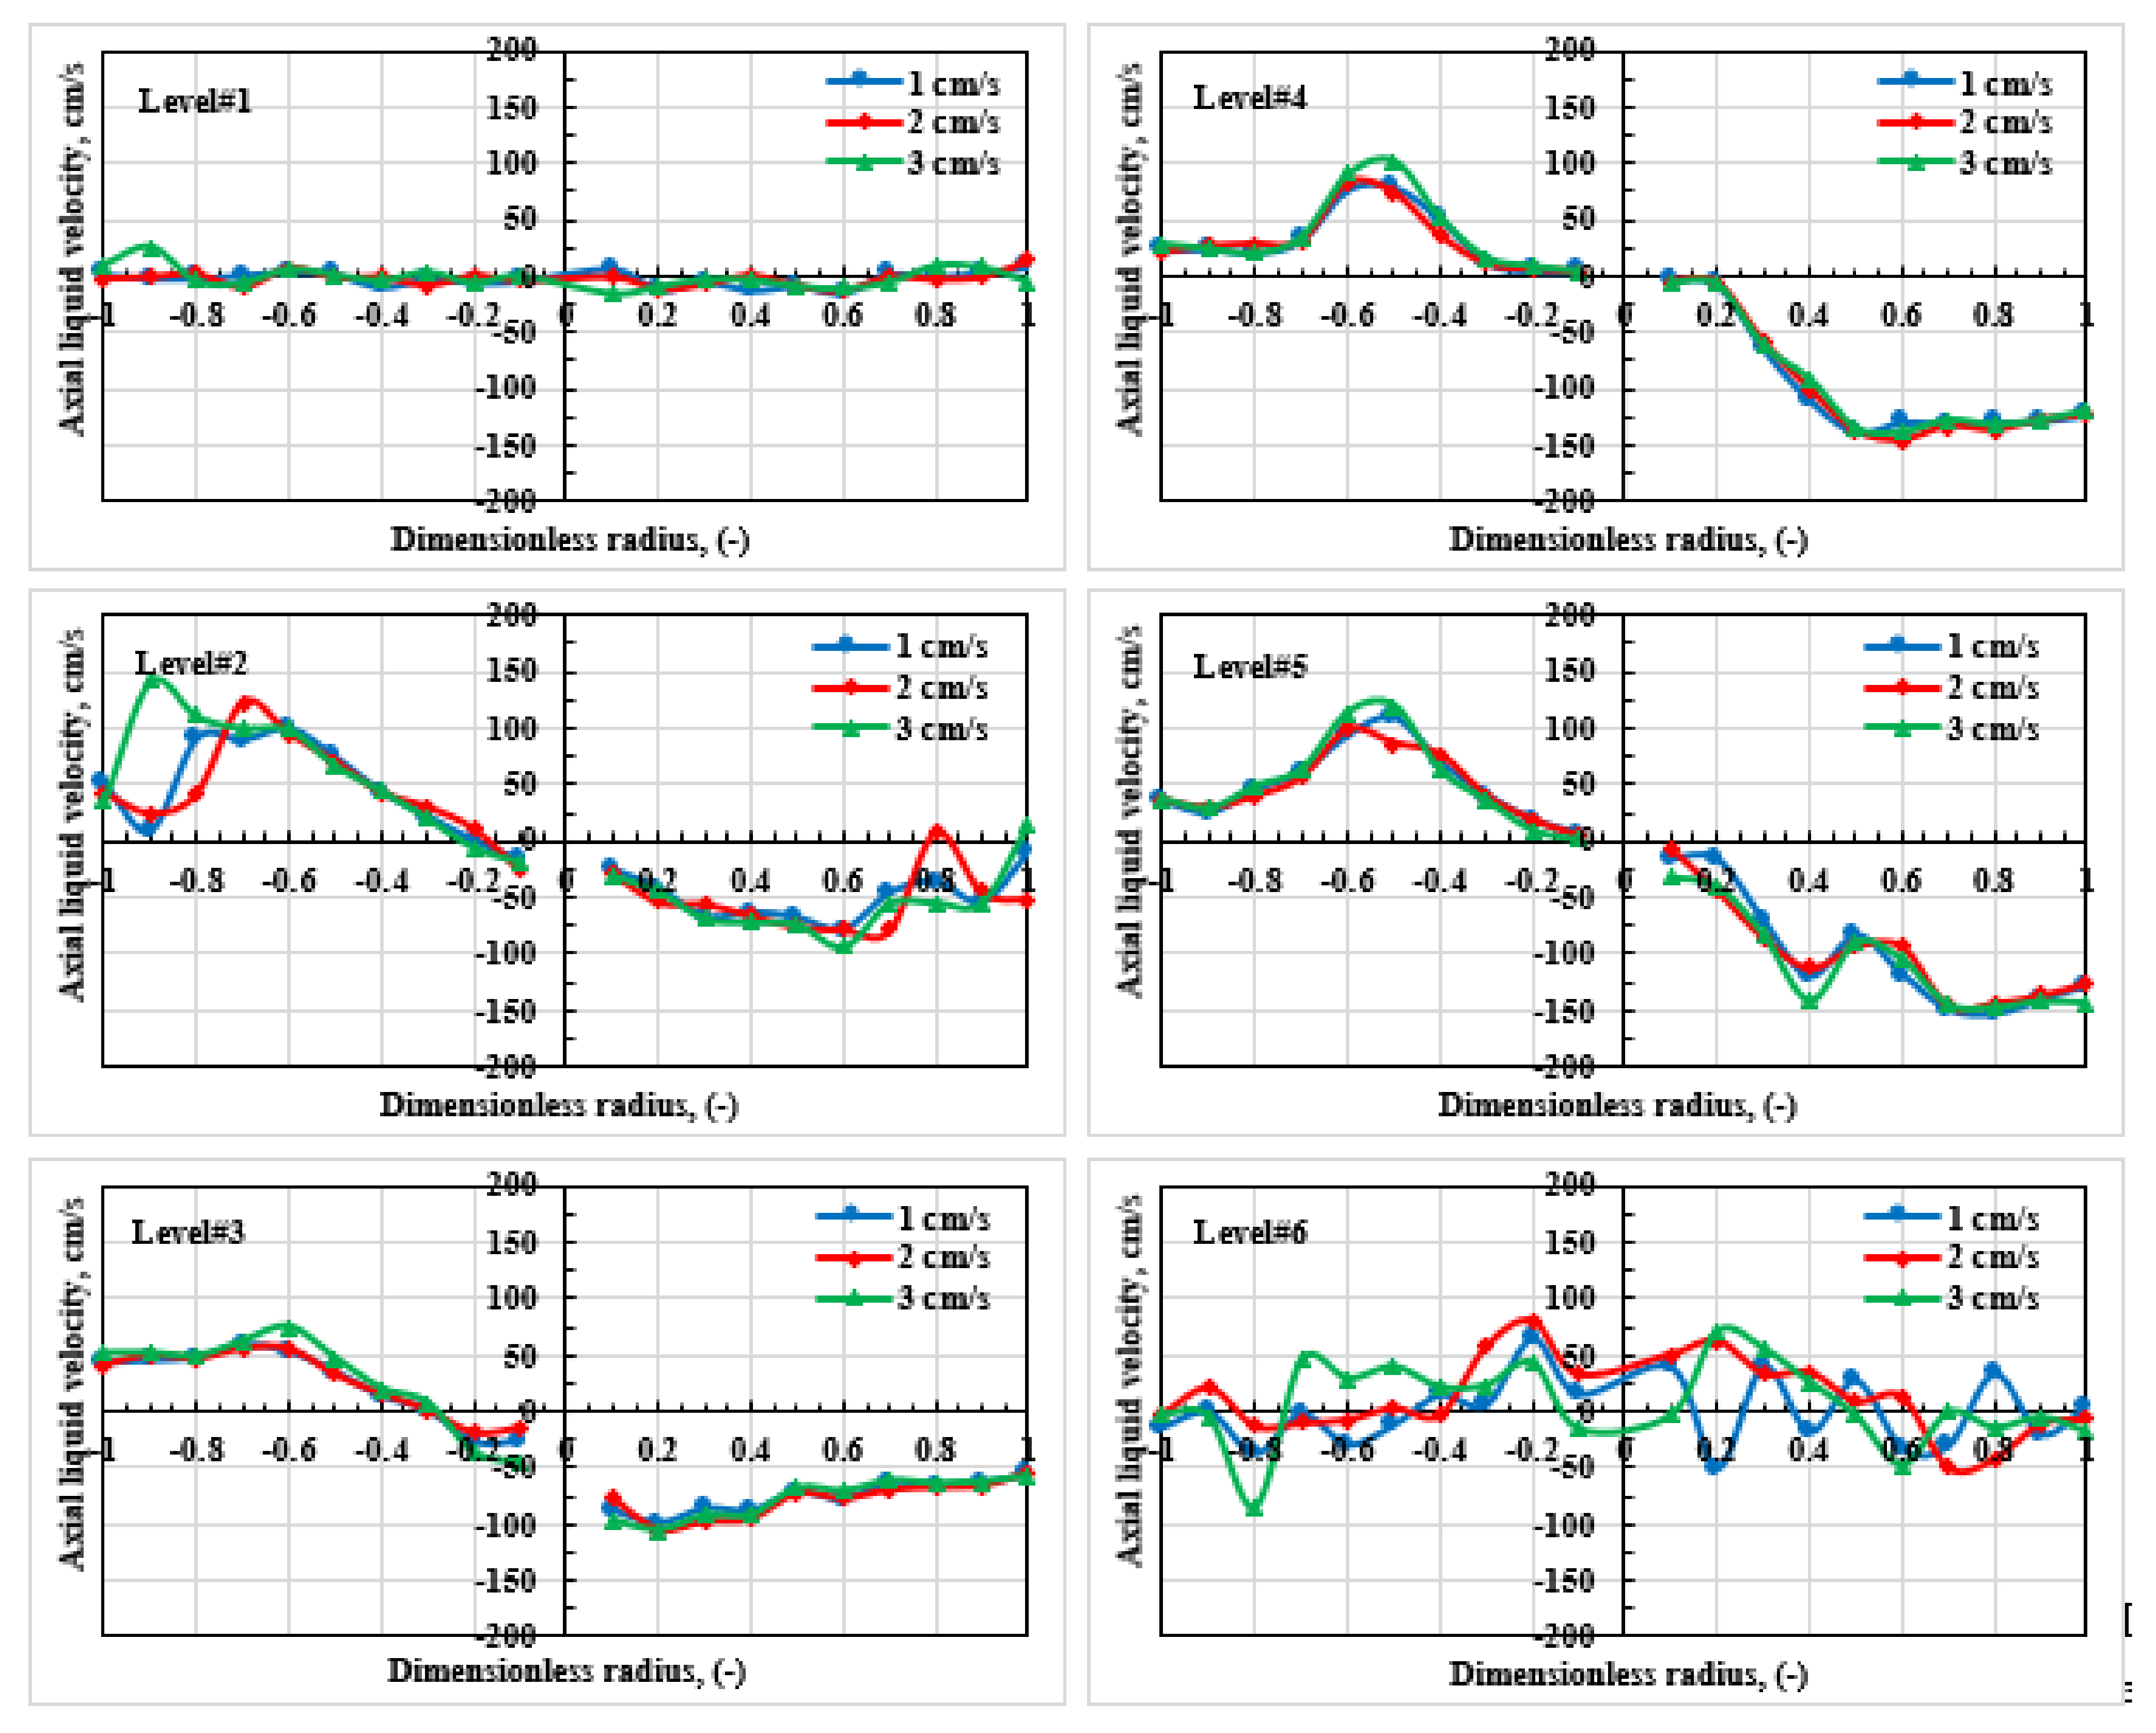
3.2. Axial Liquid Velocity Distributions and Their Profiles

Figure 12, Figure 13 and Figure 14 display the axial local liquid velocity distributions of the split airlift reactor operating at gas velocities of 1, 2, and 3 cm/s (superficial manner) for different axial heights of the column. Gradients of the color bar in each image represent the magnitude of local axial liquid velocity, where the red color indicates a high local liquid velocity while the blue color marks the less liquid velocity. As evident from these liquid velocity distributions, the flow pattern looks to be asymmetric along the split airlift reactor under the three studied gas velocities. Additionally, the axial local liquid velocity images visualize clearly that the liquid flows upwards at the riser section and downwards in the downcomer region. Hu Ping Luo [4,45] also reported such an observation. The regions at the upper and lower of the split plate show different flow patterns than in the riser and downcomer regions, as displayed in Figure 12, Figure 13 and Figure 14 This different behavior of liquid flow pattern due to the severe liquid mixing and circulation in these regions. Such visualization of flow structure for these regions (i.e., top and bottom of the column) was never reported before in literature despite the fact that these regions significantly impact the driving force and the hydraulic resistance to the liquid flow in this split airlift reactor.
As it was obtained from the gas holdup results in the previous section, it was also found that the axial liquid velocity at axial heights 60 and 90 cm are almost identical qualitatively. This identical liquid velocity distribution is a sign of this flow pattern reaches the fully developed flow. Similar observations are observed for all three studied superficial gas velocities (i.e., 1–3 cm/s) in these two axial levels. This behavior can be further proved and quantified by azimuthally average the velocity field to plot the diametrical profile of velocity on a two-dimensional plane, as displayed in Figure 15. For instance, the variance in average percentage between the axial liquid velocity profiles at axial heights of 60 and 90 cm is 10% under the superficial gas velocity of 3 cm/s. This is because the radial and angular components of the liquid velocity are minimal compared to the axial component.
Figure 15 (levels 4 and 5) disclose that in a fully developed flow region (i.e., at axial heights of 60 and 90 cm), the liquid velocity is almost parabolic at the middle riser side and negative in the downcomer side for all studied gas velocities.

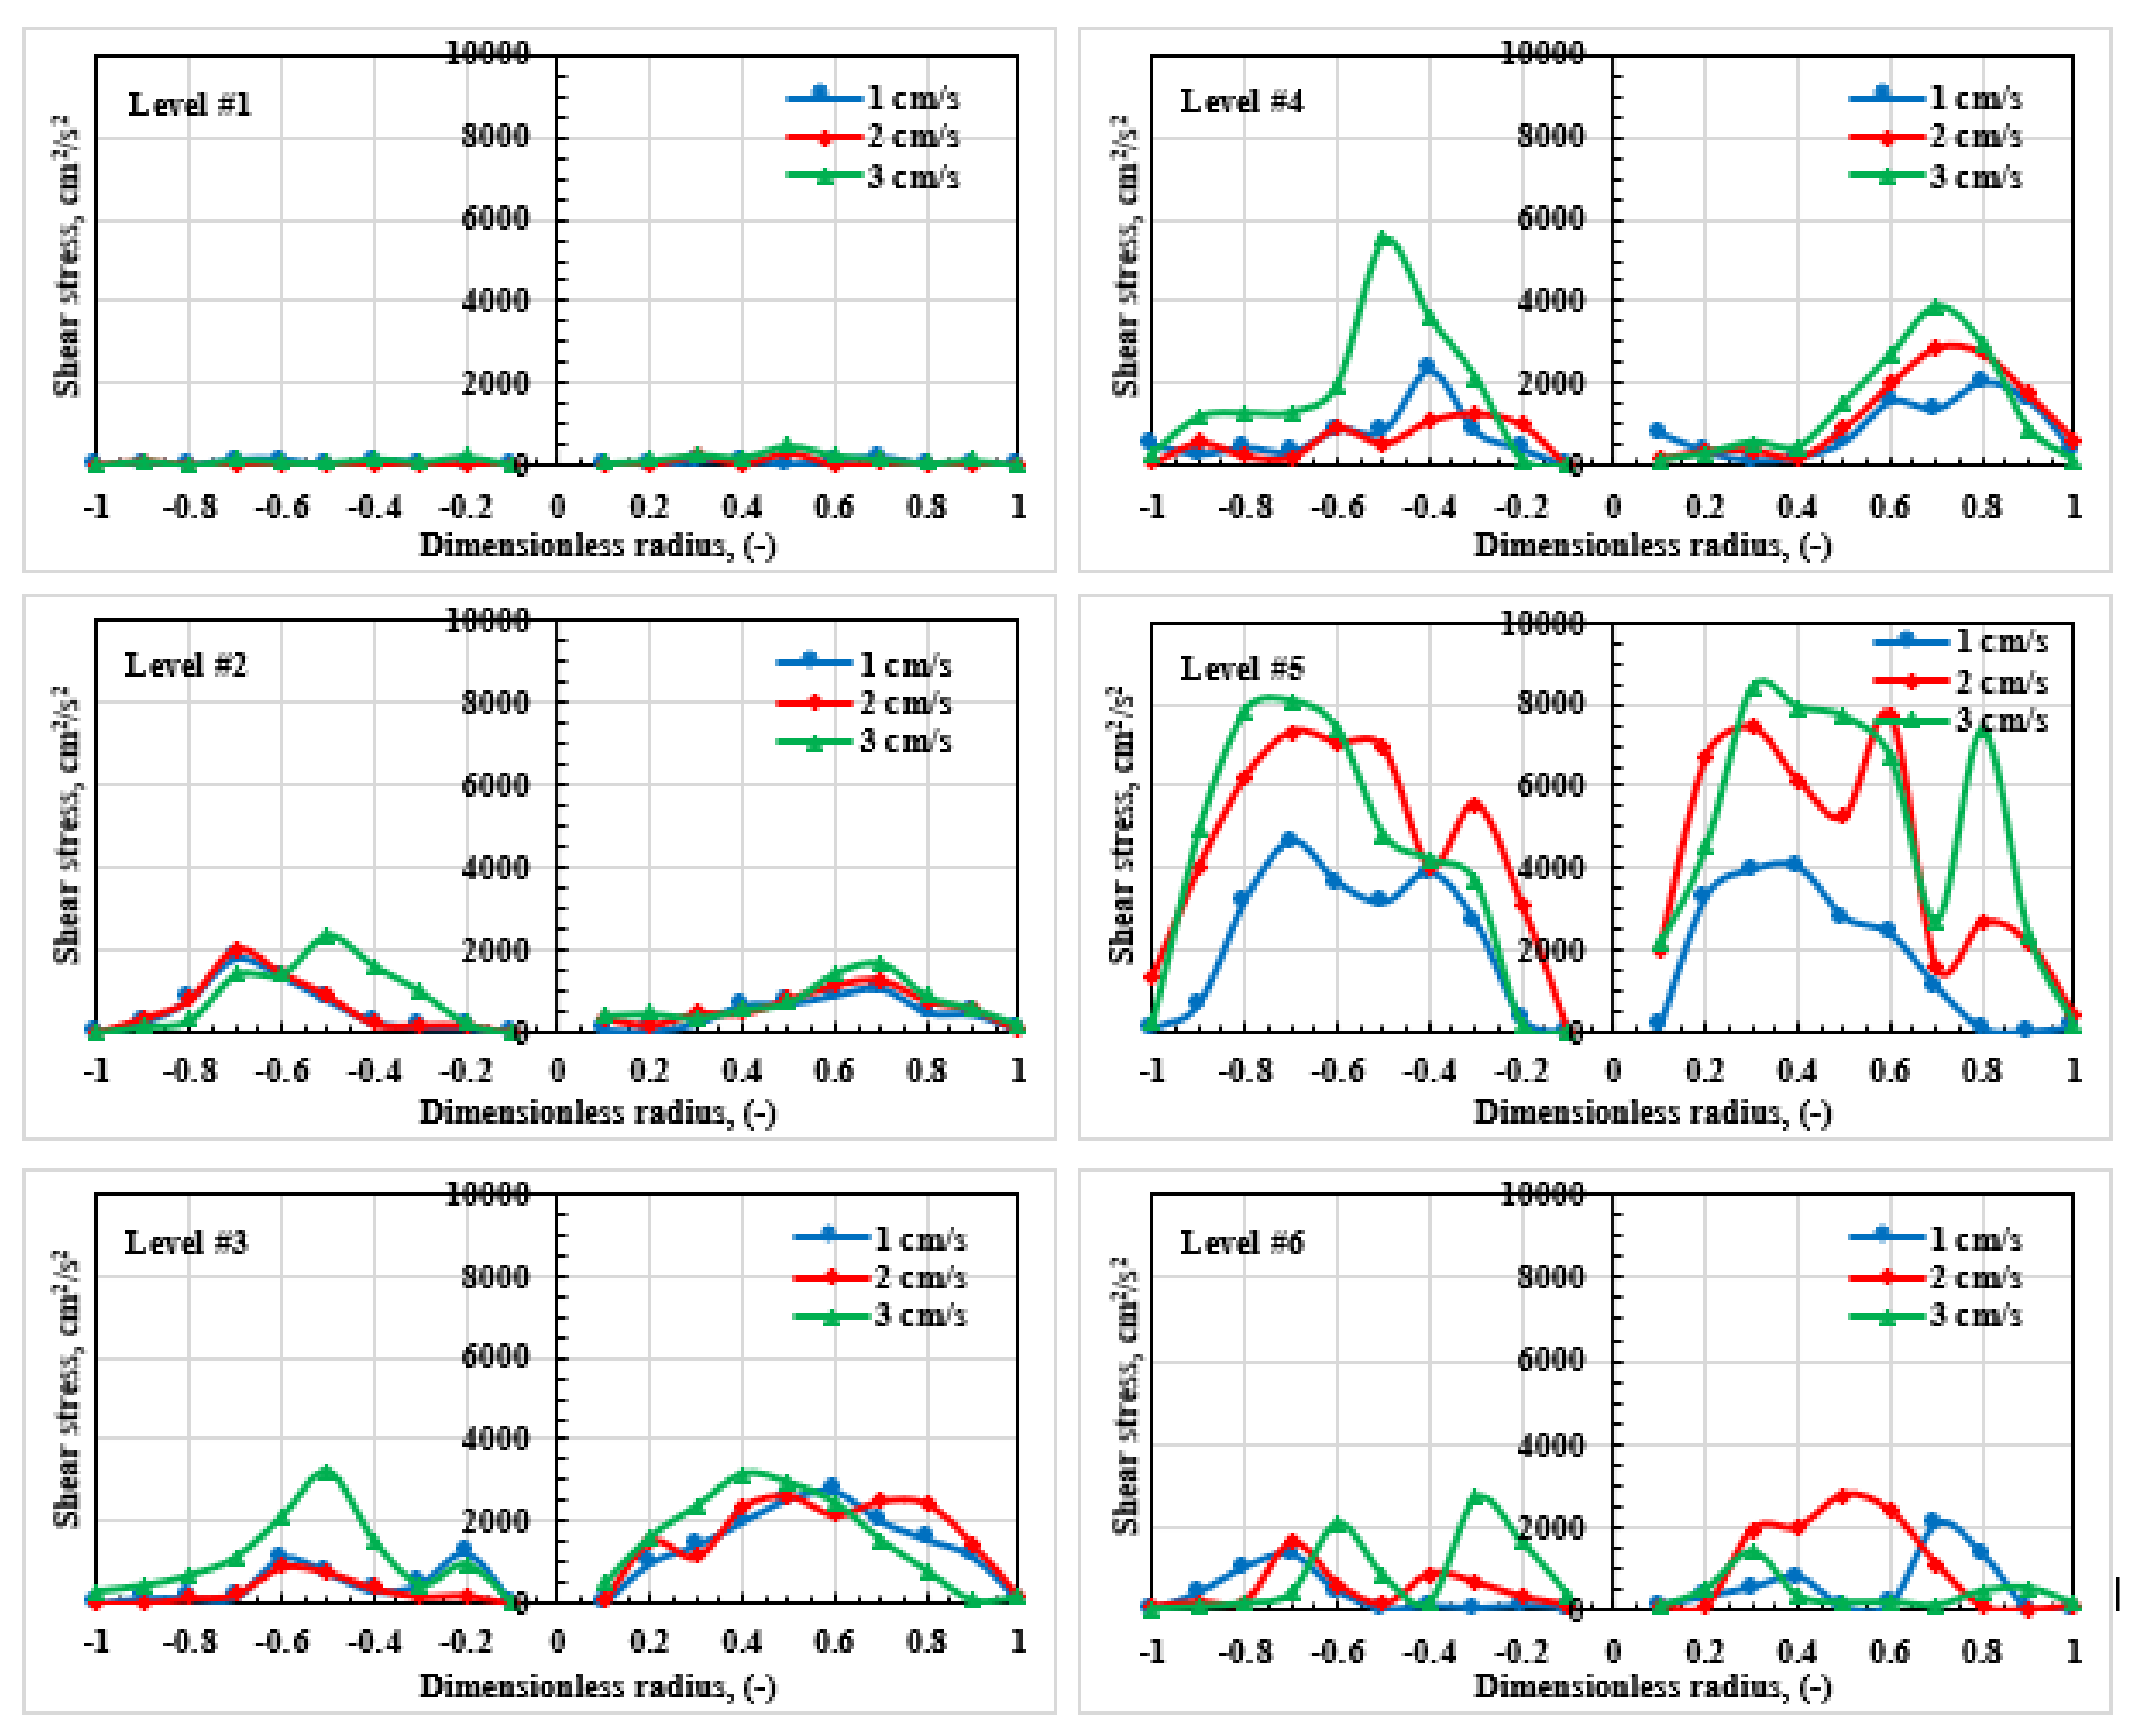
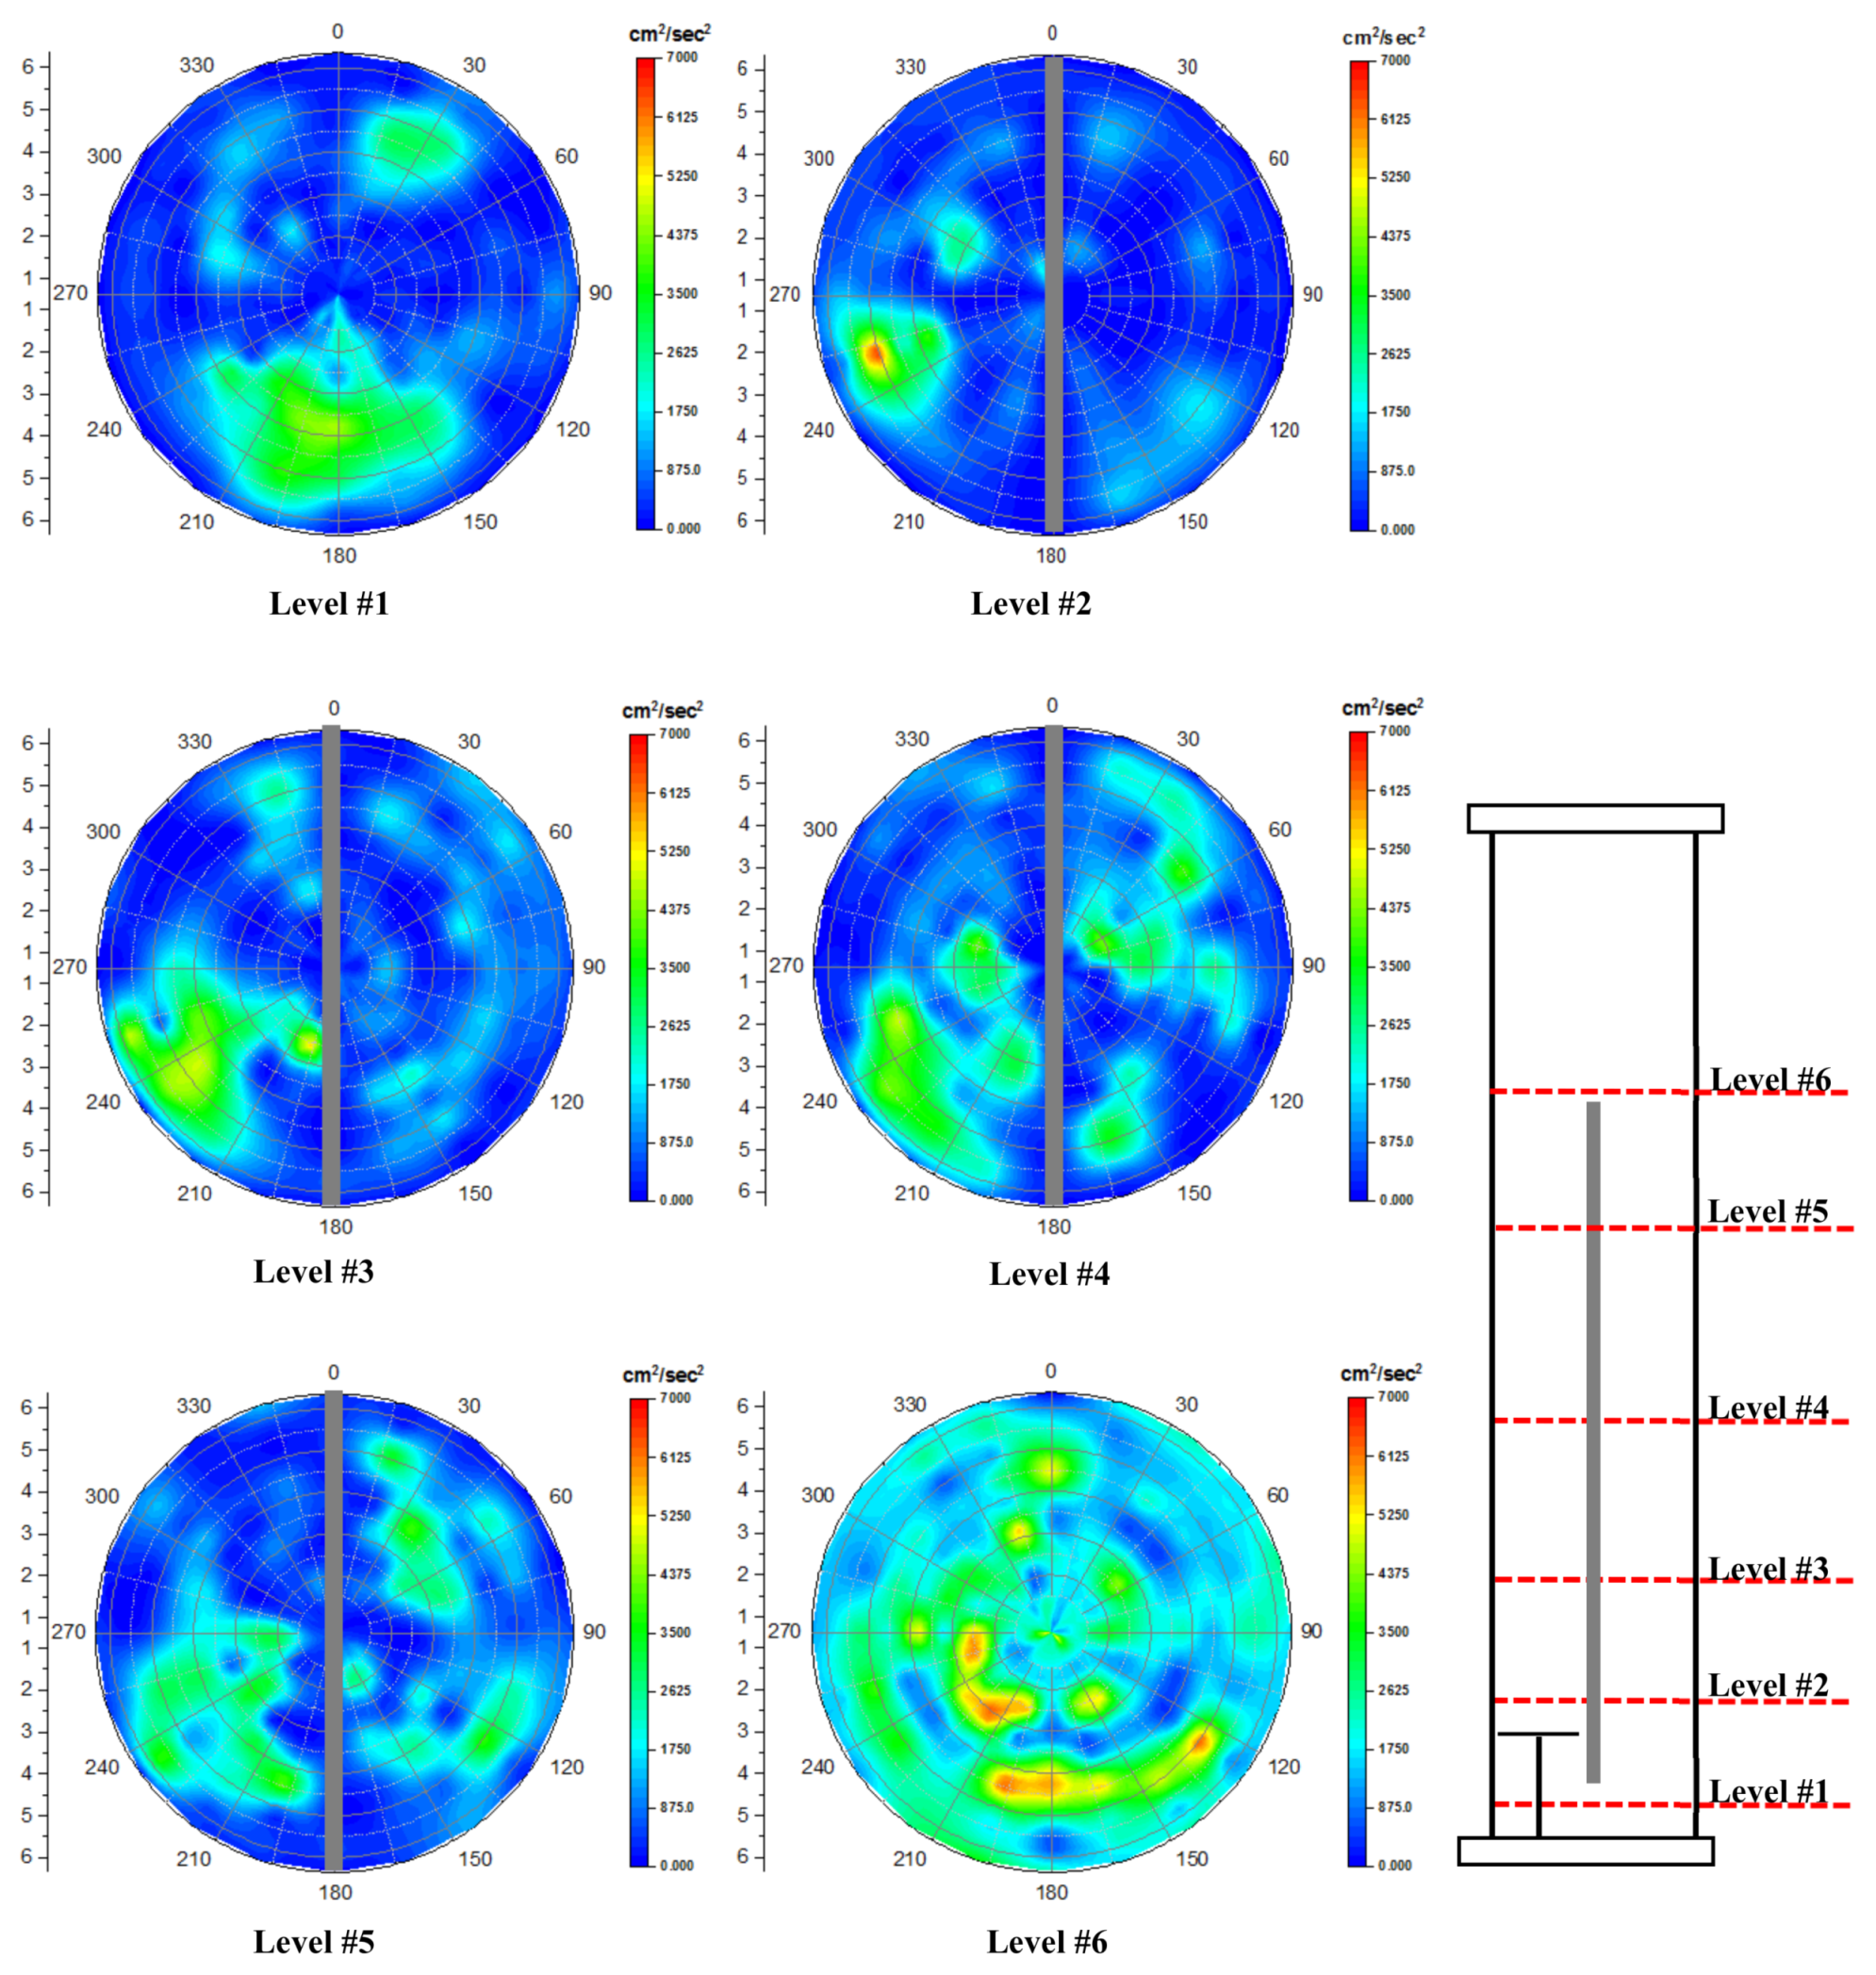
3.3. Shear Stress Distributions

The shear stress is an essential parameter for suitable split airlift reactor design and operation which can considered the quantity of the hydraulic forces in the fluid. This kind of parameter could influence the reactor performance particularly for microorganisms culturing system, because the high values of shear stress may cause damage the cells (harm the culturing cells) and minimize the rate of the growth of the microorganism’s cells that needs to be avoided [46]. Consequently, for successful and efficient split reactor performance, the details of information for shear stress distribution are required for a proper comprehension.
Figure 16, Figure 17 and Figure 18 displayed the 2D cross-sectional distribution (r-z plane) for the local shear stress, τrz, and clearly shows these distributions behave inside the split reactor. These figures illustrated the impact of the gas velocities 1, 2 and 3 cm/s on the shear stress distribution and their variations on the flow dynamics.
Figure 19 represent the radial profile of the shear stress behave at various gas velocities 1, 2 and 3 cm/s within six different level areas: at the top region z = 112 cm, middle sections of the column z = 12, 40, 60 and 90 cm, and at the lower region z = 3 cm. In Figure 19 in level #1, the behavior at the lower region (below the split plate) shows a smooth curve with a little peak close to the wall (split plate) and these profiles can matched with cross-sectional images in level 1 in Figure 16, Figure 17 and Figure 18. This is due to the short open area compared to the entire reactor, that will lead to move the liquid smoothly and quickly at this gate and will not give high distributions in shear stress.
However, observing the behavior of the curves at the other level sections of the whole column (this distance covers the split plate length), from z = 12 cm to 90 cm, Figure 19 levels 2, 3, 4 and 5 all show two peaks in the center of the distance between the wall of the column with the split plate in both sides. The curve magnitude started from the left riser side at lowest point and then increase gradually to reach the highest point at center and then decline gradually as well to reach the lowest values at the split plate. These phenomena can watch it in the downcomer side as well. these results show obvious gap between the curves because the variations in gas velocity.
Comparatively, high gas velocity cause high distributions in shear stress and that could clearly observed from the cross-sectional images in all levels in Figure 16, Figure 17 and Figure 18 the green and blue colors represent the distribution map for the shear stresses, in some cases could see some point has yellow and red color specially in level 2 above the sparger section and also at the upper zone (above the split plate), due to high share stress magnitude in these positions that causes by high mixing behavior. On the contrary, at the upper region, the curves show various phenomena as shown in Figure 19 level 6. the distribution in shear stress profiles in this region represent non-uniform behavior which shows many peaks in different points because of the harsh action of the liquid with high mixing behave in this section especially with high gas velocity.
These outcomes in terms of distribution in shear stress profiles in riser side are match with Luo [46] work. However, in the downcomer side, the profiles of the shear stress had lesser curved lines than the shear stress profiles of Luo’s study because the small space the downcomer side in the airlift (draft tube) compared with the cylindrical split reactor. Additionally, this difference is because the Luo’s results were displayed in azimuthally average profiles through the whole column in cross-section manner. however, in this study the flow dynamics results were averaged azimuthally for each side individually. the other components of the Reynolds stresses (i.e., rtt, rrt, and rtz) are not represented, due to low magnitudes. these results will help to improve the split column performance particular with microorganisms culturing application which need more details about such crucial information. This finding, for this kind of system (culturing process), in a split reactor arrangement established that these gas velocities are appropriate for microorganism’s process. These outcomes are consistent with the open literature [47].

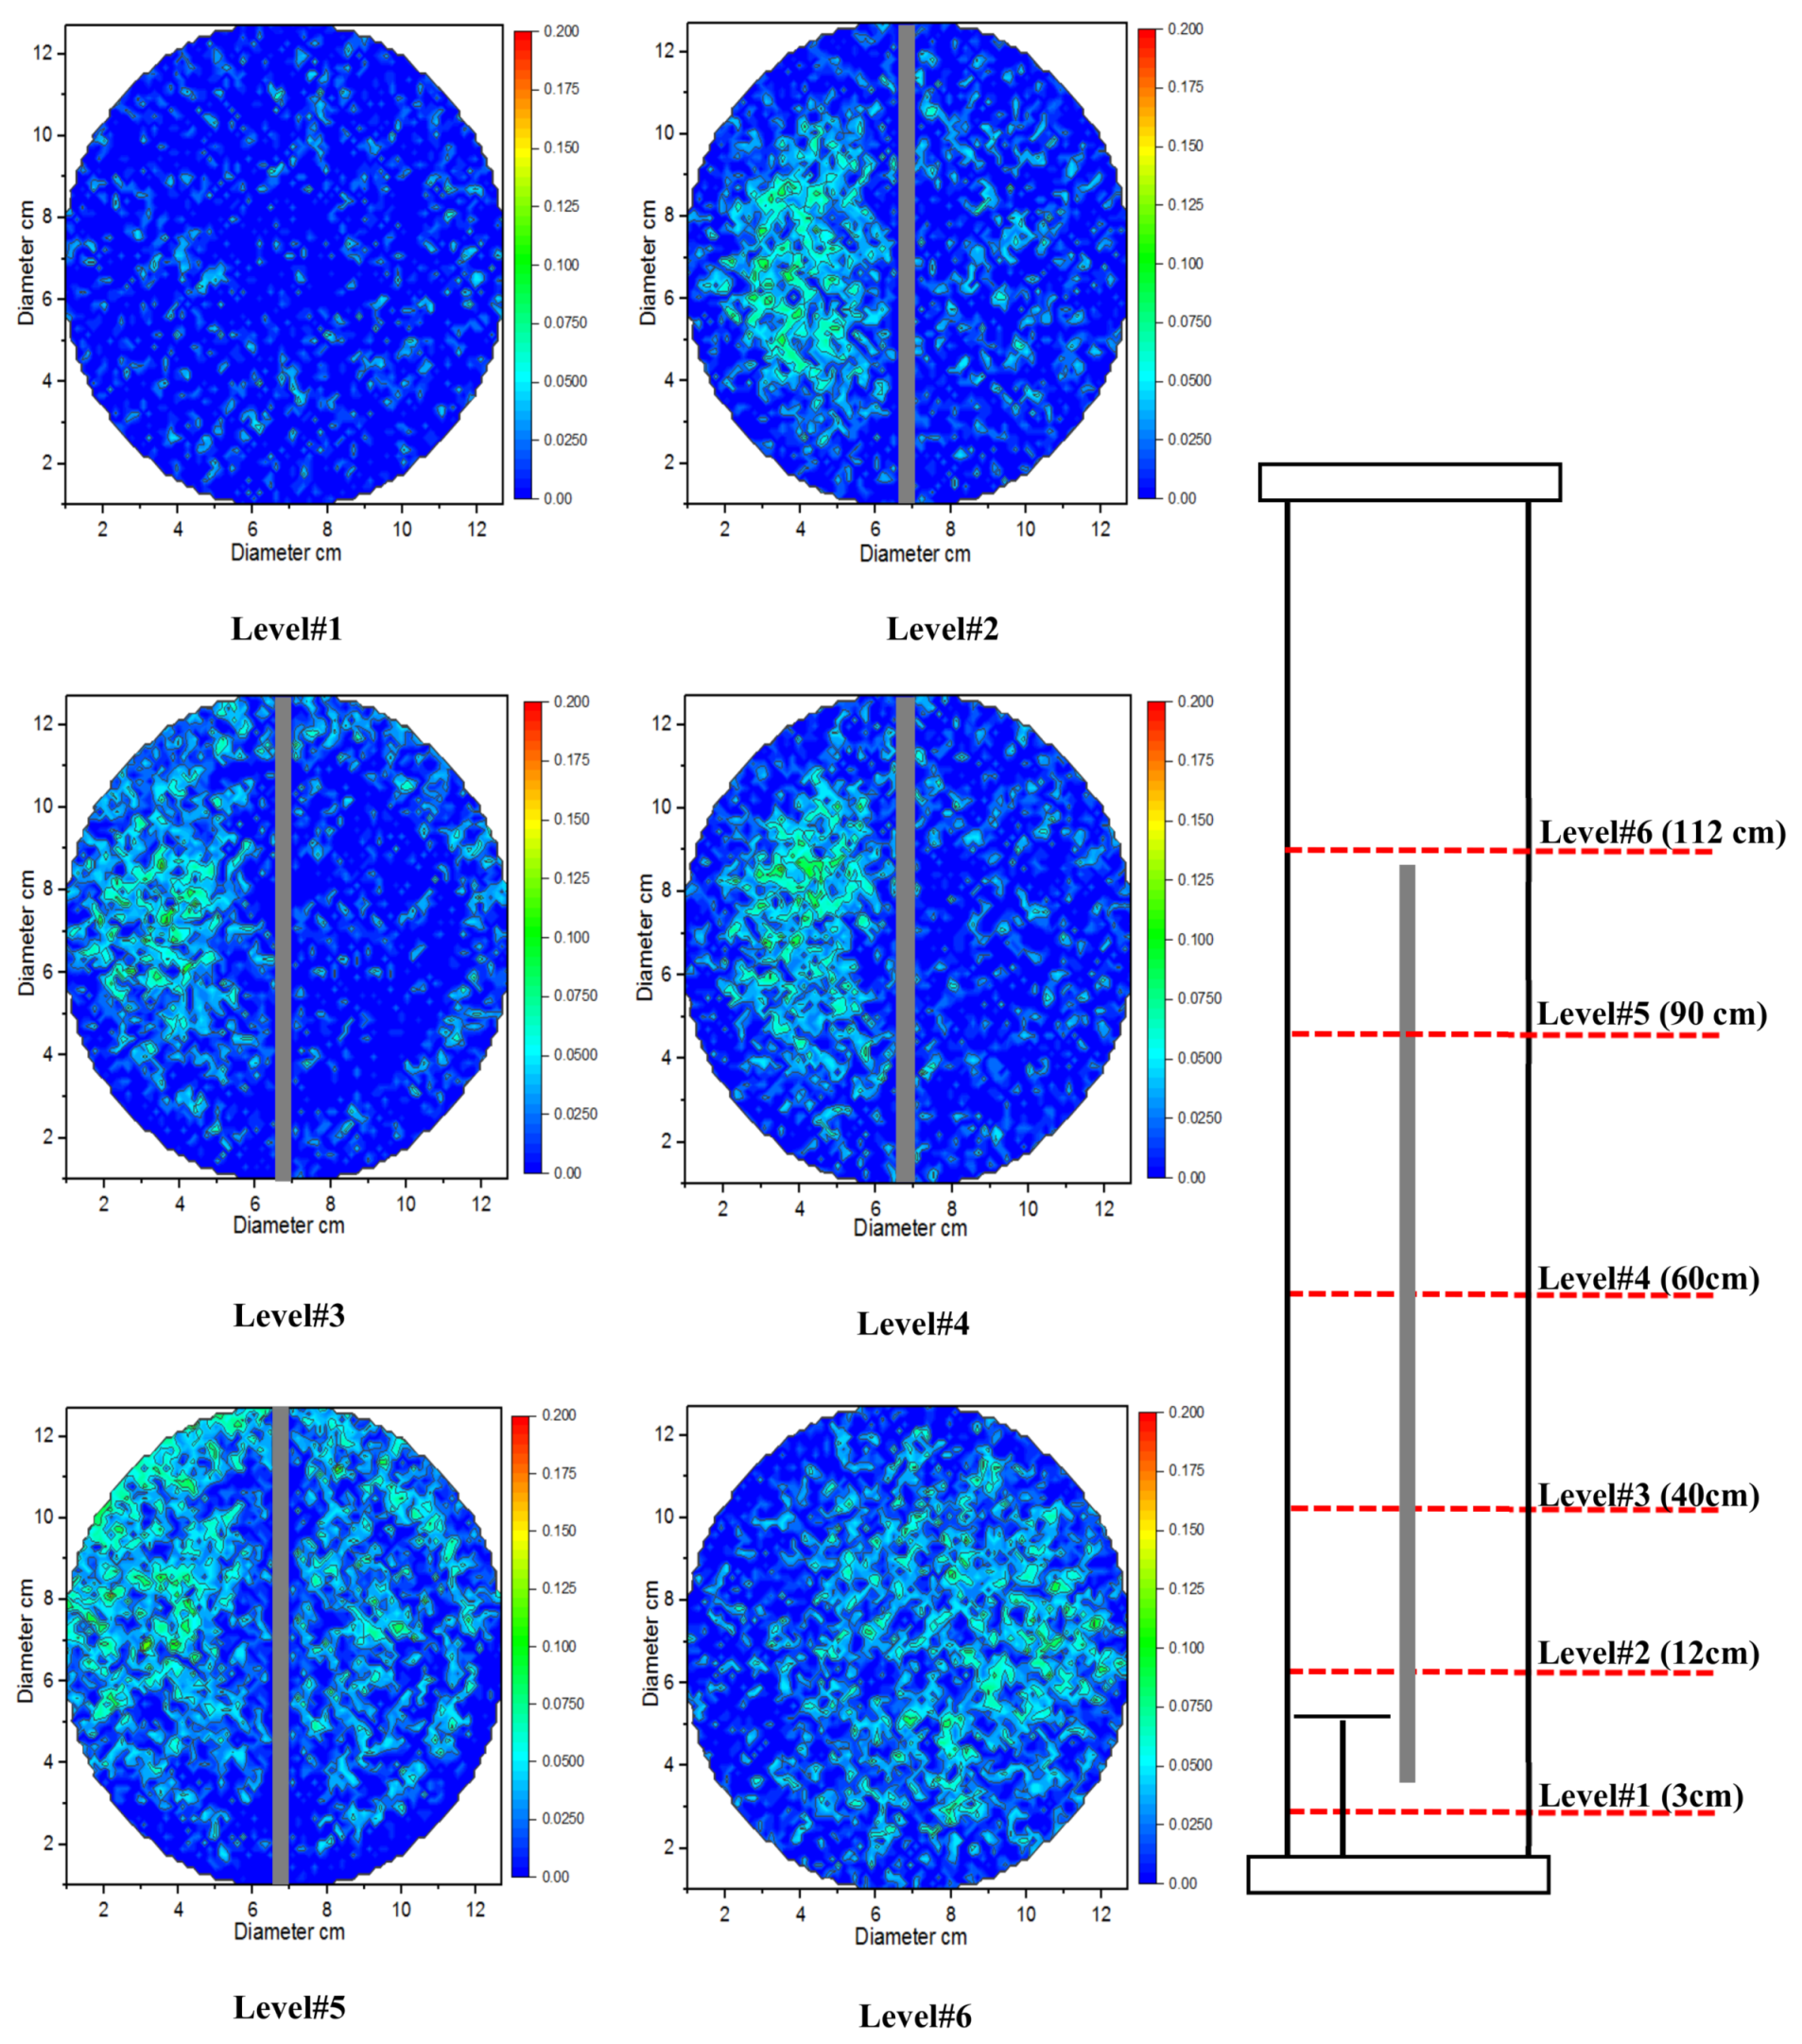
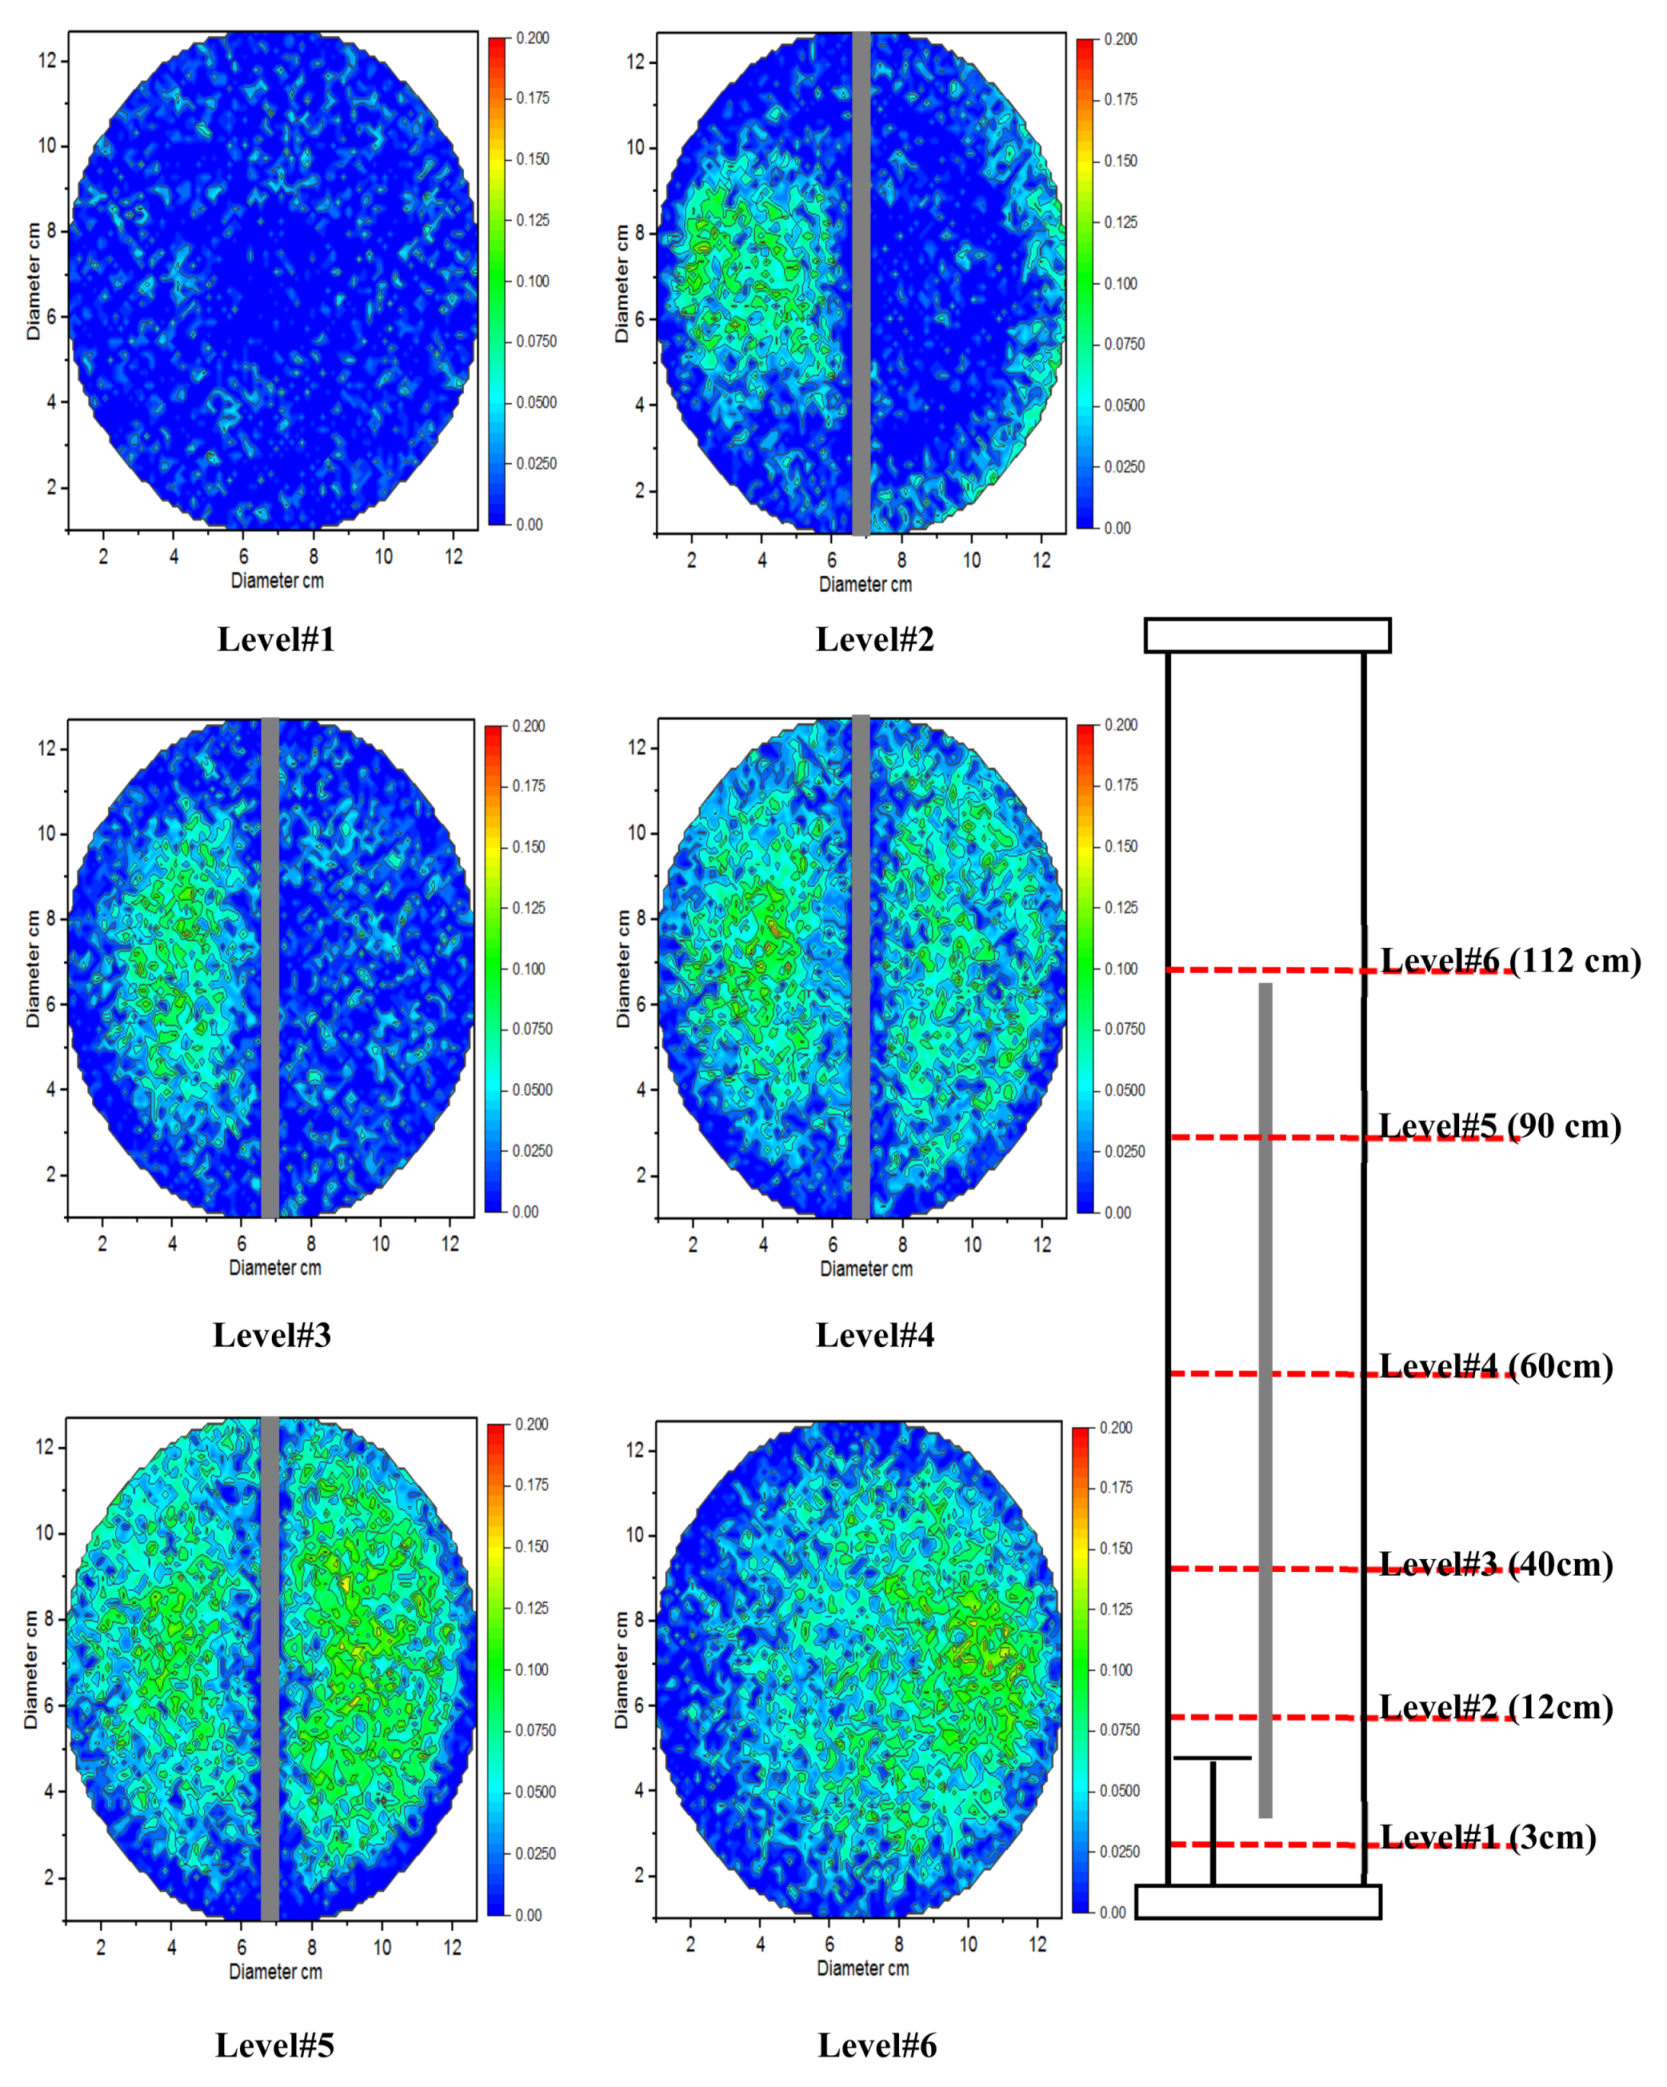
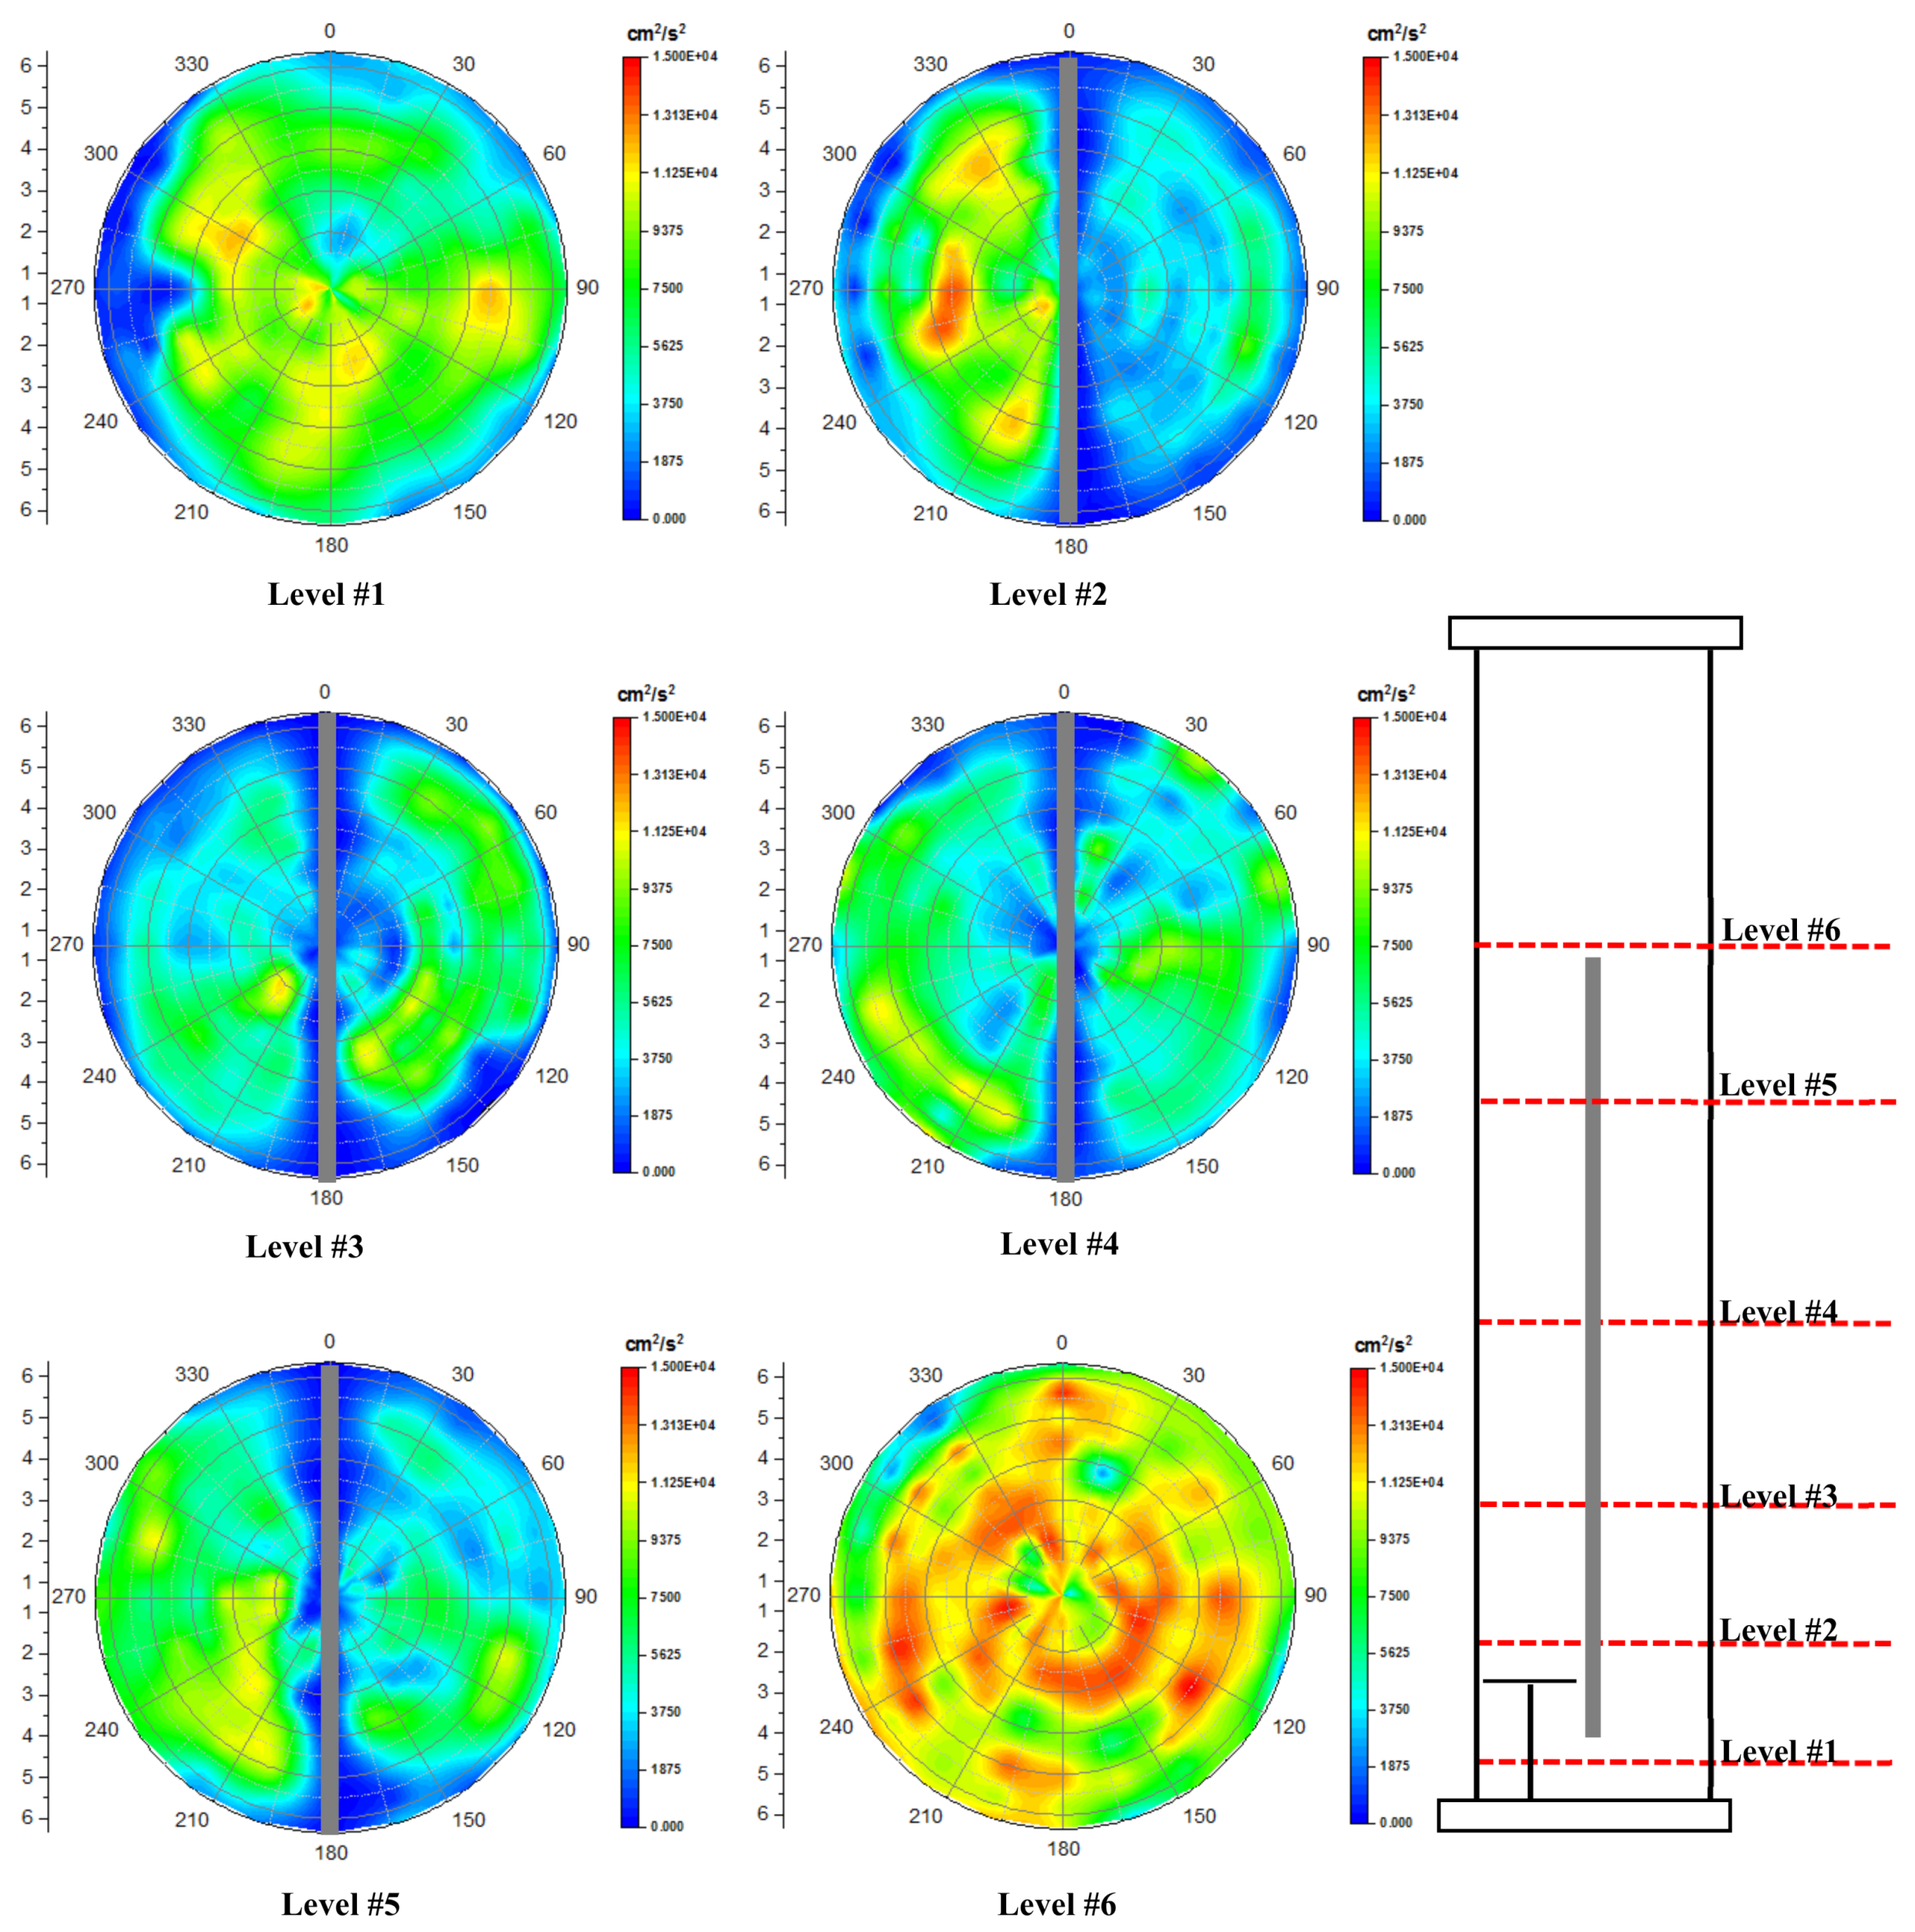
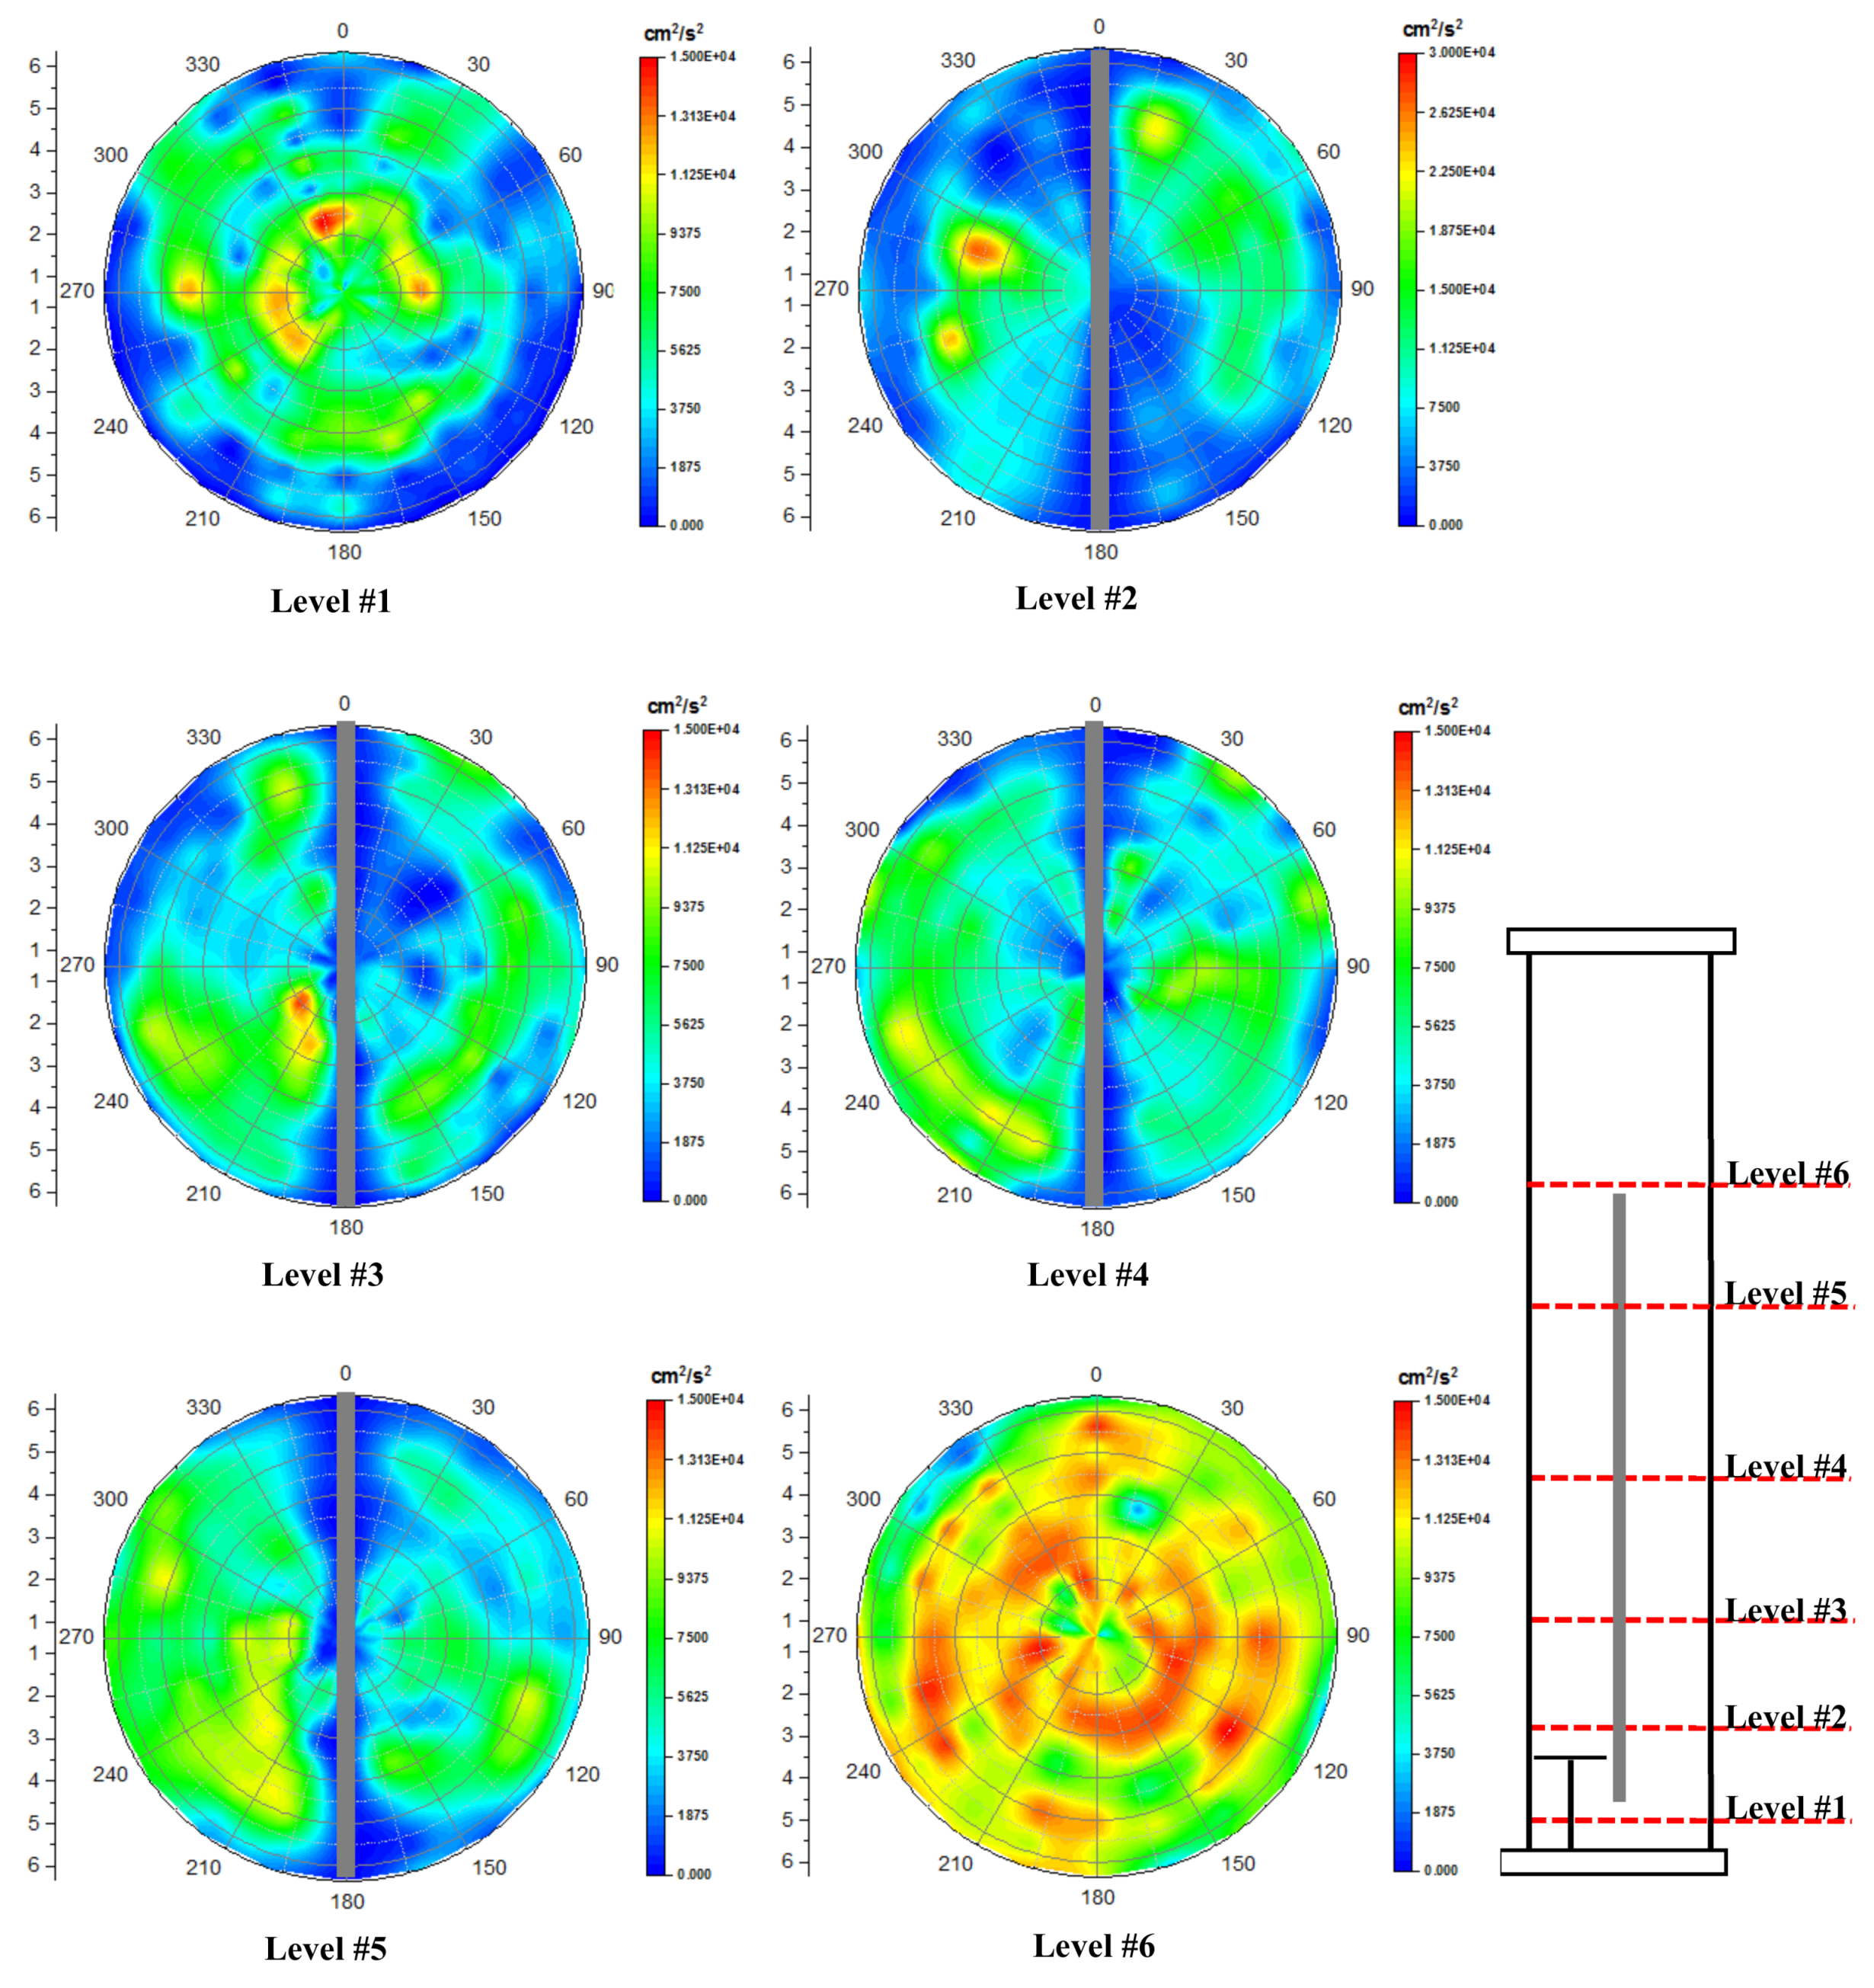
3.4. Turbulent Kinetic Energy Distributions and Their Diametrical Profiles

The behavior of the liquid mixing such as the rate of heat and mass transfer is directly affected by the turbulence kinetic energy, thus, a proper understanding of this phenomenon in the cylindrical split airlift reactor is always important for an efficient performance and its flow dynamic modeling (simulation) [48,49,50]. Figure 20, Figure 21 and Figure 22 display the local turbulent kinetic energy in 2D cross-sectional distributions area on the r-z plane with various gas velocities of 1, 2 and 3 cm/s. These Figures represents a clear difference in distribution of the turbulent energies that increase with increasing in gas velocity.
Additionally, these figures illustrated the distribution in turbulent energies in all split reactor sections, riser side, downcomer side, upper and lower the split plate, by shows a different color: blue, green, yellow and red with their gradually that represent different levels of the energy’s magnitudes. Moreover, at the sparger section (above the top surface of the sparger) the turbulence behavior is distributed widely and will displayed the movements and the interactions of the liquid in the riser side. And, at the top section (upper the split plate), we are able to see the mixing behavior of the liquid and we can recognize in the downcomer region that the magnitude values will reduce gradually due to a reduction in the driving forces. This outcome is sensible because they match the map of the liquid velocity.
As the results shown that the regions which have a large energy dissipation due to high turbulent energies, that in turn the influence the fluid flow and hydraulic resistance. Therefore, in upper plate and lower plate regions, the turbulent energies are considerable for the projections of the liquid flow field. Figure 23 demonstrates the turbulent kinetic energy magnitude in radial profiles form with various gas velocities 1, 2 and 3 cm/s. Interestingly, the level #1 in Figure 23 display the turbulence energies under the split plate which start from the left side of the column wall at lower values and increase gradually to give many peaks through this section. And this indicates a big inconstancy in the lowest part of the reactor column as a result of a significant energy dissipation due to high magnitude in turbulent kinetic energies in this section, that in turn influence the liquid flow circulation and the hydraulic resistance.
On the other hand, Figure 23 in levels #2, #3, #4 and #5 illustrates the turbulent kinetic energy behavior in radial profiles form at different sections through the length of the split plate of the reactor column. the energy magnitude in all these levels shows a lowest value at the column wall as well as the wall of the split plate and gradual increase with a peak at the midpoint of the riser side, and the same behavior was recognized at the center of the downcomer side but with less magnitude. Remarkably, Figure 23 in Level #6 display performance of the radial profiles for turbulent kinetic energy’s in upper column sections. In this zone, over the column diameter, the curves performance has the same behavior as in the middle sections and decrease at the right wall side with a big convexity upper the plate. the results show a huge dissipation in energy due to high turbulence energies values.
Furthermore, as level #1 indicates in Figure 20, Figure 21, Figure 22 and Figure 23 at the lower section of the column, the magnitude of turbulent kinetic energy has high fluctuations behaviors. regarding to Luo and Al-Dahhan [45] study, the results shows that the circulation of the liquid velocity reduced when they minimize the lower distance (the distance between the base of the reactor column and the plate end). therefore, their work illustrated that the distance in this section is significantly influence the dissipation in energy at this zone, which match with our outcomes. Hence, the turbulent kinetic energies at the top and bottom regions of the column are essential for the movement of the liquid circulation [45,46]. Finally, the magnitudes of the turbulent kinetic energies with gas velocity 3 cm/s are greater than in 2 and 1 cm/s particular in the riser side, except in the downcomer side under the split plate near to the wall of the reactor column; this consequence from a huge liquid circulation movement resistance, which is harmonic with the outcomes of Luo [46].

4. Remarks

In this investigation, the local hydrodynamics information and details for multiphase flow system (gas–liquid) were studied in a split reactor (cylindrical column) by utilizing state-of-the-art noninvasive computed tomography (CT) and radioactive particle tracking (RPT) facilities. The aims of this work were achieved by doing a different experiment with various parameters.
The local distribution of turbulent kinetics energy, shear stress, liquid velocity field and gas-holdup were represented in 2D cross-sectional pattern with their radial profiles in three different gas velocity with six height levels of the reactor column were focused and discussed. All this information will provide a comprehensive understanding needed for reaching an optimal design and efficient performance. Furthermore, the rich results that presented in this work gives a benchmark and reliable database to improve the knowledge of such system with validate the CFD simulation.
The outcomes of this work can be summarized briefly as follows:
  • A sophisticated gamma-ray technique CT and RPT were employed to find out the gas–liquid movements and behaviors in such split reactor.
  • The distribution of local gas holdup was visualized in 2D Cross-sectional pattern in r-theta scales and its radial profiles was projected in r-z scales. The results represent an explicit variation in magnitude of local distributions in gas holdup with increasing in gas velocity that starting with 1, 2 until reach to 3 cm/s. High performance was shown at 3 cm/s related to big phase spreading in all zones inside the split airlift reactor.
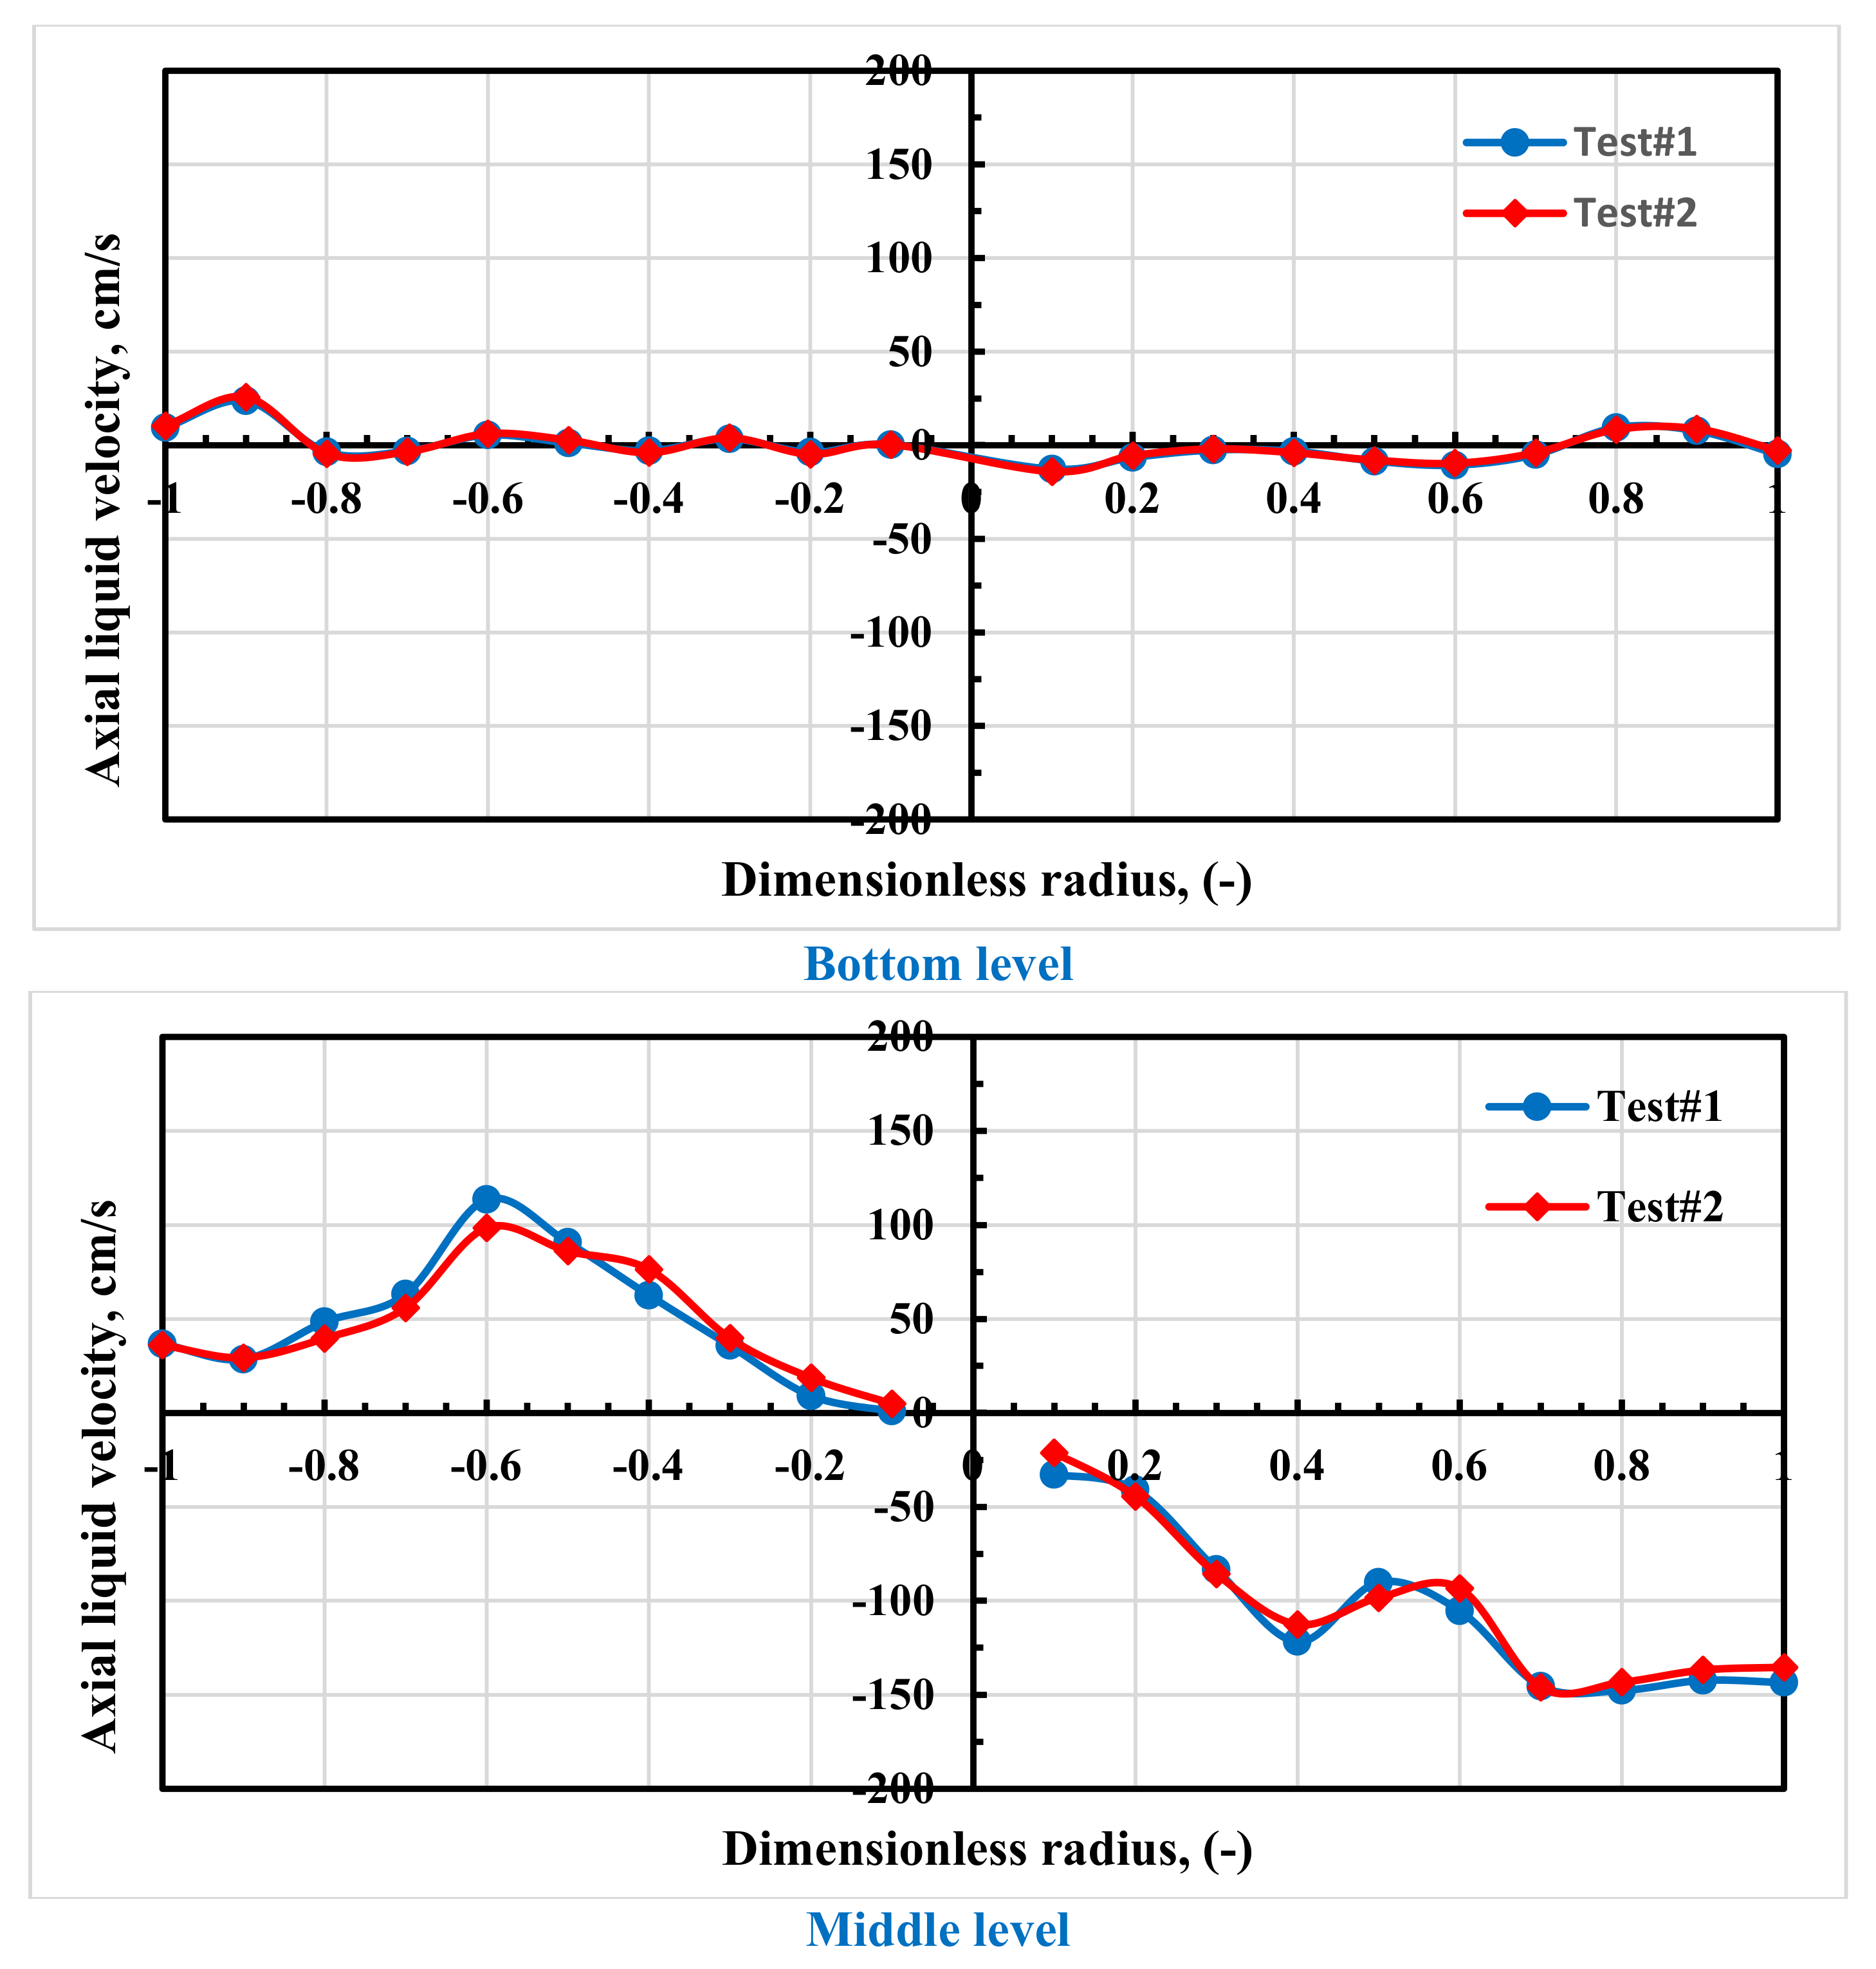
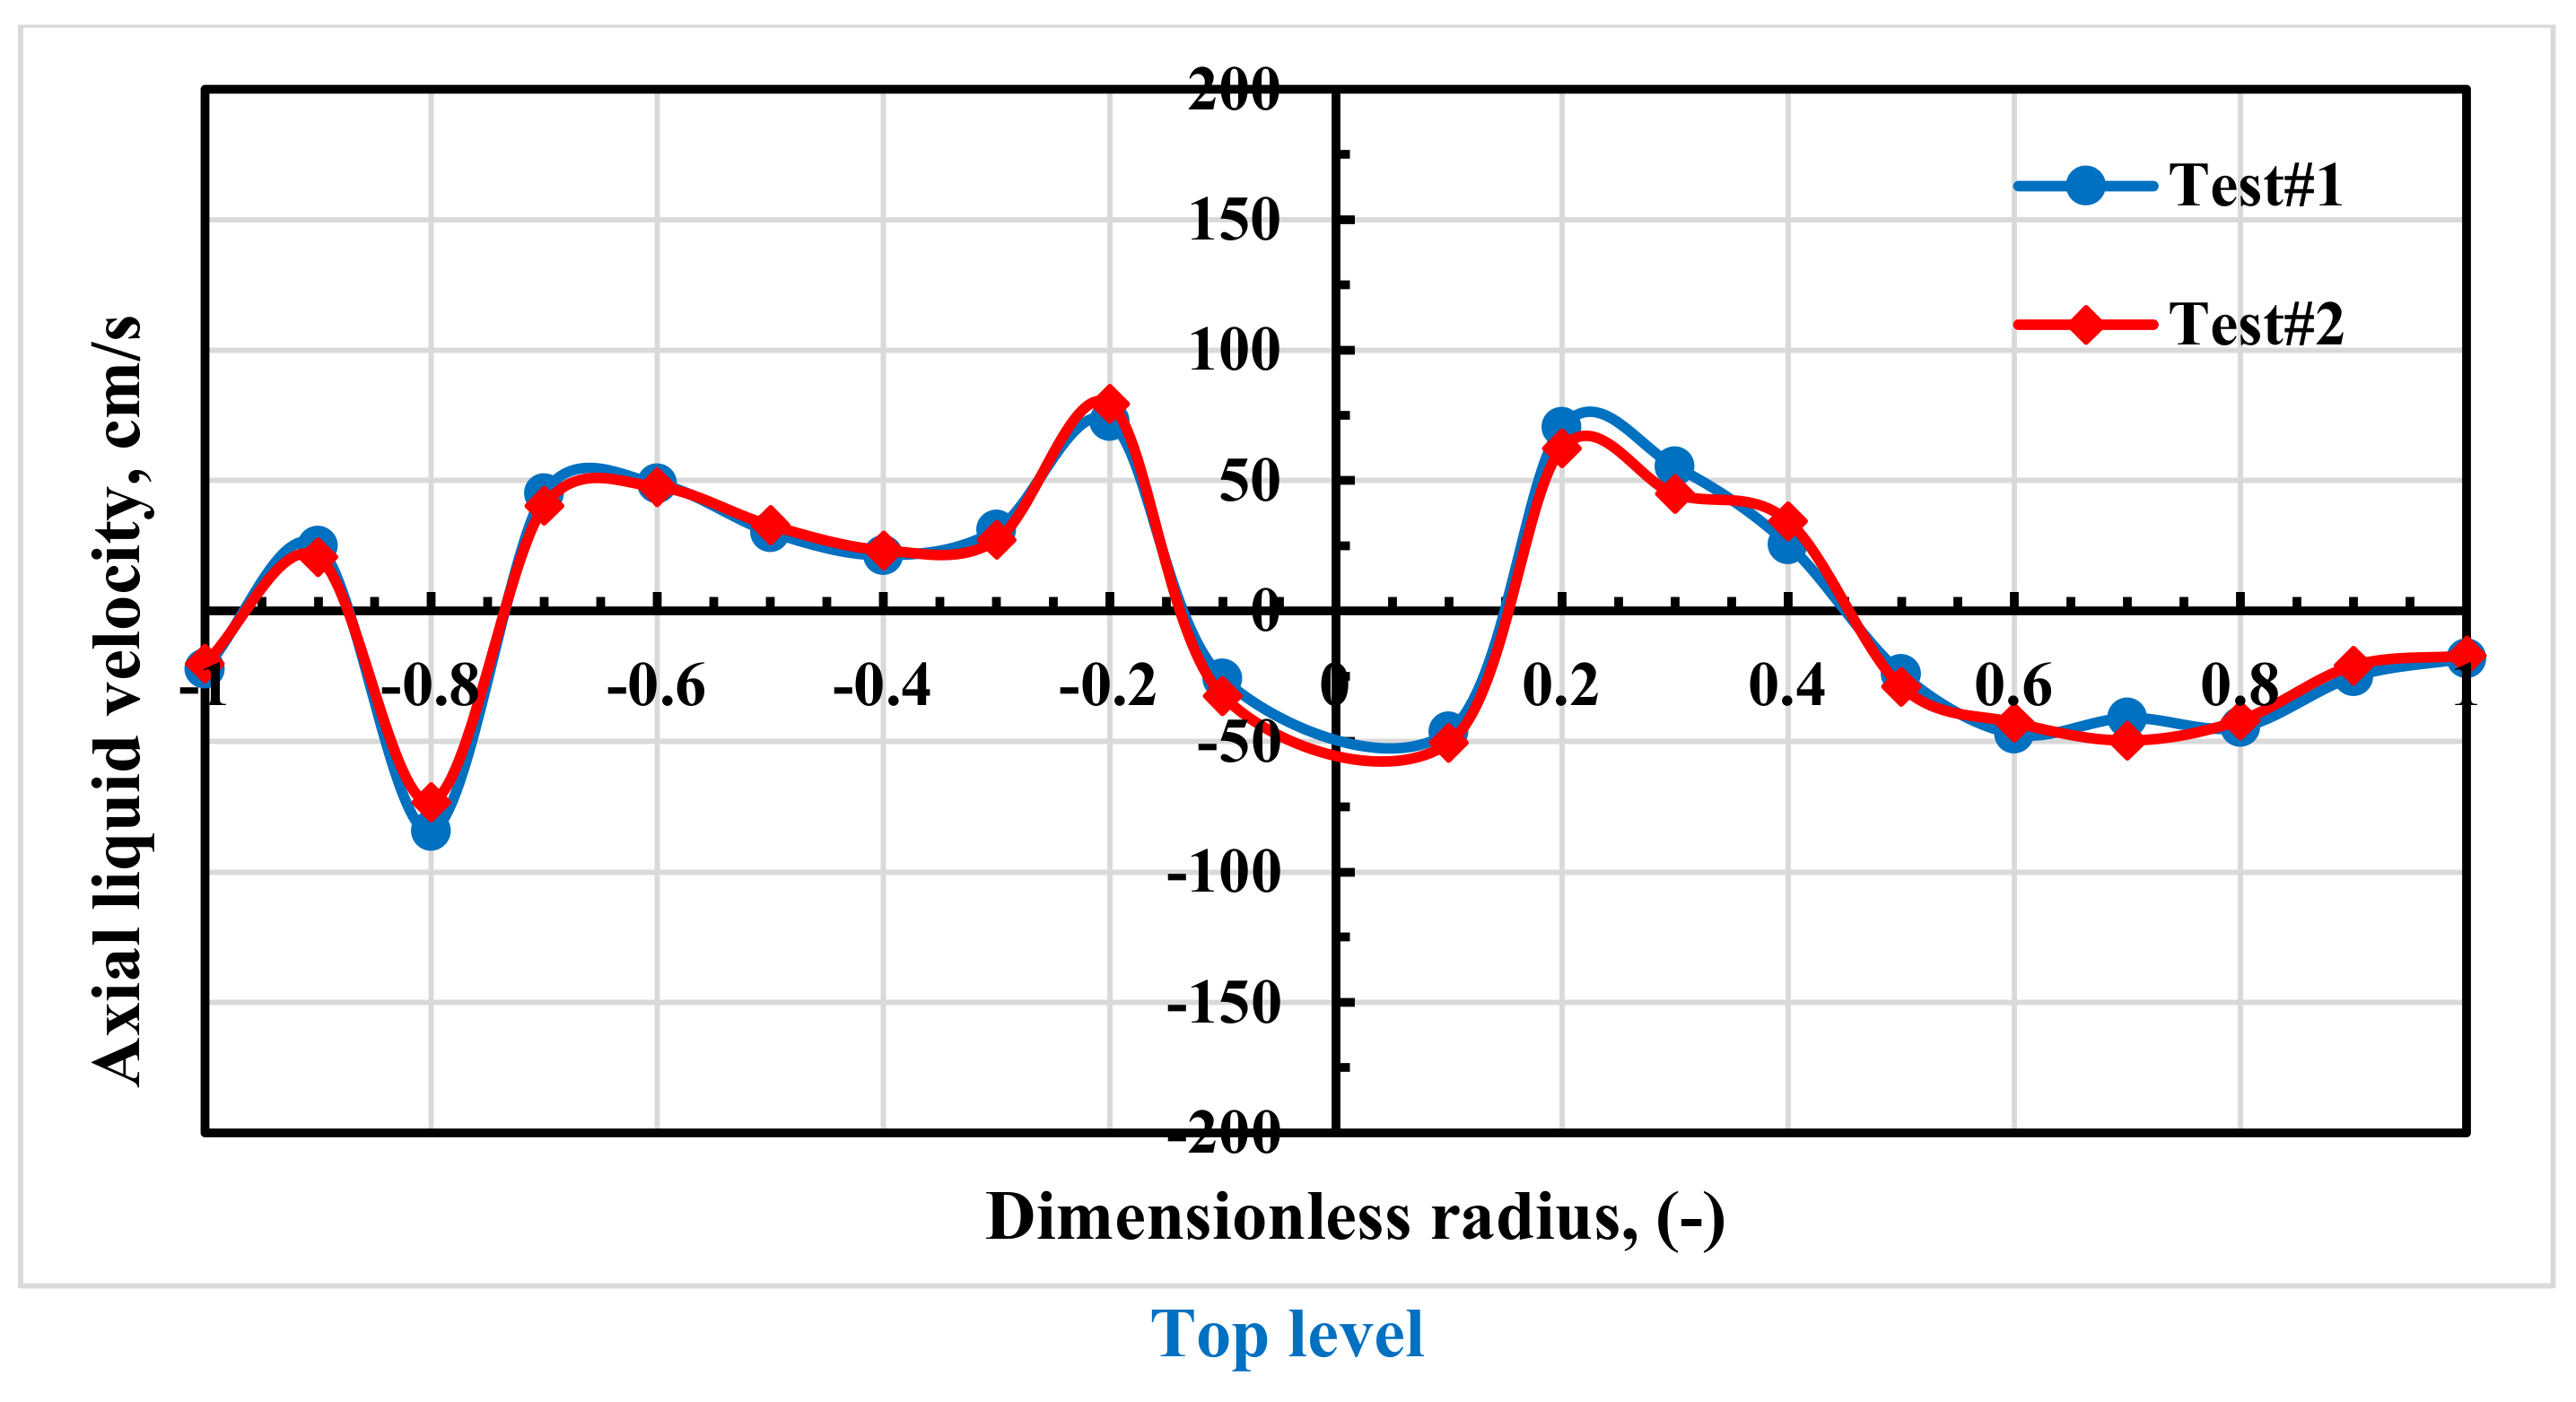
  • 2D cross-sectional distribution of the fields of local distributions in liquid velocity were mapped in r-theta planes and its axial delineation were figured in r-z scales. The outcomes represent an obvious difference in magnitude of the liquid velocity distribution with increasing in gas velocity started from 1, 2 to reach 3 cm/s. The performance of split reactor is in high mode at 3 cm/s in terms of a large gas–liquid phases distributions in all zones.
  • The local shear stress distribution was raised up with the increasing of gas velocity which is visually noticeable in the 2D cross-sectional pattern which shown the results in r-theta plane and its radial profile in r-z planes. Some differences in magnitude of the shear stress were observed in the sparger location, upper and lower the split plate which a slightly higher than in differ positions inner the split column. Additionally, the shear stress values at 3 cm/s (higher gas velocity) in the downcomer section were lower than in the riser section.
  • The 2D cross-sectional distribution of local turbulence kinetic energy were clearly showing a distinguishing behavior at gas velocity 3 cm/s with a higher magnitude than at 1, 2 cm/s. Additionally, in the upper and lower zones includes the riser side, the turbulence kinetic energy behaviors show a significant high strength, as clearly shown visually and in radial profiles.
  • The flow structure in this internal-loop reactor column affected significantly by inserting the split plate which divided the column in to different four regions, riser, downcomer, top and bottom section. This plate gives a good circulation behavior and movements for gas and liquid in all column regions which has a satisfactory effect on in the cylinder column particularly with its microorganism culturing applications in terms of sensible shear stresses, good distribution for turbulence kinetic energy, and liquid velocity, gas velocity of 3 cm/s.

Supplementary Materials

The following supporting information can be downloaded at: https://www.mdpi.com/article/10.3390/chemengineering6010018/s1.

Author Contributions

Conceptualization, L.S.S., A.J.S. and M.H.A.-D.; methodology, L.S.S., A.J.S.; software, L.S.S., A.J.S. and S.K.J.; validation, L.S.S., A.J.S. and S.K.J.; formal analysis, L.S.S., A.J.S.; investigation, L.S.S., A.J.S.; resources, L.S.S., A.J.S.; data curation, L.S.S., A.J.S. and S.K.J.; writing—original draft preparation, L.S.S. and A.J.S.; writing—review and editing, L.S.S. and A.J.S.; visualization, L.S.S., S.K.J. and A.J.S.; supervision, M.H.A.-D.; project administration, L.S.S. and A.J.S.; funding acquisition, H.S.M. All authors have read and agreed to the published version of the manuscript.

Funding

The funds provided by Missouri University of Science and Technology and Al-Mustaqbal University College.

Acknowledgments

The authors would like to acknowledge the financial aid provided by the Iraqi government, Ministry of Higher Education Iraq, the Higher Committee for Education Development in Iraq (HCED). We would also like to thank Al-Dahhan, who developed the (CT) and (RPT) techniques, for help with setting up and conducting the experiments.

Conflicts of Interest

The authors declare no conflict of interest.

References

  1. Stanbury, P.F.; Whitaker, A.; Hall, S.J. Principles of Fermentation Technology, 3rd ed.; Elsevier: Amsterdam, The Netherlands, 2016. [Google Scholar] [CrossRef]
  2. Rosa, E.A.R.; Bianchini, L.F.; Ramos, R.C.P.d.; Arantes, A.B.; da Silva, R.F.; Glassey, J. Hydrodynamics of split-rectangle-internal loop airlift bioreactor with variations in riser and downcomer cross-sectional areas based on the golden ratio. J. Chem. Technol. Biotechnol. 2019, 94, 1323–1329. [Google Scholar] [CrossRef]
  3. Esperança, M.N.; Béttega, R.; Badino, A.C. Effect of geometric design on performance of square cross-section concentric-duct and split airlift bioreactors. Can. J. Chem. Eng. 2017, 95, 2324–2332. [Google Scholar] [CrossRef]
  4. Luo, H.P.; Al-Dahhan, M.H. Macro-mixing in a draft-tube airlift bioreactor. Chem. Eng. Sci. 2008, 63, 1572–1585. [Google Scholar] [CrossRef]
  5. Sabri, L.S.; Sultan, A.J.; Al-Dahhan, M.H. Mapping of microalgae culturing via radioactive particle tracking. Chem. Eng. Sci. 2018, 192, 739–758. [Google Scholar] [CrossRef]
  6. Fernandes, B.D.; Mota, A.; Ferreira, A.; Dragone, G.; Teixeira, J.A.; Vicente, A.A. Characterization of split cylinder airlift photobioreactors for efficient microalgae cultivation. Chem. Eng. Sci. 2014, 117, 445–454. [Google Scholar] [CrossRef] [Green Version]
  7. Zhang, T.; We, C.; Ren, Y.; Feng, C.; Wu, H. Advances in airlift reactors: Modified design and optimization of operation conditions. Rev. Chem. Eng. 2017, 33, 163–182. [Google Scholar] [CrossRef]
  8. Ojha, A.; Al-Dahhan, M. Local gas holdup and bubble dynamics investigation during microalgae culturing in a split airlift photobioreactor. Chem. Eng. Sci. 2018, 175, 185–198. [Google Scholar] [CrossRef]
  9. Sabri, L.S.; Sultan, A.J.; Al-Dahhan, M.H. Investigating the cross-sectional gas holdup distribution in a split internal-loop photobioreactor during microalgae culturing using a sophisticated computed tomography (CT) technique. Chem. Eng. Res. Des. 2019, 149, 13–33. [Google Scholar] [CrossRef]
  10. Wu, J.; Feng, P. Hydrodynamics and oxygen transfer in airlift-loop bioreactor with the internals. In Experimental Heat Transfer, Fluid Mechanics, and Thermodynamics; Elsevier: Amsterdam, The Netherlands, 1993; pp. 1713–1719. [Google Scholar]
  11. Delattre, C.; Pierre, G.; Laroche, C.; Michaud, P. Production, extraction and characterization of microalgal and cyanobacterial exopolysaccharides. Biotechnol. Adv. 2016, 34, 1159–1179. [Google Scholar] [CrossRef]
  12. Solimeno, A.; Gabriel, F.; García, J. Mechanistic model for design, analysis, operation and control of microalgae cultures: Calibration and application to tubular photobioreactors. Algal Res. 2017, 21, 236–246. [Google Scholar] [CrossRef] [Green Version]
  13. Luo, H.P.; Al-Dahhan, M.H. Airlift column photobioreactors for Porphyridium sp. culturing: Part I. effects of hydrodynamics and reactor geometry. Biotechnol. Bioeng. 2012, 109, 932–941. [Google Scholar] [CrossRef]
  14. Pawar, S.B. Computational fluid dynamics (CFD) analysis of airlift bioreactor: Effect of draft tube configurations on hydrodynamics, cell suspension, and shear rate. Bioprocess Biosyst. Eng. 2018, 41, 31–45. [Google Scholar] [CrossRef]
  15. Sabri, L.S. Characterization of the Cylindrical Split Internal-Loop Photobioreactor with Scenedesmus Microalgae: Advanced Culturing, Modeling, and Hydrodynamics; Missouri University of Science and Technology. 2018. Available online: http://scholarsmine.mst.edu/cgi/viewcontent.cgi?article=3733&context=doctoral_dissertations (accessed on 11 December 2021).
  16. Ziegenhein, T.; Zalucky, J.; Rzehak, R.; Lucas, D. On the hydrodynamics of airlift reactors, Part I: Experiments. Chem. Eng. Sci. 2016, 150, 54–65. [Google Scholar] [CrossRef]
  17. Kumar, N.; Gupta, R.; Bansal, A. Effect of Surface Tension on Hydrodynamics and Mass Transfer Coefficient in Airlift Reactors. Chem. Eng. Technol. 2020, 43, 995–1004. [Google Scholar] [CrossRef]
  18. Wadaugsorn, K.; Limtrakul, S.; Vatanatham, T.; Ramachandran, P.A. Hydrodynamic behaviors and mixing characteristics in an internal loop airlift reactor based on CFD simulation. Chem. Eng. Res. Des. 2016, 113, 125–139. [Google Scholar] [CrossRef]
  19. Han, M.; González, G.; Vauhkonen, M.; Laari, A.; Koiranen, T. Local gas distribution and mass transfer characteristics in an annulus-rising airlift reactor with non-Newtonian fluid. Chem. Eng. J. 2017, 308, 929–939. [Google Scholar] [CrossRef]
  20. Dejaloud, A.; Vahabzadeh, F.; Habibi, A. Hydrodynamics and oxygen transfer characterization in a net draft tube airlift reactor with water-in-diesel microemulsion. Fuel Process. Technol. 2018, 171, 265–276. [Google Scholar] [CrossRef]
  21. Yang, T.; Geng, S.; Yang, C.; Huang, Q. Hydrodynamics and mass transfer in an internal airlift slurry reactor for process intensification. Chem. Eng. Sci. 2018, 184, 126–133. [Google Scholar] [CrossRef]
  22. Tao, J.; Huang, J.; Geng, S.; Gao, F.; He, T.; Huang, Q. Experimental investigation of hydrodynamics and mass transfer in a slurry multistage internal airlift loop reactor. Chem. Eng. J. 2019, 386, 122769. [Google Scholar] [CrossRef]
  23. Salehpour, R.; Jalilnejad, E.; Nalband, M.; Ghasemzadeh, K. Hydrodynamic behavior of an airlift reactor with net draft tube with different configurations: Numerical evaluation using CFD technique. Particuology 2019, 51, 91–108. [Google Scholar] [CrossRef]
  24. Zhang, T.; Wei, C.; Feng, C.; Ren, Y.; Wu, H.; Preis, S. Advances in characteristics analysis, measurement methods and modelling of flow dynamics in airlift reactors. Chem. Eng. Process. Process Intensif. 2019, 144, 1–19. [Google Scholar] [CrossRef]
  25. Pelivanoski, B.; Detmann, B.; Ooms, K.; Winkler, M.; Vasyukova, E.; Denecke, M. Design of a 1000 L pilot-scale airlift bioreactor for nitrification with application of a three-phase hydrodynamic mathematical model and prediction of a low liquid circulation velocity. Chem. Eng. Res. Des. 2020, 153, 257–262. [Google Scholar] [CrossRef]
  26. Molina, E.; Contreras, A.; Chisti, Y. Gas holdup, liquid circulation and mixing behaviour of viscous Newtonian media in a split-cylinder airlift bioreactor. Food Bioprod. Process. 1999, 77, 27–32. [Google Scholar] [CrossRef] [Green Version]
  27. Moraveji, M.K.; Sajjadi, B.; Davarnejad, R. Gas-Liquid Hydrodynamics and Mass Transfer in Aqueous Alcohol Solutions in a Split-Cylinder Airlift Reactor. Chem. Eng. Technol. 2011, 34, 465–474. [Google Scholar] [CrossRef]
  28. Albdiri, A.D.Z.; Ojha, A.; Al-Dahhan, M. Study of Local Gas Holdup and Specific Interfacial Area in a Split-Column Airlift Bioreactor Using Sphosticated 4-Point Optical Probe for Culturing Microlgae/Cyanobacteria. Chem. Eng. Commun. 2015, 202, 892–898. [Google Scholar] [CrossRef]
  29. Ojha, A.; Al-Dahhan, M. Investigation of Local Gas Holdup and Bubble Dynamics using Four-Point Optical Probe Technique in a Split-Cylinder Airlift Reactor. Int. J. Multiph. Flow 2018, 102, 1–15. [Google Scholar] [CrossRef]
  30. Luo, H.P.; Kemoun, A.; Al-Dahhan, M.H.; Sevilla, J.M.F.; Sánchez, J.L.G.; Camacho, F.G.; Grima, E.M. Analysis of photobioreactors for culturing high-value microalgae and cyanobacteria via an advanced diagnostic technique: CARPT. Chem. Eng. Sci. 2003, 58, 2519–2527. [Google Scholar] [CrossRef]
  31. Al Mesfer, M.; Sultan, A.; Al-Dahhan, M. Impacts of dense heat exchanging internals on gas holdup cross-sectional distributions and profiles of bubble column using gamma ray Computed Tomography (CT) for FT synthesis. Chem. Eng. J. 2016, 300, 317–333. [Google Scholar] [CrossRef]
  32. Sultan, A.J.; Sabri, L.S.; Al-Dahhan, M.H. Investigating the influence of the configuration of the bundle of heat exchanging tubes and column size on the gas holdup distributions in bubble columns via gamma-ray computed tomography. Exp. Therm. Fluid Sci. 2018, 98, 68–85. [Google Scholar] [CrossRef]
  33. Chen, J.; Rados, N.; Al-dahhan, M.H.; Dudukovic, M.P.; Nguyen, D.; Parimi, K. Particle Motion in Packed/Ebullated Beds by CT and CARPT. AIChE J. 2001, 47, 994–1004. [Google Scholar] [CrossRef]
  34. Roy, S.; Kemoun, A.; Al-Dahhan, M.H.; Dudukovic, M.P.; Skourlis, T.B.; Dautzenberg, F.M. Countercurrent flow distribution in structured packing via computed tomography. Chem. Eng. Process. Process. Intensif. 2005, 44, 59–69. [Google Scholar] [CrossRef]
  35. Efhaima, A.; Al-Dahhan, M. Local time-averaged gas holdup in fluidized bed reactor using gamma ray computed tomography technique (CT). Int. J. Ind. Chem. 2015, 6, 143–152. [Google Scholar] [CrossRef] [Green Version]
  36. Ali, N.; Al-Juwaya, T.; Al-Dahhan, M. Demonstrating the non-similarity in local holdups of spouted beds obtained by CT with scale-up methodology based on dimensionless groups. Chem. Eng. Res. Des. 2016, 114, 129–141. [Google Scholar] [CrossRef] [Green Version]
  37. Al-Juwaya, T.; Ali, N.; Al-Dahhan, M. Investigation of cross-sectional gas-solid distributions in spouted beds using advanced non-invasive gamma-ray computed tomography (CT). Exp. Therm. Fluid Sci. 2017, 86, 37–53. [Google Scholar] [CrossRef] [Green Version]
  38. Al Falahi, F.; Mueller, G.; Al-Dahhan, M. Pebble bed nuclear reactor structure study: A comparison of the experimental and calculated void fraction distribution. Prog. Nucl. Energy 2018, 106, 153–161. [Google Scholar] [CrossRef]
  39. O’Sullivan, J.A.; Benac, J. Alternating minimization algorithms for transmission tomography. IEEE Trans. Med. Imaging 2007, 26, 283–297. [Google Scholar] [CrossRef] [Green Version]
  40. Varma, R.; Bhusarapu, S.; Sullivan, J.A.O. A comparison of alternating minimization and expectation maximization algorithms for single source gamma ray tomography. Imaging 2007, 18, 1–13. [Google Scholar] [CrossRef]
  41. Sultan, A.J.; Sabri, L.S.; Shao, J.; Al-Dahhan, M.H. Overcoming the gamma-ray computed tomography data processing pitfalls for bubble column equipped with vertical internal tubes. Can. J. Chem. Eng. 2018, 96, 2206–2226. [Google Scholar] [CrossRef]
  42. Sultan, A.J.; Sabri, L.S.; Al-Dahhan, M.H. Impact of heat-exchanging tube configurations on the gas holdup distribution in bubble columns using gamma-ray computed tomography. Int. J. Multiph. Flow 2018, 106, 202–219. [Google Scholar] [CrossRef]
  43. Sultan, A.J.; Sabri, L.S.; Al-Dahhan, M.H. Influence of the size of heat exchanging internals on the gas holdup distribution in a bubble column using gamma-ray computed tomography. Chem. Eng. Sci. 2018, 186, 1–25. [Google Scholar] [CrossRef]
  44. Sultan, A.J. Hydrodynamics Study of the Bubble Columns with Intense Vertical Heat-Exchanging Tubes Using Gamma-Ray Computed Tomography and Radioactive Particle Tracking Techniques; Missouri University of Science and Technology: Rolla, MO, USA, 2018. [Google Scholar]
  45. Luo, H.-P.; Al-Dahhan, M.H. Local characteristics of hydrodynamics in draft tube airlift bioreactor. Chem. Eng. Sci. 2008, 63, 3057–3068. [Google Scholar] [CrossRef]
  46. Luo, H.-P. Analyzing and Modeling of Airlift Photobioreactors for Microalgal and Cyanobacteria Cultures; Washington University: St. Louis, MO, USA, 2005. [Google Scholar]
  47. HLuo, P.; Al-Dahhan, M.H. Airlift column photobioreactors for Porphyridium sp. culturing: Part II. verification of dynamic growth rate model for reactor performance evaluation. Biotechnol. Bioeng. 2012, 109, 942–949. [Google Scholar] [CrossRef]
  48. Talvy, S.; Cockx, A.; Line, A. Modeling of oxygen mass transfer in a gas-liquid airlift, reactor. AIChE J. 2007, 53, 316–326. [Google Scholar] [CrossRef]
  49. Wu, X.; Merchuk, J.C. A model integrating fluid dynamics in photosynthesis and photoinhibition processes. Chem. Eng. Sci. 2001, 56, 3527–3538. [Google Scholar] [CrossRef]
  50. Behin, J.; Farhadian, N. Residence time distribution measurements in a two dimensional rectangular airlift reactor by digital image processing. Exp. Therm. Fluid Sci. 2013, 51, 244–250. [Google Scholar] [CrossRef]
Figure 1. Schematic diagram of the split-plate airlift reactor with air flow system.
Chemengineering 06 00018 g001
Figure 2. Picture of dual-source gamma-ray computed tomography technique and split-plate airlift reactor.
Chemengineering 06 00018 g002
Figure 3. Schematic diagram of the CT technique with the split-plate airlift reactor.
Chemengineering 06 00018 g003
Figure 4. Photos of RPT technique with split plate airlift reactor.
Chemengineering 06 00018 g004
Figure 5. Schematic diagram of detectors arrangement around the split airlift reactor.
Chemengineering 06 00018 g005
Figure 6. Reproducibility of the cross-sectional liquid velocity distributions in split reactor at all levels and operated gas velocity 3 cm/s.
Chemengineering 06 00018 g006aChemengineering 06 00018 g006b
Figure 7. Reproducibility of the radial profiles in split photobioreactor at top level and operated at gas velocity of 3 cm/s.
Chemengineering 06 00018 g007aChemengineering 06 00018 g007b
Figure 8. Cross-sectional distributions in gas holdup at different heights of split airlift reactor operated with gas velocity of 1 cm/s.
Chemengineering 06 00018 g008
Figure 9. Cross-sectional distributions in gas holdup at different heights of split airlift reactor operated under gas velocity of 2 cm/s.
Chemengineering 06 00018 g009
Figure 10. Cross-sectional distributions in gas holdup at different heights of split airlift reactor operated under gas velocity of 3 cm/s.
Chemengineering 06 00018 g010
Figure 11. Local gas holdup profiles at different height of split airlift reactor operated under different gas velocities.
Chemengineering 06 00018 g011
Figure 12. Cross-sectional distributions of axial liquid velocity at different heights of split airlift reactor operated under gas velocity of 1 cm/s.
Chemengineering 06 00018 g012
Figure 13. Cross-sectional distributions of axial liquid velocity at different heights of split airlift reactor operated under gas velocity of 2 cm/s.
Chemengineering 06 00018 g013
Figure 14. Cross-sectional distributions of axial liquid velocity at different heights of split airlift reactor operated under gas velocity of 3 cm/s.
Chemengineering 06 00018 g014
Figure 15. Local axial velocity profiles at different height of split airlift reactor operated under different gas velocities.
Chemengineering 06 00018 g015
Figure 16. Cross-sectional distributions of shear stress at different heights of split airlift reactor operated under gas velocity of 1 cm/s.
Chemengineering 06 00018 g016
Figure 17. Cross-sectional distributions of shear stress at different heights of split airlift reactor operated under gas velocity of 2 cm/s.
Chemengineering 06 00018 g017
Figure 18. Cross-sectional distributions of shear stress at different heights of split airlift reactor operated under gas velocity of 3 cm/s.
Chemengineering 06 00018 g018
Figure 19. Local Reynolds shear stress profiles at different height of split airlift reactor operated under different gas velocities.
Chemengineering 06 00018 g019
Figure 20. Cross-sectional distributions of turbulent kinetic energy at different heights of split airlift reactor operated under gas velocity of 1 cm/s.
Chemengineering 06 00018 g020
Figure 21. Cross-sectional distributions of turbulent kinetic energy at different heights of split airlift reactor operated under gas velocity of 2 cm/s.
Chemengineering 06 00018 g021
Figure 22. Cross-sectional distributions of turbulent kinetic energy at different heights of split airlift reactor operated under gas velocity of 3 cm/s.
Chemengineering 06 00018 g022
Figure 23. Local turbulent kinetic energy profiles at different height of split airlift reactor operated under different gas velocities.
Chemengineering 06 00018 g023
Publisher’s Note: MDPI stays neutral with regard to jurisdictional claims in published maps and institutional affiliations.

