Article

Effect of Surfactant HLB Value on Enzymatic Hydrolysis of Chitosan

1
Department of Chemical Engineering, Faculty of Engineering, Diponegoro University, Jl. Prof. Soedarto S.H., Tembalang, Semarang 50275, Indonesia
2
Membrane Research Center, Integrated Laboratory for Research and Services, Diponegoro University, Jl. Prof. Soedarto S.H., Tembalang, Semarang 50275, Indonesia
*
Author to whom correspondence should be addressed.
ChemEngineering 2022, 6(1), 17; https://doi.org/10.3390/chemengineering6010017
Submission received: 11 January 2022 / Revised: 29 January 2022 / Accepted: 3 February 2022 / Published: 8 February 2022

Abstract

:
Nonionic surfactants are reported as being able to enhance enzyme stability and increase the conversion of enzymatic reactions. Surfactant-assisted enzymatic hydrolysis conversion is affected by surfactant HLB values. This work investigated the influence of nonionic surfactants with different HLB values on chitosan enzymatic hydrolysis using cellulase enzyme by measuring the reducing sugars formation, viscosity, and molecular weight of hydrolyzed chitosan. A characterization analysis of hydrolyzed products was also carried out. A higher HLB value exhibits a better enzymatic chitosan hydrolysis performance, shown by the decrease in a solution’s viscosity and the increase in reducing sugar formation. Increasing the surfactant concentration will also increase the hydrolysis rate. Nonionic surfactants can protect cellulase enzyme from the denaturation of temperature and stirring influence. The higher the HLB value, the lower the molecular weight of the hydrolyzed chitosan. The result of UV–Vis demonstrated aldehyde groups formation during hydrolysis. The SEM analysis showed that the chitosan, hydrolyzed using different HLB values of surfactants, had different surface morphologies. However, it did not change the chemical structure of the hydrolysis product seen by the FTIR analysis. The XRD patterns showed that the relative crystallinity of raw chitosan decreased when hydrolyzed with surfactants.

1. Introduction

Chitosan is a polycationic natural derivative of chitin, which is considered the main building component of crustacean shells [1,2]. This biopolymer comprises two common sugars: glucosamine and N-acetylglucosamine [3]. Chemically, chitosan is a linear copolymer of (1→4)-linked 2-acetamido-2-deoxy-β-D-glucan and 2-amino- 2-deoxy-β- D-glucan units in varying proportions [2]. Chitosan is nontoxic, biocompatible, and biodegradable. It also has a high tensile strength and antimicrobial activity. These advantageous properties make possible the use of chitosan in many applications, especially in the food, biomedical, and pharmaceutical industries [1,4,5,6]. However, the high molecular weight of chitosan results in its high viscosity and low aqueous solubility at a neutral pH, which limits its potential application [5,7].
Several methods to produce a water-soluble, low-molecular-weight chitosan have been attempted, in order to improve its solubility and applicability. Usually, a chemical or enzymatic hydrolysis of the chitosan polymers is used to prepare low-molecular-weight chitosan. Chemical hydrolysis is preferred because it is simple, practical, and gives a high yield [4]. The drawbacks of this method are the extreme reaction condition requirements (high temperature and pressure, extreme pH condition, etc.) and a composition of the final product that is difficult to control [8]. Enzymatic reactions require mild operating conditions, are more specific, and are easier to control [8,9]. The specific enzyme of chitosan hydrolysis is chitosanases. This enzyme is expensive and has a limited availability [4,9]. The enzyme is also not very stable at different temperatures and pHs or in solvents and stirring interactions [10]. Moreover, the main disadvantage of enzymatic hydrolysis is its low efficiency [11,12]. Consequently, this condition inhibits its use in large-scale applications.
One strategy that can improve enzymes’ stability and enhance their conversion is the introduction of surfactants in enzymatic hydrolysis. Surfactants are amphiphilic molecules containing two parts: hydrophilic groups (their heads) and hydrophobic groups (their tails). Surfactants are liquid soluble; hydrophobic and hydrophilic sides can reduce the surface and interfacial tensions that cause adsorption at the interface [13]. Yang et al. [14] reported that tween effectively enhanced the enzymatic hydrolysis rate of microcrystalline cellulose using cellulase. Nonionic surfactants have the best performance compared to anionic and cationic surfactants. The nonionic surfactant increased the reaction rate of the enzymatic hydrolysis of cellulose. In contrast, the presence of amphoteric, cationic, and anionic surfactants decreased the hydrolysis rate [15,16]. In addition to non-food grades, anionic and cationic surfactants can lead to cellulase flocculation via electrostatic interactions. The interactions between ionic surfactants and the enzyme molecules lead to the denaturation of the enzyme [13].
In biomass hydrolysis, nonionic surfactant addition can reduce the non-productive adsorption of enzymes onto lignin [17]. The surfactant addition on the enzymatic hydrolysis of treated lignocellulose could reduce the non-productive adsorption of cellulase on lignin. The hydrophobic part of the surfactant can bind to the residual lignin of the substrates through a hydrophobic interaction, thus preventing cellulase adsorption on lignin [18].
The performance of surfactant molecules depends on several properties, including molecular structure, type of electrolyte, hydrophilic–lipophilic balance (HLB), and concentration [19,20]. HLB is the strength balance of a surfactant molecule’s hydrophilic and lipophilic groups. The greater the HLB value, the more water-soluble the molecule is and vice versa [21]. Previously, Rokhati et al. [22] studied the Tween 80 surfactant addition on the enzymatic hydrolysis of chitosan using cellulase enzyme. The study results showed that Tween 80 could improve the formation rate of reducing sugars. The average molecular weight of the hydrolyzed chitosan with Tween 80 was lower than without Tween 80 addition.
The potential uses of chitosan have driven us to discover more on the advancement of chitosan enzymatic hydrolysis. It has been hypothesized that the properties of the surfactants used in enzymatic hydrolysis strongly influence the process. However, the in-depth understanding of the interaction between chitosan enzymatic hydrolysis and nonionic surfactants and their effects has not yet been investigated. Moreover, the research on the utilization of nonionic surfactants in chitosan hydrolysis is limited because most research utilized surfactants for other polymer hydrolysis processes (e.g., cellulose).
The use of nonionic surfactants is expected to improve the performance of the chitosan enzymatic hydrolysis process. Therefore, this experimental study of nonionic-surfactant-assisted enzymatic hydrolysis of chitosan regarding its effects and interaction was conducted. Since nonionic surfactants have specific HLB values, it is necessary to discover the effect of HLB values on the performance of chitosan enzymatic hydrolysis. Furthermore, the effects of the surfactant on the cellulases enzyme adsorption and desorption onto/from the chitosan substrate were also addressed.

2. Materials and Methods

2.1. Materials

Research materials used in this study were food-grade chitosan (deacetylation degree of 85.78%) provided by PT. Biotech Surindo, Cirebon, Indonesia. Cellulase enzyme from Aspergillus niger, potassium ferricyanide (K3(Fe(CN)6)), glucosamine, and Span 20 (CAS: 1338-39-2) were purchased from Sigma-Aldrich, Germany. Acetic acid glacial (CH3COOH), sodium acetate (CH3COONa), sodium carbonate (Na2CO3), Tween 20 (CAS-No: 9005-64-5), Tween 80 (CAS-No: 9005-65-6), as well as Span 80 (CAS-No: 1338-43-8) were purchased from Merck, Germany.

2.2. The Hydrolysis of Chitosan

Chitosan solution of 1% (w/v) was prepared by dissolving chitosan powder in 0.1 M acetic acid/sodium acetate buffer solution (pH 4.7). Then, every 50 mL of chitosan solution was mixed with a surfactant. Subsequently, cellulase enzyme was added with the ratio of 1:100 (w/w chitosan). The surfactants used in this study were Tween 20, Tween 80, Span 20, and Span 80, while the concentration of each surfactant was 0%, 1%, 2%, 4%, 7%, 10%, and 15% (w/w chitosan). The mixture was placed in an incubator shaker for hydrolysis at a certain temperature (35, 40, 45, 50, and 55 °C) with various agitation speeds of 100, 150, 200, and 250 rpm. The hydrolysis time itself varied from 4 to 72 h. After hydrolysis, the enzyme was deactivated by heating the solution for 10 min in boiling water.

2.3. The Characterization of Chitosan Hydrolysis Product

Several analysis methods were performed to evaluate the performance of surfactant-assisted chitosan hydrolysis. The colorimetric method was used for detecting the cellulase activity that depended on a chemical redox reaction; this involved the reducing ends of the hydrolytic products [23]. In this study, the Schales’ procedure [9] was used. Potassium ferricyanide of 0.05% w/v was dissolved into 0.5 M potassium carbonate solution stored in a dark bottle. Then, 2 mL of the reagent and 1.5 mL of hydrolyzed solution were mixed in a tube stoppered with aluminum foil. The mixture was heated afterward for 15 min at 100 °C, followed by cooling it to room temperature and filtering. The mixture solution’s absorbance was measured at 420 nm using a spectrophotometer (Genesys™ 20 Visible Spectrophotometer). A standard curve with D-glucosamine HCl as the standard solution was made with the absorbance data using linear regression analysis to estimate the total reducing sugars.
The hydrolyzed product’s molecular weight was estimated using the empirical correlation of molecular weight and intrinsic viscosity of solution [24]. The solutions in which the molecular weight would be measured were the raw chitosan and the hydrolyzed chitosan samples. The average molecular weight M was calculated using the Mark–Houwink empirical equation, as presented in Equation (1):
η = 1.81 . 10 3 M 0.93
where η is the intrinsic viscosity that can be determined using Equation (2):
η = η s p C C 0 = η r e d C 0
where C is in g/mL. Intrinsic viscosity is defined as reduced viscosity η r e d extrapolated to a chitosan concentration C of zero, while η s p is the specific viscosity, which can be calculated by using the Equation (3):
η s p = t t 0 t 0
The powder form of hydrolyzed solutions was required for further characterization analysis. The hydrolyzed solution was added with NaOH 0.1 N until pH 8–9 was achieved to precipitate the chitosan. Then, it was centrifuged for 20 min at a speed of 2000 rpm and later washed with ethanol, filtered, and dried.
The aldehyde group formed by the cleavage of the glycosidic bond in the chitosan chain after hydrolysis was monitored by UV–Vis spectrophotometry (Spectrophotometer Hitachi UH-900). The redox reaction between the Schales reagent and the aldehyde group of chitosan would change the color of the solution. The solution absorbance was recorded at a wavelength range between 350 and 500 nm.
The raw and hydrolyzed chitosan were also characterized using Fourier transform infrared (FTIR), scanning electron microscope (SEM), and X-ray diffraction (XRD). FTIR analysis of the sample was performed using PerkinElmer Spectrum IR 10.6.1 in the wavelength range of 500–4000 cm−1. The morphology of chitosan powder was observed by SEM (JEOL JSM-6510LA SEM, Japan) at an acceleration voltage of 10 kV. XRD pattern of chitosan was obtained by Shimadzu Lab XRD-7000 diffractometer with a CuKα target at 30 kV and 30 mA at 20 °C.

3. Results and Discussion

3.1. The Effect of Surfactant HLB Value

The total reducing sugars in the final products were analyzed to investigate the effect of nonionic surfactant HLB value of chitosan hydrolysis. The profile of reducing sugar concentration, as a function of hydrolysis time with various surfactant types, is shown in Figure 1A. The surfactants used in this study were Tween 20, Tween 80, Span 20, and Span 80, with HLB values of 16.7, 15, 8.6, and 4.3, respectively [25,26,27].
In the chitosan hydrolysis reaction, a glycosidic bond cleavage produces the aldehyde group that has a reductive property [28]. The reducing sugars formation proves the presence of enzymatic hydrolysis activity. On the other hand, the degradation of the linear polysaccharides causes the solution’s viscosity, and the molecular weight of chitosan decreases [22]. Therefore, the reaction rate of chitosan hydrolysis could be studied by measuring the solution viscosity, as shown in Figure 1B. The total reducing sugars and solution viscosity were key parameters for investigating the effect of surfactant HLB value on chitosan hydrolysis.
Figure 1 shows that adding all types of surfactants significantly enhanced the enzymatic hydrolysis of chitosan. The highest increment of reducing sugar formation was achieved by the hydrolysis process with the addition of Tween 20, followed by Tween 80 and Span 20, and the lowest was achieved with the addition of Span 80. This result indicates that the increase in the HLB value of the surfactant is followed by an increase in the enzymatic hydrolysis rate of chitosan.
Enzymes are protein compounds composed of hydrophilic amino acids. During the enzymatic hydrolysis reactions, enzymes formed complexes with substrates. After the reaction was complete, the enzyme was desorbed from the substrate functional group to adsorb another substrate functional group. Therefore, the enzymes’ rate of adsorption and desorption to and from the substrate significantly affected enzymatic hydrolysis [29].
Interactions between surfactants and polymers occur through hydrophobic interactions and hydrogen bonds [30], also illustrated in Figure 2. The presence of an acetyl group causes chitosan to have amphiphilic properties. The HLB scale ranges are from 0 to 20, where higher HLB means a higher hydrophilicity. According to Chiappisi [31], the free surfactant molecules are adsorbed at the air–water interface at low concentrations (Figure 2A). The hydrophilic part of the surfactant is oriented towards the water, while the hydrocarbon chain (tail) leads to the hydrophobic part of the chitosan polymer [32]. The interaction between the surfactant tail and the hydrophobic group of chitosan causes the dispersion of the chitosan–surfactant mixture (Figure 2B). The hydrophobic part of the surfactant avoids the chitosan solution. In contrast, the surfactant head (hydrophilic sides) points outward. It interacts with the surrounding solution, while the hydrocarbon tail is in the middle and forms free micelles (Figure 2C). The presence of the hydrophobic groups (acetyl group) cause chitosan to associate with itself. This will inhibit enzyme–substrate contact. In the next formation of micelle, the hydrophilic chains of chitosan and enzymes (hydrophilic) will be solubilized on the micellar surface (Figure 2D). This condition will cause the reactive group of the substrate to be easily accessed by the enzyme. The enzymatic chitosan hydrolysis with a higher HLB value of surfactant can increase the contact probability between the enzyme and the substrate. Thus, Tween 20 could produce notably more reducing sugar than the other surfactants. This result is supported by the previous study by Zheng et al. [33], which found that cellulose conversion with Tween 20 was higher than Tween 80.

3.2. The Effect of Surfactant Concentration

The introduction of the nonionic surfactant in the enzymatic hydrolysis of chitosan indeed has a significant effect on enhancing the conversion of the reaction, as discussed in the previous section. The effect of the surfactant concentration on enzymatic hydrolysis performance was further evaluated. The profiles of total reducing sugar increment and solution viscosity decline at various concentrations of the surfactant, as depicted in Figure 3.
Figure 3 shows that at low surfactant concentrations (below 5 % w/w), the conversion was drastically enhanced, as indicated by the sharp increment of total reducing sugar and the viscosity decline. However, increasing the surfactant concentration eventually decreased the rate of chitosan degradation indicated by the low increment of total reducing sugar. In other words, there is a critical concentration where the presence of the surfactant exhibits a positive effect below a critical point and shows the opposite effect at a higher critical point. The possible answer to this phenomenon could be that the surfactant molecules interact with the chitosan chain at low concentrations. Increasing the surfactant concentration will form micelles that produce crosslinks between the chitosan chains. The further increase in surfactant concentration will produce more free micelles interacting with the enzymes. Consequently, this weakens the adsorption of the cellulase enzyme to the chitosan functional group [31]. Therefore, a higher surfactant concentration exhibits a better enzymatic hydrolysis performance of chitosan.
Interestingly, Figure 3 also shows that increasing Tween 20 concentration by up to 15% w/w significantly increased the reducing sugar and decreased the viscosity. Enzymes are protein compounds composed of hydrophilic amino acids. Tween 20 has an HLB value of 16.7, which provides a very hydrophilic environment that potentially increases the rate of enzyme desorption from substrate functional groups to further adsorb other substrate functional groups [29].

3.3. The Effect of Operating Temperature

Enzymatic hydrolysis is a hydrolysis process that utilizes the bio-catalyzing ability of a protein so that its activity is very sensitive with the operating condition. In this study, several enzymatic hydrolysis processes of chitosan were conducted at varying temperatures to evaluate its influence on the performance of enzymatic hydrolysis. The temperatures used in the hydrolysis process were 35, 40, 45, 50, and 55 °C. The observed total reducing sugars and viscosity are depicted in Figure 4.
Enzymes consisting of amino acid units tend to be hydrophilic. Hydrophilic interactions between enzymes and surfactants can protect a three-dimensional structure of proteins from denaturation. Zheng et al. [32] found that the optimum temperature for enzymatic hydrolysis with surfactants (Tween 80 and Tween 20) was about 10 °C higher than without the addition of the surfactants. Accordingly, hydrolysis with a surfactant addition could withstand the process at a higher temperature, causing an increase in reducing sugars formation and a viscosity reduction, while the total reducing sugars formation on non-surfactant-assisted hydrolysis plummeted at 55 °C.

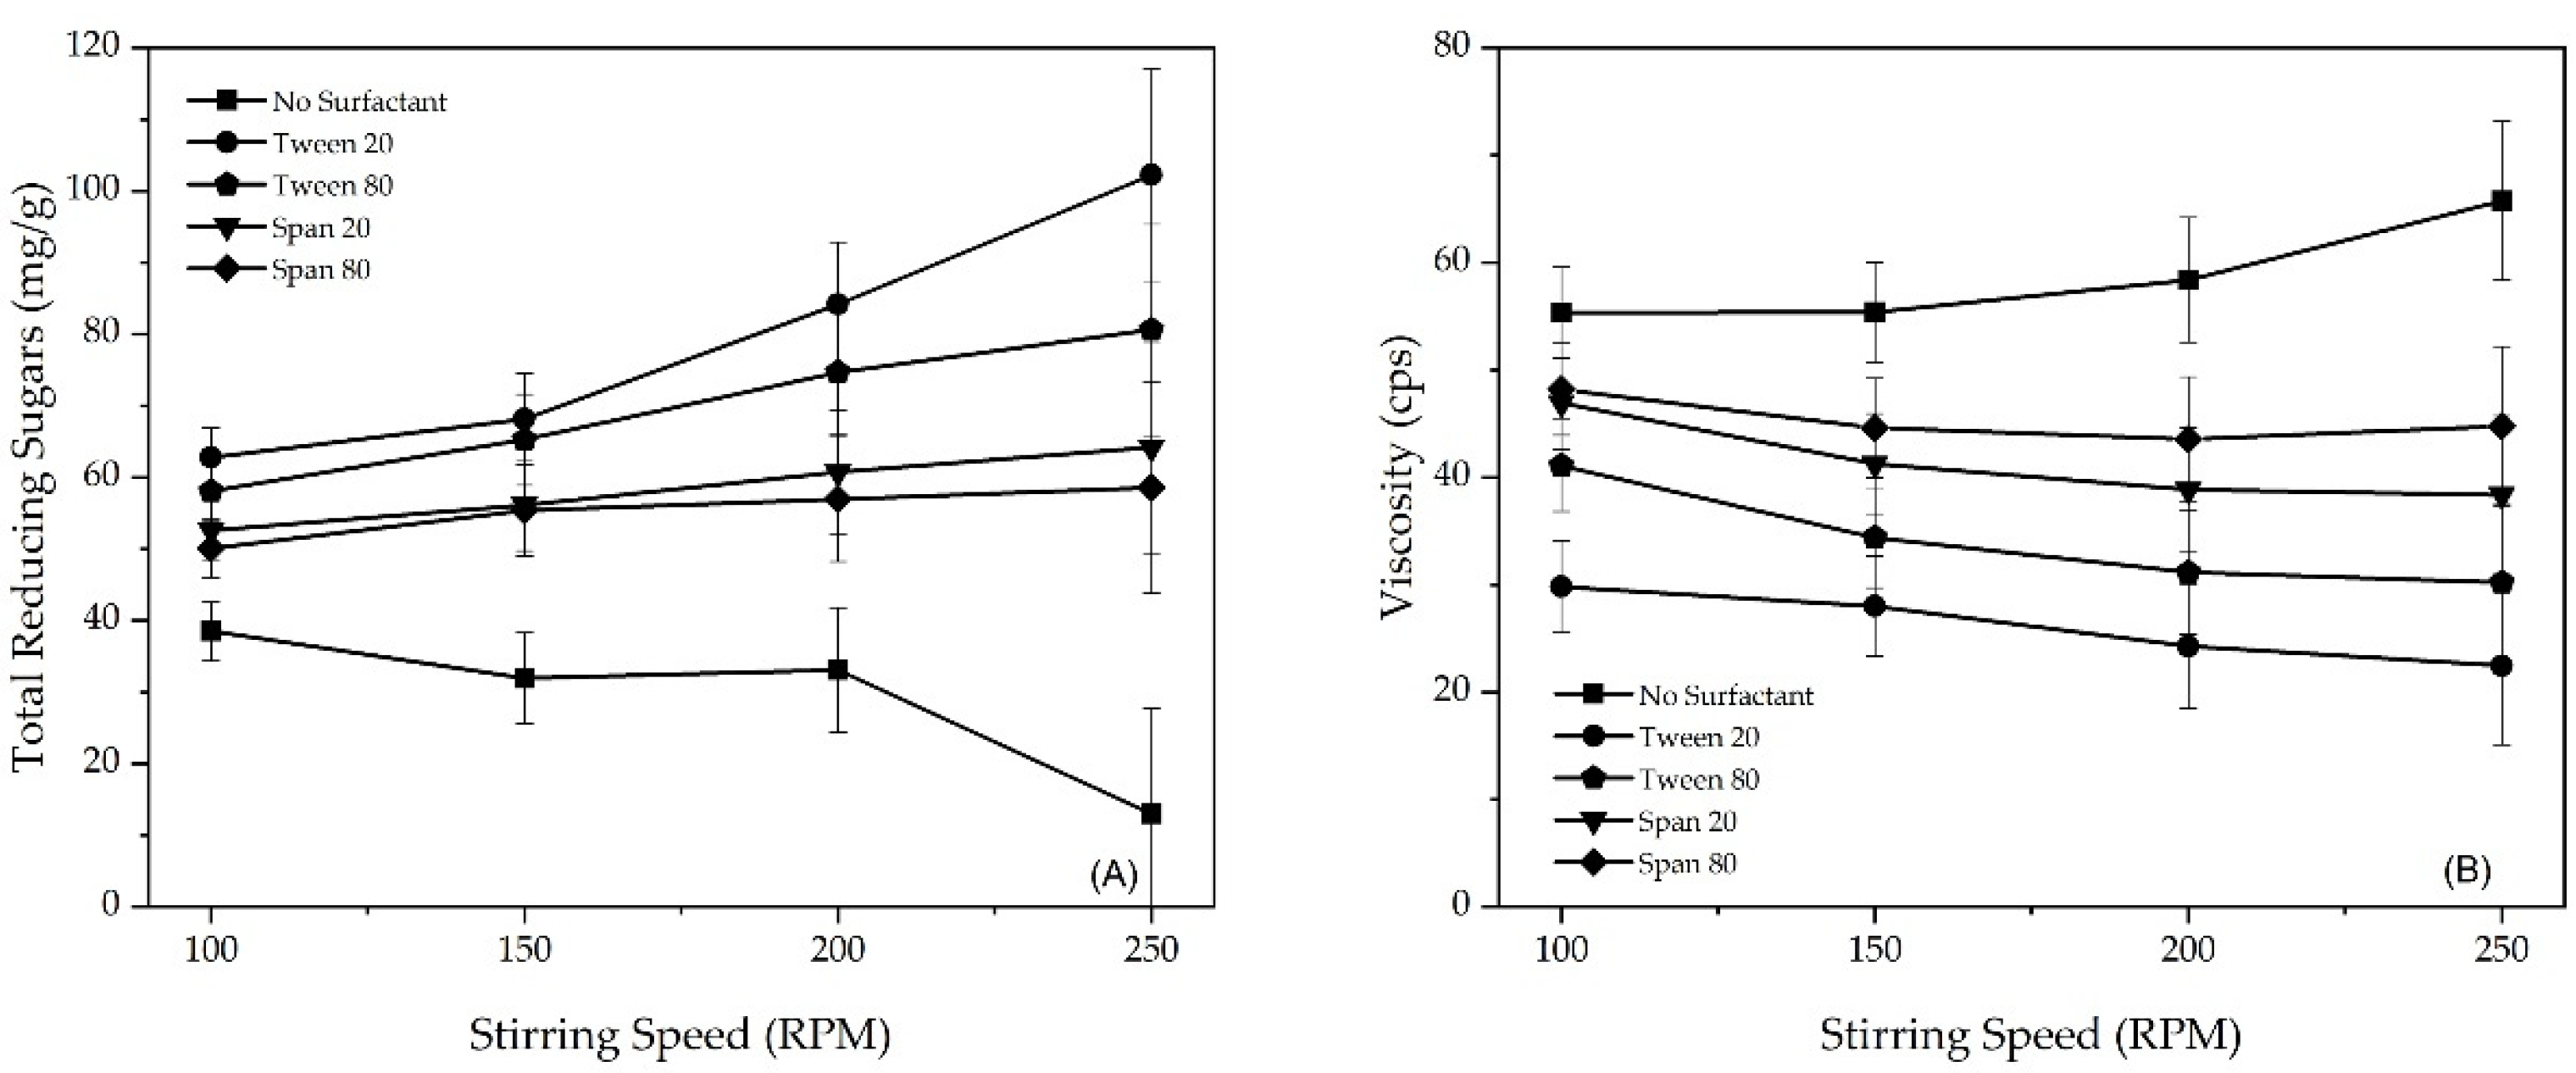
3.4. The Effect of Stirring Speed

One of the important parameters in the liquid-phase reaction process is agitation speed, which keeps the particles in a suspension state in the vessel. An optimum agitation speed is required to promote a higher contact probability among the reactants. For evaluating the effect of stirring speed on the enzymatic hydrolysis of chitosan, hydrolysis processes with various agitation speeds were prepared. The agitation speed in the incubator shaker was adjusted at the range of 100–250 rpm in the hydrolysis reaction of chitosan for 24 h. As presented in Figure 5, the results show that the higher agitation speed resulted in a greater total of reducing sugars.
In the enzymatic hydrolysis of chitosan without the surfactant addition, increasing stirring speed causes less chitosan degradation. On the other hand, increasing stirring speed can significantly increase the degradation process in hydrolysis with the addition of the surfactants.
Generally, agitation can increase the interaction between enzyme and substrate, thus intensifying the activity of enzymes. Adequate mixing could promote mass transfer within the reactor, increasing the reaction rate. However, Lou et al. [12] reported that thermal and mechanical influence could quickly deactivate cellulase enzymes during hydrolysis. The agitation speed of 250 rpm showed the lowest total reducing sugar level in the hydrolysis product without surfactant addition, indicating that the enzymes were mechanically deactivated at this speed rate.
A higher agitation speed causes a higher frictional force that potentially damages the enzyme protein’s three-dimensional structure, leading to protein denaturation. According to Okino et al. [34], shear stress from stirring from the incubator shaker could reduce the cellulase enzyme activity. This accounts for the decrease in the total reducing sugars formation in the hydrolysis without surfactant at 250 rpm.
However, nonionic surfactants can prevent cellulase deactivation by the denaturation of protein enzymes. Protein denaturation occurs due to the breaking of hydrogen bonds so that the secondary structure of the protein changes. The interaction between surfactants and enzymes can protect the breaking of hydrogen bonds in enzyme protein molecules. The addition of surfactant in the enzymatic reaction with a high stirring speed can increase the hydrolysis reaction rate. These results are in line with previous studies by Zhou et al. [11], Chen et al. [18], and Yang et al. [35].
Previous publications by Lou et al. [12] and Mussatto et al. [36] reported that nonionic surfactants could not improve hydrolysis under static conditions and at low agitation speed due to the mass transfer limitation. The results of this study proved that the conversion was enhanced at high stirring speed (250 rpm).

3.5. Characterization of Hydrolyzed Chitosan

3.5.1. Molecular Weight

Hydrolyzed chitosan can be characterized for its molecular weight by measuring the decrease in viscosity. Changes in the viscosity of the polymer solution indicate a change in the molecular weight of the polymer due to chain scission during the hydrolysis process. The molecular weight of raw chitosan and hydrolyzed chitosan were estimated by the viscosimetric method, as shown in Figure 6. The molecular weight of the raw chitosan was 2173.23 kDa, while the molecular weights of hydrolyzed chitosan with no surfactant, with Span 80, Span 20, Tween 80, and Tween 20 were 703.11 kDa, 465.25 kDa, 345.66 kDa, 142.53 kDa, and 40.63 kDa, respectively.
As stated previously, adding a surfactant with a higher HLB value increased the contact probability between the enzyme and the substrate. This phenomenon caused more of chitosan’s glycosidic bonds to be broken, resulting in lower molecular-weight values [22]. This result is consistent with Figure 1, which shown that the higher the surfactant HLB value, the lower the hydrolyzed chitosan viscosity.

3.5.2. UV–Vis Spectrophotometry

The UV–Vis spectrophotometry characterization was carried out to study the aldehyde groups formation. It is formed from the b-D-(1-4) glycosidic bonds cleavage of the chitosan chain after enzymatic hydrolysis. The UV–Vis spectra of the raw and hydrolyzed chitosan with the addition of surfactants with various HLB values are shown in Figure 7. The UV–Vis spectra showed an absorption peak at about 420 nm. The absorbance peak of hydrolyzed chitosan decreased with the increasing HLB value due to the aldehyde group formation. The redox reaction between the Schales’ reagent and the aldehyde group of chitosan will cause a change in the colored solution, turning it from yellow/red to transparent.

3.5.3. Scanning Electron Microscope (SEM)

Figure 8 illustrates the morphology of the raw and hydrolyzed chitosan powder. The raw chitosan exhibited a smooth, dense and nonporous surface, which was also observed by Mujeeb Rahman et al. [37] and Marei et al. [38] The distinct structure was observed for the hydrolyzed chitosan. It can be seen that there was some coarseness (pits) on the chitosan surface due to the hydrolysis reaction. Figure 7 also shows different surface morphologies on the chitosan’s surfaces hydrolyzed by different surfactants. Hydrolyzed chitosan without a surfactant showed some erosion of irregular amorphous material from the surface. Meanwhile, hydrolyzed chitosan with nonionic surfactants showed surface morphologies composed of regular coarse cracks. This was due to the breaking of the chitosan polymer chain. The surface morphologies of hydrolyzed chitosan with surfactant Tween 20 were more regular than other surfactants.

3.5.4. Fourier-Transform Infrared Spectroscopy (FTIR)

The raw and hydrolyzed chitosan were analyzed using FTIR to identify the functional groups in the solutions (Figure 9). The absorption band of amino groups in chitosan was in the wavelength of 3307 cm−1 and 1647 cm−1. The C-H stretch at 1159 cm−1 represented the saccharide structure. The stretching C-O-C bridge in 1163 cm−1 showed the glycosidic bond between the repeating chitosan monomers. This result aligned with previous studies [24,34,39]. The hydrolyzed chitosan’s FTIR spectra with no surfactant addition showed N-H bending for a secondary amide at 1637 cm−1. The band of O-H stretch was found at 3270 cm−1 [40].
In summary, there were no significant differences in the spectra between the surfactant-assisted and non-surfactant-assisted hydrolysis products. It showed that the addition of surfactants did not change the chemical structure of the chitosan hydrolysis product.

3.5.5. X-ray Diffraction (XRD)

The effect of adding nonionic surfactant types to enzymatic chitosan hydrolysis on the crystalline structures of hydrolyzed chitosan was investigated using XRD within the 2θ range of 5–40°, as shown in Figure 10. The raw chitosan showed crystalline peaks (2θ) at 18.7°, 20.1°, and 21.1°, which were in accordance with the study by Prasertsung et al. [41]. The raw chitosan’s relative crystallinity (RC) was 48.34% and gradually reduced after enzymatically hydrolyzed with the addition of the surfactant. The lowest RC was achieved by the chitosan hydrolyzed with Tween 20, which was 27.83%. However, the crystal peaks’ intensity was similar to the raw chitosan. Hydrolysis caused the peak intensity of chitosan to decrease.

4. Conclusions

Nonionic surfactants can improve the enzymatic hydrolysis of chitosan. Surfactants with higher HLB values significantly increase the formation of reducing sugars compared to low HLB values. The study results show that nonionic surfactants can protect the cellulase enzyme from the denaturation of the temperature and stirring influence. The higher HLB value of the surfactant will result in a lower molecular weight of the hydrolyzed chitosan. The result of UV–Vis shows that aldehyde groups were formed during hydrolysis due to the glycosidic bond cleavage and the opened ring of chitosan chain. The SEM analysis showed that the chitosan, which was hydrolyzed using different HLB values of surfactants, had different surface morphologies. However, the addition of surfactants did not change the chemical structure of the chitosan hydrolysis product shown by the FTIR analysis. The XRD patterns showed that the RC of the raw chitosan decreased when hydrolyzed with the surfactants.

Author Contributions

Conceptualization, N.R.; methodology, N.R.; data curation, N.’A.H.; writing—original draft preparation, N.R. and N.’A.H.; writing—review and editing, N.’A.H., D.P.U. and T.R.; supervision, T.D.K. and A.P.; project administration, N.’A.H. All authors have read and agreed to the published version of the manuscript.

Funding

This research received no external funding.

Acknowledgments

The authors would like to express their gratitude to the Department of Chemical Engineering, Faculty of Engineering, Diponegoro University and Membrane Research Center, Diponegoro University for facilitating this research.

Conflicts of Interest

The authors declare no conflict of interest.

References

  1. Ahmad, M.; Ahmed, S.; Ikram, S. Adsorption of heavy metal ions: Role of chitosan and cellulose for water treatment. Int. J. Pharmacogn. 2015, 2, 280–289. [Google Scholar] [CrossRef]
  2. Ibrahim, K.A.; El-Eswed, B.I.; Abu-Sbeih, K.A.; Arafat, T.A.; Al Omari, M.M.H.; Darras, F.H.; Badwan, A.A. Preparation of chito-oligomers by hydrolysis of chitosan in the presence of zeolite as adsorbent. Mar. Drugs 2016, 14, 1–13. [Google Scholar] [CrossRef] [PubMed] [Green Version]
  3. Bakshi, P.S.; Selvakumar, D.; Kadirvelu, K.; Kumar, N.S. Chitosan as an environment friendly biomaterial—A review on recent modifications and applications. Int. J. Biol. Macromol. 2020, 150, 1072–1083. [Google Scholar] [CrossRef]
  4. Aljbour, N.D.; Beg, M.D.H.; Gimbun, J. Acid Hydrolysis of Chitosan to Oligomers Using Hydrochloric Acid. Chem. Eng. Technol. 2019, 42, 1741–1746. [Google Scholar] [CrossRef]
  5. Poshina, D.N.; Raik, S.V.; Poshin, A.N.; Skorik, Y.A. Accessibility of chitin and chitosan in enzymatic hydrolysis: A review. Polym. Degrad. Stab. 2018, 156, 269–278. [Google Scholar] [CrossRef]
  6. Zhao, Y.; Saldaña, M.D.A. Hydrolysis of cassava starch, chitosan and their mixtures in pressurized hot water media. J. Supercrit. Fluids 2019, 147, 293–301. [Google Scholar] [CrossRef]
  7. Xia, Z.; Wu, S.; Chen, J. Preparation of water soluble chitosan by hydrolysis using hydrogen peroxide. Int. J. Biol. Macromol. 2013, 59, 242–245. [Google Scholar] [CrossRef]
  8. Santos-Moriano, P.; Fernandez-Arrojo, L.; Mengibar, M.; Belmonte-Reche, E.; Peñalver, P.; Acosta, F.N.; Ballesteros, A.O.; Morales, J.C.; Kidibule, P.; Fernandez-Lobato, M.; et al. Enzymatic production of fully deacetylated chitooligosaccharides and their neuroprotective and anti-inflammatory properties. Biocatal. Biotransformation 2018, 36, 57–67. [Google Scholar] [CrossRef] [Green Version]
  9. Roncal, T.; Oviedo, A.; de Armentia, I.L.; Fernández, L.; Villarán, M.C. High yield production of monomer-free chitosan oligosaccharides by pepsin catalyzed hydrolysis of a high deacetylation degree chitosan. Carbohydr. Res. 2007, 342, 2750–2756. [Google Scholar] [CrossRef]
  10. Maria de Medeiros Dantas, J.; Sousa da Silva, N.; Eduardo de Araújo Padilha, C.; Kelly de Araújo, N.; Silvino dos Santos, E. Enhancing chitosan hydrolysis aiming chitooligosaccharides production by using immobilized chitosanolytic enzymes. Biocatal. Agric. Biotechnol. 2020, 28, 101759. [Google Scholar] [CrossRef]
  11. Zhou, Y.; Chen, H.; Qi, F.; Zhao, X.; Liu, D. Non-ionic surfactants do not consistently improve the enzymatic hydrolysis of pure cellulose. Bioresour. Technol. 2015, 182, 136–143. [Google Scholar] [CrossRef] [PubMed]
  12. Lou, H.; Zeng, M.; Hu, Q.; Cai, C.; Lin, X.; Qiu, X.; Yang, D.; Pang, Y. Nonionic surfactants enhanced enzymatic hydrolysis of cellulose by reducing cellulase deactivation caused by shear force and air-liquid interface. Bioresour. Technol. 2018, 249, 1–8. [Google Scholar] [CrossRef] [PubMed]
  13. Parnthong, J.; Kungsanant, S.; Chavadej, S. The Influence of Nonionic Surfactant Adsorption on Enzymatic Hydrolysis of Oil Palm Fruit Bunch. Appl. Biochem. Biotechnol. 2018, 186, 895–908. [Google Scholar] [CrossRef] [PubMed]
  14. Yang, W.; Fan, H.; Zhou, M.; Zhou, Z.; Yan, L.; Ju, X.; Li, L. Synergistic effect of ionic liquid and surfactant for enzymatic hydrolysis of lignocellulose by Paenibacillus sp. LLZ1 cellulase. Biomass Bioenergy 2020, 142, 105760. [Google Scholar] [CrossRef]
  15. Eriksson, T.; Börjesson, J.; Tjerneld, F. Mechanism of surfactant effect in enzymatic hydrolysis of lignocellulose. Enzyme Microb. Technol. 2002, 31, 353–364. [Google Scholar] [CrossRef]
  16. Hemmatinejad, N.; Vahabzadeh, F.; Kordestani, S.S. Effect of surfactants on enzymatic hydrolysis of cellulosic fabric. Iran. Polym. J. 2002, 11, 333–338. [Google Scholar]
  17. Li, Y.; Sun, Z.; Ge, X.; Zhang, J. Effects of lignin and surfactant on adsorption and hydrolysis of cellulases on cellulose. Biotechnol. Biofuels 2016, 9, 1–9. [Google Scholar] [CrossRef] [Green Version]
  18. Chen, Y.A.; Zhou, Y.; Liu, D.; Zhao, X.; Qin, Y. Evaluation of the action of Tween 20 non-ionic surfactant during enzymatic hydrolysis of lignocellulose: Pretreatment, hydrolysis conditions and lignin structure. Bioresour. Technol. 2018, 269, 329–338. [Google Scholar] [CrossRef]
  19. Menegol, D.; Scholl, A.L.; Fontana, R.C.; Dillon, A.J.P.; Camassola, M. Increased release of fermentable sugars from elephant grass by enzymatic hydrolysis in the presence of surfactants. Energy Convers. Manag. 2014, 88, 1252–1256. [Google Scholar] [CrossRef]
  20. Agrawal, R.; Satlewal, A.; Kapoor, M.; Mondal, S.; Basu, B. Investigating the enzyme-lignin binding with surfactants for improved saccharification of pilot scale pretreated wheat straw. Bioresour. Technol. 2017, 224, 411–418. [Google Scholar] [CrossRef]
  21. Caenn, R.; Darley†, H.C.H.; Gray†, G.R. The Surface Chemistry of Drilling Fluids. Compos. Prop. Drill. Complet. Fluids 2017, 285–307. [Google Scholar] [CrossRef]
  22. Rokhati, N.; Susanto, H.; Haryani, K.; Pramudono, B. Enhanced enzymatic hydrolysis of chitosan by surfactant addition. Period. Polytech. Chem. Eng. 2018, 62, 286–291. [Google Scholar] [CrossRef] [Green Version]
  23. Ferrari, A.R.; Gaber, Y.; Fraaije, M.W. A fast, sensitive and easy colorimetric assay for chitinase and cellulase activity detection. Biotechnol. Biofuels 2014, 7, 2–9. [Google Scholar] [CrossRef] [PubMed] [Green Version]
  24. Abd-Elmohdy, F.A.; El Sayed, Z.; Essam, S.; Hebeish, A. Controlling chitosan molecular weight via bio-chitosanolysis. Carbohydr. Polym. 2010, 82, 539–542. [Google Scholar] [CrossRef]
  25. Miller, R. Emulsifiers: Types and Uses, 1st ed.; Elsevier Ltd.: Amsterdam, The Netherlands, 2015; ISBN 9780123849533. [Google Scholar]
  26. Hong, I.K.; Kim, S.I.; Lee, S.B. Effects of HLB value on oil-in-water emulsions: Droplet size, rheological behavior, zeta-potential, and creaming index. J. Ind. Eng. Chem. 2018, 67, 123–131. [Google Scholar] [CrossRef]
  27. Speranza, A.; Corradini, M.G.; Hartman, T.G.; Ribnicky, D.; Oren, A.; Rogers, M.A. Influence of emulsifier structure on lipid bioaccessibility in oil-water nanoemulsions. J. Agric. Food Chem. 2013, 61, 6505–6515. [Google Scholar] [CrossRef]
  28. Tegl, G.; Öhlknecht, C.; Vielnascher, R.; Kosma, P.; Hofinger-Horvath, A.; Guebitz, G.M. Commercial cellulases from Trichoderma longibrachiatum enable a large-scale production of chito-oligosaccharides. Pure Appl. Chem. 2016, 88, 865–872. [Google Scholar] [CrossRef] [Green Version]
  29. Chen, Y.; Zhang, X.; Zhang, S.; Qin, W.; Guo, C.; Guo, X.; Xiao, D. Enhanced enzymatic xylose/cellulose fractionation from alkaline liquor-pretreated corn cob by surfactant addition and separate fermentation to bioethanol. Turkish J. Biol. 2014, 38, 478–484. [Google Scholar] [CrossRef]
  30. Li, D.; Wagner, N.J. Universal binding behavior for ionic alkyl surfactants with oppositely charged polyelectrolytes. J. Am. Chem. Soc. 2013, 135, 17547–17555. [Google Scholar] [CrossRef]
  31. Chiappisi, L.; Gradzielski, M. Co-assembly in chitosan-surfactant mixtures: Thermodynamics, structures, interfacial properties and applications. Adv. Colloid Interface Sci. 2015, 220, 92–107. [Google Scholar] [CrossRef]
  32. Kerwin, B.A. Polysorbates 20 and 80 Used in the Formulation of Protein Biotherapeutics: Structure and Degradation Pathways. J. Pharm. Sci. 2008, 97, 2924–2935. [Google Scholar] [CrossRef] [PubMed]
  33. Zheng, Y.; Pan, Z.; Zhang, R.; Wang, D.; Jenkins, B. Non-ionic surfactants and non-catalytic protein treatment on enzymatic hydrolysis of pretreated creeping wild ryegrass. Appl. Biochem. Biotechnol. 2008, 146, 231–248. [Google Scholar] [CrossRef] [PubMed]
  34. Okino, S.; Ikeo, M.; Ueno, Y.; Taneda, D. Effects of Tween 80 on cellulase stability under agitated conditions. Bioresour. Technol. 2013, 142, 535–539. [Google Scholar] [CrossRef] [PubMed]
  35. Yang, M.; Zhang, A.; Liu, B.; Li, W.; Xing, J. Improvement of cellulose conversion caused by the protection of Tween-80 on the adsorbed cellulase. Biochem. Eng. J. 2011, 56, 125–129. [Google Scholar] [CrossRef]
  36. Mussatto, S.I.; Dragone, G.; Fernandes, M.; Milagres, A.M.F.; Roberto, I.C. The effect of agitation speed, enzyme loading and substrate concentration on enzymatic hydrolysis of cellulose from brewer’s spent grain. Cellulose 2008, 15, 711–721. [Google Scholar] [CrossRef]
  37. Mujeeb Rahman, P.; Muraleedaran, K.; Mujeeb, V.M.A. Applications of chitosan powder with in situ synthesized nano ZnO particles as an antimicrobial agent. Int. J. Biol. Macromol. 2015, 77, 266–272. [Google Scholar] [CrossRef]
  38. Marei, N.H.; El-Samie, E.A.; Salah, T.; Saad, G.R.; Elwahy, A.H.M. Isolation and characterization of chitosan from different local insects in Egypt. Int. J. Biol. Macromol. 2016, 82, 871–877. [Google Scholar] [CrossRef]
  39. Wasikiewicz, J.M.; Yeates, S.G. “Green” molecular weight degradation of chitosan using microwave irradiation. Polym. Degrad. Stab. 2013, 98, 863–867. [Google Scholar] [CrossRef]
  40. Corazzari, I.; Nisticò, R.; Turci, F.; Faga, M.G.; Franzoso, F.; Tabasso, S.; Magnacca, G. Advanced physico-chemical characterization of chitosan by means of TGA coupled on-line with FTIR and GCMS: Thermal degradation and water adsorption capacity. Polym. Degrad. Stab. 2015, 112, 1–9. [Google Scholar] [CrossRef]
  41. Prasertsung, I.; Damrongsakkul, S.; Saito, N. Degradation of β-chitosan by solution plasma process (SPP). Polym. Degrad. Stab. 2013, 98, 2089–2093. [Google Scholar] [CrossRef]
Figure 1. The effects of surfactant type at the different reaction times on the formation of reducing sugars (A) and solution viscosity (B). The chitosan concentration and surfactant concentration were 1% (w/v) and 7% (w/w).
Chemengineering 06 00017 g001
Figure 2. Interaction between chitosan solution and surfactant: (A) Surfactant at low concentration, (B) Dispersion of the chitosan–surfactant mixture, (C) Free micelles formation, (D) Hydrophilic chains of chitosan and enzymes solubilized on the micellar surface.
Chemengineering 06 00017 g002
Figure 3. Total reducing sugar (A) and viscosity decline (B) profile in the chitosan enzymatic hydrolysis for 24 h with various surfactant concentrations.
Chemengineering 06 00017 g003
Figure 4. The profile of total reducing sugars increment (A) and viscosity decline (B) in the chitosan enzymatic hydrolysis at various temperatures.
Chemengineering 06 00017 g004
Figure 5. The effects of the stirring speed on the formation of reducing sugars (A) and viscosity (B) at the various types of surfactant. The reaction time was 24 h.
Chemengineering 06 00017 g005
Figure 6. The effect of surfactant type on the molecular weight of the hydrolyzed chitosan. The chitosan’s concentration, surfactant concentration, and reaction time were 1% (w/v), 7% (w/w), and 24 h, respectively.
Chemengineering 06 00017 g006
Figure 7. UV–Vis spectra of (A) raw chitosan, (B) without surfactant, (C) with span 80 addition, (D) with span 20 addition, (E) with tween 80 addition, (F) with tween 20 addition. The chitosan concentration, surfactant concentration, and reaction time were 1% (w/v), 7% (w/w), and 24 h, respectively.
Chemengineering 06 00017 g007
Figure 8. Scanning electron micrographs of (A) raw chitosan, (B) without surfactant, (C) with span 80 addition, (D) with span 20 addition, (E) with tween 80 addition, (F) with tween 20 addition. The chitosan concentration, surfactant concentration, and reaction time were 1% (w/v), 7% (w/w), and 24 h, respectively.
Chemengineering 06 00017 g008
Figure 9. FTIR spectra of raw chitosan and hydrolyzed chitosan. The chitosan concentration, surfactant concentration, and reaction time were 1% (w/v), 7% (w/w), and 24 h, respectively.
Chemengineering 06 00017 g009
Figure 10. X-ray diffraction pattern of: (A) raw chitosan, (B) without surfactant, (C) with span 80 addition, (D) with span 20 addition, (E) with tween 80 addition, (F) with tween 20 addition. The chitosan concentration, surfactant concentration, and reaction time were 1% (w/v), 7% (w/w), and 24 h, respectively.
Chemengineering 06 00017 g010
Publisher’s Note: MDPI stays neutral with regard to jurisdictional claims in published maps and institutional affiliations.

