1. Introduction
Given the increasing complexity of construction projects, alternative modern architecture and design methods are becoming more relevant and popular. Designers, construction managers, and contractors are able to use BIM for example to complete tasks more efficiently and innovatively to meet the challenges of more modern and complex construction projects, paving the way for further development and professionalization of the construction industry at large [
1,
2].
Since 2007 when the National BIM Standard (National Institute of Building Sciences) was released, BIM been defined as “a digital representation of the physical and functional characteristics of a facility” [
3]. According to another study, BIM is “a tool that enables storage and reuse of information and domain knowledge throughout the lifecycle of the project” [
4]. In other words, it expresses the use of basic databases to summarize construction facilities while taking into account the opinions of stakeholders [
5].
BIM benefits are distributed throughout the construction lifecycle (pre-construction, construction, post-construction) [
6]. In addition to being a digital representation of a construction project, BIM also involves a process of sharing information to facilitate informed decision-making throughout the lifecycle of a project. The term “virtual design and construction” (VDC) is also used in the industry to refer to BIM [
7]. Moreover, it enhances the construction in place value (output) regarding the dollar value of materials and labor (input), which leads to efficient productivity [
8].
During the last few years, BIM adoption in the construction industry has varied from country to country. The United States (USA), United Kingdom (UK), Canada, and Denmark represent the highest levels of BIM adoption, followed by Australia and China [
6]. Despite the need, BIM adoption in the Middle East is slow or non-existent, owing to deep roots in traditional practices and an unchanged culture [
9]. Despite this, we cannot ignore the need and advantage of adopting new technology and keeping up with technological advancements.
Presently, the COVID-19 crisis has heavily impacted the economies of both developed and developing countries over the past two years, spurring greater impetus to develop high-value sectors. In Jordan and elsewhere, this includes a focus on sectors such as agriculture, construction, and industry that account for the majority of the country’s Gross National Product (GDP). The construction sector in Jordan, for example, ranks second after agriculture in terms of job opportunities and employment, employing 6.6% of the national workforce and contributing approximately 4.4% of Jordan’s GDP [
10,
11]. However, this sector is vulnerable to economic shocks and fluctuations and, as such, there is a need to improve the way the Jordanian construction sector is managed. In this context, BIM offers opportunities for a faster and more efficient process with better design, cost control, document quality improvement, and project duration reduction. As such, it holds great potential to address many of the issues facing the construction industry in Jordan, such as delay, cost overrun, safety, waste materials, communication, and cooperation [
8,
12,
13]. However, to date, few studies in Jordan have investigated the awareness of BIM and the barriers to its implementation across among various companies. Thus, this study attempts to define the barriers to BIM implementation, provide a platform for evaluating its importance, and develop a one-way ANOVA to define the variations among AEC companies in relation to the identified barriers.
The study was structured as follows:
Section 2 presents a review of the literature on the definition, needs, and common barriers to BIM. More information about the study methodology can be found in
Section 3.
Section 4 provides a high-level overview of the results and analysis.
Section 5 also contains a more in-depth discussion and comparison of the results.
Section 6 contains a conclusion and recommendations.
2. Literature Review
2.1. Defining BIM
BIM is a broad concept that has been defined in a variety of ways in the literature. The process as a whole is broadly understood as one of creating and managing a digital representation of a built asset whose physical and functional characteristics serve as a reliable foundation for decision-making [
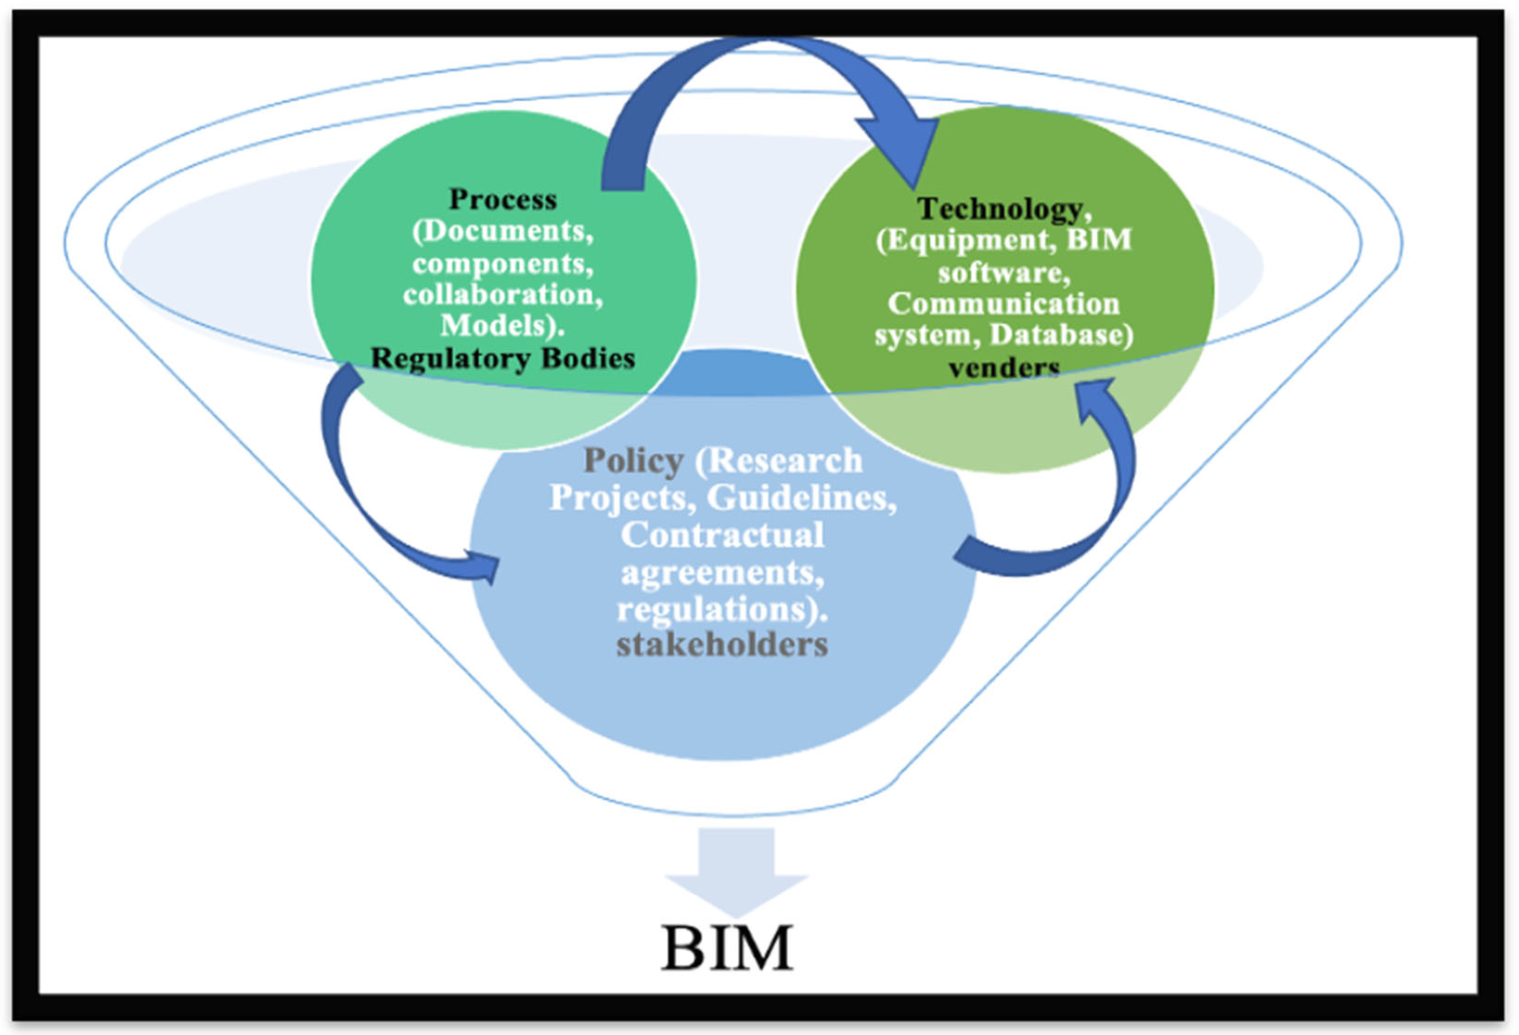
14]. BIM is divided into three interconnected fields, as illustrated in
Figure 1: policy, process, and technology. The interaction of the three fields results in a methodology for managing building design and project data in a digital format throughout the building’s lifecycle [
15,
16]. Moreover, BIM is a fundamentally different way of creating, using, and sharing building lifecycle data [
17].
Other studies consider BIM to be a philosophy for managing and accessing common building data and information that is used from the requirements phase to the decommissioning phase of the building lifecycle [
18].
BIM is, primarily, a three-dimensional digital representation of a building and its key features. It is made up of intelligent building blocks for each object, such as data properties and parametric rules [
19]. In doing so, BIM simulates the construction project in a virtual environment. A building information model, or an accurate virtual model of a building, is digitally constructed using BIM technology. When finished, the building information model contains precise geometry as well as relevant data to support the design, procurement, fabrication, and construction activities required to realize the building [
17].
Despite the complexity of construction, BIM has the advantage over the usual methods for construction estimation [
20]. Using BIM models rather than traditional CAD, quantity surveys, material takeoff, and other measurement methods will save time [
21]. Additionally, the cost is very important in all phases of the construction lifecycle. The usual method used to estimate this is quantity takeoff, which usually done using 2D software and traditional manual takeoff from drawings. These methods take more time, are described as being less accurate, are difficult to discuss with stakeholders, and sometimes lack detail in some areas. BIM has gained popularity in the construction industry because of smart problem-solving and helping with sharing knowledge between all the construction participants [
22]. The following sections illustrate more BIM benefits.
2.2. Addressing Needs
The AEC industry has long sought methods to reduce project costs, increase productivity and quality, and shorten project delivery times. Considering this and the potential benefits of BIM, several studies have been conducted to assess the impact of BIM on the construction industry [
8,
23].
The advantages of BIM are not limited to the geometric modeling of building performance, but also to project management. The most frequently identified benefits of using BIM are related to cost and time reduction throughout the construction lifecycle [
24]. Moreover, according to a study by South Australian development organizations, there are significant benefits with regard to improved constructability, visualization, productivity, and decreased long-term risk due to improved predictability [
25].
The growing interest in BIM can be seen in tandem with new project management frameworks such as Integrated Project Delivery (IPD), which increases the need for closer collaboration and more effective communication [
26]. Paper documents are generally used when discussing any phase or feature of construction projects. However, BIM has contributed significantly to the virtualization of traditional paper-based construction tools, allowing for greater efficiency, communication, and collaboration than traditional construction processes [
24,
26,
27].
In addition, BIM is considered to be a method for evaluating technologies that aid in the management of digital information throughout the project lifecycle. This has supported improving quality assurance, time management, risk detection, collaboration, and communication. In addition, the most practical benefit of BIM is in the areas of safety and waste reduction [
3]. Some studies in the Jordanian construction industry have claimed that BIM can reduce rework and design errors during construction, therefore increasing productivity. At the same time, BIM enhances the collaboration and communication between different teams in a construction project [
28,
29].
2.3. BIM Barriers
Despite these advantages, BIM is perceived differently within construction industries across different countries [
30]. Examining these perceptions has been viewed as a necessary step for enhancing BIM implementation. Considering this, researchers have worked to identify key barriers to BIM adoption in various developed and undeveloped countries.
The common challenges facing BIM adoption are related to the huge cost investment and benefits that are insufficient compared to the cost, and an unwillingness to start new technology, according to the results of a study representing respondents from the USA, Canada, the UK, Ghana, China, India, Australia, and South Africa [
31].
On the other hand, despite knowing of BIM importance, the most common reason for some AEC companies in Spain not to use BIM is related to the expense of software, owner refusal, a lack of qualified people, and company unreadiness to start using it [
32]. A survey of Ireland enterprise agreed with these results, and added the unavailability of standard tools and some problems related to data ownership [
33].
Another study discussed the barriers of BIM adoption in China, Indonesia, Pakistani, India, Sir Lanka, Vietnam, and Thailand, which highlighted the cultural resistance and long process as major barriers, in addition to the lack of awareness, high cost investment and uncertainty about the return on investment (ROI) [
34]. The construction industry in New Zealand has similar results when it comes to BIM adoption [
35].
In Jordan, the literature identifies the key challenges preventing the adoption of BIM in the construction industry as lack of government support, lack of awareness, industry resistance, lack of demand, and cost of implementation [
28,
29]. Comparatively, in Iran, the lack of trained personnel, proper social infrastructure, available guidance, and government support were identified as the most significant barriers to adoption of BIM [
7].
Another study looking at implementation in Nigeria identified the most significant barriers as low support from top management, cost of BIM, cost of software training issues, incompatibility between construction professionals, legal and contractual, and culture-related issues [
36]. The availability of studies on BIM and lack of knowledge has also been considered a critical factor to adopting BIM [
37]. Other studies in Nigeria looking at contractor firms concluded that cost of the hardware and BIM software, cost of BIM training, and cost of BIM specialists and additional staff recruitment were the primary challenges to BIM adoption [
38].
Research on BIM adoption in Ethiopia comparatively identified the lack of professionals, unavailability of proper training, lack of ready stakeholders, lack of guidelines/standards for implementation, and high investment and software cost as top barriers [
39]. Furthermore, a study in Malaysia concluded that the lack of a skilled and experienced workforce is a key reason BIM implementation has failed [
40]. Other important barriers included the nature of the construction industry, which frequently depends on fragmenting the work between different parties, lack of attention from policy makers, lack of knowledge about the BIM process, and inadequate guidelines [
41]. To better capitalize on the benefits of BIM, a study in the US identified that cost/benefit analysis, awareness raising, and education and training were important activities to address the shortfalls in BIM uptake [
24].
In addition to these studies above, other studies have made similar conclusions about the barriers to BIM adoption, where the majority identified cost as the most significant barrier (including a cost of investment, cost of training, and cost of software), followed by barriers related to management, technology, culture, and demand. Comparatively, barriers related to BIM guidelines, standards, and processes are less frequently stated [
42,
43,
44,
45,
46,
47,
48,
49,
50,
51].
Table 1 shows the barriers to BIM implementation.
3. Research Methodology
3.1. Research Design and Data Collection
Although BIM as a state-of-the-art technology in Jordan is not particularly new, key barriers within AEC companies have slowed the extent to which it has been adopted. Considering this, the main objective of this study is to define barriers to implement BIM in Jordanian AEC companies. As such, this study sought to build a questionnaire from a rigorous literature review to understand BIM definitions, industry benefits, and previously identified barriers to implementation. The questionnaire method is useful in a descriptive and knowledge study; additionally, it is the most effective method for analyzing quantitative and qualitative data that collect attitudes and opinions [
52].
The initial draft of the questionnaire was reviewed by two academic professors in the construction management field and three consultants in the design and construction site field with more than 15 years of experience. The final draft was distributed in both Arabic and English after some modifications by email, social media such as LinkedIn, and in person, which was useful in improving the understanding of the state of BIM implementation in the participating Jordanian AEC companies, while also supporting the participants to complete the questionnaire by clarifying certain points with them.
The questionnaire was divided into two sections. The first contained general information about the respondents (company type, academic level, years of experience, and employment title and status). The second section included a list of 20 barriers to BIM implementation in AEC companies based on the literature review (
Table 1). This section focused how respondents respond to these barriers and provided space for them to add additional barriers. A five-point Likert scale was included for each barrier to determine the respondent’s perception on the impact of each barrier. Likert scales are a common evaluation design for overviews that use five or seven levels, ranking quality from high to low (5: always, 4: frequently, 3: occasionally, 2: rarely, 1: never) [
53,
54]. The Statistical Package for Social Science analysis program SPSS, version 24, was used to analyze the collected data.
Relative Importance Index (RII) was used to rank the barriers; this index has been used in many construction studies, including the quantification of delay factors [
55,
56,
57]. The RII is calculated by the below Equation (1):
where:
w = the weight given to each factor by the respondent.
A = the highest weight (5 in this study).
N = the total number of the sample.
Furthermore, one-way ANOVA was used to find unique insight among AEC companies that filled out the questionnaire regarding barriers to BIM implementation.
3.2. Sample and Population
The questionnaire was aimed at four types of companies in Jordan: architecture, management, construction, and quantity surveying. To select the sample of this study, a list of AEC companies registered with the Jordanian Construction Contractors Association (JCCA) and the Jordanian Engineers Association (JEA) was obtained. Then, the sample size calculated using Equation (2) [
58]:
where:
Z = Z value (e.g., 1.96, corresponding to 95% confidence level).
P = Percentage of picking a choice, expressed as a decimal.
C = Margin of error (confidence interval).
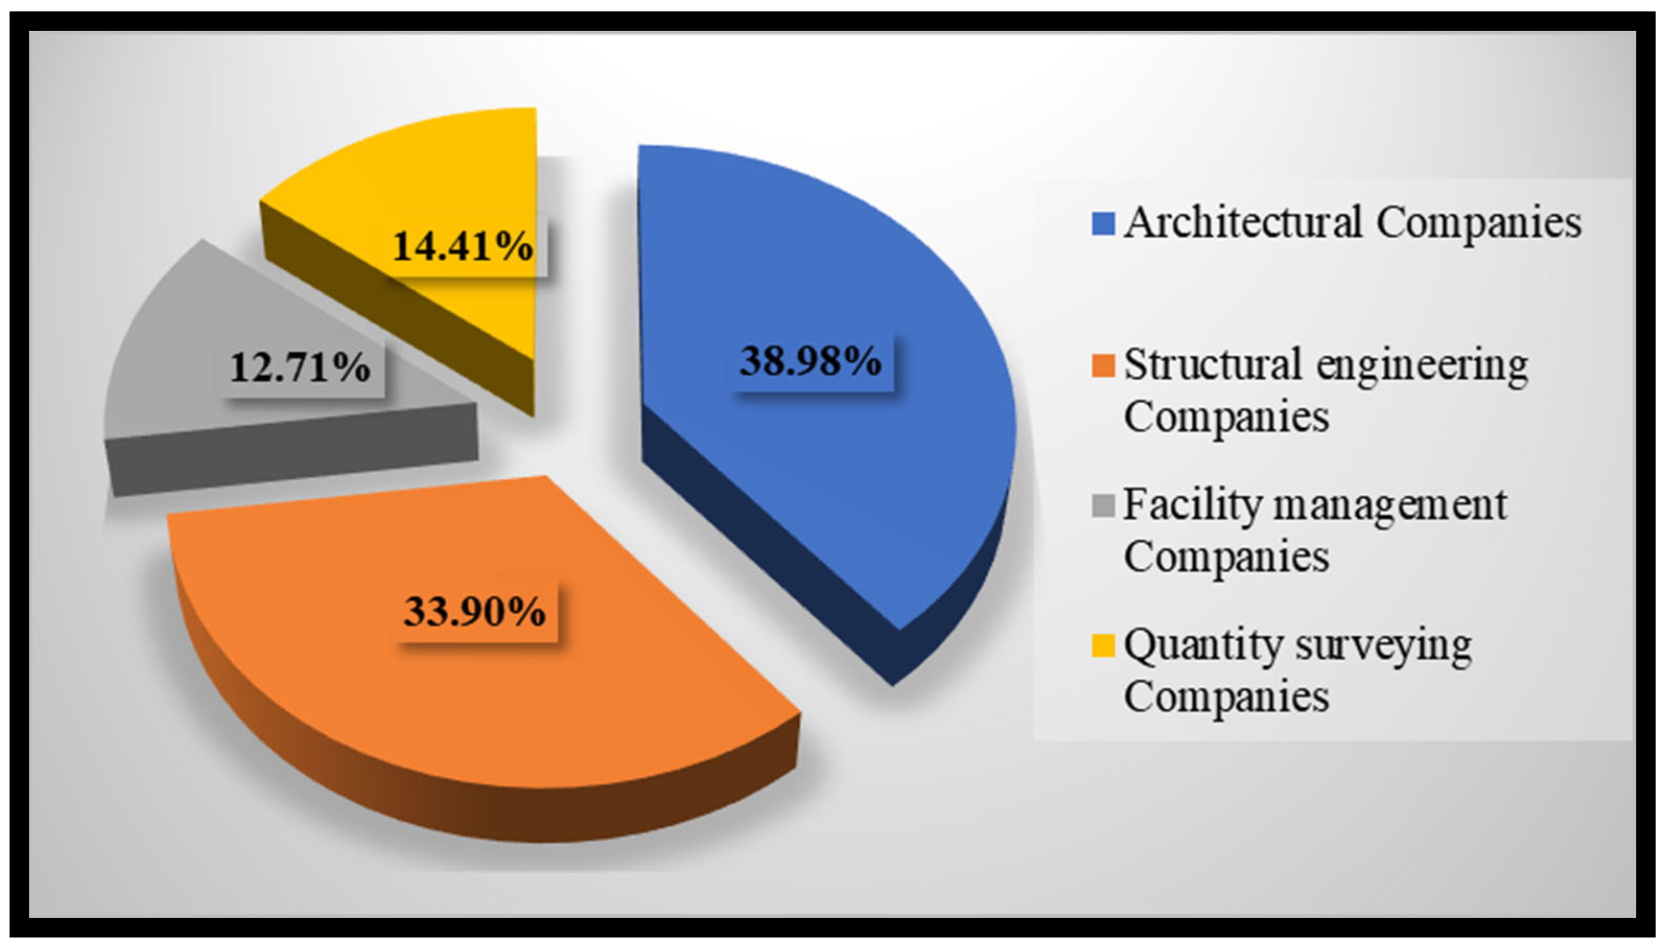
Approximately 150 sets of questionnaires were distributed to the possible respondents at all levels in the AEC companies, and 118 (78.6%) questionnaires were returned and filled completely. As shown in
Figure 2, this included 38.98% from architecture companies, 33.9% from structural engineering companies, 12.71% from facility management companies, and 14.41% from quantity surveying companies.
3.3. Validity Test between Barriers
The process of gathering evidence to support the appropriateness of variables, derived from assessment instrument responses for specific evaluation purposes, is known as validation. The degree to which the evidence supports that the interpretations are correct and that the interpretations are used appropriately is referred to as validity [
59,
60]. This is in addition to academic and consultant opinions to ensure that barriers to BIM implementation are valid. The validity test is applied to these barriers using the SPSS program. To be inserted into the SPSS program for bivariate analysis, the 20 barriers were renamed B1 to B20. The correlation result demonstrated that validity was achieved and that all barriers had a significant value (sig < 0.05). (
Appendix A,
Table A1).
3.4. Reliability Test
The consistency of assessment scores is referred to as reliability. A researcher should expect to receive the same score on a reliable test, regardless of when the assessment was completed, when the response was scored, or who scored the response [
59]. To assess reliability, Cronbach’s Alpha coefficient was used. The coefficient has a value between 0 and 1. A value of 0.6 or more indicates reliability [
61]. A value larger than 0.6 (in this case 0.857), demonstrates consistency.
Table 2 shows Cronbach’s Alpha value for each barrier.
4. Results and Data Analysis
4.1. The Demographic Profile
Table 3 illustrates the demographic profile of the respondents who come from four different types of companies: 38.98% from architecture companies, 33.9% from structural engineering companies, 12.71% from facility management companies, and 14.41% from quantity surveying companies. Furthermore, respondents’ industry experience ranged from 1 to 10 years (32.2% with 1–5 years’ experience, 31.4% with 6–10 years’ experience), followed by 25.4% of respondents with 11–15 years’ experience. Respondents with 16 to 25 years of experience were least represented; however, they contributed to accurate data collection by completing the questionnaire during in-person interview during questionnaire distribution. Most of the respondents have a bachelor’s degree (62.7%), and 37.3% have a master’s degree. In addition, the respondents work in different positions, of which approximately 33.9% are engaged in design work, 28% are engaged in construction work (site supervision and official work), 17.8% work in management (planning, scheduling, cost estimation), 15.3% are employed in technical work (measurement, quantitative survey) and 5.1% are employed in contract work.
4.2. Ranking of the Barriers to BIM Implementation
Across the four types of AEC companies, the top five barriers to BIM implementation are: training costs (B9), software costs (B10), a lack of adequate BIM guidelines (B5), huge BIM upfront investments (B7), and insufficient BIM technical knowledge and awareness (B2), as per the mean value and RII values shown in
Table 4.
Inadequate Internet access and frequent power outages (B15, B16) were the least significant barriers to BIM implementation for the AEC companies in the study. This makes sense in the context of Jordan which, while a developing country, is one of the Middle East’s main competitors in the fields of electricity and the Internet.
As shown in
Table 4 and
Table 5, all AEC companies in the study confirmed the presence of most of the barriers that inhibit implementation of BIM except for legal and contractual obligations (B14), lack of policy-maker support (B19), compatibility and interoperability issues (B18), insufficient Internet connectivity (B15), and frequent power outages (B16), which they did not report to be significant. All the respondents agree that the expense of training and software (B9, B10) are the most significant barriers to BIM implementation in the participating Jordanian AEC companies.
4.3. Variance in Evaluation of the Barriers between AEC Companies in Jordan
One-way ANOVA indicates “the significance of group differences between two or more means, as it analyzes variations between groups and within each group” [
62].
A one-way ANOVA was used to test for differences between the four AEC companies included in the study where, as the results show in
Table 6, the
p-value for most of the barriers is less than 0.05. This means that there are differing opinions among the participating AEC Jordanian companies regarding the barriers. This was true for most of the barriers, except for training and software costs (B9, B10), inadequate client demand (B17), and a lack of policy-maker support (B19), on which there was overall agreement on their significance. To understand the differences of opinion on the remaining 16 barriers, a post hoc analysis was employed.
Appendix B,
Table A2 shows the results of the post hoc analysis using Fisher’s Least Significant Difference (LSD) for the 16 barriers.
According to the mean value and the post hoc results shown in
Appendix B Table A2, the participating architecture companies reported that lack of profits resulting from BIM implementation (B8) is one of the top ten barriers to BIM implementation. On the other hand, other companies, particularly facility management companies, reported that BIM implementation will result in significantly greater profits.
The participating structural engineering companies do not see that the current technology is sufficient (B20), stating that Jordan should adopt new technology, while the architectural and quantitative survey companies reported that current technology is sufficient. Despite this, these three companies have the same assessment of the following barriers: the failure to access appropriate technology and framework (B3), the absence of an enabling environment (B6), employee resistance (B13), and inadequate Internet connectivity (B15). On the other hand, these specific barriers were less significant for facility management companies. Furthermore, the fact that senior management does not support BIM adoption (B1) and that there is a lack of technical knowledge, awareness, and BIM guidelines (B2, B5) is given less weight by the facility management and structural engineering companies, whereas the architecture and quantity surveying companies consider these to be the most significant barriers to BIM implementation.
5. Discussion and Comparison of the Results with Other Studies
To identify the most significant barriers facing the adoption of BIM principles in AEC companies in Jordan, 20 barriers were identified based on the literature review and then incorporated into a questionnaire survey form. The respondents from across four types of AEC companies in Jordan—architecture, structural engineering, facility management, and quantity surveying—participated in this study and in total completed 118 questionnaires. There was no broad agreement among respondents with all the identified barriers, where some scored less than three on a five Likert scale. However, respondents from across each type of company held perceptions on the high significance of the following barriers affecting BIM implementation in Jordan: “the cost of training”, “the cost of software”, “huge BIM upfront investment”, “lack of adequate guidelines”, and “insufficient BIM technical knowledge and awareness”.
This is because it is perceived to be easier to trust traditional methods used in Jordanian AEC companies that have their own software that the employees understand, as opposed to adopting new software with high investment costs despite the potential benefits. Although some engineers in AEC companies are aware of BIM, they have not considered adopting it due to a lack of BIM guidelines, as well as a lack of technical knowledge and awareness of the benefits.
Moreover, all the participating AEC companies listed “the cost of training”, “the cost of software”, and “huge BIM upfront investment” as among the top five barriers in implementing BIM. This is consistent with other similar studies that have identified these barriers as either significant or normal barriers to BIM implementation [
28,
32,
34,
35,
36,
37,
38,
39,
40,
41,
42,
43,
44,
45,
46,
47,
48,
49,
50,
51]. In Jordan, these results are likely because many Jordanian companies work on government-funded projects, while others work on private projects funded by the owner, who is also making decisions regarding the project. Considering this, the government and other approved authorities should subsidize the investment cost of BIM, the cost of software, and staff training. Furthermore, to move towards greater BIM implementation, labor, procedures, and practices need to be changed, all of which require significant investment and industry support. Moreover, Jordan needs to increasingly focus on skills development and training. Unfortunately, in Jordan most construction companies do not provide training to employees, considering it a waste of time and money; this approach will lead to over-reliance on unskilled workers and subsequently influence other industry issues such as delay [
28,
29].
The BIM guidelines are designed to establish an efficient BIM standard to ensure project continuity and provide project owners with the results they want. The guidelines can also have a significant impact on productivity and ensure greater sustainability of overall BIM implementation. Despite this, in Jordan there is a reported “lack of adequate BIM guidelines”. Both participating architecture and structure engineering companies ranked this barrier as the second- and third-highest barriers, while other companies ranked it as the sixth- and seventh-highest; this barrier was also noted in several other studies [
37,
39,
40,
41,
42,
48]. Another significant barrier impeding BIM implementation in Jordan is “insufficient BIM technical knowledge and awareness”, which was ranked first by the architecture companies, fifth by the structure engineering and quantity surveying companies, and tenth by the facility management companies. This problem was also a key barrier identified in many studies across different regions and countries (Iran, UK, Malaysia, Pakistan, Iraq, Hongkong, India, the Middle East) and will only further be compounded by the lack of BIM training institutes and formal education [
27,
37,
40,
46,
47,
48,
49,
50].
6. Conclusions
As BIM evolves and demonstrates its effectiveness in many countries around the world, it is essential to understand the challenges associated with its implementation, particularly in countries where this method is not well known or practiced. This study examined the most significant barriers to BIM implementation within Jordanian AEC companies’ (architecture, structure engineering, facility management, and quantity surveying) opinion. A total of 20 barriers were identified from previous studies and analyzed with appropriate methods.
The results showed that respondents from different AEC companies have similar perceptions about the barriers facing the BIM implementation according to the mean value, which is greater than 3 in most of them. In addition, the most significant barriers were “training cost”, “software cost”, “insufficient BIM technical knowledge and awareness”, “lack of adequate BIM guidelines” and “huge BIM upfront investment”. As shown in the discussion of the results section, many studies confirm the importance of these same barriers, which encourage the creation of a future global study with the opportunity for meta-analysis.
Moreover, despite some of the differing opinions across the four types of participating AEC companies there is a base level of understanding on the barriers to implementing BIM, as well as broad agreement on the importance of adopting new technologies to continue developing the construction sector.
Considering this, the study recommends the following: the government and specialized companies should develop a plan to better facilitate its adoption in Jordan. The plan should study initial investment as well as software and training costs and importantly include BIM standards and guidelines. In addition, trained and educated engineers with preliminary knowledge of BIM should participate.
Furthermore, BIM should be incorporated into the educational process (architecture college, engineering college), and training courses and workshops should be prepared that address new technology such as BIM in specialist associations such as JEA and JCCA. On the other hand, AEC companies can collaborate with companies from other countries that have adopted BIM, which is a good start towards BIM adoption in Jordan.
The results of this study should be considered within the context of its limitations. First, the study considered BIM implementation in general; it did not investigate the barriers for specific BIM tools or techniques such as BIM software for planning and construction management (Think Project, Vico 4D BIM Scheduling (Trimble) etc.), and did not include any hypotheses. Perhaps some future studies will take this into consideration. The second limitation of the study was the use of a questionnaire survey, which, despite its commonality as a method to collect data and study variables, has shortfalls compared to other methods such as interview because it does not allow for the clarification of replies, the collection of more nuanced and thorough data, or the opportunity for participants to contribute their own opinions. The third limitation of this study is that only the opinion of AEC Jordanian companies was taken in this study, even if it included the opinion of the owner and contractors in an indirect way (sample size small). As a future recommendation, other studies must include their opinions in a direct way, with all their classifications. Finally, to improve BIM awareness and understanding of BIM, more research is required to identify additional tools and barriers facing BIM education in Jordan.
According to the problem statement, which discusses the need for new technology to enhance the construction industry, this has a direct impact on Jordan’s economy. The findings may be useful in improving the management of construction projects not only in Jordan, but also in other countries with similar circumstances. On the other hand, this study can also help AEC companies gain an understanding of the barriers they currently face or may face in BIM implementation. As a result, they should consider these in their planning to adopt and implement BIM. Furthermore, this research can help the government and specialized associations gain knowledge about BIM and begin recommending it in education and training programs.


