
Clinical and Genetic Characteristics of Early and Advanced Gastric Cancer

Abstract
1. Introduction
2. Materials and Methods
2.1. Sample Preparation and DNA Extraction
2.2. Library Preparation and Gene Panel Sequencing
2.3. Bioinformatic Analysis
2.4. Determination of Microsatellite Instability Status
2.5. Statistical Analysis
3. Results
3.1. Clinicopathological Characteristics
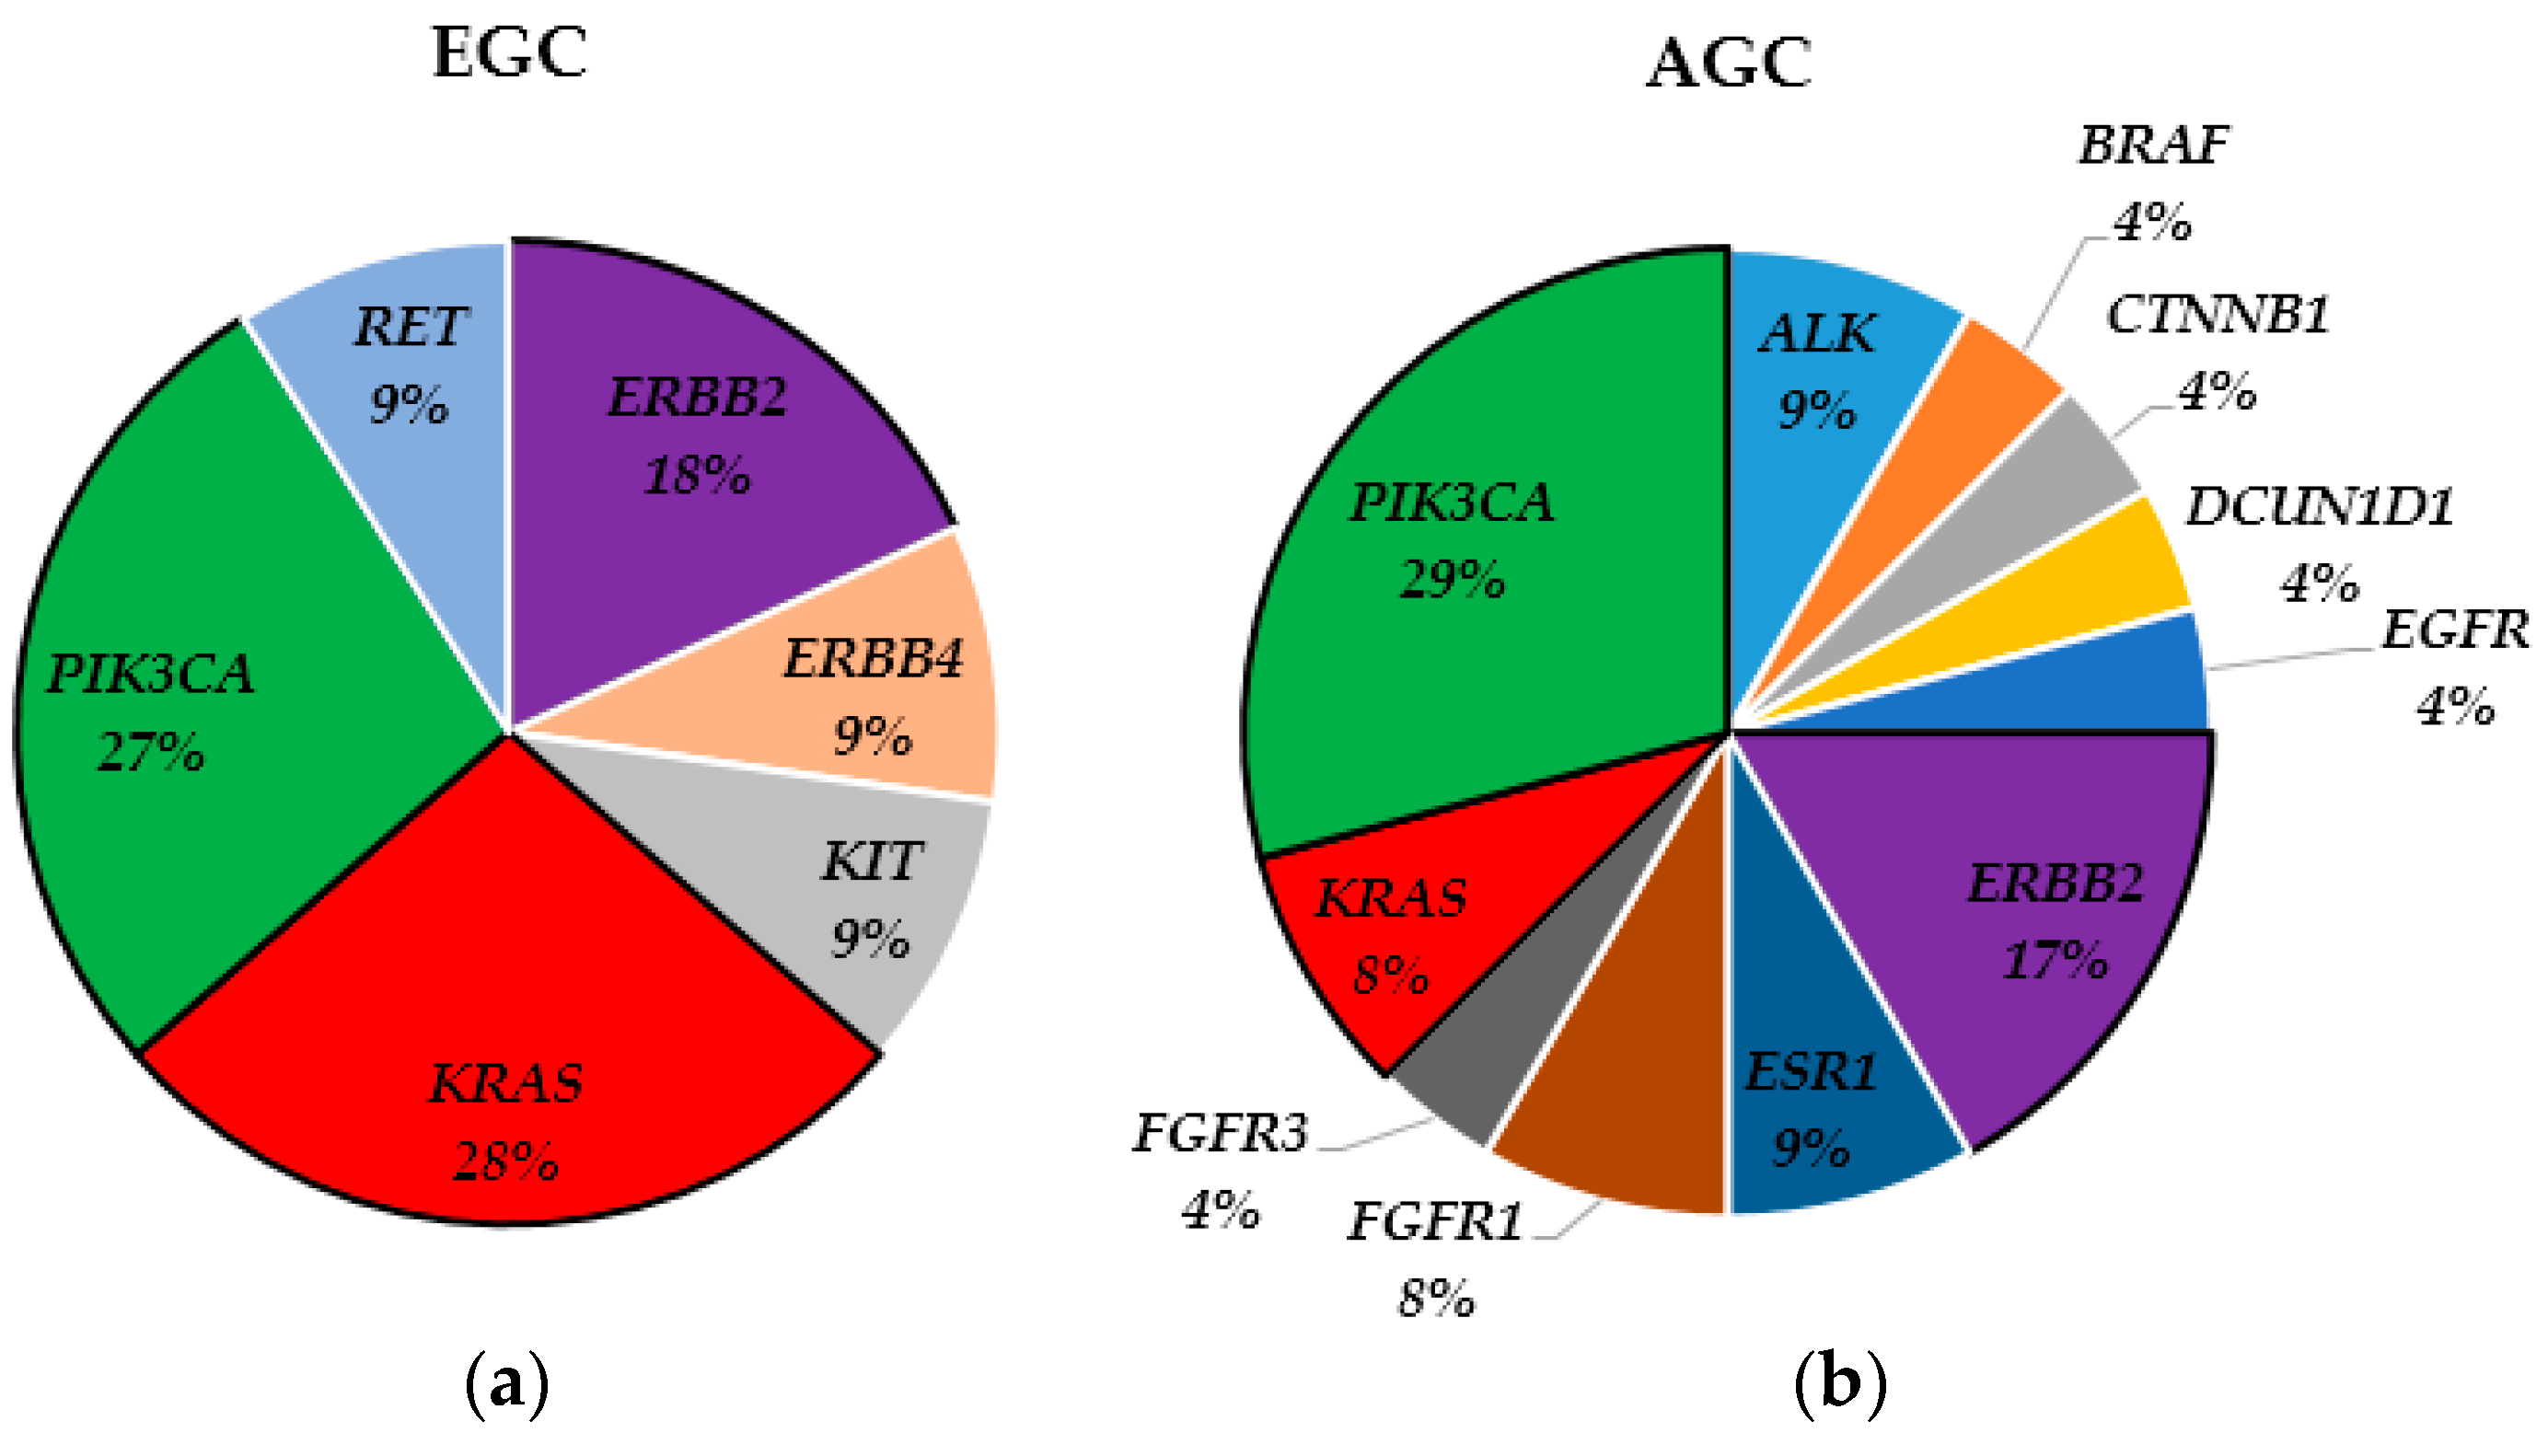
3.2. Landscape of Somatic Mutations
3.3. Microsatellite Instability Status
4. Discussion
5. Conclusions
Author Contributions
Funding
Institutional Review Board Statement
Informed Consent Statement
Data Availability Statement
Conflicts of Interest
References
- Yusefi, A.R.; Bagheri Lankarani, K.; Bastani, P.; Radinmanesh, M.; Kavosi, Z. Risk Factors for Gastric Cancer: A Systematic Review. Asian Pac. J. Cancer Prev. 2018, 19, 591–603. [Google Scholar] [CrossRef] [PubMed]
- Zhang, X.Y.; Zhang, P.Y. Gastric cancer: Somatic genetics as a guide to therapy. J. Med. Genet. 2017, 54, 305–312. [Google Scholar] [CrossRef] [PubMed]
- Hong, S.; Won, Y.J.; Lee, J.J.; Jung, K.W.; Kong, H.J.; Im, J.S.; Seo, H.G. Cancer Statistics in Korea: Incidence, Mortality, Survival, and Prevalence in 2018. Cancer Res. Treat. 2021, 53, 301–315. [Google Scholar] [CrossRef]
- Information Committee of the Korean Gastric Cancer Association. Korean Gastric Cancer Association-Led Nationwide Survey on Surgically Treated Gastric Cancers in 2019. J. Gastric Cancer 2021, 21, 221–235. [Google Scholar] [CrossRef]
- Cai, H.; Jing, C.; Chang, X.; Ding, D.; Han, T.; Yang, J.; Lu, Z.; Hu, X.; Liu, Z.; Wang, J.; et al. Mutational landscape of gastric cancer and clinical application of genomic profiling based on target next-generation sequencing. J. Transl. Med. 2019, 17, 189. [Google Scholar] [CrossRef]
- Park, H.Y.; Kwon, M.J.; Kang, H.S.; Kim, Y.J.; Kim, N.Y.; Kim, M.J.; Min, K.W.; Choi, K.C.; Nam, E.S.; Cho, S.J.; et al. Targeted next-generation sequencing of well-differentiated rectal, gastric, and appendiceal neuroendocrine tumors to identify potential targets. Hum. Pathol. 2019, 87, 83–94. [Google Scholar] [CrossRef]
- Watanabe, M.; Kuwata, T.; Setsuda, A.; Tokunaga, M.; Kaito, A.; Sugita, S.; Tonouchi, A.; Kinoshita, T.; Nagino, M. Molecular and pathological analyses of gastric stump cancer by next-generation sequencing and immunohistochemistry. Sci. Rep. 2021, 11, 4165. [Google Scholar] [CrossRef] [PubMed]
- Machlowska, J.; Maciejewski, R.; Sitarz, R. The Pattern of Signatures in Gastric Cancer Prognosis. Int. J. Mol. Sci. 2018, 19, 1658. [Google Scholar] [CrossRef]
- Polom, K.; Marrelli, D.; Smyth, E.C.; Voglino, C.; Roviello, G.; Pascale, V.; Varas, J.; Vindigni, C.; Roviello, F. The Role of Microsatellite Instability in Positive Margin Gastric Cancer Patients. Surg. Innov. 2018, 25, 99–104. [Google Scholar] [CrossRef]
- Dai, X.; Zhang, X.; Yu, J. Clinicopathological features and Borrmann classification associated with HER2-positive in primary gastric cancer. Clin. Exp. Gastroenterol. 2019, 12, 287–294. [Google Scholar] [CrossRef]
- Wadhwa, R.; Song, S.; Lee, J.S.; Yao, Y.; Wei, Q.; Ajani, J.A. Gastric cancer-molecular and clinical dimensions. Nat. Rev. Clin. Oncol. 2013, 10, 643–655. [Google Scholar] [CrossRef] [PubMed]
- Willems, L.; Tamburini, J.; Chapuis, N.; Lacombe, C.; Mayeux, P.; Bouscary, D. PI3K and mTOR signaling pathways in cancer: New data on targeted therapies. Curr. Oncol. Rep. 2012, 14, 129–138. [Google Scholar] [CrossRef]
- Cristescu, R.; Lee, J.; Nebozhyn, M.; Kim, K.M.; Ting, J.C.; Wong, S.S.; Liu, J.; Yue, Y.G.; Wang, J.; Yu, K.; et al. Molecular analysis of gastric cancer identifies subtypes associated with distinct clinical outcomes. Nat. Med. 2015, 21, 449–456. [Google Scholar] [CrossRef]
- Cancer Genome Atlas Research Network. Comprehensive molecular characterization of gastric adenocarcinoma. Nature 2014, 513, 202–209. [Google Scholar] [CrossRef]
- Hovelson, D.H.; McDaniel, A.S.; Cani, A.K.; Johnson, B.; Rhodes, K.; Williams, P.D.; Bandla, S.; Bien, G.; Choppa, P.; Hyland, F.; et al. Development and validation of a scalable next-generation sequencing system for assessing relevant somatic variants in solid tumors. Neoplasia 2015, 17, 385–399. [Google Scholar] [CrossRef] [PubMed]
- Shin, W.S.; Xie, F.; Chen, B.; Yu, P.; Yu, J.; To, K.F.; Kang, W. Updated Epidemiology of Gastric Cancer in Asia: Decreased Incidence but Still a Big Challenge. Cancers 2023, 15, 2639. [Google Scholar] [CrossRef]
- Correa, P. Gastric cancer: Overview. Gastroenterol. Clin. N. Am. 2013, 42, 211–217. [Google Scholar] [CrossRef]
- Kuboki, Y.; Yamashita, S.; Niwa, T.; Ushijima, T.; Nagatsuma, A.; Kuwata, T.; Yoshino, T.; Doi, T.; Ochiai, A.; Ohtsu, A. Comprehensive analyses using next-generation sequencing and immunohistochemistry enable precise treatment in advanced gastric cancer. Ann. Oncol. 2016, 27, 127–133. [Google Scholar] [CrossRef]
- Polom, K.; Marrelli, D.; Roviello, G.; Pascale, V.; Voglino, C.; Vindigni, C.; Generali, D.; Roviello, F. PIK3CA mutation in gastric cancer and the role of microsatellite instability status in mutations of exons 9 and 20 of the PIK3CA gene. Adv. Clin. Exp. Med. 2018, 27, 963–969. [Google Scholar] [CrossRef]
- Ramón, Y.C.S.; Sesé, M.; Capdevila, C.; Aasen, T.; De Mattos-Arruda, L.; Diaz-Cano, S.J.; Hernández-Losa, J.; Castellví, J. Clinical implications of intratumor heterogeneity: Challenges and opportunities. J. Mol. Med. 2020, 98, 161–177. [Google Scholar] [CrossRef]
- Delgado-Guillena, P.; Morales-Alvarado, V.; Ramírez Salazar, C.; Jimeno Ramiro, M.; Llibre Nieto, G.; Galvez-Olortegui, J.; Uchima, H. Frequency and clinical characteristics of early gastric cancer in comparison to advanced gastric cancer in a health area of Spain. Gastroenterol. Hepatol. 2020, 43, 506–514. [Google Scholar] [CrossRef]
- Choi, S.; Kim, H.; Heo, Y.J.; Kang, S.Y.; Ahn, S.; Lee, J.; Kim, K.M. PIK3CA mutation subtype delineates distinct immune profiles in gastric carcinoma. J. Pathol. 2023, 260, 443–454. [Google Scholar] [CrossRef] [PubMed]
- Bian, S.; Wang, Y.; Zhou, Y.; Wang, W.; Guo, L.; Wen, L.; Fu, W.; Zhou, X.; Tang, F. Integrative single-cell multiomics analyses dissect molecular signatures of intratumoral heterogeneities and differentiation states of human gastric cancer. Natl. Sci. Rev. 2023, 10, nwad094. [Google Scholar] [CrossRef]
- Chen, J.; Huang, Q.; Li, Y.Q.; Li, Z.; Zheng, J.; Hu, W.; Yang, Y.; Wu, D.; Bei, J.X.; Gu, B.; et al. Comparative single-cell analysis reveals heterogeneous immune landscapes in adenocarcinoma of the esophagogastric junction and gastric adenocarcinoma. Cell Death Dis. 2024, 15, 15. [Google Scholar] [CrossRef]
- Polom, K.; Marano, L.; Marrelli, D.; De Luca, R.; Roviello, G.; Savelli, V.; Tan, P.; Roviello, F. Meta-analysis of microsatellite instability in relation to clinicopathological characteristics and overall survival in gastric cancer. Br. J. Surg. 2018, 105, 159–167. [Google Scholar] [CrossRef]
- Martinez-Ciarpaglini, C.; Fleitas-Kanonnikoff, T.; Gambardella, V.; Llorca, M.; Mongort, C.; Mengual, R.; Nieto, G.; Navarro, L.; Huerta, M.; Rosello, S.; et al. Assessing molecular subtypes of gastric cancer: Microsatellite unstable and Epstein-Barr virus subtypes. Methods for detection and clinical and pathological implications. ESMO Open 2019, 4, e000470. [Google Scholar] [CrossRef] [PubMed]
- Mathiak, M.; Warneke, V.S.; Behrens, H.M.; Haag, J.; Böger, C.; Krüger, S.; Röcken, C. Clinicopathologic Characteristics of Microsatellite Instable Gastric Carcinomas Revisited: Urgent Need for Standardization. Appl. Immunohistochem. Mol. Morphol. 2017, 25, 12–24. [Google Scholar] [CrossRef] [PubMed]
- Corso, G.; Pedrazzani, C.; Marrelli, D.; Pascale, V.; Pinto, E.; Roviello, F. Correlation of microsatellite instability at multiple loci with long-term survival in advanced gastric carcinoma. Arch. Surg. 2009, 144, 722–727. [Google Scholar] [CrossRef]
- Marrelli, D.; Polom, K.; Pascale, V.; Vindigni, C.; Piagnerelli, R.; De Franco, L.; Ferrara, F.; Roviello, G.; Garosi, L.; Petrioli, R.; et al. Strong Prognostic Value of Microsatellite Instability in Intestinal Type Non-cardia Gastric Cancer. Ann. Surg. Oncol. 2016, 23, 943–950. [Google Scholar] [CrossRef]
- Joshi, S.S.; Badgwell, B.D. Current treatment and recent progress in gastric cancer. CA Cancer J. Clin. 2021, 71, 264–279. [Google Scholar] [CrossRef]
- Puliga, E.; Corso, S.; Pietrantonio, F.; Giordano, S. Microsatellite instability in Gastric Cancer: Between lights and shadows. Cancer Treat. Rev. 2021, 95, 102175. [Google Scholar] [CrossRef] [PubMed]
- Paasinen-Sohns, A.; Koelzer, V.H.; Frank, A.; Schafroth, J.; Gisler, A.; Sachs, M.; Graber, A.; Rothschild, S.I.; Wicki, A.; Cathomas, G.; et al. Single-Center Experience with a Targeted Next Generation Sequencing Assay for Assessment of Relevant Somatic Alterations in Solid Tumors. Neoplasia 2017, 19, 196–206. [Google Scholar] [CrossRef] [PubMed]
- Graziano, F.; Fischer, N.W.; Bagaloni, I.; Di Bartolomeo, M.; Lonardi, S.; Vincenzi, B.; Perrone, G.; Fornaro, L.; Ongaro, E.; Aprile, G.; et al. TP53 Mutation Analysis in Gastric Cancer and Clinical Outcomes of Patients with Metastatic Disease Treated with Ramucirumab/Paclitaxel or Standard Chemotherapy. Cancers 2020, 12, 2049. [Google Scholar] [CrossRef] [PubMed]

| Variable | EGC (n = 50) | AGC (n = 50) | p Value |
|---|---|---|---|
| Age (year), mean (range) | 65.5 (34–84) | 65 (39–81) | |
| Gender (n), Male/Female | 31/19 | 36/14 | 0.198 |
| Tumor location (n) | 0.003 | ||
| Upper-third | 6 | 12 | |
| Middle-third | 16 | 2 | |
| Lower-third | 26 | 32 | |
| Whole | 2 | 4 | |
| Lauren classification (n) | 0.015 | ||
| Intestinal | 21 | 30 | |
| Diffuse | 12 | 15 | |
| Mixed | 17 | 5 | |
| Differentiation (n) | 0.689 | ||
| Differentiated | 25 | 27 | |
| Undifferentiated | 25 | 23 | |
| T stage (n), T1/T2/T3/T4 | 50/0/0/0 | 0/9/10/31 | 0.000 |
| N stage (n), N0/N1/N2/N3 | 25/5/7/13 | 10/11/12/17 | 0.015 |
| M stage (n), M0/M1 | 50/0 | 48/2 | 0.153 |
| H. pylori infection (n) | 2 | 5 | 0.240 |
| Mutation status (n) | |||
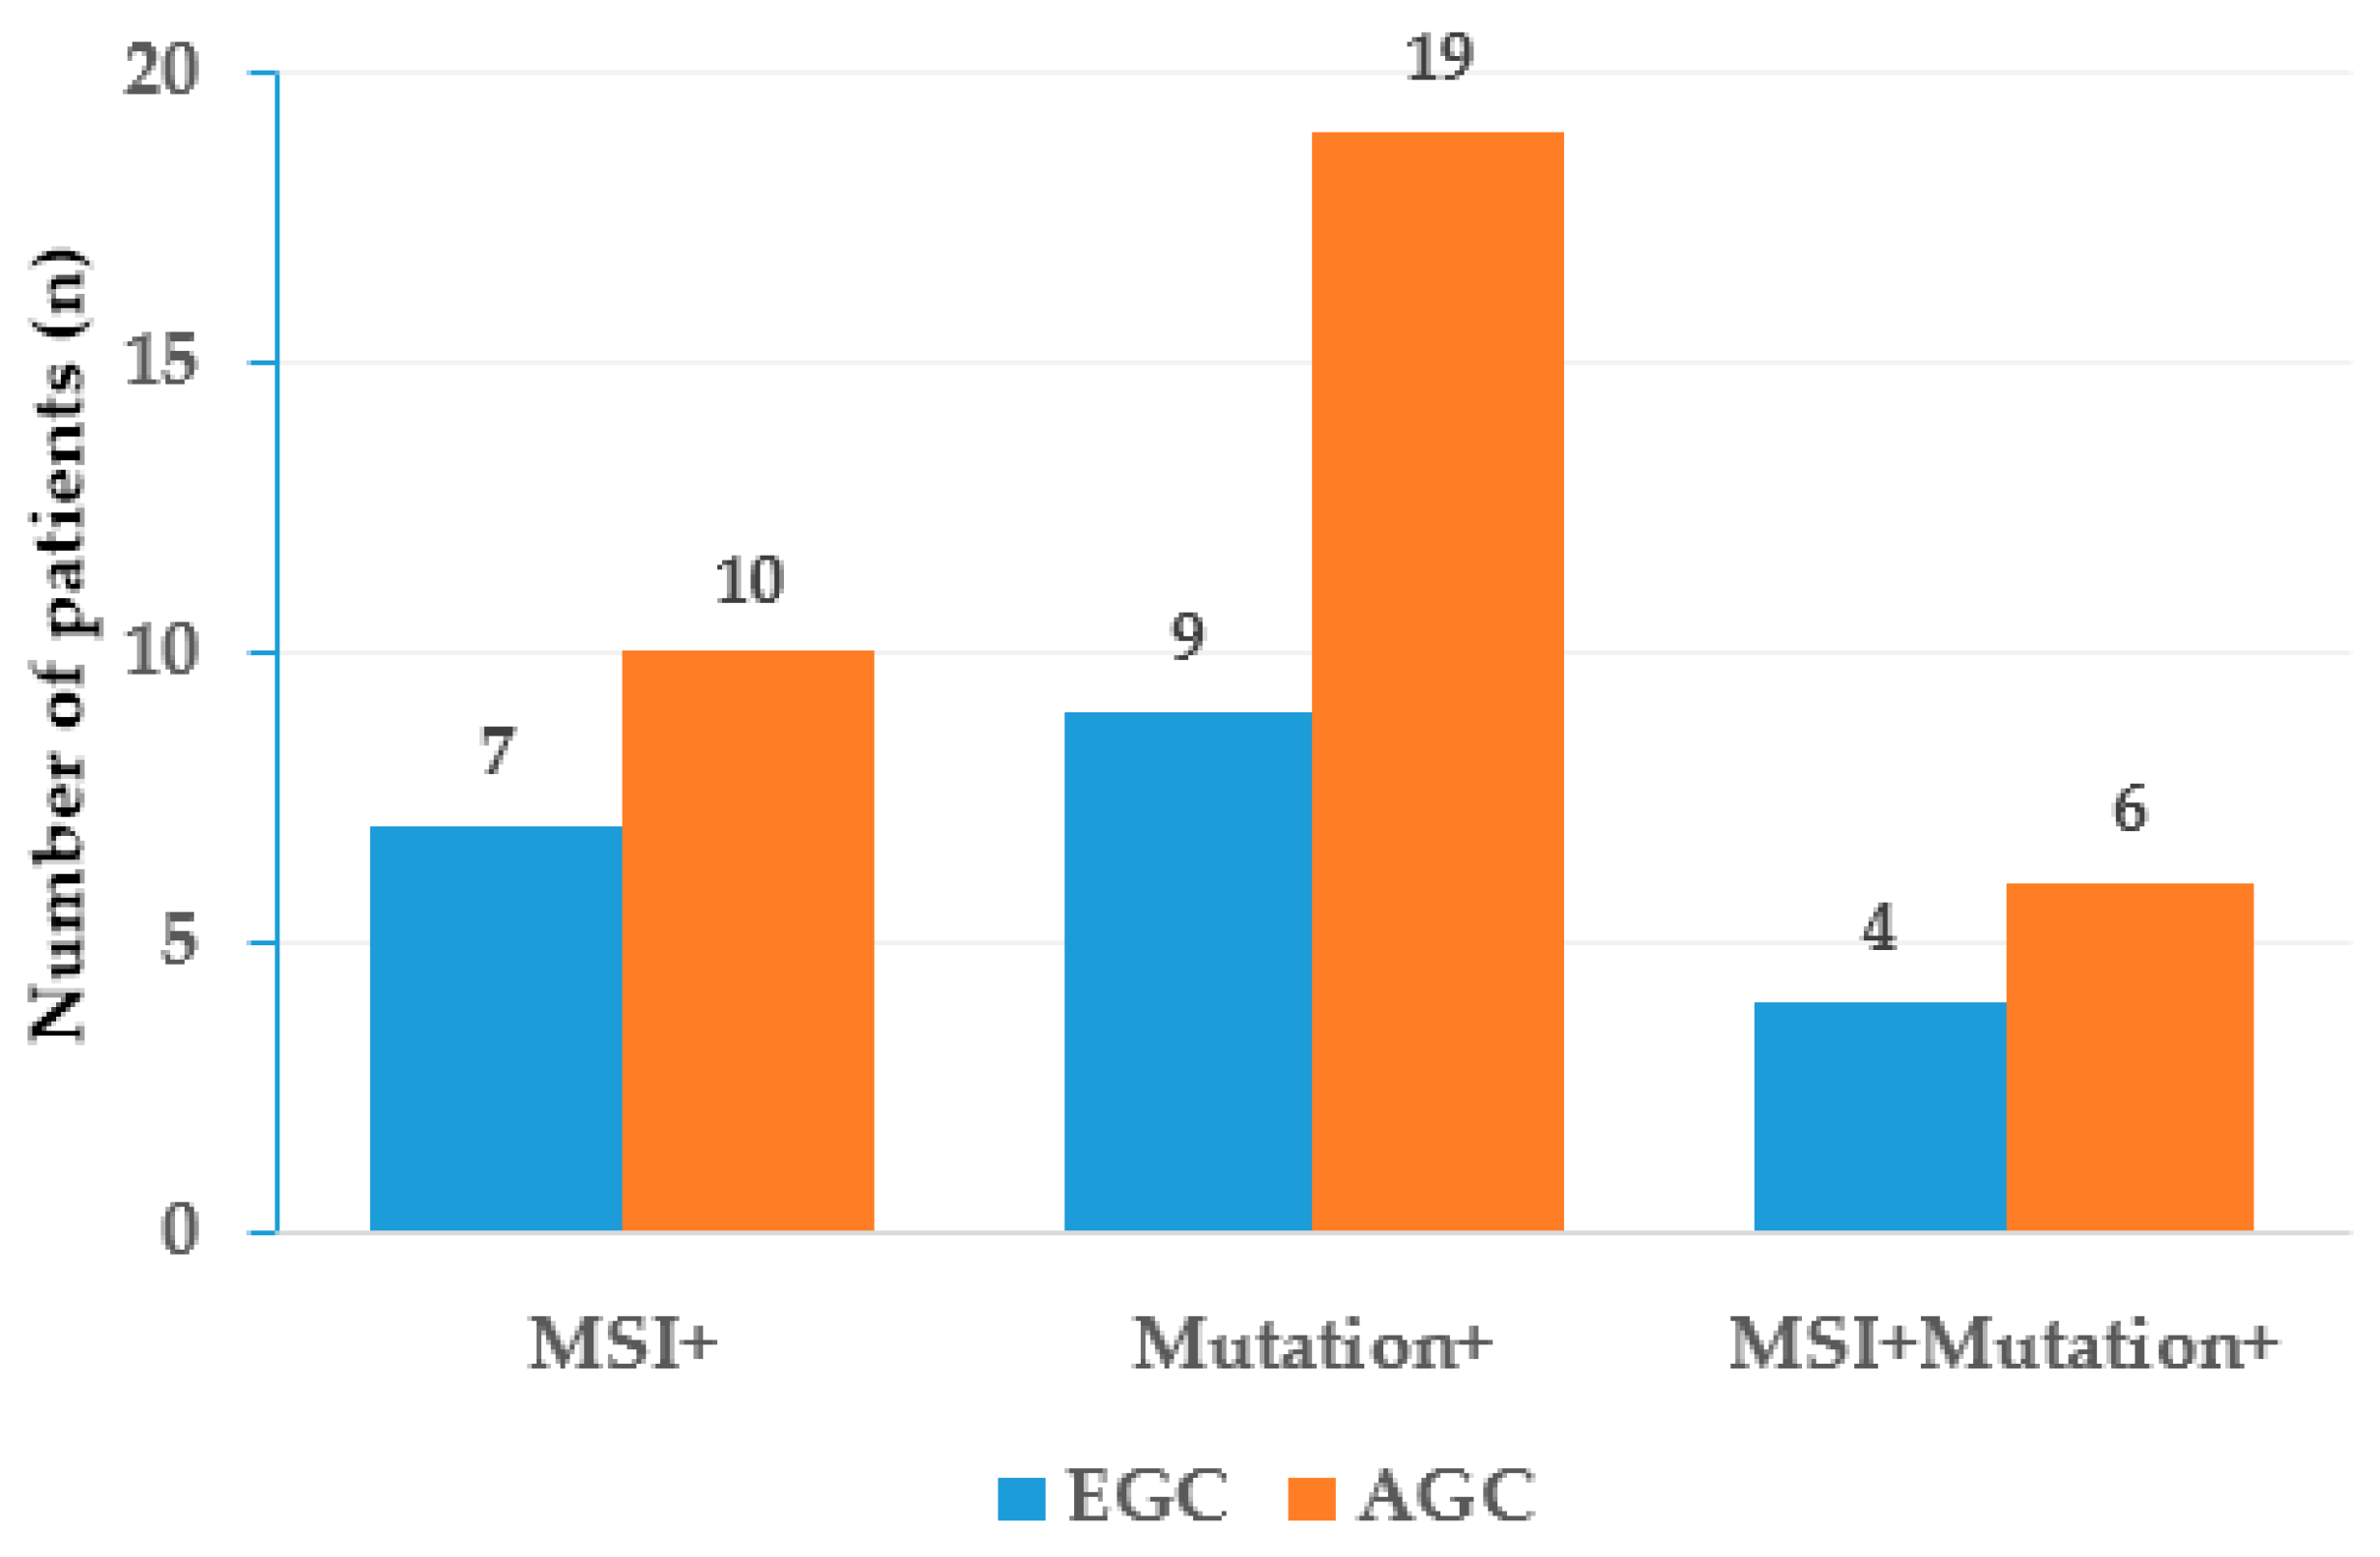
| MSI-positive | 7 | 10 | 0.424 |
| Mutation-positive | 9 | 19 | 0.026 |
| MSI- and mutation-positive | 4 | 6 | 0.505 |
| Sample | MSI | Gene | Reference ID | Base Change | AA Change | Class |
|---|---|---|---|---|---|---|
| EG01 | Neg | KRAS | NM_004985.5 | c.57G>C | p.Leu19Phe | Pathogenic |
| EG04 | Pos | Negative | ||||
| EG08 | Pos | Negative | ||||
| EG10 | Pos | ERBB2 | NM_004448.4 | c.2524G>A | p.Val842Ile | VUS |
| ERBB4 | NM_005235.3 | c.2804A>G | p.Lys935Arg | VUS | ||
| EG14 | Neg | KRAS | NM_004985.5 | c.38G>A | p.Gly13Asp | Pathogenic |
| EG20 | Pos | ERBB2 | NM_004448.4 | c.2524G>A | p.Val842Ile | VUS |
| PIK3CA | NM_006218.4 | c.3140A>G | p.His1047Arg | Pathogenic | ||
| EG21 | Neg | KIT | NM_000222.3 | c.1689A>G | p.Ile563Met | VUS |
| EG31 | Neg | KRAS | NM_004985.5 | c.437C>T | p.Ala146Val | Pathogenic |
| EG37 | Neg | PIK3CA | NM_006218.4 | c.1637A>G | p.Gln546Arg | Pathogenic |
| EG41 | Pos | RET | NM_020975.4 | c.2636delA | p.Asn879Thrfs*4 | Likely Pathogenic |
| EG48 | Pos | PIK3CA | NM_006218.4 | c.1637A>G | p.Gln546Arg | Pathogenic |
| EG49 | Pos | Negative | ||||
| AG02 | Pos | Negative | ||||
| AG03 | Neg | ERBB2 | NM_004448.4 | c.2524G>A | p.Val842Ile | VUS |
| AG09 | Pos | Negative | ||||
| AG10 | Pos | Negative | ||||
| AG11 | Pos | EGFR | NM_005228.5 | c.2227G>A | p.Ala743Thr | VUS |
| ESR1 | NM_000125.4 | c.1652C>T | p.Ala551Val | VUS | ||
| KRAS | NM_004985.5 | c.38G>A | p.Gly13Asp | Pathogenic | ||
| AG13 | Pos | ALK | NM_004304.5 | c.1999G>A | p.Gly667Arg | VUS |
| FGFR3 | NM_000142.5 | c.274delC | p.Gln92Serfs*6 | VUS | ||
| AG14 | Neg | ALK | NM_004304.5 | c.4061G>T | p.Cys1354Phe | VUS |
| AG15 | Pos | PIK3CA | NM_006218.4 | c.325GAA | p.Glu110del | Pathogenic |
| AG16 | Pos | PIK3CA | NM_006218.4 | c.323G>A | p.Arg108His | Pathogenic |
| AG17 | Neg | ERBB2 | NM_004448.4 | c.3149C>T | p.Ser1050Leu | VUS |
| AG18 | Neg | DCUN1D1 | NM_020640.4 | c.19T>G | p.Ser7Ala | VUS |
| AG23 | Pos | PIK3CA | NM_006218.4 | c.325GAA | p.Glu110del | Pathogenic |
| AG27 | Neg | ERBB2 | NM_004448.4 | c.2033G>A | p.Arg678Gln | Pathogenic |
| AG28 | Neg | PIK3CA | NM_006218.4 | c.1633G>A | p.Glu545Lys | Pathogenic |
| AG29 | Neg | ERBB2 | NM_004448.4 | c.3110C>T | p.Pro1037Leu | VUS |
| AG32 | Pos | Negative | ||||
| AG34 | Neg | BRAF | NM_001904.4 | c.98C>T | p.Ser33Phe | Pathogenic |
| AG38 | Neg | FGFR1 | NM_023110.3 | c.2266C>T | p.Arg756Cys | VUS |
| AG40 | Neg | KRAS | NM_004985.5 | c.34G>A | p.Gly12Ser | Pathogenic |
| PIK3CA | NM_006218.4 | c.1633G>A | p.Glu545Lys | Pathogenic | ||
| AG44 | Neg | FGFR3 | NM_000142.5 | c.274delC | p.Gln92Serfs*6 | VUS |
| PIK3CA | NM_006218.4 | c.1390T>G | p.Ser464Ala | VUS | ||
| AG46 | Pos | PIK3CA | NM_006218.4 | c.1633G>A | p.Glu545Lys | Pathogenic |
| AG49 | Neg | BRAF | NM_004333.6 | c.1780G>A | p.Asp594Asn | Pathogenic |
| AG50 | Neg | ESR1 | NM_000125.4 | c.1664G>A | p.Arg555His | VUS |
Disclaimer/Publisher’s Note: The statements, opinions and data contained in all publications are solely those of the individual author(s) and contributor(s) and not of MDPI and/or the editor(s). MDPI and/or the editor(s) disclaim responsibility for any injury to people or property resulting from any ideas, methods, instructions or products referred to in the content. |
© 2024 by the authors. Licensee MDPI, Basel, Switzerland. This article is an open access article distributed under the terms and conditions of the Creative Commons Attribution (CC BY) license (https://creativecommons.org/licenses/by/4.0/).
Share and Cite
Ha, G.W.; Hwang, H.P.; Cho, Y.G.; Park, J. Clinical and Genetic Characteristics of Early and Advanced Gastric Cancer. Curr. Issues Mol. Biol. 2024, 46, 1208-1218. https://doi.org/10.3390/cimb46020077
Ha GW, Hwang HP, Cho YG, Park J. Clinical and Genetic Characteristics of Early and Advanced Gastric Cancer. Current Issues in Molecular Biology. 2024; 46(2):1208-1218. https://doi.org/10.3390/cimb46020077
Chicago/Turabian StyleHa, Gi Won, Hong Pil Hwang, Yong Gon Cho, and Joonhong Park. 2024. "Clinical and Genetic Characteristics of Early and Advanced Gastric Cancer" Current Issues in Molecular Biology 46, no. 2: 1208-1218. https://doi.org/10.3390/cimb46020077
APA StyleHa, G. W., Hwang, H. P., Cho, Y. G., & Park, J. (2024). Clinical and Genetic Characteristics of Early and Advanced Gastric Cancer. Current Issues in Molecular Biology, 46(2), 1208-1218. https://doi.org/10.3390/cimb46020077