Article

Assessing and Monitoring of Building Performance by Diverse Methods

1
School of Engineering and the Built Environment, Edinburgh Napier University, Edinburgh EH11 4BN, UK
2
Department of Construction Management and Real Estate, Vilnius Gediminas Technical University, 10223 Vilnius, Lithuania
*
Author to whom correspondence should be addressed.
Sustainability 2022, 14(3), 1242; https://doi.org/10.3390/su14031242
Submission received: 21 December 2021 / Revised: 14 January 2022 / Accepted: 17 January 2022 / Published: 22 January 2022
(This article belongs to the Special Issue Optimization of Energy Use in Buildings)

Abstract

:
Buildings are one of the largest contributors to energy consumption and greenhouse gas emissions (GHG) in the world. There is an increased interest in building performance evaluation as an essential practice to design a sustainable building. Building performance is influenced by various terms, for example, designs, construction-related factors such as building envelope and airtightness, and energy technologies with or without micro-generations. How well a building performs thermally is key to determining the level of energy demand and GHG emissions. Building standards and regulations, in combination with assessments (e.g., energy modeling tools) and certifications, provide sets of supports, guidelines and instructions for designers and building engineers to ensure users’ health and well-being, consistency in construction practices and environmental protection. This paper reviews, evaluates and suggests a sequence of building performance methods from the UK perspective. It shows the relationships between such methods, their evolutions and related tools, and further highlights the importance of post-occupancy analysis and how crucial such assessments could be for efficient buildings.

1. Introduction

Buildings are one of the largest energy consumers and emitters of carbon dioxide in the world [1]. The level of these terms is correlated with the level of demand and how a building performs. Building performance analysis directs and shows how buildings can be improved in diverse terms. Different groups, for example, government, industry professionals and scientists, use this analysis to develop building regulations intended for existing buildings, new designs, refurbishments, evaluations, and management, for instance. Thus, this research provides an overview of what approved measures in building performance exist in the UK and how they operate. As follows, a number of building criteria are systematically reviewed.

1.1. Historical Context

The UK Government has recognized the environmental impact of buildings since 1985, when “Part L—Conservation of fuel and power” was introduced into the Building Regulations. However, the initial approach was based on functional requirements, and attention was paid to the fabric approach first. The fabric efficiency was calculated via the following method, outlined in the Building Regulations 1995 edition [1]:
  • Elemental method—specific U-values were given for different construction elements;
  • Target U-value method—average U-values were calculated using the total floor area, the total area of exposed elements, the proportion of windows and heating efficiency;
  • Energy Rating method—ventilation rate, fabric losses, water heating requirements, internal heat and solar gains were simultaneously taken into account using the Government Standard Assessment Procedure (SAP).
The Kyoto Protocol in 1997 emphasized the importance of greenhouse gas (GHG) emissions and their role in global warming. EU countries committed to reducing the mentioned emissions by 8% below the 1990 levels during the first committed period (2008–2012), and in the meantime, the UK had a specific target of 12.5% reduction. Consequentially, in 2002, with an upgrade of the building regulation, the energy rating method was abolished and the Carbon Index method was gradually applied instead. In this direction, the Carbon Index limit was set above 8.0 [2]. Thus, this route was changed in 2002 from energy efficiency measurement to a more comprehensive method, with the inclusion of carbon emissions.
In the 2006 edition of Part L, Section 1 on design and construction confronted the significant amendments, and was renamed Section 1 Design Standards. The carbon dioxide (CO2) Target Emission Rate (TER) was introduced as the minimum energy performance requirement for new dwellings. TER can be computed via the following methodologies:
  • The SAP 2005 for dwellings smaller than 450 m2;
  • The Simplified Building Energy model for dwellings greater than the above.
Therefore, TER was assessed for a notional building with the same size and shape as the actual dwelling, and the proposed Dwellings Carbon Emission Rate (DER) must not be greater [3]. To assist the DER reduction, a reasonable limit for designed air permeability was recommended. In 2008, the UK Government passed the Climate Change Act, setting specific emission reduction targets, with an initial goal of reducing carbon emissions by 80% in 2050 compared to the 1990 levels. Nowadays, the actual target is net-zero by 2050. Therefore, over the past few decades, the UK Building Regulations have been adapted to reach the UK Government’s ambitious plan. In 2010, an upgrade of the Part L1A (conservation of fuel and power) was prepared, with a carbon emissions rate calculation according to the new version of SAP in 2009. It guaranteed an improvement of 25% compared to the 2006 standards, in conjunction with U-values for fabric element reduction and air permeability [4]. Later, in the 2013 version, the Target Fabric Energy Efficiency (TFEE) was established alongside TER as the minimum energy performance requirement. Afterwards, TFEE and TER were calculated and analyzed using a new SAP version—SAP2012. As for the TER, TFEE was calculated considering a notional dwelling of the same size and shape [5]:
The next update was published in 2016 with no technical changes. In January 2021, a consultation was begun to abort changes to Part L, and draft guidance was published. Two important concepts introduced in the draft version were the following:
  • The primary energy rate and the target primary energy rate, alongside TER and TFEE. These represent the primary energy used (kWhPE/m2/year) by the dwelling;
  • The near-zero-energy requirements for new buildings state that “where a building is erected, it must be a nearly zero-energy building” [6].
The next part focused on the construction elements (U-values), with further improvements; for example, the air permeability was reduced from 10 to 8 m3/h/m2 at 50 Pa. Moreover, the consultation document looked at the requirements for efficiency and the control of the buildings’ energy systems with self-regulating devices, to be imposed in new and existing dwellings. The specific guidance for energy systems is given in Chapter 6 of the document [6]. Lastly, Chapter 9 of the document looks at the building handover. Consequently, occupants should receive a copy of the Buildings Regulations Compliance Report (BREL), photographic evidence of the build quality, and a Home User Guide with non-technical advice for homeowners regarding how the building’s efficiency is maintained [6].
An example of a building’s improvement history (Table 1) summarizes how the recommended U-values for the construction elements have changed from the first version of Part L (conservation of fuel and power) to the last consultation document, dated January 2021.
It should be noted that “Part L—Conservation of fuel and power” is to be executed on the mainland of the UK. The differences between England, Scotland and Wales are completely negligible [5,7,8].

1.2. Envelope

Technical information, for example, the thermal properties of prefabricated building envelopes, is provided and presented by manufacturers, along with certified laboratory tests. In the laboratory tests, thermal insulation properties are calculated in compliance with the EN ISO 8990:1996 [9] under steady-state conditions. For existing buildings, age and type are used as a starting point, and then energy modeling tools evaluate the building’s performance in different terms. However, with the use of building energy modeling tools, inaccuracies—for example, in determining U-values—might occur due to the uncertainty in the materials’ quantity (i.e., mortar, stones, water) and quality [10].
On-site tests (co-heating, U-value measurements and thermography) can verify the U-values and heat losses using thermal flux equipment and tools. The in situ U-value measurements are described by the ISO 9869-1:2014 [11], and preliminary infrared surveys are usually undertaken to reduce heat loss through thermal bridges [12]. Sensors are placed on both sides of the element (i.e., wall) and the results are monitored, with internal and external temperatures recorded. The minimum duration for the test is 72 h, while the indoor temperature is kept steady [13]. Despite the long time required to undertake an on-site test and the costs associated, in both new and existing buildings, discrepancies have been figured out between theoretical U-values and the ones obtained on-site. Therefore, diagnostic tests become crucial to evaluate the real energy efficiency of existing buildings [14], and to verify the envelope performances of new buildings that have the scope to be highly energy efficient [15].

1.3. Airtightness

Airtightness could be described as a building’s ability to maintain heat and avoid extra air infiltration through leaks [16]. Air leakage could affect up to 50% of the heat loss in cold climate countries [17]. Typically, air leakage occurs in joints between two or more building elements (i.e., wall–window, roof–wall, floor–wall), or holes used for services [17]. Design, specifications, construction details and materials are the main factors that influence airtightness [18]. However, human mistakes and issues related to management processes and quality control could considerably affect the level of airtightness [17,18].
It should be noted that methods of building construction, such as off-site construction, could guarantee a higher airtightness level due to the reduction in on-site operations, tests, etc. [19]. Timber frame constructions could have a lower level of airtightness due to failures in installing services or fitting doors and windows [20]. Cavity masonry walls are even more prone to low-quality human instalment [18]. Moreover, the level of air leakage could be associated with the building typology [21], with flats having more air leakage on the ground and top floors, but a higher airtightness level than houses [18]. Building regulations worldwide recommend a specific level of airtightness, with on-site tests used to evaluate the building infiltration rate. The infiltration is measured using a fan pressurization method, also known as the “blower door test”, described by the EN ISO 9972:2015 [22]. The effectiveness of the blower door test has been recognized by various standards and is widely used [23]. However, the test results might be highly influenced by weather conditions [24]. The high speed of the wind and the difference between internal and external temperatures invalidate the test [24]. Furthermore, according to [23], the test results might be affected by the use of different blower door models, which perform differently according to the flow range.

1.4. Indoor Air Quality (IAQ) and Ventilation

Indoor air quality (IAQ) is related to the health and comfort of building occupants, and building ventilation is considered a key factor to achieving a good level of IAQ [25]. Moreover, ventilation is crucial for the well-being of the occupants [17]. Despite the great advantage of airtight buildings reducing or minimizing a building’s energy demand, the indoor air quality could be affected undesirably, with higher risks of moisture [26]. Other impacts, such as excess radon, volatile organic compounds, or overheating, might occur [27].
Thermal insulation, airtightness, and efficient heating systems are among the energy measures that could affect IAQ [28]. An example of the effect of ventilation on occupants’ health is that if the ventilation rate is not adequate, the risk of adult asthma for occupants could rise [27]. Improving a buildings’ ventilation is considered as a strategy to assist the optimal performance in terms of energy consumption and noise level [29]. Consequently, mechanical ventilation and heat recovery systems (MVH) are often used as solutions [27], despite the following areas of concern [30]:
  • Lack of adequate skills in installation;
  • Control and operation uncertainties due to occupants’ behavior;
  • No implementation of occupants’ preferences and needs at the early stage when energy-saving measures are to be placed.
Finally, it can be summarized that building performance evaluation plays a significant role in realizing different solutions to decrease the level of energy consumption and carbon dioxide emission from buildings. In line with the literature review, the different techniques used to assess a building’s performance have not been well reviewed, collected, or examined in a study on the UK case. Therefore, this research focuses on this demand to systematically review different methods that can monitor building performance. This includes the history of buildings’ energy consumption and carbon emissions, building energy modeling tools, surveys and interviews, and assessment schemes. This study also outlines the progress of UK legislation in terms of building regulations.

2. Energy Consumption and Carbon Emissions

It is a fact that there is a link between population growth and energy consumption on micro and macro scales. Data reported in [31] and [32] show the importance of the residential sector for energy consumption. In 2018, it was the third most energy-consuming sector worldwide and the second in the United Kingdom, with space heating representing the greatest final energy consumption [33]. The latest data from 2019 confirm that the building’s operational energy accounts for 35% of the total final energy, and 38% of the total emissions for the whole construction sector [34]. Considering the above, the terms nearly/zero-energy/emission buildings have been designated as a key part of the housing industry and governments’ policies. A nearly-zero-energy building has been defined [35] “as a building that has a very high energy performance”, where “energy performance of a building” is “the calculated or measured amount of energy needed to meet the energy demand associated with a typical use of the building”. On the other hand, a nearly/zero-emission building is defined as a highly energy-efficient and powered building, in which the associated operational emissions are either zero or negative [36].
Despite the two definitions, energy consumption and carbon emissions can be extremely correlated. Thus, buildings should aim to be zero or nearly zero, meaning they should reduce or minimize the energy demand through the design, fabric characteristics, appliance efficiency, and the supply of energy demand through green and/or renewable technologies [37]. Looking at the energy demand, this is influenced firstly by site location, building usage, and outdoor and indoor temperatures [38]. It has been shown [39] that in a small country like the Netherlands, weather variations could result in as much as 2% of gas being used for space heating.
On the other hand, it is suggested [40] that the first step to decarbonizing the building sector is to establish and implement an ambitious code for buildings. Hence, governments such as that in the UK have focused on aspects such as thermophysical properties, insulation, surface treatments and mass, promoting the fabric first approach and passive design strategies [36]. According to Estiri et al. [41], energy needs are considered to be directly proportional to the buildings’ size, with single-family detached dwellings consuming more energy than other building typologies, and different approaches might be necessary to reduce the energy demand. The use of advanced thermal insulation is the most effective measure for both small residential and apartment buildings, and is less effective for non-residential buildings [42].
Thus, establishing a building envelope with energy-efficient windows and a high level of airtightness is considered key to reducing the energy demand and emissions [40]. Other passive design strategies, such as orientation, building form, and transparency ratio, have the capacity to optimize the solar gain depending on the climate conditions of the site. Musall et al. [42] assumed that apartments gain more benefits from solar radiation than small residential buildings, while vice versa, passive cooling is more efficient for small independent dwellings.
All the approaches mentioned previously are considered passive measures, while the use of new and efficient technologies for HVAC systems, hot water, lighting, and appliances are considered active measures [43]. Nevertheless, the use HVAC systems is highly influenced by households’ patterns, incomes, and habits [44].
Once the energy demand has been minimized, no fossil fuel should be used to supply the energy demand for nearly/zero-energy/emission buildings [45]. Therefore, the UK government has pushed its agenda to increase renewable energy sources. However, it is argued [46] that reducing building energy demand must be the driving factor, since technologies might improve over the years, but energy needs would remain almost constant, or increase, if building fabric and occupants’ behavior are not evaluated. With the occupants’ behavior playing a crucial role in building energy consumption, the use of energy management systems (EMSs) [47] has been promoted in the past years, as a strategy to control energy utilization. Thus, EMSs guarantee thermal comfort and air quality in households, optimizing the use of energy through automation and technology [48]. The functions of the EMSs [49] are itemized as:
  • Monitoring, controlling, and communicating building energy consumption;
  • Planning energy consumption according to users’ patterns and needs, looking as well at the energy cost;
  • Managing the energy demand via home appliances, energy storage and renewable systems.
EMSs guarantee lower energy bills, and the other main advantages of the EMSs [50] depend on their objectives, for example, cost minimization, energy consumption minimization, or carbon emission minimization while maintaining indoor thermal comfort.

3. Building Energy Modeling

Building simulation and energy modeling methods were established in late 1970. Due to the high levels of energy consumption and carbon emissions related to the operational period of buildings, energy modeling tools offer promising predictions and calculations of energy demand and usage. Three different methods are generally used for building energy modeling:
  • The traditional approach—white box;
  • The data-driven approach—black box;
  • The hybrid approach—grey box.
The traditional approach is based on thermophysical equations, with data input including architectural and technical drawings, as well as weather data [51]. The white box approach is widely utilized by energy modeling software such as EnergyPlus, TRNSYS, DesignBuilder, and DOE-2. However, two main problems have been identified related to the traditional approach: the first one is the accuracy required to model the building; thus, for complex buildings, inaccuracy might occur and higher modeling skills are needed. The second one relates to the previous point, and is the run-time of simulations [52,53,54]. The data-driven approach is based on historical data input; for example, energy consumption. Therefore, through a statical methodology, the building energy consumption is measured or can be estimated [53].
The main problem associated with the black box approach is the lack of a building’s thermal and physical characteristics information. However, due to its quicker running time, this approach is often used when total energy consumption, electricity demand, and heating/cooling load are required for complex units [52,54,55]. The hybrid approach utilizes both the traditional and data-driven approaches. Thus, the physical models are simplified, and historical data and statistical methods are implemented. However, the results might be affected by the complexity of combining the data utilized [37]. On the other hand, the time required to develop the model is shorter than the traditional approach, with valid building energy performance prediction. For these reasons, the grey box approach has been recognized as the most accurate [53,56,57]. The building energy performance simulation tools can also be classified according to the level of thermal dynamism as steady-state models or dynamic models. In a steady-state regime, average data on the weather and linear programming techniques are used to extrapolate the building’s energy performance [58]. In dynamic models, every time-step of the simulations is taken into account with real weather data. After the European Directives 2010/31/EU and 2012/27/EU, in most European countries, to comply with the legislation, energy modeling tools based on numerical analysis with calculation-based methodologies have been developed. The data required for building energy modeling tools based on a calculations methodology are building location (e.g., geography and the built environment), building physics, HVAC systems, internal heat gains, and the on-site energy systems. Then, the output data can be derived in different formats; for instance, indoor air temperature and quality, and energy demand or consumption.
On the other hand, in dynamic simulations, it is possible to analyze how different variants might affect building energy performance. Thus, the building’s physical properties and dynamic aspects such as weather and occupancy play important roles [56,59,60]. Crawley et al. [61] described the main tools of dynamic simulations, some of which are summarized as follows: BLAST (three main programs of Space Loads Prediction, Air System Simulation and Central Plan), DOE-2 (hourly weather information, building and systems data to forecast building’s hourly energy use and energy cost), EnergyPlus (based on both BLAST and DOE-2; therefore, various time-steps’ energy use and energy cost are estimated), TRNSYS (subsystem approach to analyzing the building energy performance), ESP-r (estimation of a building’s thermal and acoustic performance, which can be used by different users, with a project manager assigning different modules to a third part according to the computational needs), Design Builder (simulation of building energy performance), E-Quest (using three different input wizards: Design Wizard (simple inputs), Design Development Wizard (detailed input), and Energy Efficiency Wizard). Several studies have been conducted on the accuracy of building energy performance software. The findings of [10,55,62,63,64,65,66,67,68,69,70,71] can be considered as follows.
The Passive House Planning Package (PHPP) is the building energy modeling software used to design a Passive House building, and is an essential part of the building design process. As part of the steady-state methodology, it is an accurate tool for assessing the thermal performance of passive houses [63]. Additionally, PHPP has been validated in Ref. [64] based on dynamic simulations results. Moreover, the transparency of the outcomes and the flexibility of the software are its further advantages. Limitations regarding the use of whole house temperature, rather than the zone temperature approach, might increase overheating risks. Furthermore, the energy from renewable resources is considered in the PHPP package, but it is not included in the overall primary energy target, and predicts the operational carbon as the main factor to determine the building’s efficiency in terms of both energy and carbon emissions [46].
Moran et al. [64] compared actual energy in a case study using the PHPP, SAP and IES dynamic simulation models. All three tools overestimated the use of gas and electricity due to a lack of information relative to the occupants (e.g., internal heat gain profiles). However, by using a reduction factor, the results derived with PHPP and with the dynamic simulation were close to the actual energy usage; meanwhile, SAP remained unchanged. Furthermore, Bros-Williamson et al. [65] showed that the climatic change predicted by PHPP was closer to what was recorded. Burford et al. [66] have also highlighted how adopting different building forms and orientations can reduce energy demand. However, these two characteristics are not contemplated in SAP models. Kelly et al. [10] have stated that SAP measures energy cost saving rather than the whole-life energy used by the buildings. Moreover, carbon emission calculation is not an accurate way to determine energy demand/consumption in SAP [62]. Grid electricity does not take into consideration the energy efficiency of the systems adopted. Hence, the risk could be that the design approach does not look at the most efficient way to use energy.
Regarding dynamic simulations tools, Schwartz and Raslan [67] have pointed out the importance of the weather data used in dynamic simulations, and how they could impact the results obtained from the models. Moreover, the main difference in the results is determined by how each component is differently considered. M’Saouri El Bat et. [68] introduced a microclimatic simulation, which is not usually contemplated in dynamic models, to demonstrate the impact and importance of the street canyon microclimate once the building energy consumption has been estimated. The variety of plant systems contemplated in TRNSYS, and the direct incorporation of measurement-based weather, have both been considered advantageous by Nageler et al. [69]. The importance of the modular feature in TRNSYS is emphasized, which allows for more flexibility and more detailed simulations [55].

4. Surveys and Interviews

With the performance gap rising between the development of energy-efficient buildings and occupants’ behavior, the use of surveys and feedback techniques to evaluate building performance and users’ satisfaction is growing exponentially.
One of the first survey methodologies developed was the Building Use Studies (BUS) occupant survey, created in the UK in 1985. Initially, the BUS survey was launched for non-domestic buildings, and in 2010, a version for domestic buildings was established [72]. The BUS methodology employs user questionnaires using a semantic differential scale from 1—Unsatisfactory, to 7—Satisfactory. The scope of the survey is to evaluate the building users’ satisfaction in terms of environmental variants (i.e., thermal comfort, acoustic, lighting) and functional elements such as space layout [73]. Paper questionnaires are one of the key points of the methodology, with online surveys available [72]. Moreover, there is a substantial difference between BUS surveys for non-domestic and domestic buildings. A standard set of data could be used for domestic buildings, but further investigations such as occupants’ interviews might be necessary to understand the context and the needs [74]. As a consequence, surveys for domestic buildings [74]:
  • Might take longer, with BUS survey for non-domestic buildings generally undertaken in one day;
  • Appear more resistant to setting benchmarks to compare the survey’s results, due to the scale of the survey for domestic buildings;
  • Might be inaccurate due to reluctant responses.
Another established survey methodology used widely was developed by the Center for the Built Environment (CBE), University of California, in 1999. The CBE survey was the first to use a web platform to evaluate the Indoor Environmental Quality (IEQ) of buildings, including offices and dwellings. A core module with 60 questions is available, wherein buildings’ environmental and space elements are evaluated. Extra modules that analyze the buildings’ operation systems can also be added upon clients’ requests [75]. As for the BUS survey, a rating scale of seven points is used, with a range from −3 (very dissatisfied) to 3 (very satisfied) [76]. One key difference between the BUS and CBE methodologies is that the last one comprises two surveys to evaluate the users’ satisfaction—one conducted before the occupancy, with occupants evaluating the building before being renovated, and one conducted after six months of occupancy [75]. Furthermore, the CBE surveys allow for comparing the users’ perception of about different buildings that have been constructed using the same energy-efficient principles, and for the above reason, the CBE methodology has been widely used to compare LEED-certified and non-certified buildings, and to prove the effectiveness of “Green” certification (i.e., LEED, BREEAM) [75]. It should also be noted that even though CBE could be utilized for domestic buildings, a recent study conducted by Altomonte and Schiavon [76] asserts that just 1% of the total buildings that have used the CBE survey fall into the category of multi-family residential/dormitory. However, BUS and CBE surveys are the two methodologies used for both domestic and non-domestic buildings. Other questionnaire methods are applied exclusively to evaluate offices buildings, such as Cost-effective Open-Plan Environments (COPE) and the Building Assessment Survey and Evaluation (BASE), PROKLIMA [77,78].
With research based on surveys and questionnaires, qualitative data are produced and used as a fundamental support for extended analyses. For instance, Alexi Marmot Associates (AMA) have developed AMA WorkWare, a tool in which quantitative and qualitative assessments are collected and analyzed. The AMA toolkit aims to improve the collaboration between the parties involved in construction projects and the final users, and contemplates five key methods [79], including web-based questionnaires, space audits, space occupancy surveys, interviews, workshops, and focus groups. In the AMA WorkWare, the Soft-Landing Framework intends to improve building performance using integrated feedback and lessons learnt, and by supporting collaboration between all the parties involved in a project [80]. Published for the first time in 2009, the Soft-Landing Framework includes six stages: (1) inception and briefing, (2) design, (3) construction, (4) pre-handover, (5) initial aftercare and (6) extended aftercare and post-occupancy evaluation. Stage 6 lasts for three years; several surveys are recommended after one year of occupancy, so that users can experience cold and warm seasons, and during the third year, to see if the issues that arose in the previous years have been resolved. On the other hand, during the second year, it is suggested to conduct occupant focus groups, so that occupants can confront each other about the issues that arise [80].

5. Assessment Schemes

5.1. Standard Assessment Procedure (SAP)

The Standard Assessment Procedure (SAP) is an approach used to calculate building energy performance in terms of Energy Efficiency Rate (EER) and Environmental Impact Rating (EIR) [81]. Moreover, energy costs and carbon emissions are estimated. It is based on the BRE Domestic Energy Model (BREDEM) and it was first introduced in 1994, in Part L1A of the Building Regulations for the “Conservation of Fuel and Power” in new buildings [82]. Several versions of SAP have been developed in past years—1998, 2001, 2005, 2009 and 2012, which is the current version used. With the European directive 2002/91/EC, the SAP methodology became the National Calculation Methodology in the UK, used to assess building energy performance and to create the Energy Performance Certificate (EPC) [10].
SAP is based on standardized occupancy behavior assumptions and standardized climate data for the UK [81]. Buildings are rated from 1 to 100, according to the annual energy cost estimated per meter square. The higher the value, the better the buildings are performing. The use of SAP was first focused on new dwellings, and later in 2005 and 2006, the attention of the government was directed towards existing buildings with the creation of the Reduced Data Standard Assessment Procedure (RdSAP) [10]. The RdSAP is based on the SAP model. However, in the RdSAP, standardized values are used, according to the age and typology of the building and its components, including the insulation levels [10]. SAP is based on a steady-state methodology, with fewer inputs required if compared to dynamic tools [83] and [84]. The inaccuracy of the SAP methodology is mainly due to the weather data used and the lack of occupants’ behavior inclusion. The limitations of SAP are related to the estimation of internal temperatures, which are calculated on a monthly basis and are generalized, rather than categorized by room. Despite its limitations, SAP is widely known, and the UK government intends to maintain SAP as the main methodology. A new version of SAP10 was published in 2018, which is still under revision. Some changes should take place in the new version to overcome the problems that arose during the past few years. Some of the changes are summarized as follows:
  • 55% reduction in carbon emissions produced by electricity;
  • Overheating risk increase, with more deep consideration of natural ventilation, which could also be impacted by noise;
  • Building performance calculation could be affected negatively if thermal bridging details are not provided.
The UK government [82] highlighted how changes in emission factors for electricity could have a great impact on the construction sector (e.g., with firms and contractors) using more electrical systems for heating and hot water.

5.2. Energy Performance Certificate (EPC)

Article 11 of the European Directive 2010/31/EU, also known as the Energy Performance Building Directive (EPBD), established that all the Member States should put in place a certification scheme to evaluate the energy performance of their buildings. The energy performance certificate (EPC) would then become common all around Europe. The main aim of EPCs is to rate building energy efficiency from level A (very efficient) to G (inefficient), with calculations made according to the common general framework as per European Directive 2010/31/EU Annex I [35]. Moreover, the European Directive has suggested the implementation of recommendations for improving building energy performance within EPCs [35]. The validity of EPCs should not exceed ten years, and they are mandatory for new buildings or owner(s). The information contained in EPC can be summarized as:
  • The asset rating for the building;
  • A reference value (A to G);
  • Recommendation report;
  • Relevant reference number;
  • Address of the building;
  • The date on which it was issued.
With EPCs, awareness regarding the importance of more efficient buildings has grown not only in the construction sector, but also between sellers, renters and occupants [10]. The labeling approach and the recommendations included in EPC reports have caused a transformation during the past few years, with each European country responding differently in the development and implementation of EPCs in their legislation [85]. Kelly et al. [10] compared the EPCs of three different countries, including the UK, Germany, and Italy. In the UK, EPCs show a normalized scale where unit measures are not expressed, while German EPCs give the details of the energy consumption, as do Italian ones. Moreover, German EPCs compare the energy performance of new and old buildings of the same typology; meanwhile, Italian EPCs show detailed information about the systems’ energy performance (i.e., HVAC, DHW). The limitations of the UK EPCs were also highlighted [10]. Thus, a comparison within the same building typology, as per German EPCs, could overcome the difficulties that owners have in understanding the effectiveness of the suggested measures to improve building energy performance. On the other hand, EPCs in the UK give information about the environmental impact, and the suggested measures are categorized into three different levels, lower and higher cost, plus other measures. Gokarakonda et al. [86] showed that twenty-seven member countries of the European Union, plus the UK, have recommendations in their EPC reports. However, in just sixteen countries (Belgium, Bulgaria, Croatia, Cyprus, Denmark, Finland, France, Germany, Greece, Ireland, Italy, Latvia, Luxembourg, Portugal, Sweden, UK) are the recommendations related to the cost and energy savings. They also analyzed the key barriers to the use of EPCs in different European countries [86]. A lack of understanding of the information, the low level of interest in EPCs of the end-users, and the lack of connection between the information provided in EPCs and the renovation process seem to be common problems across Europe.
According to [87], the high cost in some European countries is related to the need for energy audits to stipulate EPCs. On the other hand, having an accredited body for the certificates establishes their reliability. Reliability is one of the key points for a successful EPC practice, with the other key points including transparency, cost-effectiveness, comparability, functionality/usability, and neutrality.
Gokarakonda et al. [88] looked at how EPCs could be improved to accommodate the stakeholders’ needs, and suggest the priorities should be:
  • Higher validity of the software used for the EPC;
  • Improvement with deep renovation and recommendations of online tools that could compare the different options;
  • An on-site inspection is mandatory.
Consequentially, for improving EPCs across Europe, the strategy should focus on two main areas: deep renovations and EPCs structure and development [89]. EPCs should be more user-friendly, more training for EPCs assessors should be accomplished across Europe, and collaboration with the real estate market should be stimulated [89]. For deep renovations, tools that emphasize their benefits and support the decision-making process are beneficial in reducing energy consumption and carbon emissions in the construction sector. We also consider that deep retrofitting is slow across Europe, despite the introduction of EPCs [89].

5.3. Building Performance Evaluation (BPE)

The concept of a building’s life cycle assessment (cradle to grave) is not linear [90], but a significant phase is the operational phase. Building Performance Evaluation (BPE) evaluates the performance of edifices, not just in terms of energy, but also in terms of environmental conditions and quality for the occupant, by collecting and analyzing quantitative and qualitative data [91]. Hence, BPE is based on the concept of performance, which includes the building’s fabric elements, materials, and construction methods, but also the use of resources such as water and energy, and the impact on the environment, economic system, and quality of life [92]. Considering the abovementioned terms, the Royal Institute of British Architects (RIBA), UK [93], has classified the activities necessary to undertake a BPE as follows:
  • Review of project delivery—at this stage the team and the client experience should be evaluated;
  • Project outcomes, which include interpretation and analysis of the brief;
  • Building use/occupant behavior, which looks at the building fabric and its connection with the building use, and the occupant patterns;
  • Occupant feedback;
  • Energy use;
  • System, including health and safety strategy, ventilation strategy, lighting, water and HVAC systems, control, and maintenance;
  • Environmental performance, a measure of the thermal and acoustic performances, indoor air quality, heat loss, airtightness, and light levels;
  • Comparisons, predicted performance versus the actual one, and use of previous studies;
  • Report, to share with the client and the design team for future references.
Even though the approach suggested by the RIBA [93] looks at the whole building life, for retrofit projects, a different path might be necessary. The Low-Carbon Building Group [94] have performed BPEs for a retrofit project, following different steps, as below:
PHASE I (before retrofit)
  • Design and construction audit, with analysis of quantitative data, such as SAP calculation, and qualitative data, such as photographic surveys and team interviews;
  • Building envelope tests, regarding its thermal properties.
PHASE II (after retrofit)
  • Analysis of the commissioning and handover process;
  • Building energy evaluation;
  • Building environmental conditions, such as internal temperature, relative humidity, and indoor air quality;
  • Analysis of occupant satisfaction, with qualitative data based on interviews, activity logging, and thermal comfort diaries.
Moreover, [94] have highlighted the importance of the involvement of the occupants in both phases I and II. They [94] also showed that almost 91% of the buildings analyzed in their study, subjected to retrofit projects, have suffered from problems related to the commissioning and the handover, especially regarding the use of new technologies, and the lack of information given to the occupants about them. Hence, BPE is based on empirically measurable data and qualitative data referring to the occupants’ satisfaction and the interaction with the environment they are living in. These last aspects have been proven to have a great impact on the building performance, and for the above reasons, more interest in the past years has developed around the BEP [95].
Using BPE, the construction sector needs to focus on five key points for delivering buildings that have a lower impact in terms of energy and GHG emissions [96], as follows:
  • Aspiration, driven by investors and developers, with targets set since the beginning;
  • Control, with collaboration in the supply chain for the contracting and delivery processes;
  • Design for performance;
  • Feedback, to address better delivery and handover;
  • Knowledge improvement for all the parties involved.
Despite the benefits of BPE, there are some issues related to its application. Firstly, there is a lack of policies and incentives, which could cover the costs associated with BPE, and guarantee the efficiency of buildings [97]. Secondly, the lack of collaboration continuity between the design team and the contractor once BPE is over, which could manifest as a lower effectiveness of the BPE [97].

5.4. Post-Occupancy Evaluation (POE)

The Post-Occupancy Evaluation (POE) has its origins in the late 1960s, with a study conducted at the University of Utah, Salt Lake City, UT, USA, where for the first time the occupants’ sensations regarding the environment they were living in were taken into account [90]. Between 1960 and 1980, more studies in the UK, the USA, Canada, and New Zealand analyzed the perceptions of people in the environment they were living, studying, or working in [98].
POE was defined in 1988 [99] as a process to evaluate buildings after they have been occupied for a period. However, the definition of POE might be summarized as the activity(ies) by which building performance is evaluated in parallel with the occupants’ satisfaction [100]. Thus, POE is based on questions that aim to analyze technical and social aspects [101]. It should be carried out at least once after one year [102], while it is suggested that POE should be regularly performed during the whole building life. Due to the “performance gap”, and its connection with the occupants’ behavior, POE plays a key role in understanding the relationship between end-users, resources and the indoor environment, and in helping future building design decisions [98], and in drawing guidelines for the best practice according to the building typology [102]. POE is based on data collection for technical performance, looking at the following key elements [103]: physical systems, environmental systems, adaptability and durability/robustness. The evaluation process of POE follows seven steps [103]:
  • Identify the strategy and needs;
  • Identify the issues to address;
  • Form a statement or brief for the POE;
  • POE planning;
  • POE execution;
  • Report;
  • Actions in response to the POE.
Once the handover is completed, POE evaluates the occupants’ perceptions during the operational phase. There are no specific protocols regarding how POE should be conducted. However, several methods have been used during the past few years. Ref. [103] summarized these methods, as shown in Table 2, with questionnaires and surveys clearly utilized as normal practice.
Despite the increase in interest in POE, limitations of the assessment have been highlighted during the past few years. One of the problems is the cost associated with POE. POE proves the effectiveness of the strategy used by the project lead and the design team to address building performance, and the results associated with POE would benefit the occupants. Thus, if those benefits are introduced and explained to dwellers, they might be included in the cost process [90]. Furthermore, when POE is conducted, expectations increase regarding how the building performance might be improved, and if additional costs are needed, there will be concerns related to budgeting and responsible stakeholders [90]. Even if POE is undertaken, due to the lack of collaboration between different construction phases and stakeholders, it might be difficult to establish responsibility for the success or the failure of the building in achieving its desired performance [98]. Moreover, since POE is based on quantitative and qualitative data, the results might not be generalizable for future references [98].

5.5. Energy Retrofit Measures (ERMs)

Energy retrofitting measures (ERMs) are defined as the changes implemented in buildings to reduce their impact in terms of the three sustainability dimensions: environmental, economic and social [104]. In light of the fact that “roughly 65% of the total expected buildings stock in 2060 are already built today in Organisation for Economic Cooperation and Development (OECD), Paris, France countries” [105], ERMs represent the most feasible and cost-effective approach for reducing the construction sector’s influence on energy demand and GHG emissions [104,106]. Therefore, energy retrofitting measures can be categorized as follows [107,108,109,110]: (1) the demand side, reducing the energy demand through new technologies, (2) the supply side, using renewable energy sources, and (3) the human side, with the connection between lifestyle and energy consumption. A deeper classification was presented in [111], based on monitoring and controlling systems. For example, controlling lighting and ventilation, using efficient energy systems, and identifying occupants’ patterns and the energy usage associated with them. Hence, when selecting specific retrofitting measures, a strategy should be established, with five steps undertaken [108]:
  • Energy modeling and assessment, through surveys, simulations and interviews, to establish the building’s energy demand and the building’s physical characteristics;
  • Energy retrofit design, with several options taken into considerations;
  • Decision-making criteria assessment, including the economic, environmental and social aspects, and their weight for the decision-making;
  • Optimal allocation of resources, evaluating the whole approach, and its objectives and constraints;
  • Risk valuation.
Ma et al. [107] suggested a systematic approach for sustainable building retrofits, focusing on three key areas: strategic planning, the characterization of pre-retrofitting activities (with several steps undertaken similar to [108]) and the characterization of post-retrofitting activities, which introduces the evaluation of the strategy adopted and the satisfaction of the occupants. In [107], they also determined the importance of evaluating the measures after the occupancy, which could reduce the gap between the energy efficiency promised and that realized. Figure 1 shows the systematic approach developed by [107].
To deliver efficient ERMs, the UK government published a report in 2016 with twenty-seven recommendations, looking at different aspects and subjects in a retrofit project [110]:
  • Consumer protection, with certified bodies that guarantee the professionality and validity of the measures adopted. Training might be necessary;
  • Development of guidelines, and advice for consumers and the construction industry;
  • Introduction of quality and standards, which could lead to compliance and enforcement.
In the report, sector-specific recommendations have been specified, regarding:
  • Insulation and fabric, using a holistic approach in which environment, heritage, occupancy, and the householders’ improvement objectives drive the chosen retrofit measures;
  • Smart meters, with their installation operated by skilled staff that could advise and inform the consumers;
  • Home energy technologies, with the use of existing and new technologies supported by advice documents for the benefit of the supply chain and consumers.
These recommendations were followed by the British Standards’ publication of PAS 2035: 2019 (Retrofitting Dwellings for Improved Energy Efficiency Specification and Guidance document), wherein a whole-house approach is pursued. The document emphasizes that the risks related to the interaction between different types of ERM should be evaluated. Moreover, ERMs should be scheduled in a precise order, assessing the possibility of any knock-on effects [111]. PAS 2035 suggests a cost-effective method, with an approach that aims to improve the fabric first. Improving envelope insulation is the most effective ERM, with heat loss reduced up to 40% with cavity wall insulation, and up to 50–80% with external wall or roof insulation [112,113]. When deciding the appropriate ERMs, the age and the building typology should be considered. Table 3 shows typical energy uses for houses built in different years [114].
To summarize, ERMs focus on improving the ability of buildings to retain heat, and on upgrading the technologies used for space heating, water heating, and lighting [115]. Insulation technologies and techniques, shading and glazing systems, airtightness, and ventilation systems should be adopted to guarantee a higher level of energy loads [116]. Additionally, the fabric first approach seems to be the most advantageous, in terms of cost and environmental benefits, as shown in Figure 2.
It should be noted that the most cost-effective options might be calculated using a simple payback calculation, which poorly estimates the savings in the long term [10], and with the cheapest solutions becoming the most attractive [117]. Hence the use of life-cycle cost analysis (LCCA) to evaluate ERMs’ costs and benefits [104]. In evaluating ERMs, Jafari and Valentin [104] added to the standard LCCA the evaluated benefits of reselling, considering the increase in the property value, and the benefits derived from the tax incentives for buildings’ energy optimization. Thus, building owners could be made aware of the ERMs’ advantages, via a detailed and more exhaustive analysis, with costs and risks being crucial factors for ERMs strategies and decision-making processes. It has been highlighted in [118] that the influence of the occupants’ behavior in developing effective ERMs could be as high as 62–86%. Additionally, if the behavior pattern corresponds to a high energy level, ERMs change the behavior patterns and reduce energy consumption by up to 50%, making them more efficient than physical improvements. On the other hand, if the behavior pattern is categorized as low energy level, physical improvements might be more efficient. Occupant behavior could thus influence the final decision when choosing a strategy for the most appropriate ERMs.

5.6. Building Research Establishment Environmental Assessment Method (BREEAM)

After the First World War, a need for new buildings arose in the UK. Thus, in 1921, the Building Research Station (BRS) was founded in London, UK supporting research regarding methods of construction, building materials and their behavior, and helping in the development of the British Standard for bricks. With the advent of the Second World War, the BRS focused its studies on supporting the war effort. Afterwards, the BRS undertook research related to the use of timber in construction and fire risks for buildings. However, one important date is 1949, when a Building Research Station office, operating in Scotland, centerd its studies on climate change issues and their connection with the construction sector. Thus, it can be argued that 1949 paved the way for the creation of the Building Research Establishment Environmental Assessment Method (BREEAM).
BRS was an established authority in the construction sector in the UK; the World Climate Program conference in 1985, known as the Villach meeting, recognized the role of GHG emissions in climate change. In this context, in 1988, BREEAM was created, and it was launched in 1990, aiming to minimize the impact that buildings have on the environment, and focusing on new office buildings [119]. In 1991, two new versions of BREEAM were launched, one called BREEAM 2/91, for new superstores, and BREEAM 2/91 for new homes. Another update in 1993 introduced the industrial buildings assessments into BREEAM. In 1998, an update of BREEAM for new offices was published [119]. However, later in 2000, BRE published the BREEAM assessment called Ecohomes, an environmental rating for homes. Updated over the years, Ecohomes built the fundamentals for the Code for Sustainable Homes, developed by the UK government. In 2008, for the first time, two stages were introduced in the assessment [120]:
  • Design stage (DS)—leading to an Interim BREEAM Certificate;
  • Post-construction stage (PCS)—leading to a Final BREEAM Certificate;
Moreover, minimum standards and innovation credits have been added to the 2008 BREEAM version. With the introduction of mandatory minimum standards, BREEAM assessment overcame problems related to the interconnection between energy and water efficiency, and environmental aspects [121].
Later in 2011, a new version of BREEAM was launched, known as New Construction 2011. However, the new version was also used for major refurbishments, even though for fit-out or minor refurbishments, the 2008 BREEAM version was recommended by BRE [122]. The major amendments to version 2011 are summarized as follows [123]:
  • New benchmarks and assessment methodologies for determining energy efficiency and operational GHG emissions. Reductions in energy demand, energy consumption, and GHG emissions are key requirements in the 2011 versions;
  • Updated benchmarks for construction waste and water consumption;
  • Introduction of new standards for sustainable procurement and post-construction operational aftercare;
  • New and updated reporting requirements of key performance indicators.
In 2012, the BREEAM Refurbishment Domestic Buildings scheme was introduced. Due to the nature of the scheme, over 40% of the available scores are influenced by solutions that aim to improve energy efficiency [124]. The assessment looks more at the environmental aspect of the projects, and the energy-saving measures suggested offer more benefits to the occupants in the long term, increasing also the property value [125]. Currently, the latest version of BREEAM is the 2018 one, and different assessments are available, as follows [126]:
  • BREEAM Communities, for the master-planning of a larger community of buildings;
  • BREEAM New Construction: Buildings, for new-build, domestic and non-domestic buildings;
  • BREEAM New Construction: Infrastructure, for new-build infrastructure projects;
  • BREEAM In-Use, for existing non-domestic buildings in use;
  • BREEAM Refurbishment and Fit Out, for domestic and non-domestic building fit-outs and refurbishments.
BREEAM can be carried out in three different stages, including the design stage (optional), the post-construction stage, and the post-occupancy stage (optional). At the design stage, an interim BREEAM rating is released, which does not represent the final rating. However, it is recommended that projects aim to reach high levels of performance. In the post-construction stage, the building is rated according to BREEAM if an interim rating is already in place. At the post-occupancy stage, building performance is evaluated after it has been occupied, and the assessment should take place after at least 12 months. Here, the post-occupancy handover, commissioning processes and performance evaluation would be appraised [126]. The BREEAM rating is based on credits, and ten sections are considered: Management (21 credits), Health and Wellbeing (22 credits), Energy (31 credits), Transport (8 credits), Water (4 credits), Material (8 credits), Waste (3 credits), Land Use and Ecology (5 credits), Pollution (8 credits), Innovation (2 credits). Thus, building performance is accredited via the following four elements:
  • The BREEAM rating level benchmarks;
  • The minimum BREEAM standards;
  • The environmental section weightings;
  • The BREEAM assessment issues and credits.
Using the rating benchmark levels, buildings’ performances are compared to other BREEAM-rated buildings, and to new non-domestic buildings in the UK that have addressed sustainable performance [126]. The BREEAM rating benchmarks are shown in Table 4.
Moreover, the equivalent performances for the BREEAM ratings are as follows:
  • Outstanding: Less than the top 1% of UK new non-domestic buildings (innovator);
  • Excellent: Top 10% of UK new non-domestic buildings (best practice);
  • Very Good: Top 25% of UK new non-domestic buildings (advanced good practice);
  • Good: Top 50% of UK new non-domestic buildings (intermediate good practice);
  • Pass: Top 75% of UK new non-domestic buildings (standard good practice).
BREEAM is defined as a sustainability assessment system, looking at three main aspects of the project: environmental, social and economic. The environmental benefits of using BREEAM come from the sections dedicated to energy and pollutions, which aim to reduce emissions. Additionally, the section dedicated to Land Use and Ecology has a great impact on the final score, and extra investigations might be required during the projects to achieve a higher rating. Minimizing construction waste and the sustainable use of materials bring further environmental benefits to the final construction project [127]. The social benefits related to the BREEEAM scheme could be associated with the Health and Wellbeing section, in which visual comfort, indoor air quality, thermal comfort, acoustic performance, security and health, and healthy surroundings are taken into consideration by improving occupants’ comfort and satisfaction. Moreover, Parker [127] has shown that the use of BREEAM could lead to social benefits for the construction industry. The economic benefits are related to the consequential reduction in the building’s operational energy consumption [127]. The importance of BREEAM in evaluating buildings’ environmental impacts has been recognized worldwide, and since its launch, BREEAM-type schemes have been developed in Hong Kong, Canada, Denmark, Norway, Australia, New Zealand, and the USA [128]. However, the scheme has been criticized for the higher costs and high skills levels it demands. Freitas and Zhang [129] highlighted the lack of flexibility of the scheme and the complexity of the rating systems as weaknesses. Besides this, looking at the social aspects, BREEAM might not support people with low incomes who are unable to afford buildings with high BREEAM standards. In addition, they [129] argued that, in the context of reducing a building’s operational energy, in BREEAM, more importance is given to the use of new technologies rather than strategies that minimize the demand for energy.

5.7. Leadership in Energy and Environmental Design (LEED)

In 1993, the U.S. Green Building Council (USGBC), Washington, DC, USA was created with the scope of assisting and supporting the construction community (i.e., stakeholders, architects, builders, etc.) interested in green buildings.
Thus, based on precedent environmental assessments, such as BREEAM, in 1998, the Leadership in Energy and Environmental Design (LEED) was launched as a system to evaluate and certify buildings in the US [130]. In the UK, a significant number of buildings owned by US companies follow the LEED certification procedure. The pilot version, known as LEED 1.0 Pilot, was reviewed, and updated in 2000 with LEED 2.0 version. Further upgrades followed LEED 2.0 version, with the LEED 2.1 and 2.2 administrative updates applied to simplify the processes of building evaluation and to reduce the costs [131]. Later, in 2009, LEED 3.0 was released, and the previous rating system was compacted into three main categories, as shown in Table 5.
Moreover, in LEED version 3.0, more attention was given to the use of energy and GHG emissions reduction, with an increase in credits available for the Sustainable Sites and Energy and Atmosphere categories. In 2013, a new upgrade was instituted, LEED version 4.0. Thus, new building typologies were introduced into the rating scheme, such as data centers, warehouses and distribution centers, hospitality, existing schools, existing retail, and mid-rise residential projects. Furthermore, the process was simplified, and guidelines for building performance management were introduced [133]. The most recent version of LEED is 4.1, inaugurated in 2019, which is divided into the following assessments:
  • Building Design Construction, for new constructions and major renovations, core and shell development, schools, retail, data centers, warehouses and distribution centers, hospitality, and healthcare;
  • Interior Design and Construction, for commercial interiors, retail, and hospitality buildings;
  • Operations and Maintenance, for existing buildings and existing interiors;
  • Residential, for single-family homes, multifamily homes and multifamily homes core and shell;
  • Cities and Communities, regarding planning and design, or applied to existing cities and communities.
Similar to BREEAM, LEED is based on a credit system. The credits are based on the principles that projects with the certification must pursue, and its aims are [134]:
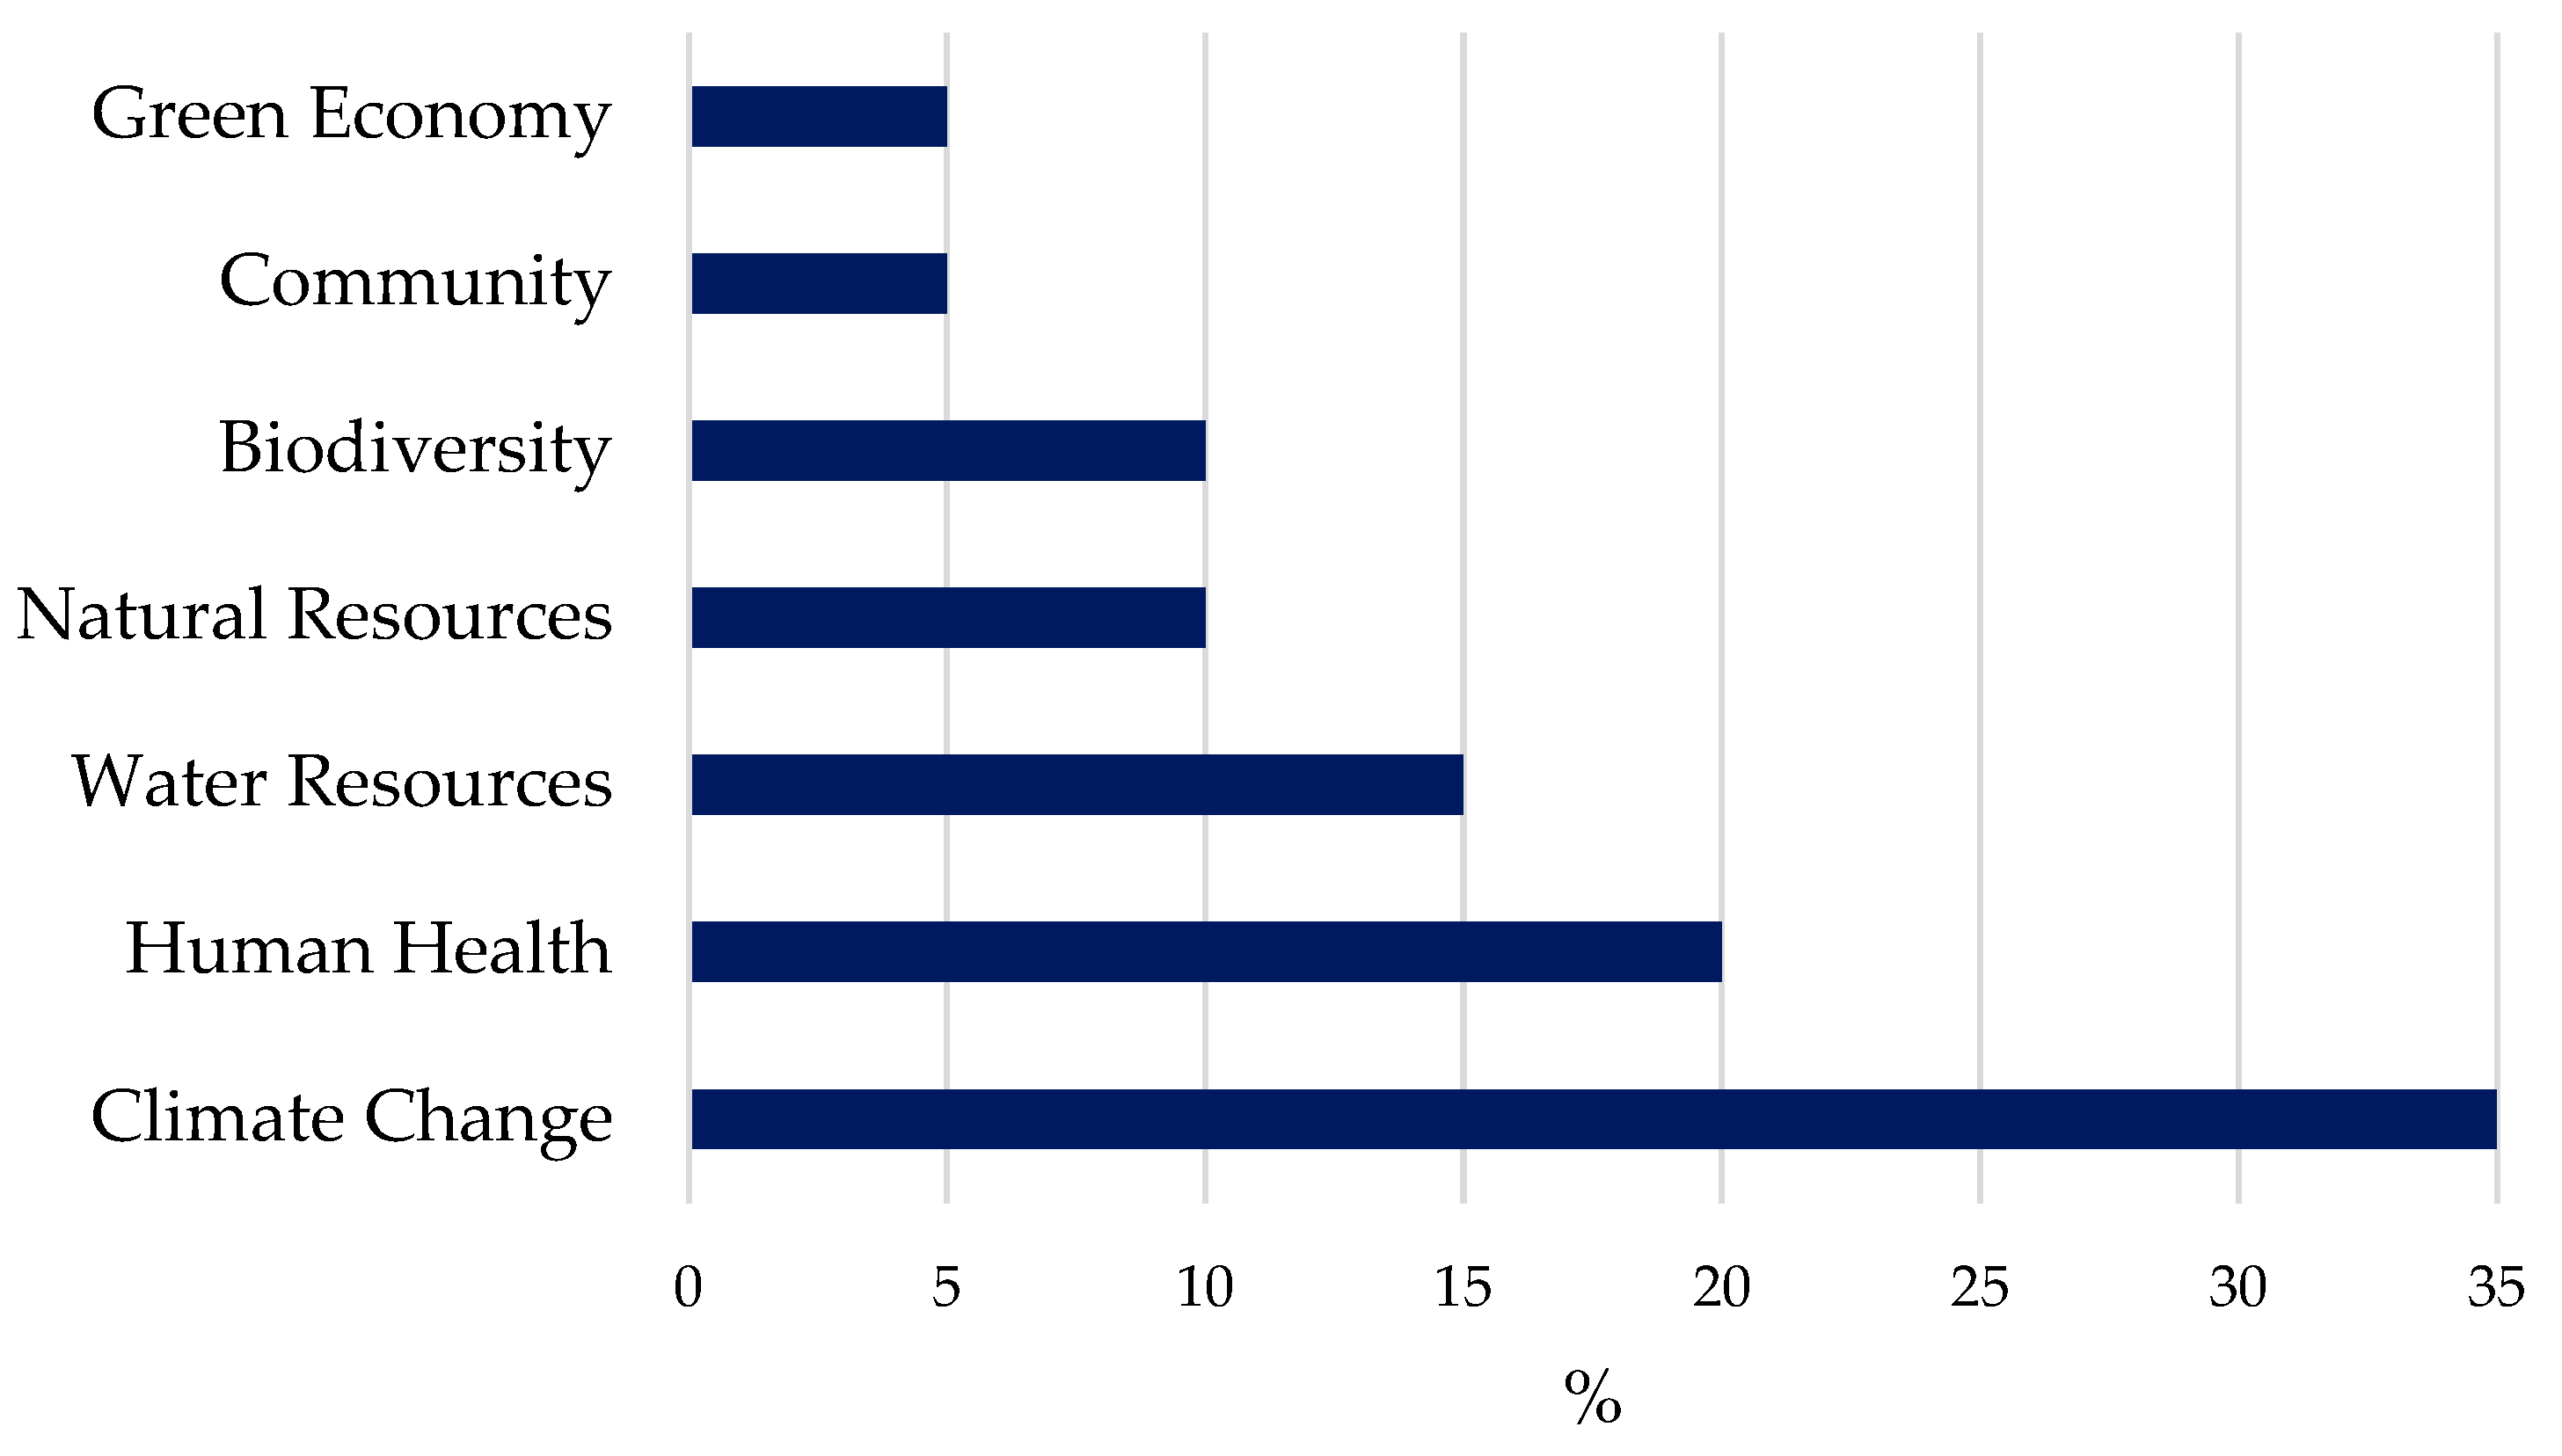
  • Having less impact on global climate change;
  • Adding value for human health and well-being;
  • Protecting biodiversity and water resources;
  • Promoting the use of sustainable materials;
  • Enhancing a sustainable approach, which looks at green economy, social equity, environmental justice, and community quality of life.
Consequently, a credit weighting system has been established by the USGBC, Washington, DC, USA following the specific criteria shown in Figure 3.
The categories Energy and Atmosphere (33 credits), Water Efficiency (11 credits), Sustainable Site (10 credits), Materials and Resources (13 credits), Indoor Environmental Quality (16 credits), Regional Priority (4 credits) and Innovative Design (6 credits) are part of the core of LEED. However, two new categories have been added in the last version, Location and Transportation (16 credits) and Integrate Projects (1 credit), making 110 credits available for LEED certification. The intention of the new credit Integrate Projects is to “Maximize opportunities for integrated, cost-effective adoption of green design and construction strategies” [135]. To have access to this credit, the requirements are as follows:
  • Owner’s Project Requirements Document, where the missions and goals of the projects are determined, addressing social, economic and environmental values;
  • Preliminary Rating Goals, specifying the targeted certification that the project wants to obtain;
  • Having an Integrated Project Team and a design charrette (at least four hours).
Meanwhile, the new Location and Transportation credits look at the impact of buildings in terms of transportation, promoting carshare parking, and the use of electric vehicles and bicycle facilities, which have also contributed to human well-being [135]. The LEED certification is operated by a third party, the Green Building Certification Institute (GBCI), Washington, DC, USA, and the process includes:
  • LEED Pre-Assessment;
  • Pre-Certification (optional);
  • Design Review by GBCI after the design documentation’s submittal;
  • Construction Review by the GBCI after the construction documentation’s submittal;
  • Certification Awarded.
To be certified with LEED, at least 40 credits are necessary, and the further classification is as follows,
  • +40 credits—Certified;
  • +50 credits—Silver;
  • +60 credits—Gold;
  • +80 credits—Platinum.
Despite LEED having been widely used worldwide, concerns have been growing regarding the effectiveness of the certification in terms of energy consumption and emissions. Scofield [136] compared energy usage between LEED buildings and the general US commercial building stock. Despite an energy-saving average between 18 and 39% for LEED buildings, 28–35% of them are more energy efficient than the uncertified ones. Moreover, no substantial differences in terms of energy consumption between the different accreditation levels (Certified, Silver, Gold) have been recorded, although the reasons behind this could be that a Silver-certified building might have a higher score in terms of the energy credits than a Gold one. Scofield [137] compared 21 certified office buildings in New York with an uncertified building. Despite Gold-certified buildings showing a 20% reduction in terms of energy consumptions and GHG emissions, LEED-certified and Silver-certified buildings used more energy than older offices. Altomonte and Schiavon [76] investigated the occupant satisfaction of LEED-certified and uncertified buildings, and they found that LEED buildings’ occupants have better air quality. The same results were obtained when looking at satisfaction in terms of building maintenance, furnishing, etc, with a lower satisfaction score given by the occupants in terms of the amount of light in buildings within the LEED buildings. Nonetheless, to overcome the problems related to energy consumption and GHG emissions, and to monitor building performance, in 2018, a new program called LEED Zero was launched, which complements LEED certification. Twelve months of monitoring data are required to achieve these certifications, including LEED Zero Carbon, LEED Zero Energy, LEED Zero Water and LEED Zero Waste. Until now, no comprehensive studies have been conducted to show how the buildings certified with the last version of LEED perform, and whether any advantages compared to non-certified ones are noticeable.

6. Discussion and Conclusions

The construction sector plays a key role in climate change, and adjustments to reduce building energy usage and GHG emissions are essential. According to our literature review, building performance assessments based on different methods have not been comprehensively investigated and reviewed. In this context, this article explores the current assessments used in the UK, as a case study, to evaluate the buildings’ energy performances, highlighting the strengths and weaknesses of each methodology. Meanwhile, this study offers an overview of the progress of UK legislation in terms of building regulations.
Since the introduction of Part L1A Conservation of fuel and power in 1985, the UK government has focused on the impact that buildings have in terms of energy consumption. Pursuing the fabric first approach from the beginning, UK legislation has evolved during the years, focusing as well on the impact that buildings have in terms of emissions. Despite the intention of the UK government, it can be argued that small changes have been made over the years regarding the construction elements’ U-values. On the other hand, a new approach seems to have affected the Part L1A Conservation of fuel and power consultation version published in 2021. With the buildings’ requirement of being nearly zero-energy, the introduction of the primary energy rate and the target primary energy rate, alongside TER and TFEE, is crucial. In fact, with the primary energy rate having been introduced, the legislation does not focus only on how much energy is used in buildings, but the use of energy for the extraction and transportation of fuels is also taken into account. Furthermore, the consultation version concentrates on the handover process to figure out whether occupants’ behavior could highly influence the final building performance. Thus, it is important to specify what the main factors are that affected the building’s energy performance and the tools used to evaluate them. With on-site component testing, it can be figured out the level of improvement that should be accomplished—not just values given, but the quality of construction process too. On the other hand, IAQ is a vital element in the well-being of occupants, and with a high level of airtightness in buildings, there are also higher risks that IAQ could be compromised. Thus, procedures that use less operations on-site and have successful standardized techniques should be promoted. In light of the above, as the UK government has already anticipated in its consultation document, the involvement of the buildings’ users at the early stage and best practice in handover should both be encouraged. Therefore, different measures have been identified to achieve efficient buildings. These measures are categorized as passive and active measures.
It has been shown that passive measures are highly influenced by the site and by the building’s typology. Nonetheless, despite new advanced technologies, active measures are affected by occupants’ behavior and how the systems are being used. As a result, the use of energy management systems, which guarantee more automation and control of the energy consumed within the buildings, seems to be a solution that can alleviate users’ influence.
This research focused on the tools used to evaluate these measures. Among them, energy building modeling tools are crucial in estimating the energy needs of a building. Steady-state models are utilized to accomplish the European Directives 2010/31/EU and 2012/27/EU, with less input and faster output. However, inaccuracies related to the use of steady-state models may have a significant influence on the results. One of the problems is that they consider generalized weather data, e.g., Test Reference Year data, which have considerable influence on building energy performance. On the contrary, dynamic simulation tools offer an opportunity to study the influence of external temperatures and their relationship with building performance.
Surveys and interviews are vital to understanding how users could influence energy usage. With the qualitative data obtained with interviews and surveys, these methods allow researchers to understand how “efficient buildings” are perceived by the final occupiers, and also to compare the perception that users have about buildings built with the same sustainable principles. Furthermore, these data, accompanied with quantitative data, facilitate an extensive review of building performance, reminding everyone that buildings must be efficient in terms of energy and emissions, but that they also need to be efficient and practical for the final users.
Depending on the energy assessment scheme, different factors and tools are considered. SAP measures the energy and emission ratings of dwellings, and the exclusion of the dwellers from the SAP methodology has facilitated the comparison of energy performance between buildings of the same typology. Inaccuracies related to the use of steady-state model simulation have been reported with the use of SAP. Building performance driven by SAP can be reduced due to the lack of comprehensive details. Despite the improvements suggested, less attention has been paid to the Reduced Data Standard Assessment Procedure (RdSAP) used for existing buildings, because the standardized values used for the calculations do not reflect the actual values and characteristics of the elements analyzed.
The next scheme is BPE, which analyzes the whole buildings’ life from the design to the operational period/occupancy process. Therefore, BPE seems to be more coherent with the idea that buildings should be evaluated all-around, and that the construction process does not end with the handover, but that occupants’ feedback and actual energy efficiency should be evaluated. BPE requires a schematic approach, with cooperation between all the parties from the beginning of the process. The approach might be categorized into different phases, and for each phase, we should establish the scope, how it will be pursued (which methodologies are used, qualitative data, quantitative data), and how the results will be used. Thus, there is a certain complexity in the scheme, implying higher costs, which are always seen as a disadvantage. Moreover, cooperation is the key part of the assessment, but it is also known that the construction process might be very fragmented, with designers, contractors, subcontractors, and final users not always able to maintain a high level of communication between them.
POE might be considered as part of, or at least included in, BPE. POE aims to evaluate how occupants perceive the environment they are living in. POE is generally carried out after energy retrofitting measures have taken place. From the review of the SAP assessment and the EPC, it has emerged that deep renovations are vital to reducing a buildings’ impact in terms of emissions and energy consumption. Thus, the energy retrofitting measures used have been analyzed. POE is based on interviews and surveys, and it is correlated to social studies with no specific protocols. However, due to the performance gap and its association with occupants’ behavior, POE may make a great contribution in understanding why efficient buildings fail to meet their optimal performance. On the other hand, several problems and questions are rising along with POE use. Firstly, it should be clarified who benefits from POE, in order to recognize who is responsible for the costs associated with it. If the building does not achieve the targets established and evaluated with POE, how will the responsibilities for the failure be judged and addressed? If the targets are not reached due to occupants’ behavior, how will the improvements be made? How advantageous is POE for firms, and does POE negatively affect firms’ reputation?
The payback period to renovate existing buildings should be analyzed. Thus, a life cycle cost analysis is used instead, since it includes the costs associated with the expected systems’ life, helping the buildings’ owners to develop more of an understanding of the advantages of ERMs. Alongside active and passive measures, the human side, namely, the impact of the users, is another category that could be included in ERMs. Thus, for existing buildings, studies related to costs, risks and occupants’ behavior should be undertaken in parallel before choosing the measures that best fit buildings’ and owners’ needs.
BREEAM assesses the performance of various buildings. It is based on credits, which are categorized by considering the whole construction process, the building’s operational energy, and the health and well-being of the occupants. BREEAM offers the opportunity to change the view of the building construction process, in which each action and each subject could contribute to the overall building performance. BREEAM has been criticized for its higher costs and lack of flexibility in its process.
As with BREEAM, LEED evaluates the whole construction process, and credits are assigned and weighted by looking at the overall building’s environmental impact. As a matter of fact, in both BREEAM and LEED, the post-occupancy stage evaluation is optional; despite the innovative and comprehensive approaches used in BREEAM and LEED, the post-occupancy evaluation is a mere part of the two assessments.
All this information should stimulate more investments in upgrading existing buildings, which are slowly seeing improvements in terms of energy efficiency. As has been noticed for building regulations, the general approach to improving building performance has changed over the past years, with the approach now focusing on nearly/zero-energy buildings so as to reduce the level of energy demand and GHG emissions significantly. To achieve this, the first step is to focus on the building envelope and to reduce or minimize its energy demand, then to concentrate on energy systems using microgrid technologies with or without energy management systems.
Conversely, the study shows that great attention should be given to the analysis of buildings while they are occupied. This assessment is crucial when evaluating the effectiveness of the measures used to develop efficient buildings, but it also considers owners’ points of view and their perception of the buildings. Additionally, it offers the opportunity to estimate the occupants’ behavior’s impact on the performance, and to improve it if necessary. This study flow can be applied to other countries.

Author Contributions

Conceptualization, methodology, writing, review and editing, P.S. and B.V.; writing, review and editing, S.M.S.; editing, L.T. All authors have read and agreed to the published version of the manuscript.

Funding

This research received no external funding.

Institutional Review Board Statement

Not Applicable.

Informed Consent Statement

Not Applicable.

Data Availability Statement

Not Applicable.

Conflicts of Interest

The authors declare no conflict of interest.

References

  1. The Building Regulations 2010-Part, L. Available online: https://assets.publishing.service.gov.uk/government/uploads/system/uploads/attachment_data/file/1045920/ADL1.pdf (accessed on 19 December 2021).
  2. The Building Regulations 2002-Part L1A. Available online: https://webarchive.nationalarchives.gov.uk/ukgwa/20141202124314/https://www.planningportal.gov.uk/uploads/br/BR_PDF_ADL1_2002.pdf (accessed on 19 December 2021).
  3. The Building Regulations 2006-Part L1A. Available online: https://webarchive.nationalarchives.gov.uk/ukgwa/20141202124243/https://www.planningportal.gov.uk/uploads/br/BR_PDF_ADL1A_2006.pdf (accessed on 19 December 2021).
  4. The Building Regulations 2010-Part L1A. Available online: https://webarchive.nationalarchives.gov.uk/ukgwa/20141202124319/https://www.planningportal.gov.uk/uploads/br/BR_PDF_AD_L1A_2010.pdf (accessed on 19 December 2021).
  5. The Building Regulations 2013-Part L1A. Available online: https://webarchive.nationalarchives.gov.uk/ukgwa/20150601171016/http://www.planningportal.gov.uk/uploads/br/BR_PDF_AD_L1A_2013.pdf (accessed on 19 December 2021).
  6. The Building Regulations 2021 edition. Available online: https://www.legislation.qld.gov.au/view/pdf/inforce/current/sl-2021-0126 (accessed on 19 December 2021).
  7. Scottish Government. Building Standards Technical Handbook 2020: Domestic. Available online: http://www.gov.scot/publications/building-standards-technical-handbook-2020-domestic/6-energy/6-2-building-insulation-envelope/ (accessed on 19 December 2021).
  8. Wales Government. Building Regulations Guidance: Part L (Conservation of Fuel and Power). Available online: https://gov.wales/building-regulations (accessed on 19 December 2021).
  9. EN ISO 8990; Thermal insulation —Determination of Steady-State Thermal Transmission Properties. Calibrated and Guarded Hot Box. BSI Standards: London, UK, 1996.
  10. Kelly, S.; Crawford-Brown, D.; Pollitt, M.G. Building performance evaluation and certification in the UK: Is SAP fit for purpose? Renew. Sustain. Energ. Rev. 2012, 16, 6861–6878. [Google Scholar] [CrossRef]
  11. ISO 9869-1; Thermal Insulation—Building Elements—In-Situ Measurement of Thermal Resistance and Thermal Transmittance—Part 1: Heat Flow Meter Method. ISO: Vernier, Geneva, 2014.
  12. Asdrubali, F.; D’Alessandro, F.; Baldinelli, G.; Bianchi, F. Evaluating in situ thermal transmittance of green buildings masonries—A case study. Case Stud. Constr. Mater. 2014, 1, 53–59. [Google Scholar] [CrossRef]
  13. Kosmina, L. BRE Guide to In-Situ U-Value Measurement of Walls in Existing Dwellings. In-Situ Measurement of U-Value. BRE. 2016. Available online: https://www.bre.co.uk/filelibrary/In-situ-measurement-of-thermal-resistance-and-thermal-transmittance-FINAL.pdf (accessed on 19 December 2021).
  14. Baker, P. Technical Paper 10. U-values and Traditional Buildings. In Situ Measurements and Their Comparisons to Calculated Values; Glasgow Caledonian University: Glasgow, UK, 2011. [Google Scholar]
  15. Berardi, U. Clarifying the new interpretations of the concept of sustainable building. Sustain. Cities Soc. 2013, 8, 72–78. [Google Scholar] [CrossRef]
  16. Sherman, M.H.; Chan, W.R. Building air tightness: Research and practice. In Building Ventilation. The State of the Art, 1st ed.; Santamouris, M., Wouters, P., Eds.; Routledge: London, UK, 2006. [Google Scholar]
  17. Energy Saving Trust. In Enhanced Construction Details: Thermal Bridging and Airtightness; Energy Saving Trust: London, UK, 2009.
  18. Pan, W. Relationships between air-tightness and its influencing factors of post-2006 new-build dwellings in the UK. Build Environ. 2010, 45, 2387–2399. [Google Scholar] [CrossRef]
  19. Kalamees, T. Air tightness and air leakages of new lightweight single-family detached houses in Estonia. Build Environ. 2007, 42, 2369–2377. [Google Scholar] [CrossRef]
  20. Johnston, D.; Miles-Shenton, D. Airtightness of UK dwellings. In Proceedings of the Construction and Building Research Conference, London, UK; 2009; pp. 271–280. Available online: https://eprints.leedsbeckett.ac.uk/id/eprint/644/1/cobra04-3.pdf (accessed on 19 December 2021).
  21. Salehi, A.; Torres, I.; Ramos, A. Experimental analysis of building airtightness in traditional residential Portuguese buildings. Energy Build 2017, 151, 198–205. [Google Scholar] [CrossRef]
  22. EN ISO 9972; Thermal Performance of Buildings—Determination of Air Permeability of Buildings—Fan Pressurization Method. ISO: Vernier, Geneva, 2015.
  23. Zheng, X.; Mazzon, J.; Wallis, I.; Wood, C.J. Airtightness measurement of an outdoor chamber using the pulse and blower door methods under various wind and leakage scenarios. Build Environ. 2020, 179, 106950. [Google Scholar] [CrossRef]
  24. Air Tightness Testing & Measurement Association (ATTMA). Air Tightness Testing & Measurement Association Technical Standard L1. Measuring Air Permeability of Building Envelopes (Dwellings); ATTMA: Wycombe, UK, 2010. [Google Scholar]
  25. Šenitková, I.J. Indoor air quality—buildings design. MATEC Web Conf. 2017, 93, 03001. [Google Scholar] [CrossRef]
  26. Shrestha, P.M.; Humphrey, J.L.; Barton, K.E.; Carlton, E.J.; Adgate, J.L.; Root, E.D.; Miller, S.L. Impact of low-income home energy-efficiency retrofits on building air tightness and healthy home indicators. Sustainability 2019, 11, 2667. [Google Scholar] [CrossRef] [Green Version]
  27. Davies, M.; Oreszczyn, T. The unintended consequences of decarbonising the built environment: A UK case study. Energy Build 2012, 46, 80–85. [Google Scholar] [CrossRef] [Green Version]
  28. Sharpe, R.A.; Thornton, C.R.; Nikolaou, V.; Osborne, N.J. Higher energy efficient homes are associated with increased risk of doctor diagnosed asthma in a UK subpopulation. Environ. Int. 2015, 75, 234–244. [Google Scholar] [CrossRef] [PubMed]
  29. SeppȨnen, O. Ventilation strategies for good indoor air quality and energy efficiency. Int. J. Vent. 2008, 6, 297–306. [Google Scholar]
  30. Ortiz, M.; Itard, L.; Bluyssen, P.M. Indoor environmental quality related risk factors with energy-efficient retrofitting of housing: A literature review. Energy Build 2020, 221, 110102. [Google Scholar] [CrossRef]
  31. Pérez-Lombard, L.; Ortiz, J.; Pout, C. A review on buildings energy consumption information. Energy Build 2008, 40, 394–398. [Google Scholar] [CrossRef]
  32. IEA. Data & Statistics. Available online: https://www.iea.org/data-and-statistics?country=WORLD&fuel=Energy%20supply&indicator=TPESbySource (accessed on 19 December 2021).
  33. IEA. Energy Efficiency Indicators—Analysis. Available online: https://www.iea.org/reports/energy-efficiency-indicators (accessed on 19 December 2021).
  34. United Nations Environment Programme. 2020 Global Status Report for Buildings and Construction. Towards a Zero-Emissions, Efficient and Resilient Buildings and Construction Sector. 2020. Available online: https://globalabc.org/sites/default/files/inline-files/2020%20Buildings%20GSR_FULL%20REPORT.pdf (accessed on 19 December 2021).
  35. EU. Parliament Directive 2010/31/EU of the European Parliament and the Council on the Energy Performance of Buildings; EU: Brussels, Belgium, 2010. [Google Scholar]
  36. UK Green Building Council. Net Zero Carbon Buildings: A Framework Definition; UK Green Building Council: London, UK, 2019. [Google Scholar]
  37. Ascione, F.; Bianco, N.; De Masi, R.F.; Dousi, M.; Hionidis, S.; Kaliakos, S.; Mastrapostoli, E.; Nomikos, M.; Santamouris, M.; Synnefa, A.; et al. Design and performance analysis of a zero-energy settlement in Greece. Int. J. Low Carbon Technol. 2017, 12, 141–161. [Google Scholar] [CrossRef] [Green Version]
  38. Hagentoft, C.-E.; Pallin, S. A conceptual model for how to design for building envelope characteristics. Impact of thermal comfort intervals and thermal mass on commercial buildings in U.S. climates. J. Build. Eng. 2021, 35, 101994. [Google Scholar] [CrossRef]
  39. Brounen, D.; Kok, N.; Quigley, J.M. Residential energy use and conservation: Economics and demographics. Eur. Econ. Rev. 2012, 56, 931–945. [Google Scholar] [CrossRef]
  40. Steinemann, M.; Kessler, S. Decarbonizing the Building Sector—10 Key Measures; United Nations Environment Programme: Nairobi, Kenya, 2021; Available online: http://globalabc.org/resources/publications/decarbonizing-building-sector-10-key-measures (accessed on 19 December 2021).
  41. Estiri, H. A Structural equation model of energy consumption in the United States: Untangling the complexity of per-capita residential energy use. Energy Res. Soc. Sci. 2015, 6, 109–120. [Google Scholar] [CrossRef]
  42. Musall, E.; Weiss, T.; Voss, K.; Lenoir, A.; Donn, M.; Cory, S.; Garde, F. Net Zero Energy Solar Buildings: An Overview and Analysis on Worldwide Building Projects; EuroSun: Graz, Austria, 2010. [Google Scholar] [CrossRef] [Green Version]
  43. Rodriguez-Ubinas, E.; Montero, C.; Porteros, M.; Vega, S.; Navarro, I.; Castillo-Cagigal, M.; Matallanas, E.; Gutiérrez, A. Passive design strategies and performance of net energy plus houses. Energy Build 2014, 83, 10–22. [Google Scholar] [CrossRef] [Green Version]
  44. Yohanis, Y.G.; Mondol, J.D.; Wright, A.; Norton, B. Real-life energy use in the UK: How occupancy and dwelling characteristics affect domestic electricity use. Energy Build 2008, 40, 1053–1059. [Google Scholar] [CrossRef]
  45. Torcellini, P.; Pless, S.; Deru, M. Zero Energy Buildings: A Critical Look at the Definition. National Renewable Energy Laboratory; U.S. Department of Energy: Washington, DC, USA, 2006. [Google Scholar]
  46. Passivehous Trust. Passivehous: The Route to Zero Carbon? Report. Available online: https://www.passivhaustrust.org.uk/guidance_detail.php?gId=40 (accessed on 19 December 2021).
  47. Alimohammadisagvand, B. Influence of Demand Response Actions on Thermal Comfort and Electricity Cost for Residential Houses. Article Dissertation, Aalto University: Espoo, Finland. 2018. Available online: https://aaltodoc.aalto.fi/handle/123456789/33143 (accessed on 19 December 2021).
  48. Shaikh, P.H.; Nor, N.B.M.; Nallagownden, P.; Elamvazuthi, I.; Ibrahim, T. Intelligent multi-objective control and management for smart energy efficient buildings. Int. J. Electr. Power Energy Syst. 2016, 74, 403–409. [Google Scholar] [CrossRef]
  49. Zhou, B.; Li, W.; Chan, K.W.; Cao, Y.; Kuang, Y.; Liu, X.; Wang, X. Smart home energy management systems: Concept, configurations, and scheduling strategies. Renew. Sustain. Energ. Rev. 2016, 61, 30–40. [Google Scholar] [CrossRef]
  50. Kailas, A.; Cecchi, V.; Mukherjee, A. A survey of communications and networking technologies for energy management in buildings and home automation. J. Comput. Netw. Commun. 2012, 2012, 932181. [Google Scholar] [CrossRef] [Green Version]
  51. American Society of Heating, Refrigerating & Air-Conditioning Engineers. ASHRAE Handbook: Fundamentals; American Society of Heating, Refrigeration and Air-Conditioning Engineers: Atlanta, GA, USA, 2009. [Google Scholar]
  52. Wei, Y.; Zhang, X.; Shi, Y.; Xia, L.; Pan, S.; Wu, J.; Han, M.; Zhao, X. A review of data-driven approaches for prediction and classification of building energy consumption. Renew. Sustain. Energ. Rev. 2018, 82, 1027–1047. [Google Scholar] [CrossRef]
  53. Rahman, S.M. Simplified 32RC Building Thermal Network Model: A Case Study. Int. J. Struct. Constr. Eng. 2019, 13, 288–294. [Google Scholar]
  54. Arendt, K.; Jradi, M.; Shaker, H.R.; Veje, C.T. Comparative Analysis of White-, Gray- and Black-Box Models for Thermal Simulation of Indoor Environment: Teaching Building Case Study. In Proceedings of the 2018 Building Performance Modeling Conference and SimBuild, Chicago, IL, USA, 26–28 September 2018; pp. 173–180. [Google Scholar]
  55. Amara, F.; Agbossou, K.; Cardenas, A.; Dubé, Y.; Kelouwani, S. Comparison and simulation of building thermal models for effective energy management. Smart Grid Renew. Energy 2015, 6, 95–112. [Google Scholar] [CrossRef] [Green Version]
  56. Coakley, D.; Raftery, P.; Keane, M. A review of methods to match building energy simulation models to measured data. Renew. Sustain. Energ. Rev. 2014, 37, 123–141. [Google Scholar] [CrossRef] [Green Version]
  57. Dong, B.; Li, Z.; Rahman, S.M.M.; Vega, R. A hybrid model approach for forecasting future residential electricity consumption. Energy Build 2016, 117, 341–351. [Google Scholar] [CrossRef]
  58. Connolly, D.; Lund, H.; Mathiesen, B.V.; Leahy, M. A review of computer tools for analysing the integration of renewable energy into various energy systems. Appl. Energy 2010, 87, 1059–1082. [Google Scholar] [CrossRef]
  59. Sajjadian, S.M. Risk Identification in the Early Design Stage Using Thermal Simulations—A Case Study. Sustainability 2018, 10, 262. [Google Scholar] [CrossRef] [Green Version]
  60. Sajjadian, S.M. Dynamic modelling of solar storage system: A case study of leisure centre. Smart Sustain. Built Environ. 2016, 5, 165–175. [Google Scholar] [CrossRef]
  61. Crawley, D.B.; Hand, J.W.; Kummert, M.; Griffith, B.T. Contrasting the capabilities of building energy performance simulation programs. Build Environ. 2008, 43, 661–673. [Google Scholar] [CrossRef] [Green Version]
  62. Scottish Building Regulations Review of Energy Standards ’Call for Evidence’. Available online: https://www.gov.scot/publications/scottish-building-regulations-review-energy-standards-call-evidence/documents/ (accessed on 19 December 2021).
  63. Hamedani, M.N.; Smith, R. Evaluation of performance modelling: Optimizing simulation tools to stages of architectural design. Procedia Eng. 2015, 118, 774–780. [Google Scholar] [CrossRef] [Green Version]
  64. Moran, F.; Blight, T.; Natarajan, S.; Shea, A. The use of passive house planning package to reduce energy use and CO2 emissions in historic dwellings. Energy Build 2014, 75, 216–227. [Google Scholar] [CrossRef]
  65. Bros-Williamson, J.; Garnier, C.; Currie, J.I. A longitudinal building fabric and energy performance analysis of two homes built to different energy principles. Energy Build. 2016, 130, 578–591. [Google Scholar] [CrossRef] [Green Version]
  66. Burford, N.; Pearson, A. Ultra-low-energy perspectives for regional Scottish dwellings. Intell. Build. Int. 2013, 5, 221–250. [Google Scholar] [CrossRef]
  67. Schwartz, Y.; Raslan, R. Variations in results of building energy simulation tools, and their impact on BREEAM and LEED ratings: A case study. Energy Build 2013, 62, 350–359. [Google Scholar] [CrossRef]
  68. El Bat, A.M.; Romani, Z.; Bozonnet, E.; Draoui, A. Thermal impact of street canyon microclimate on building energy needs using TRNSYS: A case study of the city of Tangier in Morocco. Case Stud. Therm. Eng. 2021, 24, 100834. [Google Scholar] [CrossRef]
  69. Nageler, P.; Schweiger, G.; Pichler, M.; Brandl, D.; Mach, T.; Heimrath, R.; Schranzhofer, H.; Hochenauer, C. Validation of dynamic building energy simulation tools based on a Real test-box with thermally activated building systems (TABS). Energy Build 2018, 168, 42–55. [Google Scholar] [CrossRef]
  70. Xing, J.; Ren, P.; Ling, J. Analysis of energy efficiency retrofit scheme for hotel buildings using EQuest software: A case study from Tianjin, China. Energy Build 2015, 87, 14–24. [Google Scholar] [CrossRef]
  71. Tronchin, L.; Fabbri, K. Energy performance building evaluation in Mediterranean countries: Comparison between software simulations and operating rating simulation. Energy Build 2008, 40, 1176–1187. [Google Scholar] [CrossRef]
  72. Usable Buildings. The Building Use Studies (BUS) Occupant Survey: Origins and Approach. Q&A. 2011. Available online: https://www.usablebuildings.co.uk/UsableBuildings/Unprotected/BUSOccupantSurveyQ&A.pdf (accessed on 19 December 2021).
  73. Bunn, R.; Marjanovic-Halburd, L. Comfort signatures: How long-term studies of occupant satisfaction in office buildings reveal on-going performance. Build Serv. Eng. Res. Technol. 2017, 38, 663–690. [Google Scholar] [CrossRef] [Green Version]
  74. Usable Buildings. BUS Occupant Survey Method: Details for Licensees, n.d. Available online: http://www.usablebuildings.co.uk/BUSMethodology.pdf (accessed on 20 December 2021).
  75. Huizenga, C.; Zagreus, L.; Arens, E.; Lehrer, D. Measuring Indoor Environmental Quality: A Web-Based Occupant Satisfaction Survey. UC Berkeley: Center for the Built Environment. 2013. Available online: https://escholarship.org/uc/item/8zc5c32z (accessed on 19 December 2021).
  76. Altomonte, S.; Schiavon, S. Occupant satisfaction in LEED and non-LEED certified buildings. Build Environ. 2013, 68, 66–76. [Google Scholar] [CrossRef]
  77. Graham, L.T.; Parkinson, T.; Schiavon, S. Lessons learned from 20 Years of CBE’s occupant surveys. B&C 2021, 2, 166–184. [Google Scholar] [CrossRef]
  78. Galatioto, A.; Leone, G.; Milone, D.; Pitruzzella, S.; Franzitta, V. Indoor environmental quality survey: A brief comparison between different post occupancy evaluation methods. Adv. Mat. Res. 2014, 864–867, 1148–1152. [Google Scholar]
  79. AMA WorkWare. Available online: http://aleximarmot.com/workware/ (accessed on 19 December 2021).
  80. Building Services Research and Information Association (BSRIA). The Soft Landings Framework for Better Briefing, Design, Handover and Building Performance In-Use. 2009. Available online: https://www.usablebuildings.co.uk/UsableBuildings/Unprotected/SoftLandingsFramework.pdf (accessed on 19 December 2021).
  81. Stone, A.; Shipworth, D.; Biddulph, P.; Oreszczyn, T. Key factors determining the energy rating of existing English houses. Build. Res. Inf. 2014, 42, 725–738. [Google Scholar] [CrossRef] [Green Version]
  82. UK Government. Guidance Standard Assessment Procedure. Available online: https://www.gov.uk/guidance/standard-assessment-procedure (accessed on 20 December 2021).
  83. Tillson, A.-A.; Oreszczyn, T.; Palmer, J. Assessing impacts of summertime overheating: Some adaptation strategies. Build. Res. Inf. 2013, 41, 652–661. [Google Scholar] [CrossRef] [Green Version]
  84. Building Research Establishment (BRE). The Government’s Standard Assessment Procedure for Energy Rating of Dwellings; BRE: Watford, UK, 2014. [Google Scholar]
  85. Killip, G. Can market transformation approaches apply to service markets? An investigation of innovation, learning, risk and reward in the case of low-carbon housing refurbishment in the UK. In Proceedings of the 2011 ECEEE Summer Study on Energy Efficiency: Energy Efficiency First: The Foundation of a Low-Carbon Society, Belambra Presquile de Giens, Belambra Presquile de Giens, France, 6–11 June 2011. [Google Scholar]
  86. Gokarakonda, S.; Venjakob, M.; Thomas, S.; Kostova, D. Report on Local EPC Situation and Cross-Country Comparison Matrix. QualDeEPC Project. 2020. Available online: https://qualdeepc.eu/wp-content/uploads/2020/04/QualDeEPC_D2.1_Final_V2.pdf (accessed on 19 December 2021).
  87. Kostova, D.; Gokarakonda, S.; Venjakob, M.; Thomas, S. Report on EPC Best Practices. QualDeEPC Project. 2020. Available online: https://qualdeepc.eu/wp-content/uploads/2020/06/QualDeEPC_D2.2-Report-on-EPC-best-practices_Final_28052020.pdf (accessed on 19 December 2021).
  88. Gokarakonda, S.; Thomas, S.; Venjakob, M.; Kostova, D. Report on EPC Short Comings and National Priority Approaches to Their Resolution. QualDeEPC Project. 2020. Available online: https://qualdeepc.eu/wp-content/uploads/2020/04/QualDeEPC_D2.3_EPC-shortcomings-and-national-priority-approaches_final-20200422.pdf (accessed on 19 December 2021).
  89. Kostova, D.; Thomas, S.; Gokarakonda, S. Development Strategy Plan for the Development of next Generation EPC Schemes. QualDeEPC Project. 2020. Available online: https://qualdeepc.eu/wp-content/uploads/2020/07/QualDeEPC_D2.4-Development-Strategy-plan_200630_final.pdf (accessed on 19 December 2021).
  90. Preiser, W.F.E.; Hardy, A.E.; Schramm, U. From linear delivery process to life cycle phases: The validity of the concept of building performance evaluation. In Building Performance Evaluation: From Delivery Process to Life Cycle Phases; Preiser, W.F.E., Hardy, A.E., Schramm, U., Eds.; Springer International Publishing: Cham, Switzerland, 2018; pp. 3–18. [Google Scholar] [CrossRef]
  91. Gupta, R.; Kapsali, M.; Howard, A. Evaluating the influence of building fabric, services and occupant related factors on the actual performance of low energy social housing dwellings in UK. Energy Build 2018, 174, 548–562. [Google Scholar] [CrossRef] [Green Version]
  92. ISO 19208; Framework for Specifying Performance in Buildings. ISO: Vernier, Geneva, 2016.
  93. Royal Institute of British Architects (RIBA). Post Occupancy Evaluation and Building Performance Evaluation Primer; RIBA: London, UK, 2016. [Google Scholar]
  94. Low Carbon Building Group. Building Performance Evaluation Research: Testing, Monitoring and Post-Occupancy Evaluation; Oxford Brookes University: Oxford, UK, 2015. [Google Scholar]
  95. Morgan, C. Sustainable Renovation Improving Homes for Energy, Health and Environment. The Pebble Trust: Dingwall, UK, 2018. [Google Scholar]
  96. UK Green Building Council. Delivering Building Performance; UK Green Building Council: London, UK, 2016. [Google Scholar]
  97. UK Green Building Counci. Practical How-to Guide: How to: Execute a High Impact Post Occupancy Evaluation, n.d; UK Green Building Council: London, UK, 2018. [Google Scholar]
  98. Li, P.; Froese, T.M.; Brager, G. Post-occupancy evaluation: State-of-the-art analysis and state-of-the-practice review. Build Environ. 2018, 133, 187–202. [Google Scholar] [CrossRef] [Green Version]
  99. Preiser, W.F.E.; White, E.; Rabinowitz, H. Post-Occupancy Evaluation (Routledge Revivals), 1st ed.; Routledge: Abingdon, UK, 2015. [Google Scholar] [CrossRef]
  100. National Research Council. Learning from Our Buildings: A State-of-the-Practice Summary of Post-Occupancy Evaluation; The National Academies Press: Washington, DC, USA, 2002. [Google Scholar]
  101. Enright, S. Post-occupancy evaluation of UK library building projects: Some examples of current activity. LIBER Q. 2002, 12, 26–45. [Google Scholar] [CrossRef] [Green Version]
  102. Royal Institute of British Architects (RIBA). Building Knowledge: Pathways to Post Occupancy Evaluation; RIBA: London, UK, 2017. [Google Scholar]
  103. HEFCE; AUDE; University of Westminster. Guide to Post Occupancy Evaluation. 2006. Available online: http://www.smg.ac.uk/documents/POEBrochureFinal06.pdf (accessed on 19 December 2021).
  104. Jafari, A.; Valentin, V. An optimization framework for building energy retrofits decision-making. Build Environ. 2017, 115, 118–129. [Google Scholar] [CrossRef]
  105. International Energy Agency (IEA). Global Status Report; IEA: Paris, France, 2017. [Google Scholar]
  106. Wang, B.; Xia, X.; Zhang, J. A Multi-objective optimization model for the life-cycle cost analysis and retrofitting planning of buildings. Energy Build. 2014, 77, 227–235. [Google Scholar] [CrossRef] [Green Version]
  107. Ma, Z.; Cooper, P.; Daly, D.; Ledo, L. Existing building retrofits: Methodology and state-of-the-art. Energy Build. 2012, 55, 889–902. [Google Scholar] [CrossRef]
  108. Ruggeri, A.G.; Gabrielli, L.; Scarpa, M. Energy retrofit in European building portfolios: A review of five key aspects. Sustainability 2020, 12, 7465. [Google Scholar] [CrossRef]
  109. Hashempour, N.; Taherkhani, R.; Mahdikhani, M. Energy performance optimization of existing buildings: A literature review. Sustain. Cities Soc. 2020, 54, 101967. [Google Scholar] [CrossRef]
  110. Department for Business, Energy & Industrial Strategy; Department for Communities and Local Government. Each Home Counts. An Independent Review of Consumer Advice, Protection, Standards and Enforcement for Energy Efficiency and Renewable Energy. 2016. Available online: https://assets.publishing.service.gov.uk/government/uploads/system/uploads/attachment_data/file/578749/Each_Home_Counts__December_2016_.pdf (accessed on 19 December 2021).
  111. PAS 2035/2030; 2019 Retrofitting Dwellings for Improved Energy Efficiency. Specification and Guidance. British Standards Institution (BSI): London, UK, 2019.
  112. Jones, P.; Li, X.; Perisoglou, E.; Patterson, J. Five energy retrofit houses in South Wales. Energy Build. 2017, 154, 335–342. [Google Scholar] [CrossRef]
  113. Roberts, S. Altering existing buildings in the UK. Energy Policy 2008, 36, 4482–4486. [Google Scholar] [CrossRef]
  114. Energy Saving Trust. Domestic Energy Primer—An Introduction to Energy Efficiency in Existing Home. 2006. Available online: https://www.southend.gov.uk/downloads/file/416/energy-efficiency-introductory-guide (accessed on 19 December 2021).
  115. Baeli, M. Residential Retrofit: Twenty Case Studies; RIBA Publishing: London, UK, 2019. [Google Scholar] [CrossRef]
  116. Smith, L.; Whiffen, T.; Pasquale, L.; National Energy Foundation. Energy efficiency—Technology Landscaping; Scotland’s Energy Efficiency Programme: 2017. Available online: https://www.climatexchange.org.uk/media/1331/technology_landscaping_report_energy_efficiency_technologies.pdf (accessed on 20 December 2021).
  117. Almeida, M.; Ferreira, M. Cost effective energy and carbon emissions optimization in building renovation (Annex 56). Energy Build. 2017, 152, 718–738. [Google Scholar] [CrossRef]
  118. Ben, H.; Steemers, K. Energy retrofit and occupant behaviour in protected housing: A case study of the Brunswick Centre in London. Energy Build. 2014, 80, 120–130. [Google Scholar] [CrossRef]
  119. Mendonça, A. BREEAM—History and Future; Building Research Establishment: Watford, UK, 2018. [Google Scholar]
  120. Building Research Establishment. BREEAM Scheme Document SD 5052; Building Research Establishment: Watford, UK , 2008. [Google Scholar]
  121. Yates, A. Briefing: BREEAM 2008: Moving beyond excellence. Proc. Inst. Civ. Eng. -Civ. Eng. 2008, 161, 150. [Google Scholar] [CrossRef]
  122. Building Research Establishment. BREEAM 2011 FAQs. Available online: https://tools.breeam.com/filelibrary/BREEAM%202011/BREEAM_2011FAQs_6.pdf (accessed on 20 December 2021).
  123. Building Research Establishment. Global BREEAM 2011. Open Letter and Summary Paper. Available online: https://tools.breeam.com/filelibrary/BREEAM%202011/BREEAM_2011_Open_letter_and_summary_paper_PDF.pdf (accessed on 20 December 2021).
  124. Sezer, A. Environmental assessment tools and efficiency in housing and office refurbishment. In Proceedings of the 28th Annual ARCOM Conference, Edinburgh, UK, 3–5 September 2012; Smith, S.D., Ed.; Association of Researchers in Construction Management; pp. 1331–1341. [Google Scholar]
  125. Goode, R.; Xiao, H. Is BREEAM suitable for small and medium refurbishment/maintenance projects? In Proceedings of the 48th ASC Annual International Conference, Birmingham, UK, 11–14 April 2012. [Google Scholar]
  126. Building Research Establishment. BREEAM New Construction 2018 (UK). Available online: https://www.breeam.com/NC2018/#01_introduction_newcon/2introductiontobreeam_nc.htm%3FTocPath%3DIntroduction%2520to%2520BREEAM%7C_____0 (accessed on 20 December 2021).
  127. Parker, J. The Value of BREEAM; BSRIA: Bracknell, UK, 2012. [Google Scholar]
  128. Doggart, J.; Baldwin, D.R. BREEAM international: Regional similarities and differences of an international strategy for environmental assessment of buildings. In Proceedings of the 2nd International Conference: Buildings and the Environment, Paris, France, 9–12 June 1997; pp. 83–90. [Google Scholar]
  129. Freitas, I.A.S.; Zhang, X. Green building rating systems in Swedish market—A comparative analysis between LEED, BREEAM SE, GreenBuilding and Miljöbyggnad. Energy Procedia 2018, 153, 402–407. [Google Scholar] [CrossRef]
  130. Kubba, S. Chapter 2—Basic LEEDTM concepts. In LEED Practices, Certification, and Accreditation Handbook; Kubba, S., Ed.; Butterworth-Heinemann: Boston, MA, USA, 2010; pp. 19–48. [Google Scholar] [CrossRef]
  131. U.S. Green Building Council. Green Building Rating System for New Construction & Major Renovations (LEED-NC), Version 2.1. Available online: https://www.usgbc.org/sites/default/files/LEEDv2.1RS%204-8-03.pdf (accessed on 20 December 2021).
  132. Steelcase. Understanding LEED Version 3. Available online: https://www.steelcase.com/content/uploads/2015/05/understanding_leed_version_31.pdf (accessed on 20 December 2021).
  133. U.S. Green Building Council. LEED v4, the Newest Version of LEED Green Building Program Launches at USGBC’s Annual Greenbuild Conference. Available online: https://www.usgbc.org/articles/leed-v4-newest-version-leed-green-building-program-launches-usgbc%E2%80%99s-annual-greenbuild-confe (accessed on 20 December 2021).
  134. U.S. Green Building Council. LEED v4 Impact Category and Point Allocation Process Overview. Available online: https://www.usgbc.org/resources/leed-v4-impact-category-and-point-allocation-process-overview (accessed on 20 December 2021).
  135. U.S. Green Building Council. LEED v4.1 Building Design and Construction. Getting Started Guide for Beta Participants; U.S. Green Building Council: Washington, DC, USA, 2021. [Google Scholar]
  136. Scofield, J.H. Do LEED-certified buildings save energy? Not really… Energy Build. 2009, 41, 1386–1390. [Google Scholar] [CrossRef]
  137. Scofield, J.H. Efficacy of LEED-certification in reducing energy consumption and greenhouse gas emission for large New York city office buildings. Energy Build. 2013, 67, 517–524. [Google Scholar] [CrossRef] [Green Version]
Figure 1. A systematic approach for sustainable building retrofits [107].
Sustainability 14 01242 g001
Figure 2. Cost versus environmental benefits of the energy hierarchy [107].
Sustainability 14 01242 g002
Figure 3. The weighting of the LEED v4 impact categories [134].
Sustainability 14 01242 g003
Table 1. Limit fabric parameters (U-values) from 1995 to 2021 [1,2,3,4,5,6].
ElementU-Values (W/m2K) For Each Updates of “Part L—Conservation of Fuel and Power”
1995200220062010 Target Emission Rate (TER) Introduced2013 Target Fabric Energy Efficiency (TFEE) IntroducedConsultation Version, January 2021 Target Primary Energy Rate Introduced
Roof0.20–0.25 10.16–0.25 20.250.200.200.16
Exposed walls0.450.350.350.300.300.26
Exposed floor and ground floors0.35–0.45 10.250.250.250.250.18
Semi-exposed walls and floors0.6-----
Windows, doors, and rooflights3.0–3.3 12.0-2.2 32.22.02.0Windows and doors 1.6
Rooflight 2.2
Air permeability ---10 m3/(hm2) at 50 Pa10 m3/(hm2) at 50 Pa8 m3/(hm2) at 50 Pa
1 It varies depending on SAP calculation. 2 It varies depending on roof insulation. 3 It varies depending on frame characteristics (i.e., metal, wood, PVC).
Table 2. Post-Occupancy Evaluation methods used [103].
MethodMethodTechniques UsedFocusWhenLength of the Process
The Montfort MethodWalk through the buildingProcess review, functional performance1 year after occupancy1 day
Design Quality IndicatorsOnline questionnaireQuality of the buildingDesign stage and after completion20–30 min
Overall Linking ScoreOnline/hard copy questionnaireUsers’ satisfaction1 year after occupancy10–12 min per person
PROBEQuestionnaire, focus groups, energy, and space auditsUsers’ satisfaction and systems performanceTime suggested after 1 yearFrom 2 days to over a month
BUS Occupant SurveyQuestionnaire, walk through the buildingUsers’ satisfactionTime suggested after 1 year10–15 min per person
Energy Assessment and Reporting MethodologyEnergy use surveyEnergy savedAfter building completionUp to 1 person per week
Learning from ExperienceGroup discussionsProcess reviewDuring the whole construction process, or at the end1 seminar, or continuous evaluation
Table 3. Typical energy use for different house ages [114].
191019751995
Space Heating63%44%33%
Hot Water16%25%25%
Lighting17%25%34%
Cooking4%6%8%
Table 4. BREEAM rating benchmarks [126].
BREEAM Rating% Score
Outstanding≥85
Excellent≥70
Very good≥55
Good≥45
Pass≥30
Table 5. LEED version 2.2 rating system vs. LEED version 3.0 [132].
Rating SystemCategory
LEED for New ConstructionGreen Building Design and Construction
LEED for Core and Shell
LEED for School
LEED for Healthcare
LEED for Retail
LEED for Commercial InteriorsGreen Interior Design and Construction
LEED for Retail Interiors
LEED for Existing BuildingsGreen Buildings Operations and Maintenance
LEED for Existing Schools
LEED for Neighbourhood DevelopmentGreen Neighbourhood Development
LEED for HomesGreen Home Design and Construction
Publisher’s Note: MDPI stays neutral with regard to jurisdictional claims in published maps and institutional affiliations.

