
The pH Value Control of Morphology and Luminescence Properties of Gd2O2S: Tb3+ Phosphors


Abstract
:1. Introduction
2. Materials and Methods
2.1. Preparation
2.2. Characterizaton
3. Results and Discussion
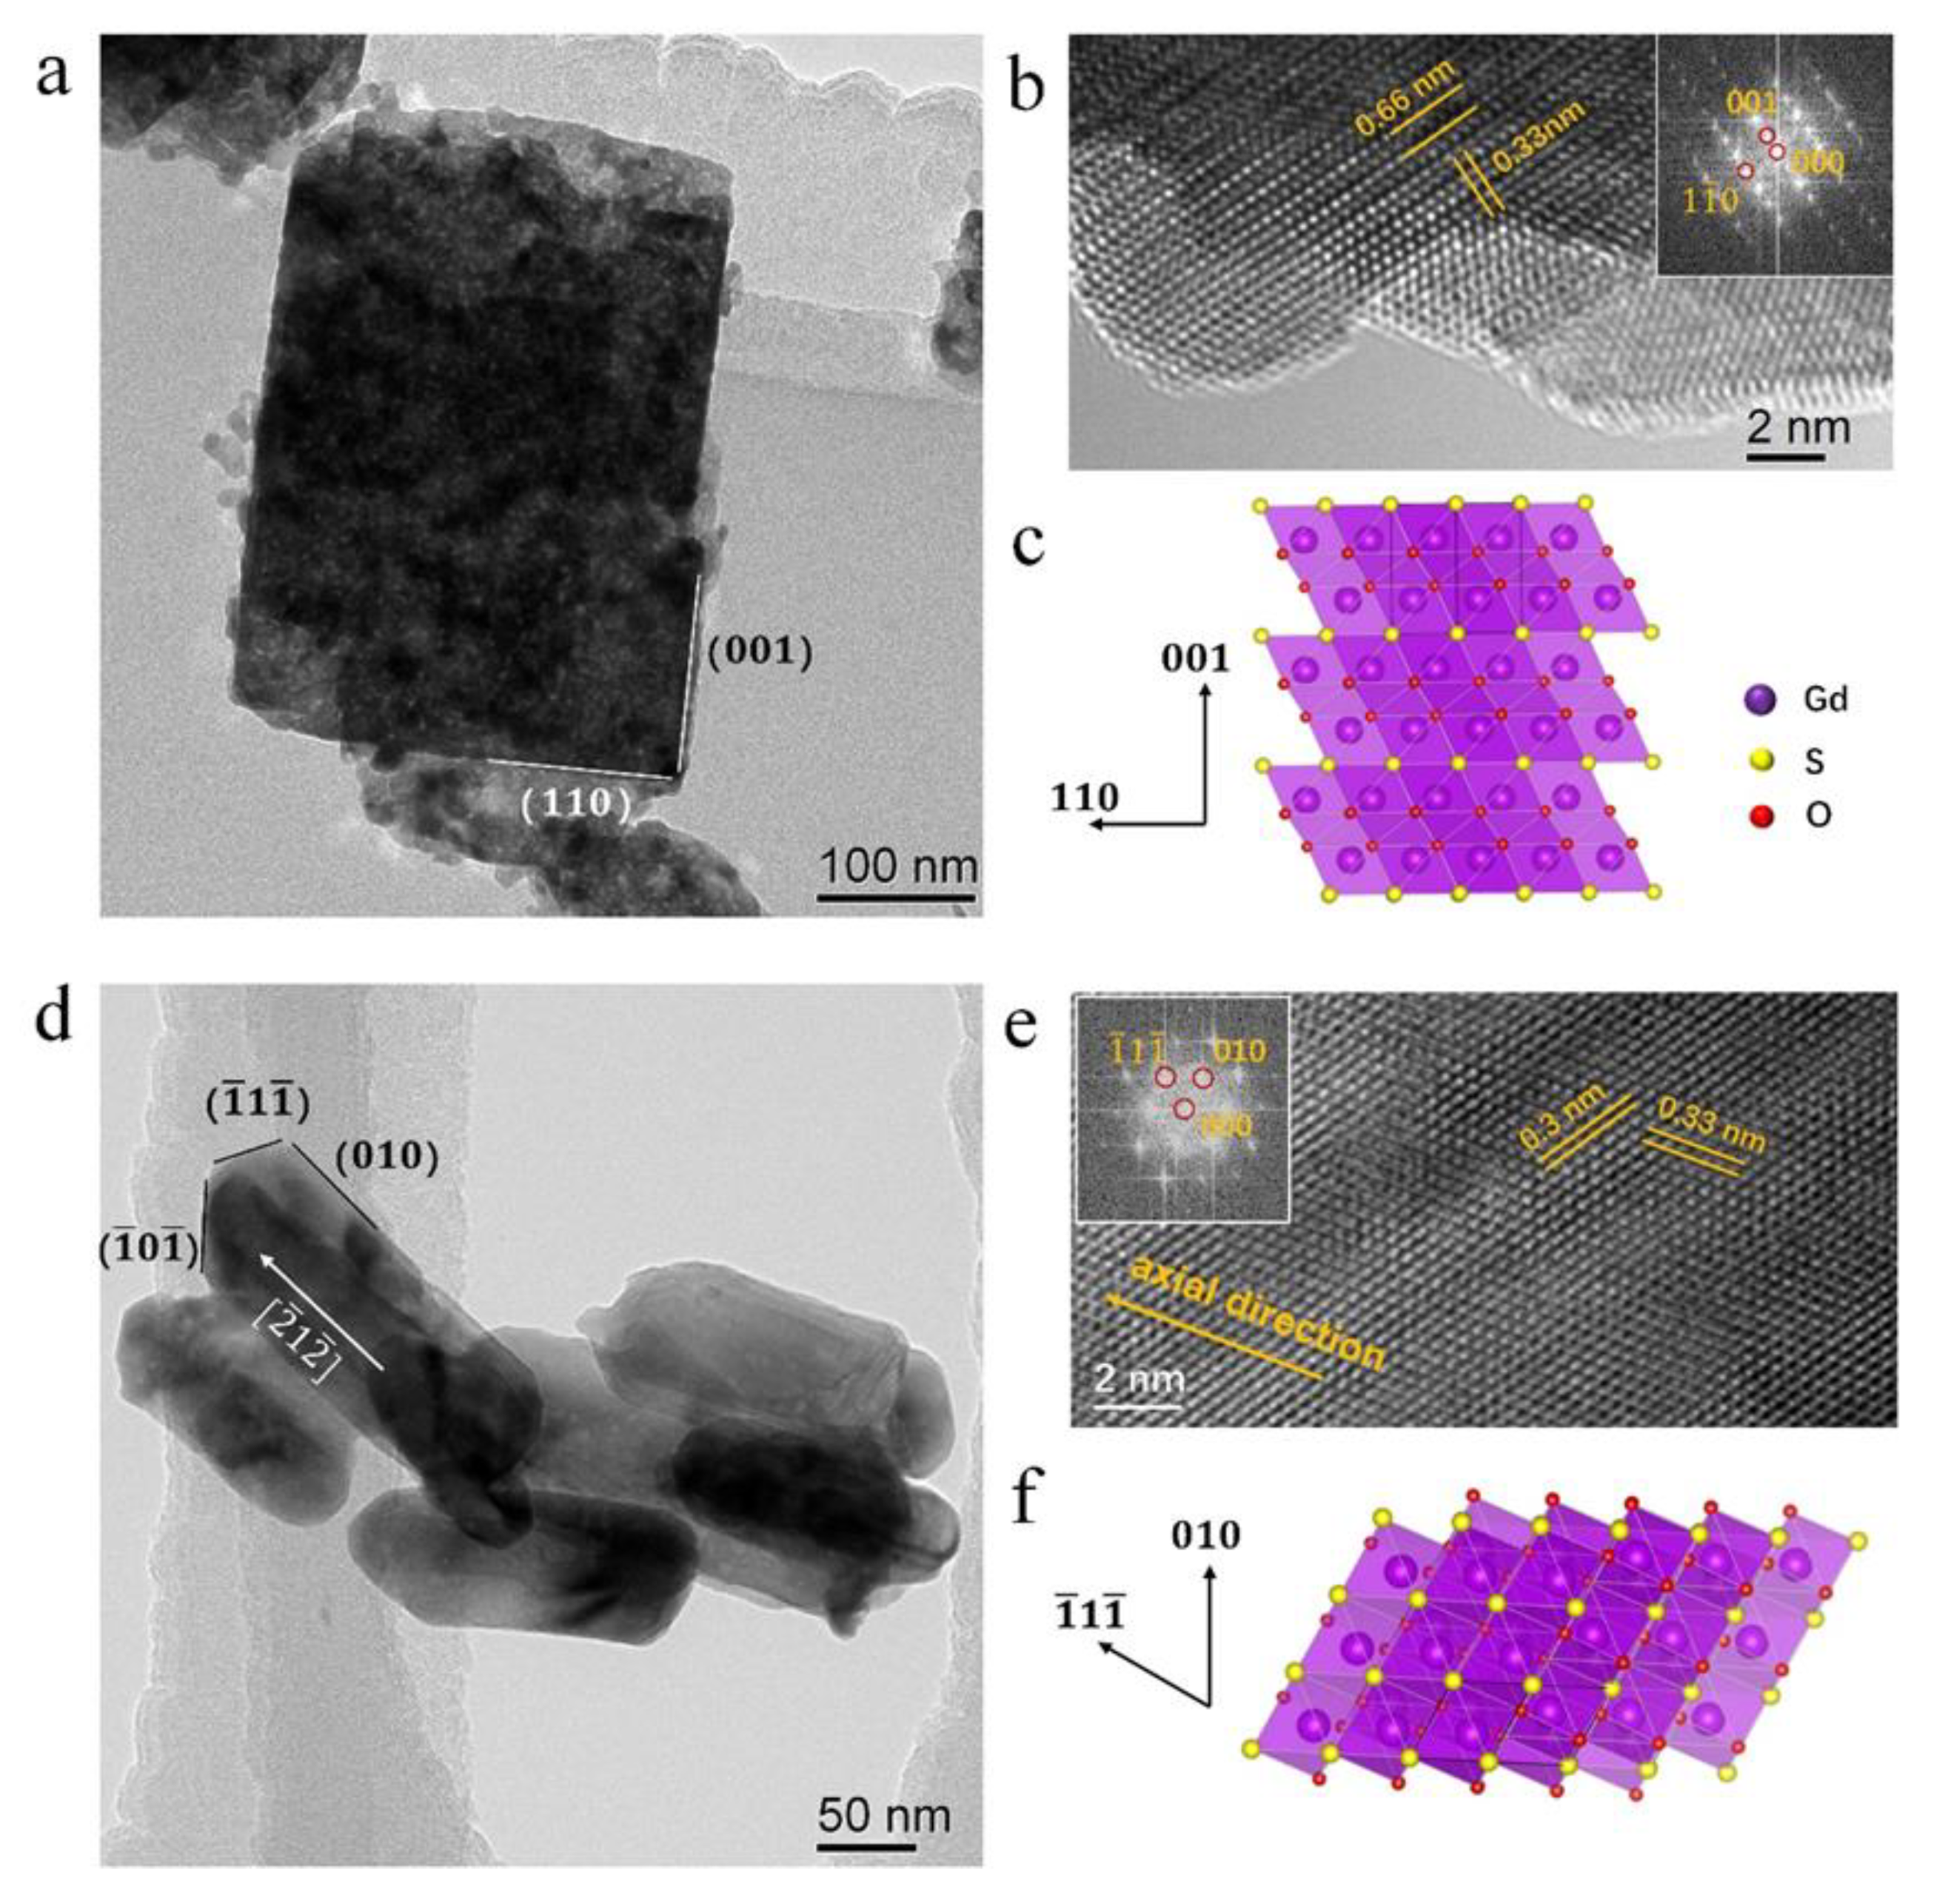
3.1. Morphology
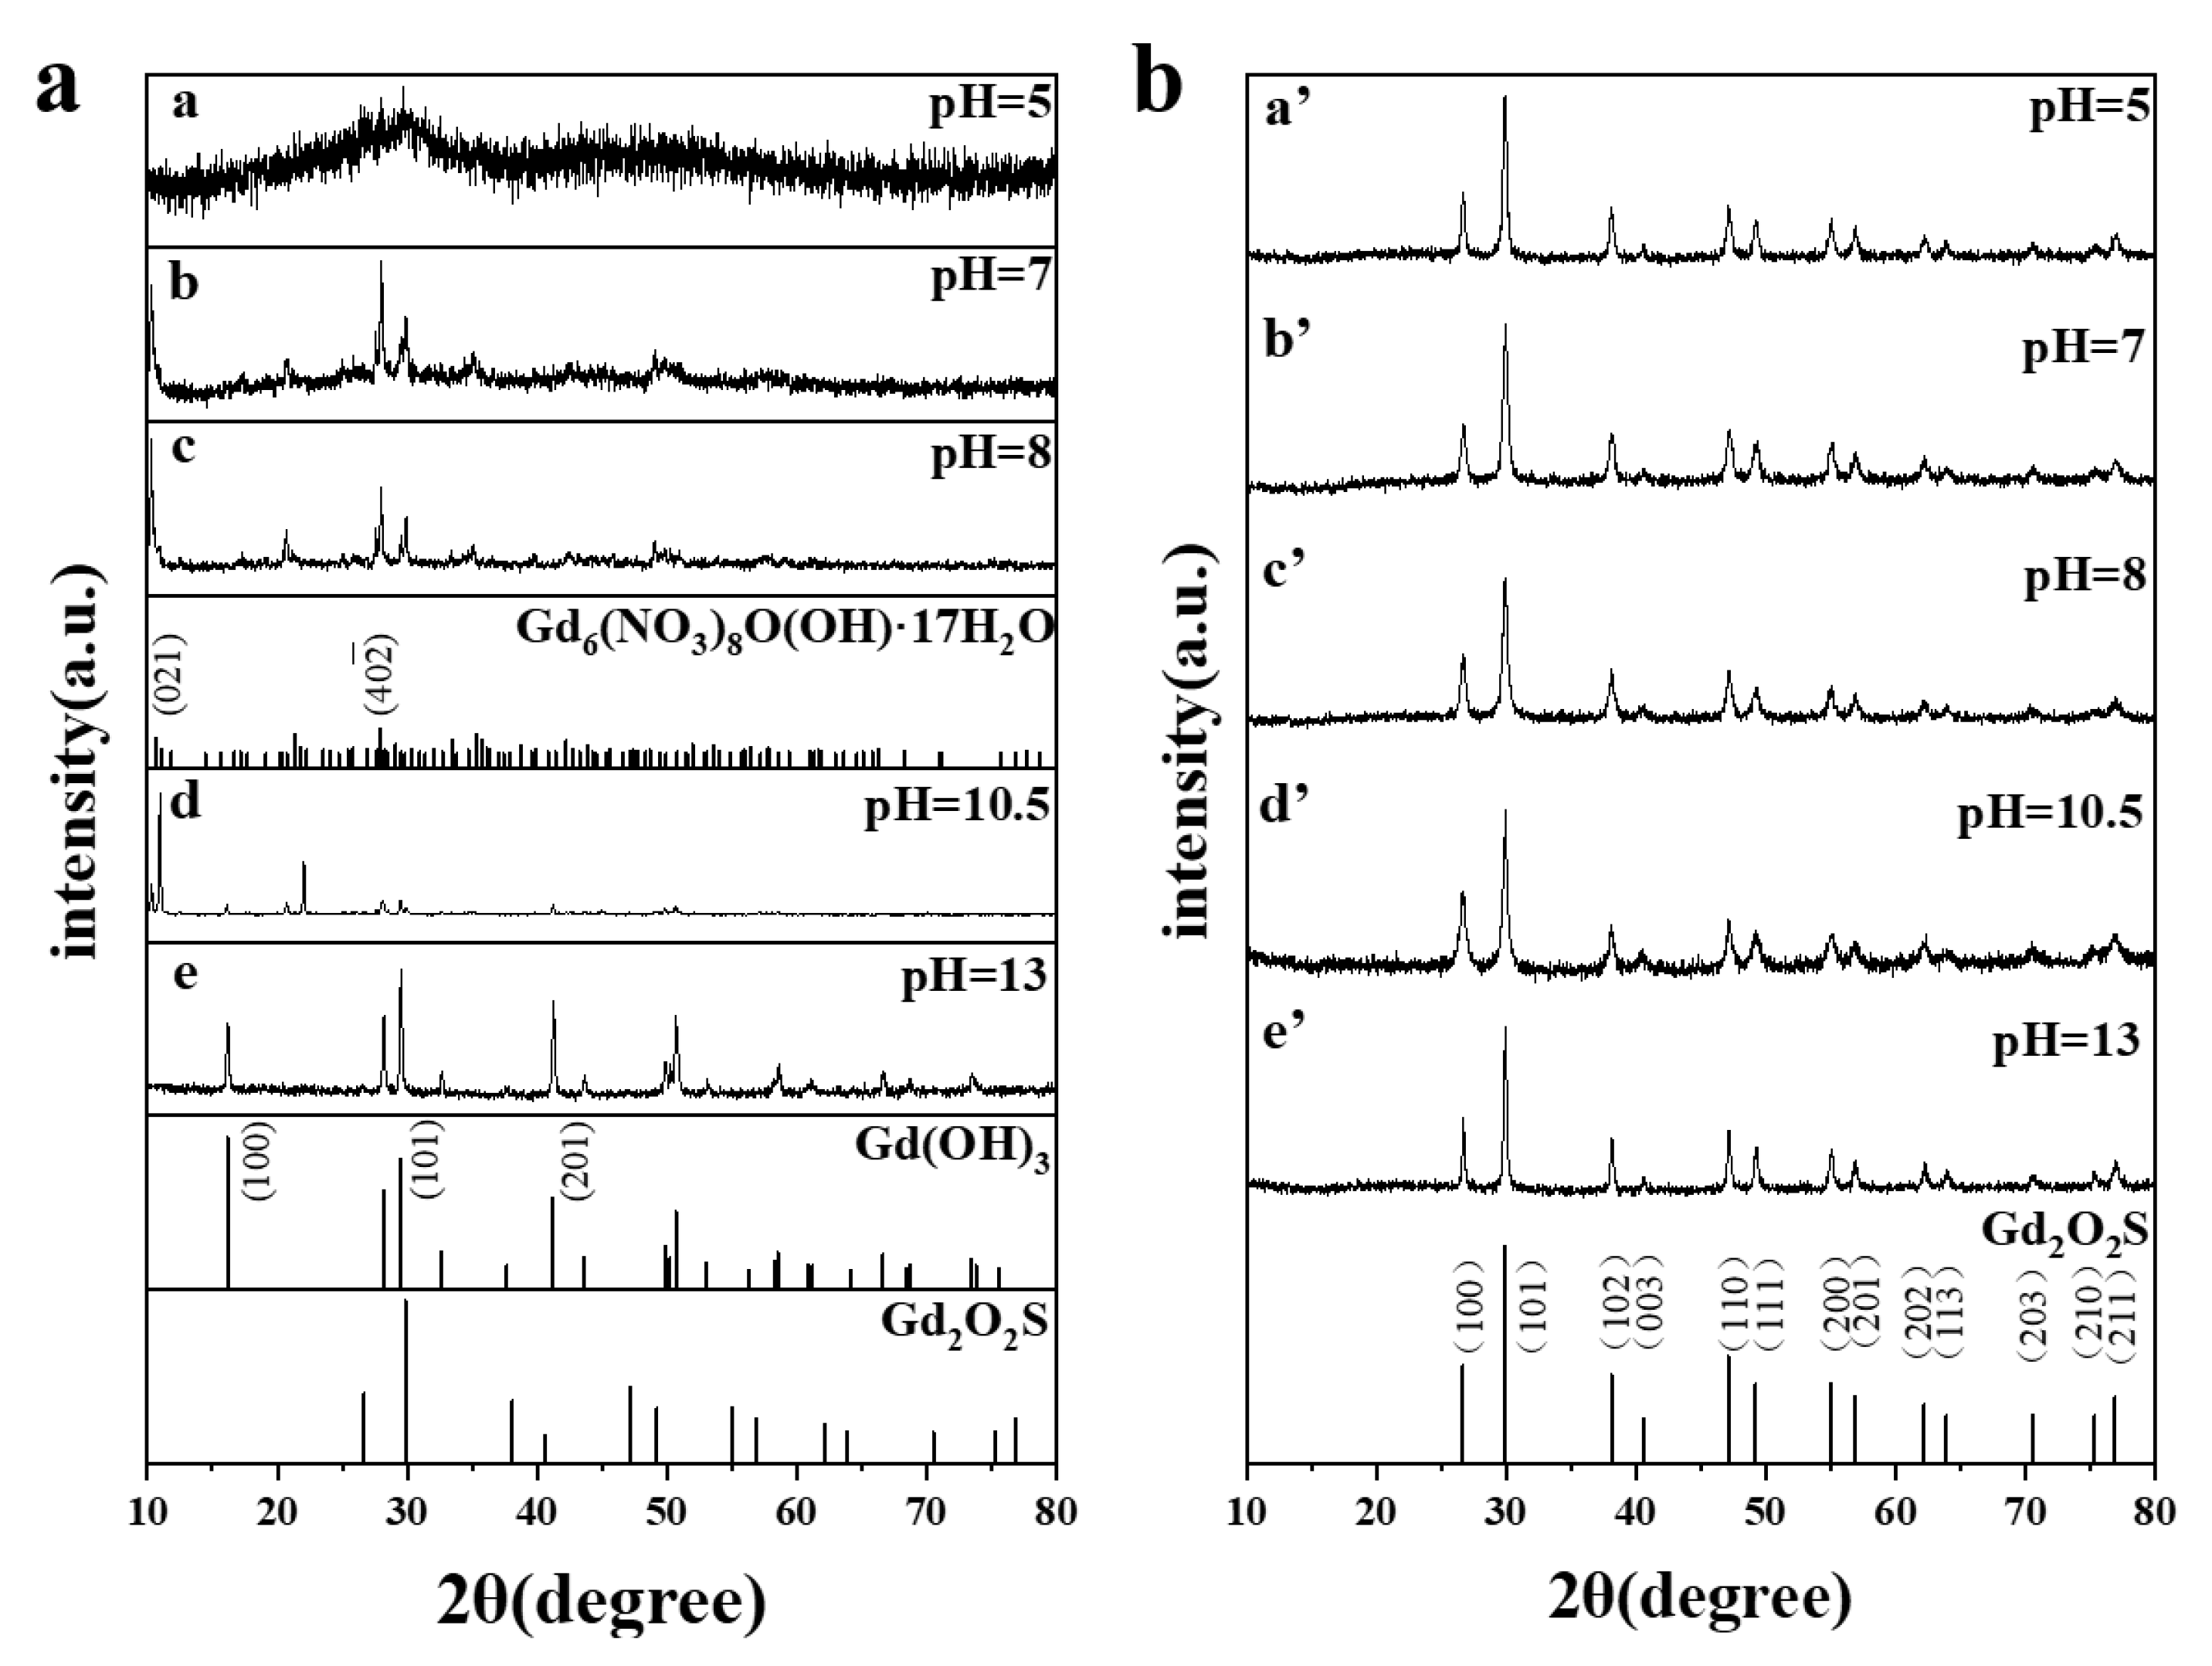
3.2. Structures
3.3. Luminescence Properties
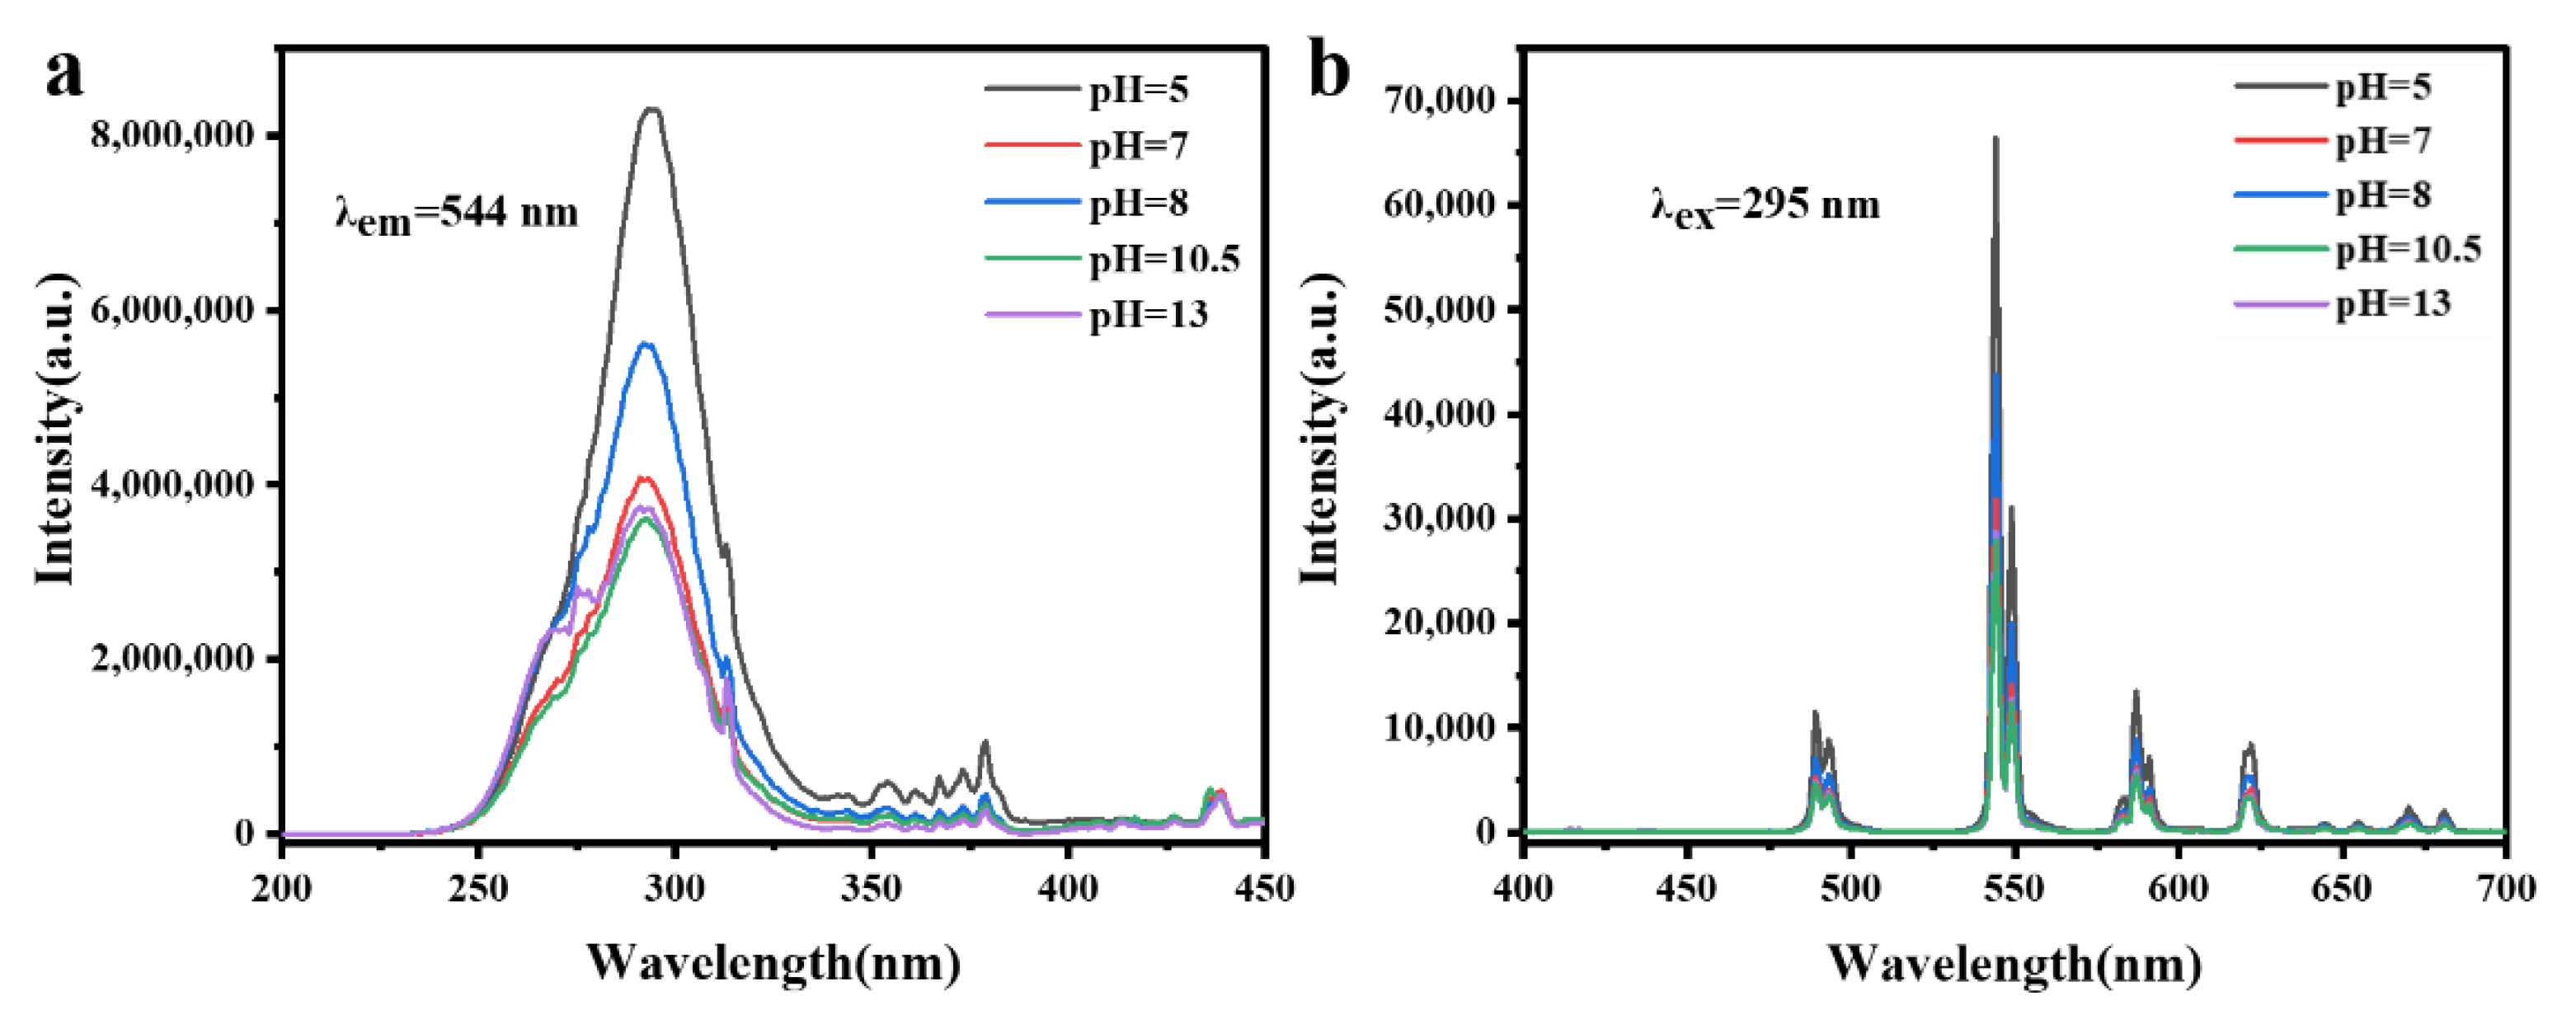
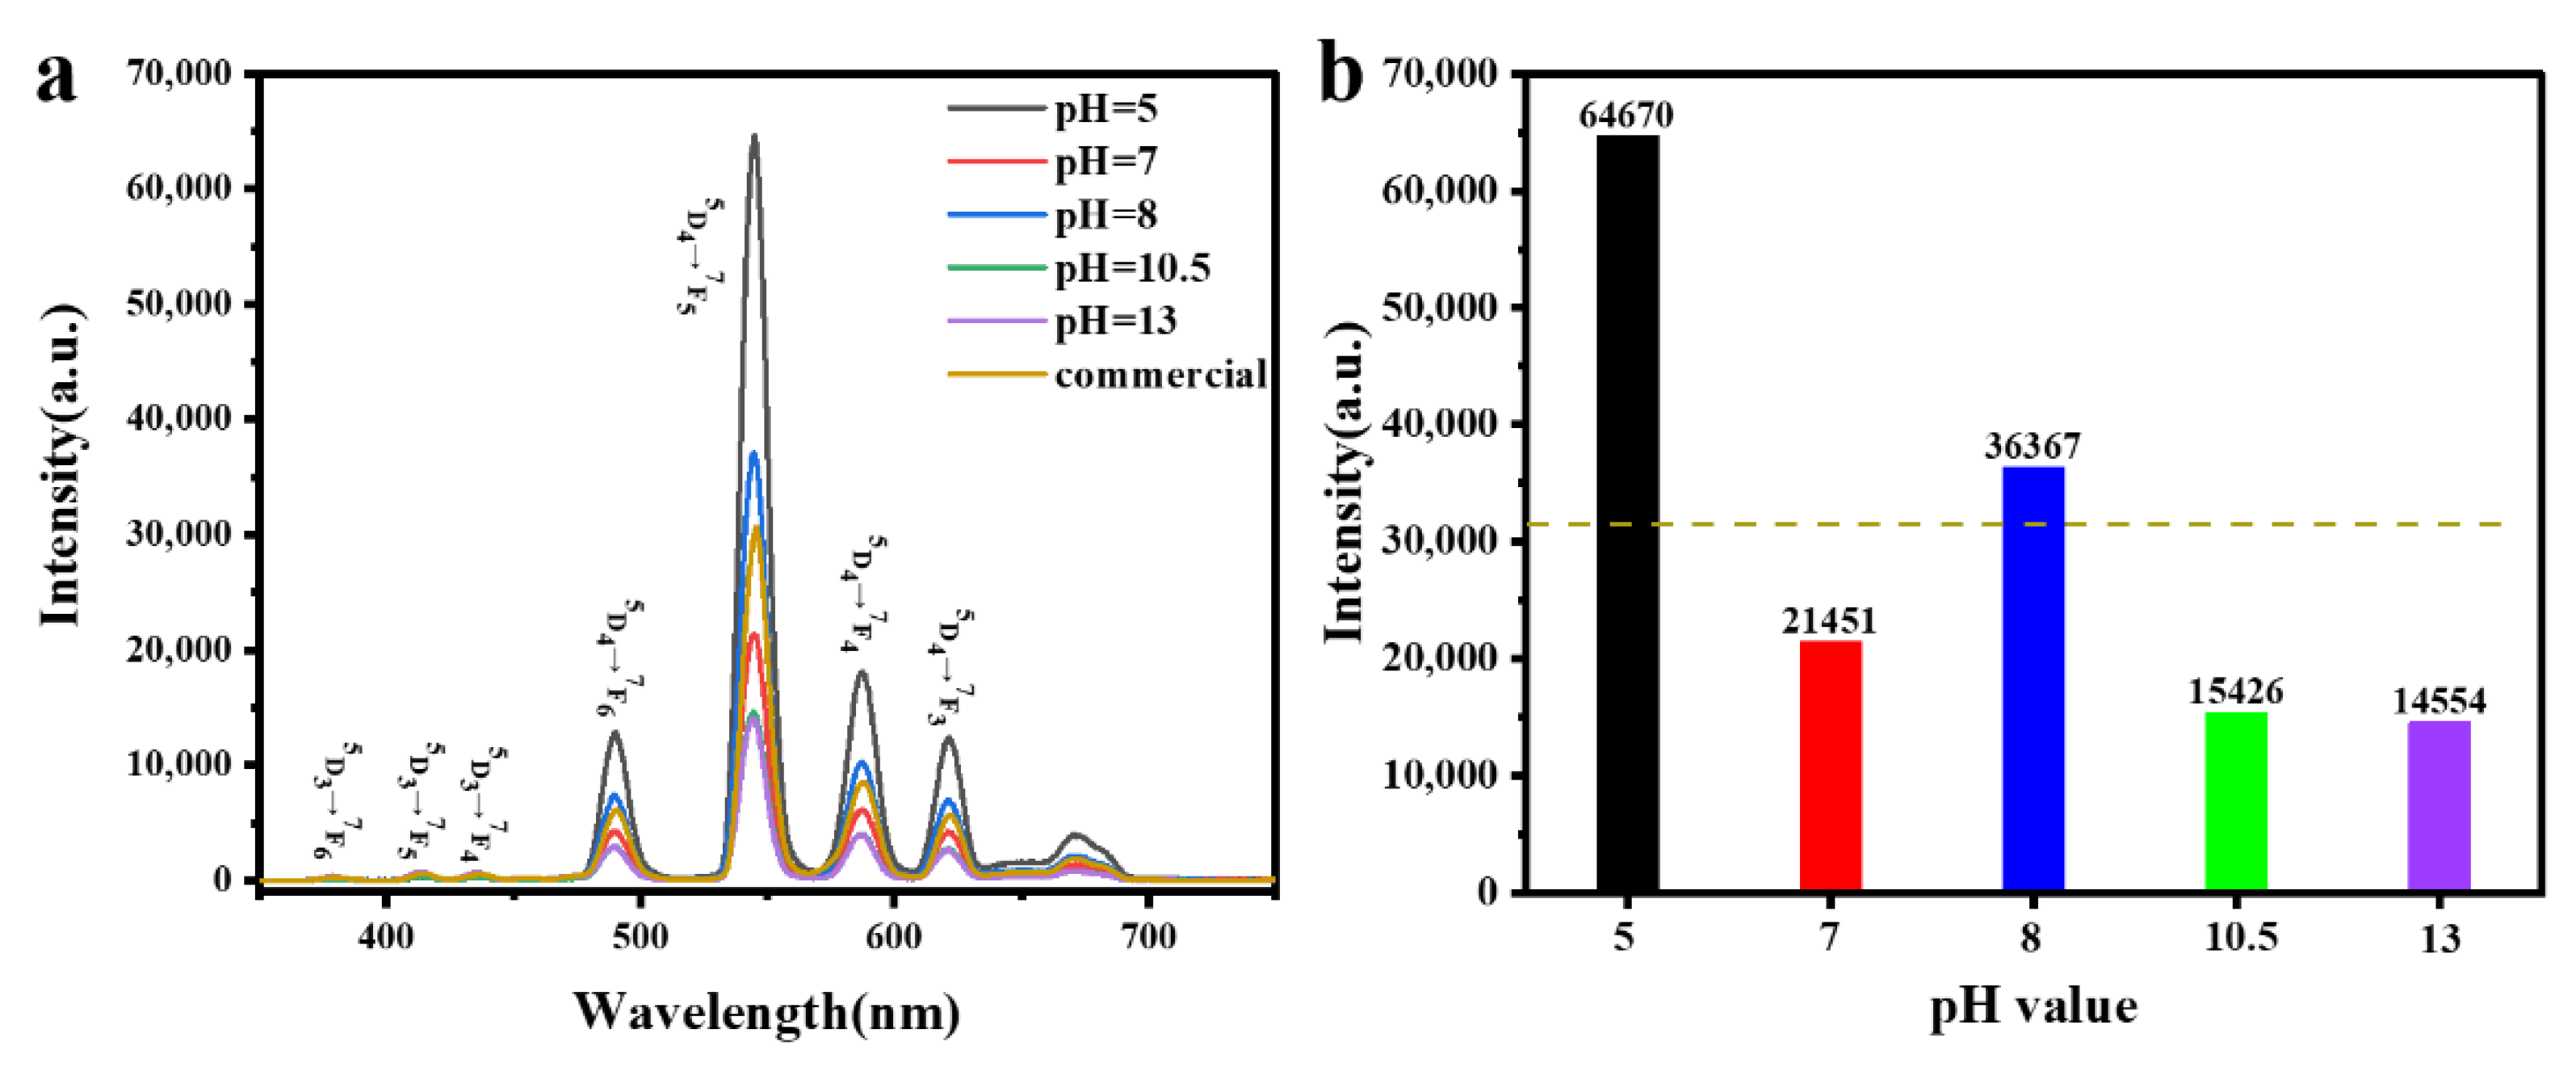
3.3.1. Photoluminescence
3.3.2. Cathodoluminescence
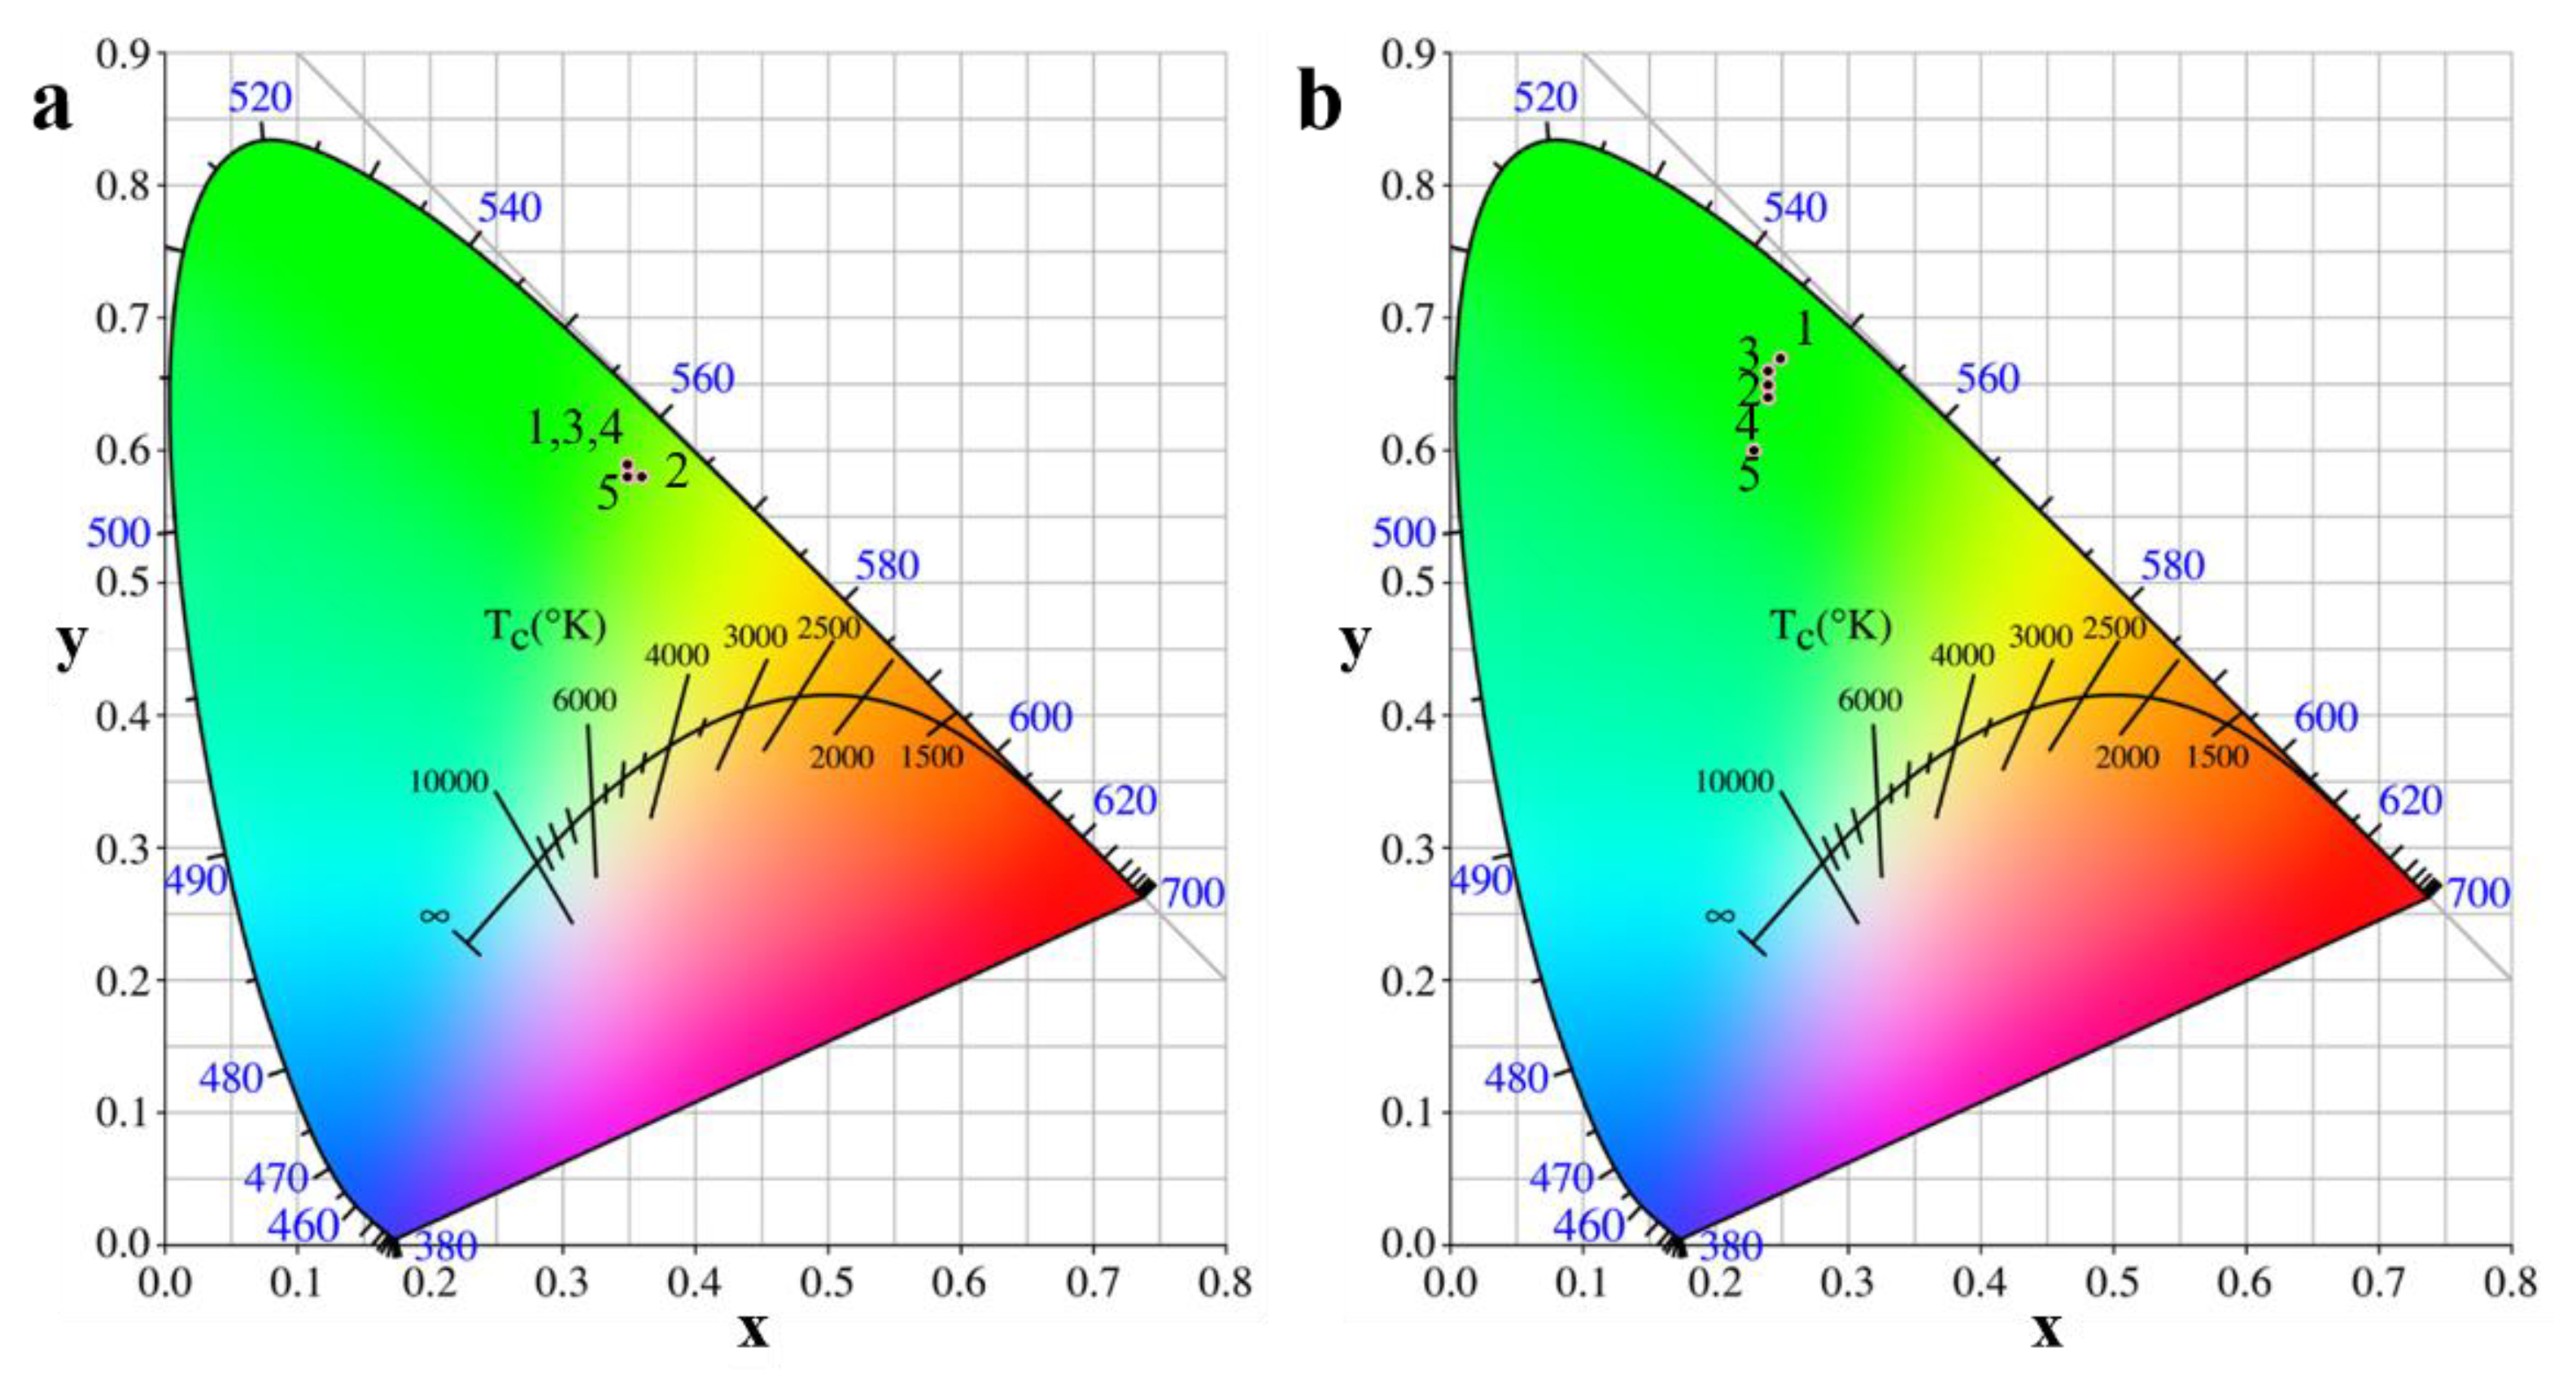
3.3.3. CIE chromaticity Diagram
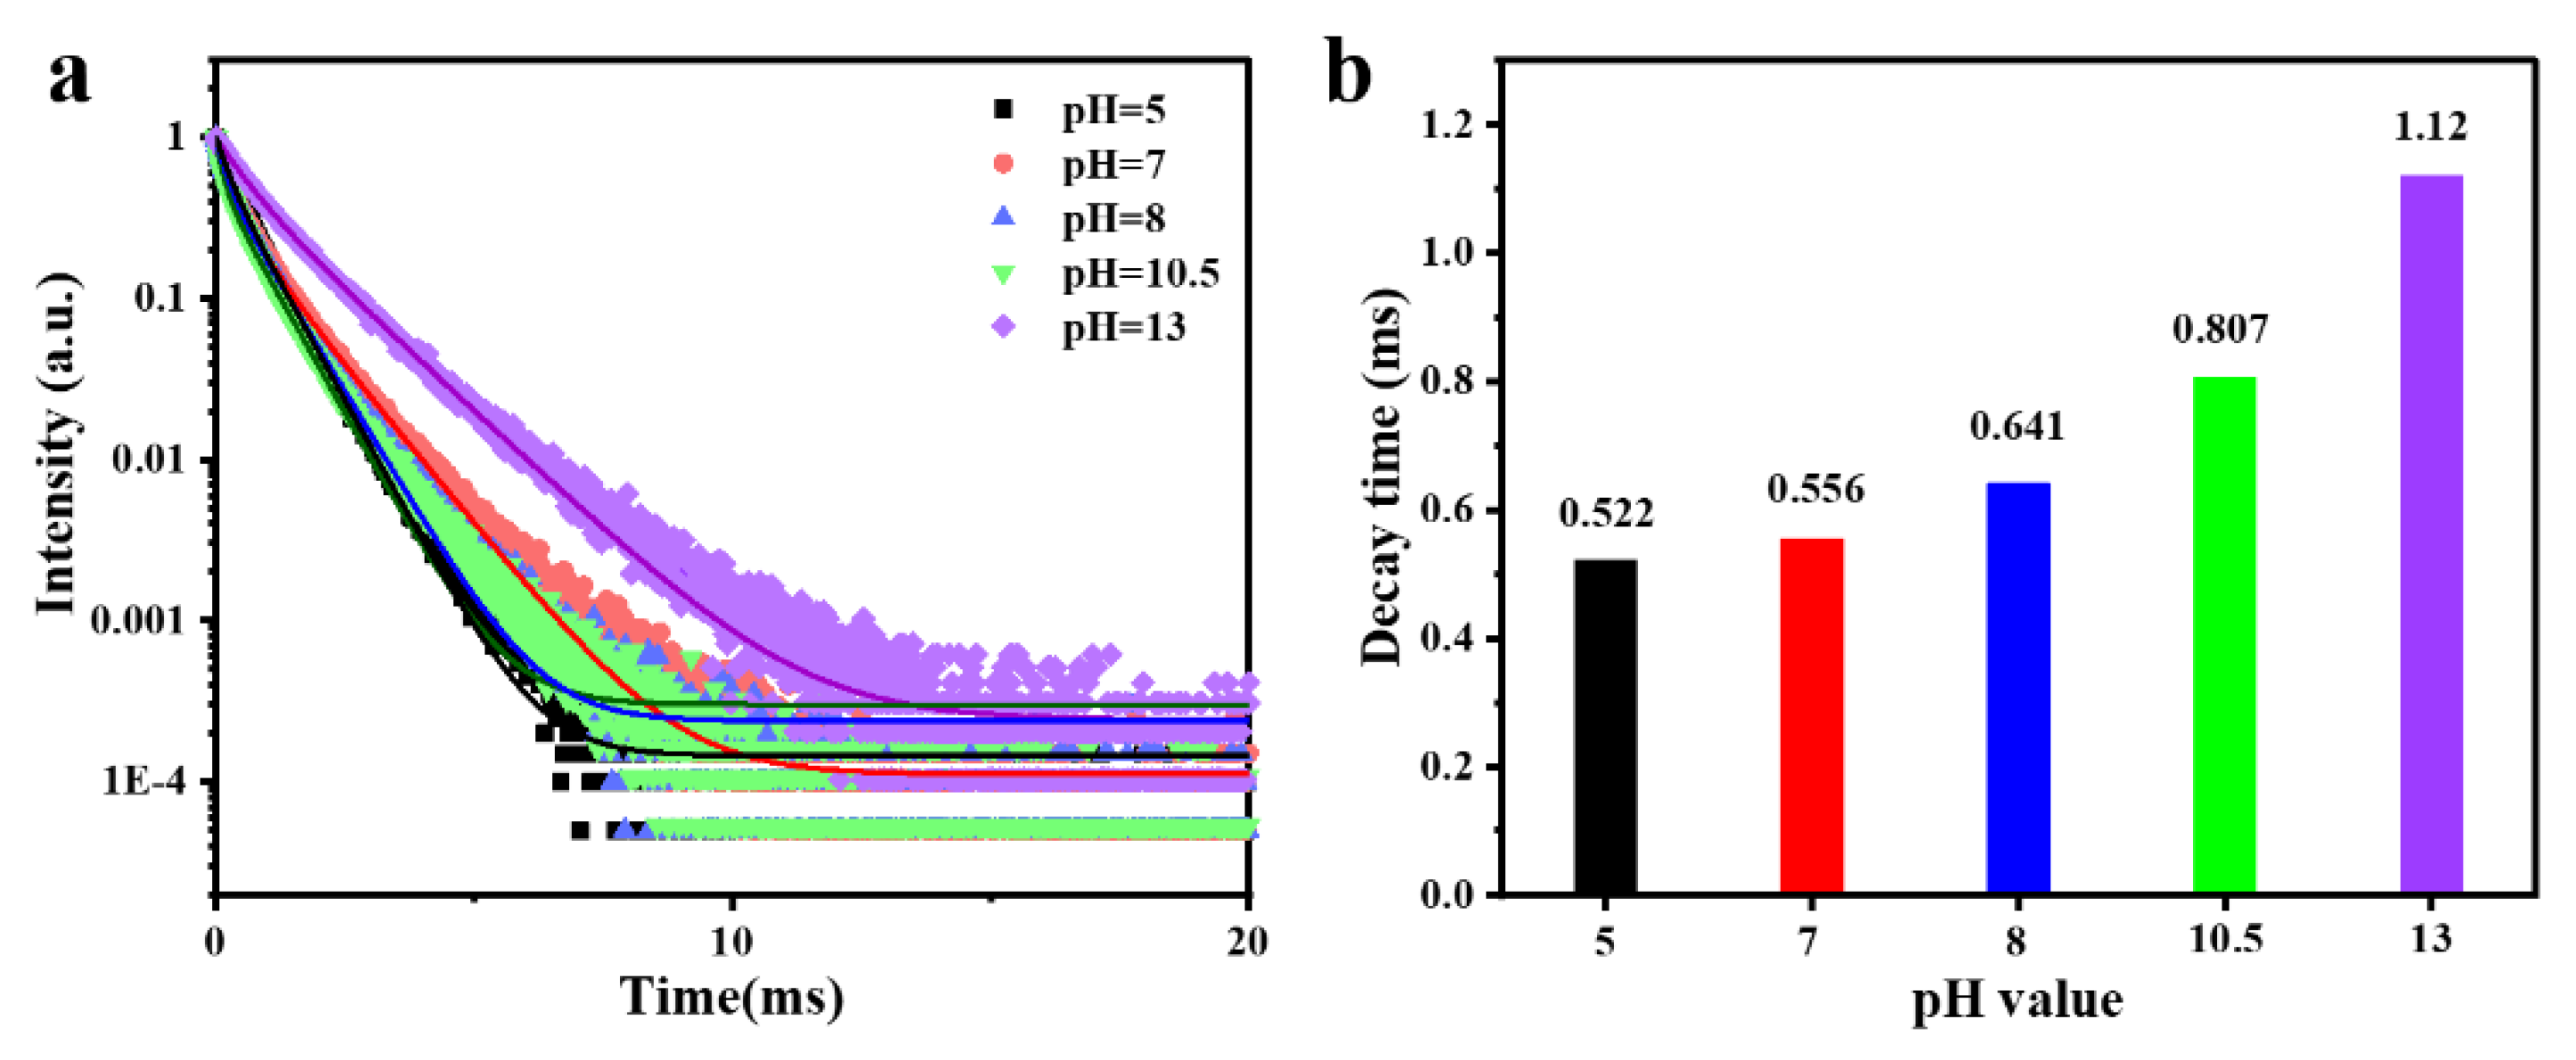
3.3.4. Luminescence Decay Curves
4. Conclusions
Author Contributions
Funding
Institutional Review Board Statement
Informed Consent Statement
Data Availability Statement
Conflicts of Interest
References
- Thirumalai, J.; Chandramohan, R.; Vijayan, T.A.; Somasundaram, R.M. Preparation of Highly Ordered Growth of Single-Crystalline Gd2O2S:Eu3+ Nanostructures. Mater. Res. Bull. 2011, 46, 285–291. [Google Scholar] [CrossRef]
- Sang, X.; Lian, J.; Wu, N. Synthesis Characterization and Formation Mechanism of Gd2O2S:Pr3+,Ce3+ Phosphors by Sealed Triple-Crucible Method. J. Asian. Ceram. Soc. 2020, 3, 733–744. [Google Scholar] [CrossRef]
- Song, Y.; You, H.; Huang, Y.; Yang, M.; Zheng, Y.; Zhang, L.; Guo, N. Highly Uniform and Monodisperse Gd2O2S:Ln3+ (Ln= Eu, Tb) Submicrospheres: Solvothermal Synthesis and Luminescence Properties. Inorg. Chem. 2010, 49, 11499–11504. [Google Scholar] [CrossRef]
- Wang, W.; Kou, H.; Liu, S.; Shi, Y.; Li, J.; Li, Y.; Feng, X.; Pan, Y.; Guo, J. Comparison of the Optical and Scintillation Properties of Gd2O2S:Pr, Ce Ceramics Fabricated by Hot Pressing and Pressureless Sintering. Opt. Mater. 2015, 42, 199–203. [Google Scholar] [CrossRef]
- Katumo, N.; Ruiz Preciado, L.A.; Kumar, V.; Hernandez Sosa, G.; Richards, B.S.; Howard, I.A. Anticounterfeiting Labels with Smartphone-Readable Dynamic Luminescent Patterns Based on Tailored Persistent Lifetimes in Gd2O2S:Eu3+ /Ti4+. Adv. Mater. Technol.-US 2021, 6, 2100047. [Google Scholar] [CrossRef]
- Lei, L.; Zhang, S.; Xia, H.; Tian, Y.; Zhang, J.; Xu, S. Controlled Synthesis of Lanthanide-Doped Gd2O2S Nanocrystals with Novel Excitation-Dependent Multicolor Emissions. Nanoscale 2017, 9, 5718–5724. [Google Scholar] [CrossRef] [Green Version]
- Wang, F.; Yang, B.; Zhang, J.; Dai, Y.; Ma, W. Highly Enhanced Luminescence of Tb3+-Activated Gadolinium Oxysulfide Phosphor by Doping with Zn2+ Ions. J. Lumin. 2010, 130, 473–477. [Google Scholar] [CrossRef]
- Da Silva, A.A.; Cebim, M.A.; Davolos, M.R. Excitation Mechanisms and Effects of Dopant Concentration in Gd2O2S:Tb3+ Phosphor. J. Lumin. 2008, 128, 1165–1168. [Google Scholar] [CrossRef]
- Giakoumakis, G.E.; Nomicos, C.D.; Sandilos, P.X. Absolute Efficiency of Gd2O2S:Tb Screens Under Fluoroscopic Conditions. Phys. Med. Biol. 1989, 34, 673–678. [Google Scholar] [CrossRef]
- Huang, X.; Ding, J.; Liu, X.; Li, X.; Chen, H.; Hu, D.; Zhu, D.; Xie, T.; Zhou, J.; Jiang, X.; et al. Fabrication of Gd2O2S:Tb Scintillation Ceramics From the Uniformly Doped Nanopowder. Opt. Mater. 2021, 117, 111192. [Google Scholar] [CrossRef]
- Yasuda, R.; Katagiri, M.; Matsubayashi, M. Influence of Powder Particle Size and Scintillator Layer Thickness On the Performance of Gd2O2S:Tb Scintillators for Neutron Imaging. Nucl. Instrum. Methods Phys. Res. Sect. A Accel. Spectrometers Detect. Assoc. Equip. 2012, 680, 139–144. [Google Scholar] [CrossRef]
- Zhang, B.; Zou, H.; Dai, Y.; Song, Y.; Zheng, K.; Zhou, X.; Sheng, Y. Controlled Synthesis and Morphology Dependent Luminescence of Lu2O2S:Eu3+ Phosphors. RSC Adv. 2016, 6, 7846–7853. [Google Scholar] [CrossRef]
- Wang, F.; Liu, X. Recent Advances in the Chemistry of Lanthanide-Doped Upconversion Nanocrystals. Chem. Soc. Rev. 2009, 38, 976–989. [Google Scholar] [CrossRef]
- Xie, Y.; Ma, S.; Wang, Y.; Xu, M.; Lu, C.; Xiao, L.; Deng, S. Controlled Synthesis and Luminescence Properties of CaMoO4:Eu3+ Microcrystals. Opt. Mater. 2018, 77, 13–18. [Google Scholar] [CrossRef]
- Jia, K.; Bi, Z.; Liu, Y.; Lyu, Y. Electronic Structure, Morphology-Controlled Synthesis, and Luminescence Properties of YF3: Eu3+. J. Sol-Gel Sci. Technol. 2021, 98, 497–507. [Google Scholar] [CrossRef]
- Zhang, B.; Zou, H.; Guan, H.; Dai, Y.; Song, Y.; Zhou, X.; Sheng, Y. Lu2O2S:Tb3+, Eu3+Nanorods: Luminescence, Energy Transfer, and Multicolour Tuneable Emission. Crystengcomm 2016, 18, 7620–7628. [Google Scholar] [CrossRef]
- Xu, G.X.; Sang, X.T.; Lian, J.B.; Wu, N.C.; Zhang, X. Solvothermal Synthesis and Luminescence Properties of Gd2O2S:RE3+ (RE3+= Eu3+/Tb3+) Hollow Sphere. Key. Eng. Mater. 2019, 807, 1–10. [Google Scholar] [CrossRef]
- Liu, Q.; Pan, H.; Chen, X.; Li, X.; Liu, X.; Li, W.; Hu, Z.; Zhang, X.; Wu, L.; Li, J. Gd2O2S:Tb Scintillation Ceramics Fabricated From High Sinterability Nanopowders Via Hydrogen Reduction. Opt. Mater. 2019, 94, 299–304. [Google Scholar] [CrossRef]
- Liu, F.; Lian, J.; Wu, N.; He, J.; Zhang, X.; Liu, F. One-Step Solvothermal Synthesis, a Worm-Shaped Morphology and Luminescence Properties of Green-Emitting Y2O2S:Tb3+ Nanophosphors. Opt. Laser. Technol. 2018, 99, 167–173. [Google Scholar] [CrossRef]
- Sang, X.; Xu, G.; Lian, J.; Wu, N.; Zhang, X.; He, J. A Template-Free Solvothermal Synthesis and Photoluminescence Properties of Multicolor Gd2O2S:X Tb3+, Y Eu3+ Hollow Spheres. Solid State Sci. 2018, 80, 15–21. [Google Scholar] [CrossRef]
- Wan, Y.; Wang, S.; Luo, W.; Zhao, L. Impact of Preparative pH on the Morphology and Photocatalytic Activity of BiVO4. Int. J. Photoenergy 2012, 2012, 1–7. [Google Scholar] [CrossRef] [Green Version]
- Gómez-Barojas, E.; Sánchez-Mora, E.; Castillo-Abriz, C.; Flores-Rodríguez, E.; Silva-González, R. Synthesis and Study of Optical and Photocatalytic Properties of Mn and Sm Doped ZnS Grown by Sol-Gel. J. Supercond. Nov. Magn. 2013, 26, 2337–2340. [Google Scholar] [CrossRef]
- Jia, G.; Liu, K.; Zheng, Y.; Song, Y.; Yang, M.; You, H. Highly Uniform Gd(OH)3 and Gd2O3:Eu3+ Nanotubes: Facile Synthesis and Luminescence Properties. J. Phys. Chem. C 2009, 113, 6050–6055. [Google Scholar] [CrossRef]
- Sahana, M.B.; Sudakar, C.; Dixit, A.; Thakur, J.S.; Naik, R.; Naik, V.M. Quantum Confinement Effects and Band Gap Engineering of SnO2 Nanocrystals in a MgO Matrix. Acta Mater. 2012, 60, 1072–1078. [Google Scholar] [CrossRef]
- Gholami, T.; Salavati-Niasari, M. Effects of Copper:Aluminum Ratio in CuO/Al2O3 Nanocomposite: Electrochemical Hydrogen Storage Capacity, Band Gap and Morphology. Int. J. Hydrogen Energ. 2016, 41, 15141–15148. [Google Scholar] [CrossRef]
- He, C.; Xia, Z.; Liu, Q. Microwave Solid State Synthesis and Luminescence Properties of Green-Emitting Gd2O2S:Tb3+ Phosphor. Opt. Mater. 2015, 42, 11–16. [Google Scholar] [CrossRef]
- Jeong, G.J.; Kang, T.W.; Park, Y.J.; Park, Y.J.; Lee, Y.; Bae, B.; Kim, S.W. Development of a Cyan Blue-Emitting Ba3La2(BO3)4:Ce3+, Tb3+ Phosphor for Use in Dental Glazing Materials: Color Tunable Emission and Energy Transfer. RSC Adv. 2021, 11, 24949–24957. [Google Scholar] [CrossRef]
- Hernandez-Adame, L.; Palestino, G.; Meza, O.; Hernandez-Adame, P.L.; Vega-Carrillo, H.R.; Sarhid, I. Effect of Tb3+ Concentration in the Visible Emission of Terbium-Doped Gadolinium Oxysulfide Microspheres. Solid State Sci. 2018, 84, 8–14. [Google Scholar] [CrossRef]
- Chen, J.; Song, Y.; Li, D.; Ma, Q.; Dong, X.; Yu, W.; Wang, X.; Yang, Y.; Wang, J.; Liu, G. Investigating Efficient Energy Transfer in Novel Strategy-Obtained Gd2O2S:Dy3+, Eu3+ Nanofibers Endowed with White Emitting and Magnetic Dual-Functionality. J. Lumin. 2019, 206, 509–517. [Google Scholar] [CrossRef]
- Birkel, A.; Denault, K.A.; George, N.C.; Doll, C.E.; Héry, B.; Mikhailovsky, A.A.; Birkel, C.S.; Hong, B.; Seshadri, R. Rapid Microwave Preparation of Highly Efficient Ce3+-Substituted Garnet Phosphors for Solid State White Lighting. Chem. Mater. 2012, 24, 1198–1204. [Google Scholar] [CrossRef]
- Zhu, H.; Lin, C.C.; Luo, W.; Shu, S.; Liu, Z.; Liu, Y.; Kong, J.; Ma, E.; Cao, Y.; Liu, R.; et al. Highly Efficient Non-Rare-Earth Red Emitting Phosphor for Warm White Light-Emitting Diodes. Nat. Commun. 2014, 5, 1–10. [Google Scholar] [CrossRef] [PubMed] [Green Version]
- Singh, S.; Singh, D. Structural and Optical Properties of Green Emitting Y2SiO5:Tb3+ and Gd2SiO5:Tb3+ Nanoparticles for Modern Lighting Applications. Rare Metals 2021, 40, 3289–3298. [Google Scholar] [CrossRef]
Publisher’s Note: MDPI stays neutral with regard to jurisdictional claims in published maps and institutional affiliations. |
© 2022 by the authors. Licensee MDPI, Basel, Switzerland. This article is an open access article distributed under the terms and conditions of the Creative Commons Attribution (CC BY) license (https://creativecommons.org/licenses/by/4.0/).
Share and Cite
Jiang, P.; Li, Z.; Lu, W.; Ma, Y.; Tian, W. The pH Value Control of Morphology and Luminescence Properties of Gd2O2S: Tb3+ Phosphors. Materials 2022, 15, 646. https://doi.org/10.3390/ma15020646
Jiang P, Li Z, Lu W, Ma Y, Tian W. The pH Value Control of Morphology and Luminescence Properties of Gd2O2S: Tb3+ Phosphors. Materials. 2022; 15(2):646. https://doi.org/10.3390/ma15020646
Chicago/Turabian StyleJiang, Peng, Zhipeng Li, Wei Lu, Yi Ma, and Wenhuai Tian. 2022. "The pH Value Control of Morphology and Luminescence Properties of Gd2O2S: Tb3+ Phosphors" Materials 15, no. 2: 646. https://doi.org/10.3390/ma15020646
APA StyleJiang, P., Li, Z., Lu, W., Ma, Y., & Tian, W. (2022). The pH Value Control of Morphology and Luminescence Properties of Gd2O2S: Tb3+ Phosphors. Materials, 15(2), 646. https://doi.org/10.3390/ma15020646