
Improvement of Position Repeatability of a Linear Stage with Yaw Minimization

Abstract
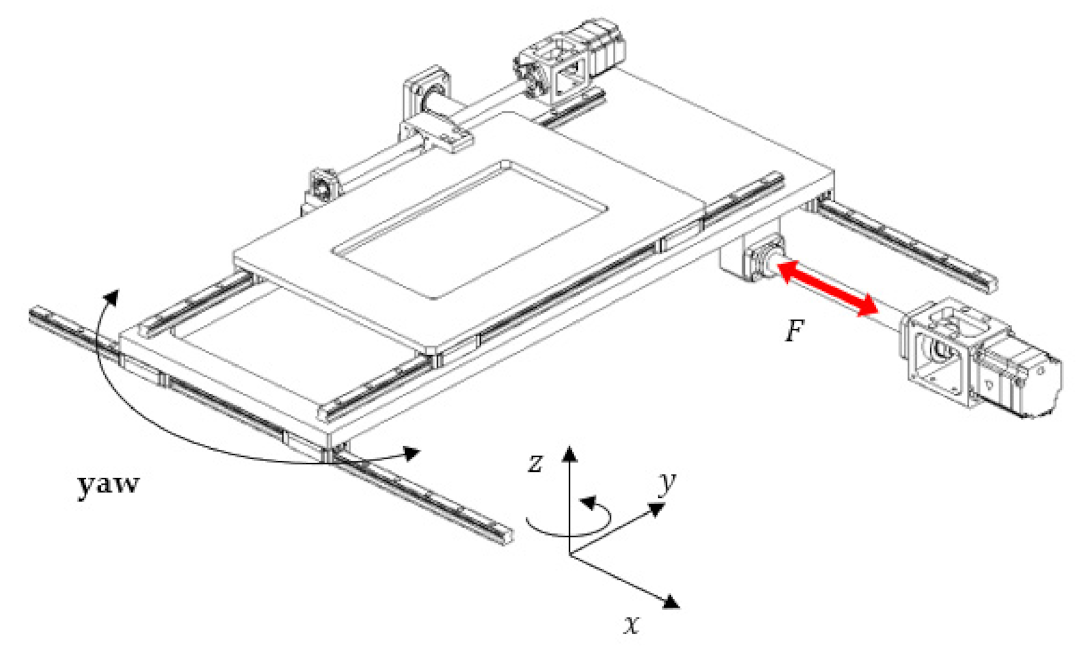
1. Introduction
2. Dynamic Model for Moving Platform
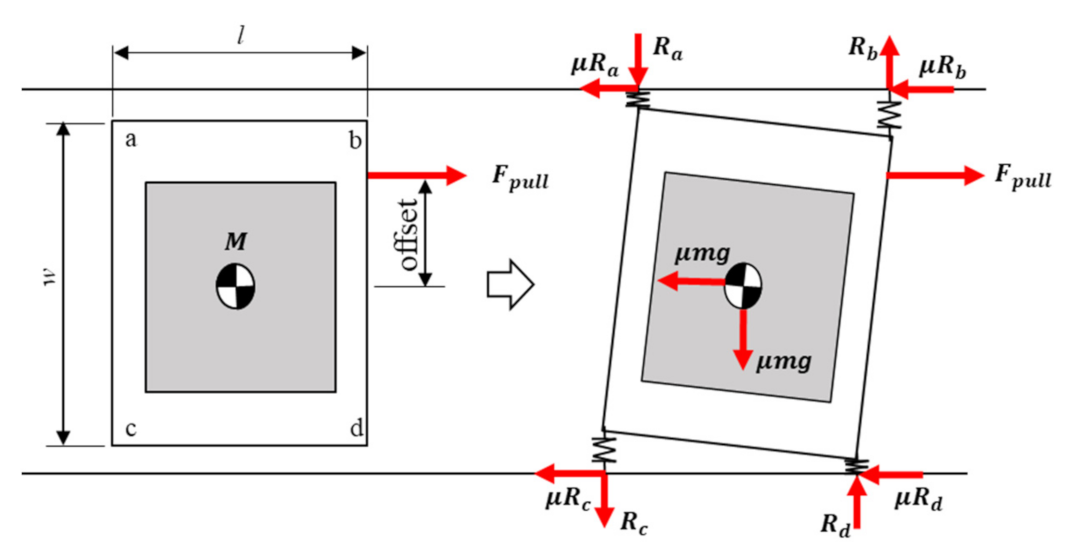
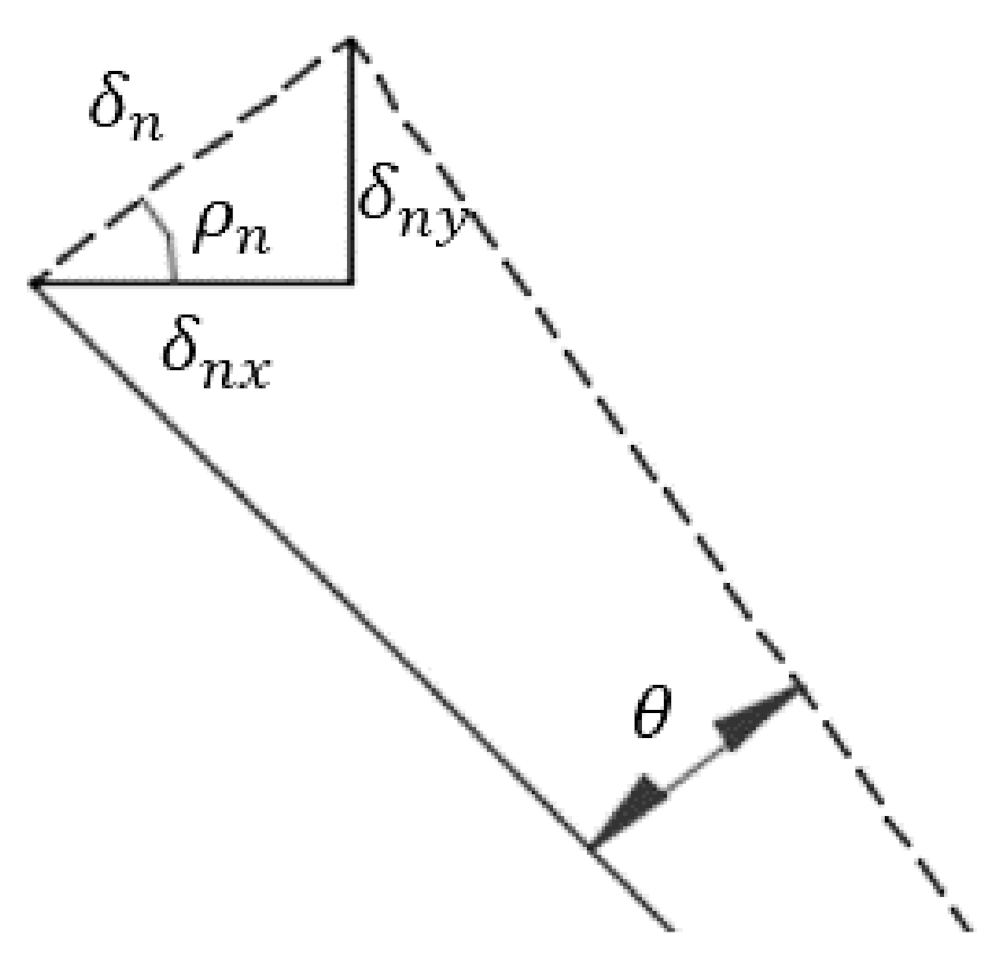
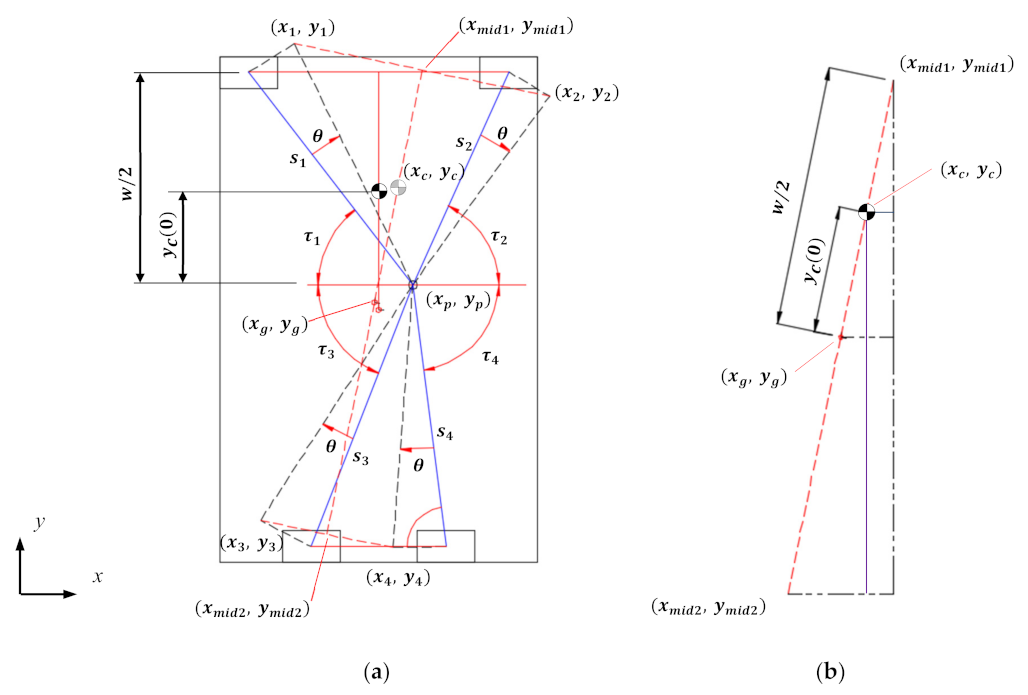
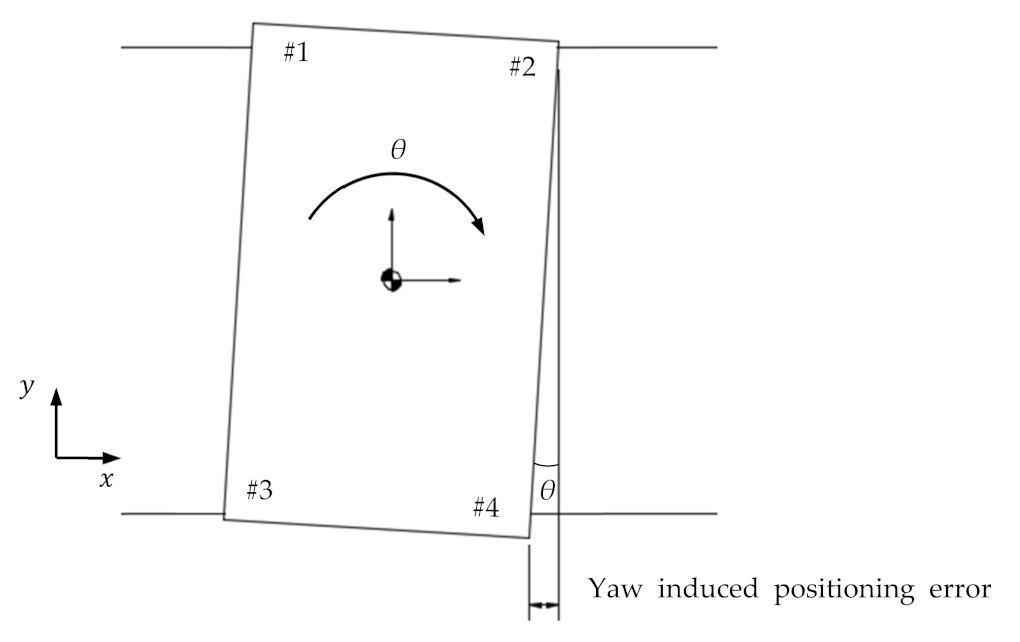
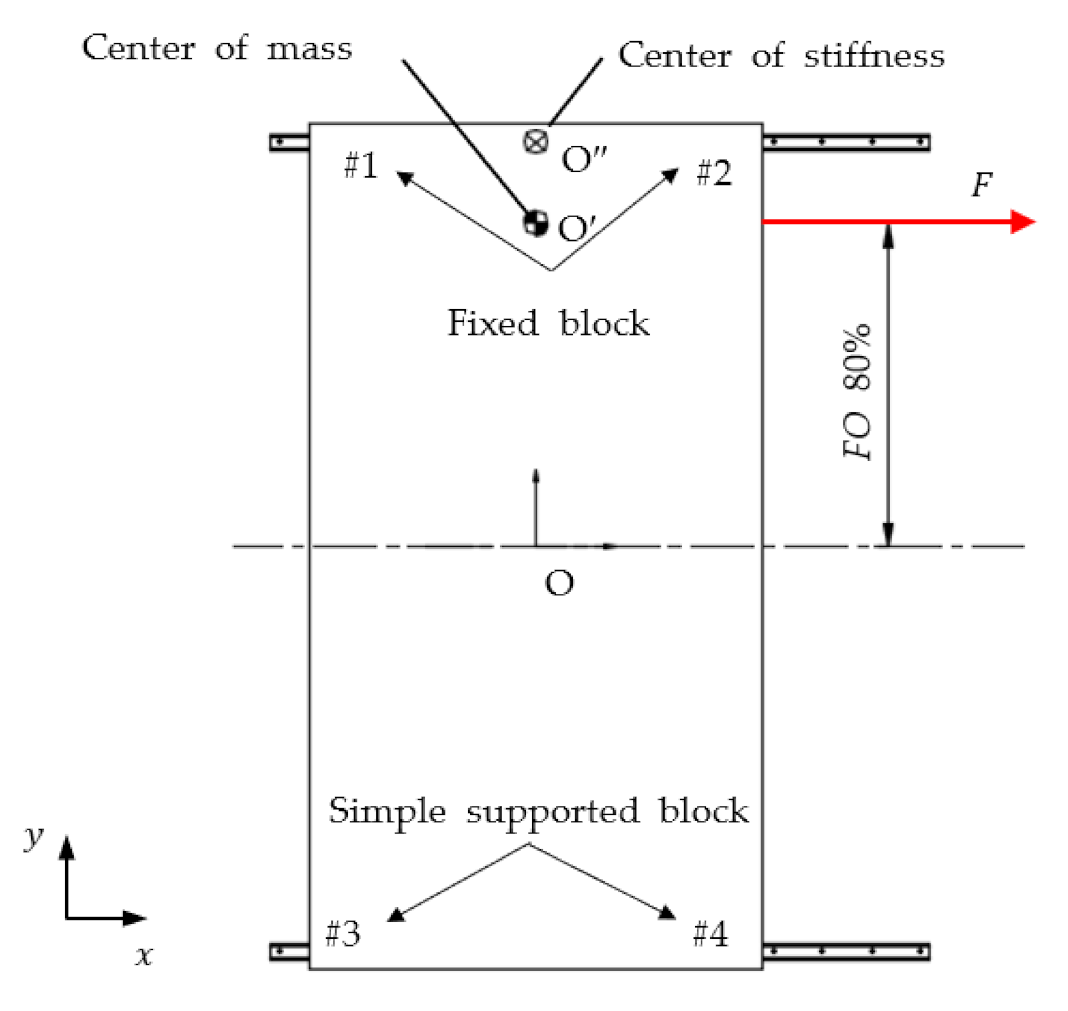
2.1. Yaw Error Motion
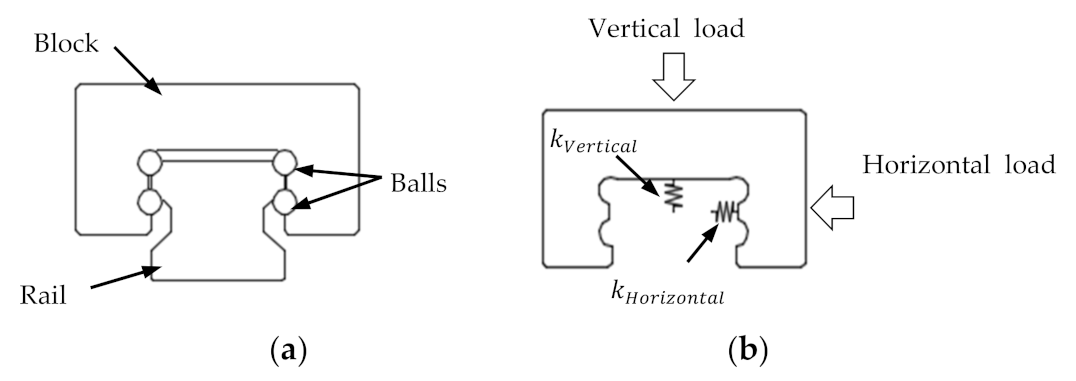
2.2. Stiffness of LM Guide
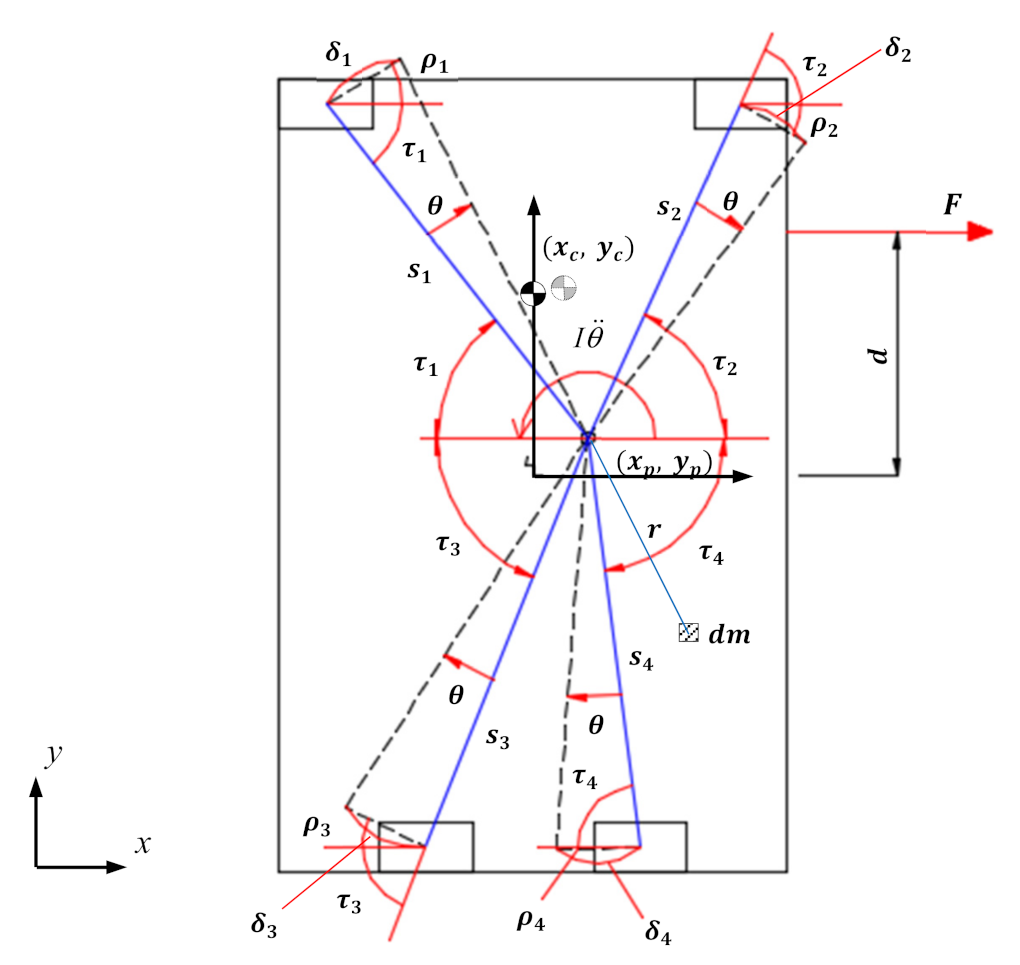
2.3. Equations of Motion
3. Factors Affecting the Yaw Motion
3.1. Uncontrollable Parameters: Given Conditions
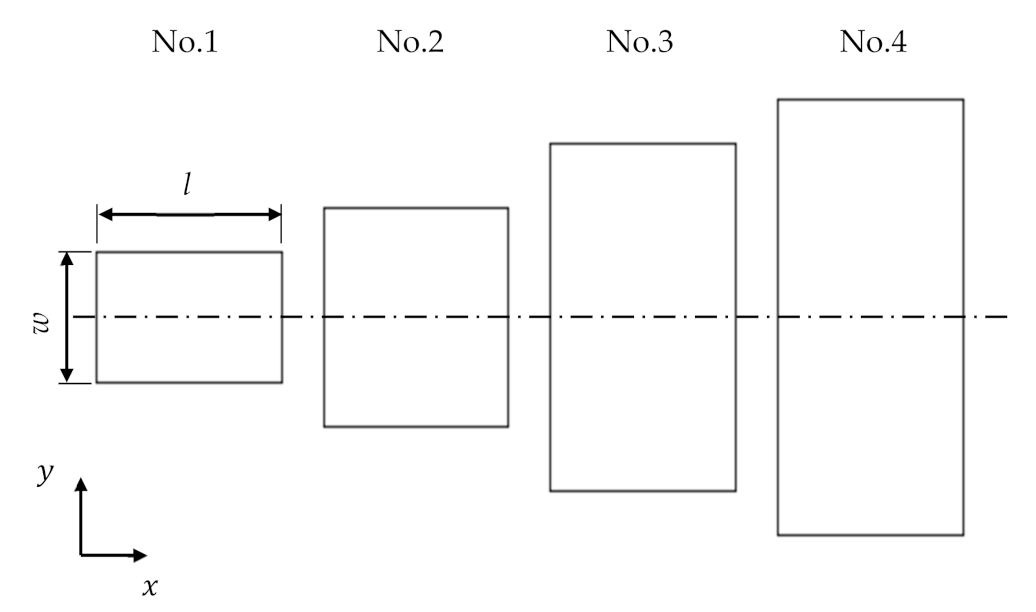
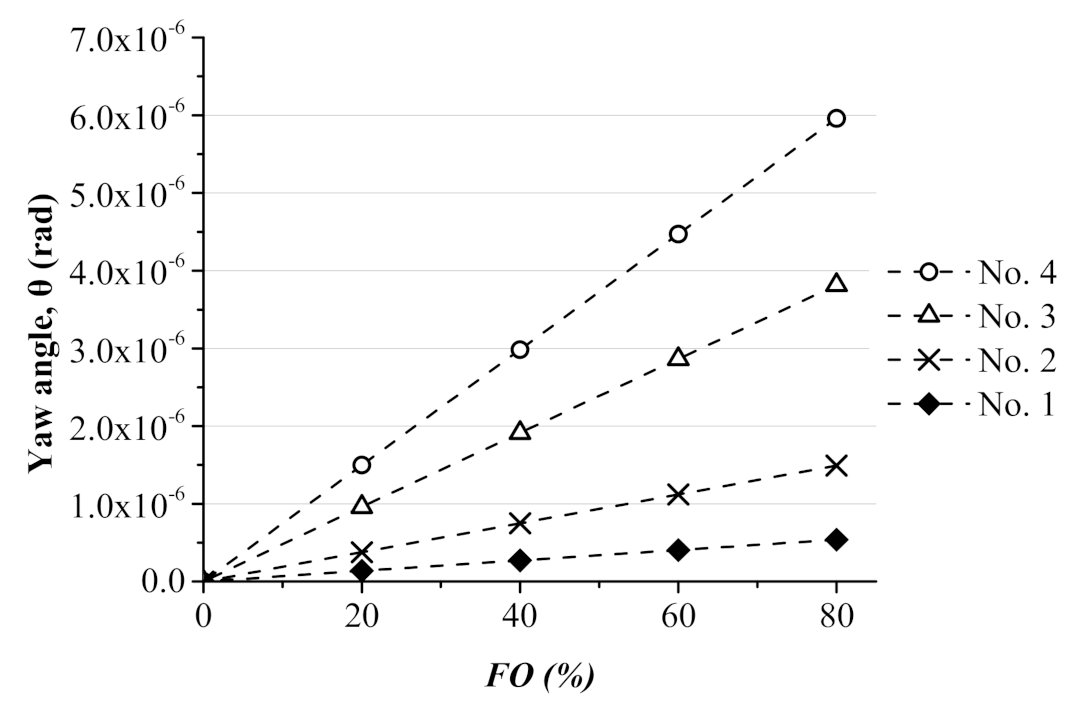
3.1.1. Aspect Ratio of Platforms
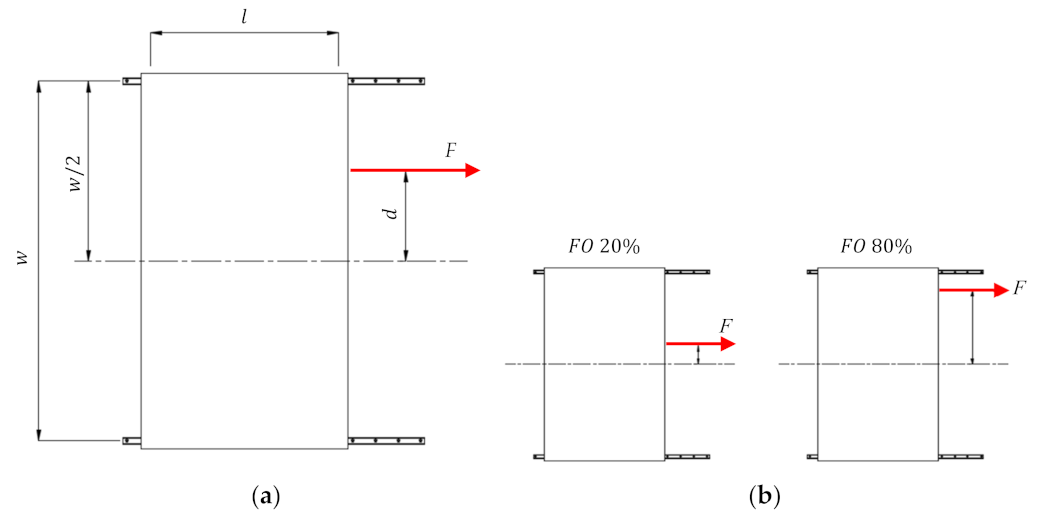
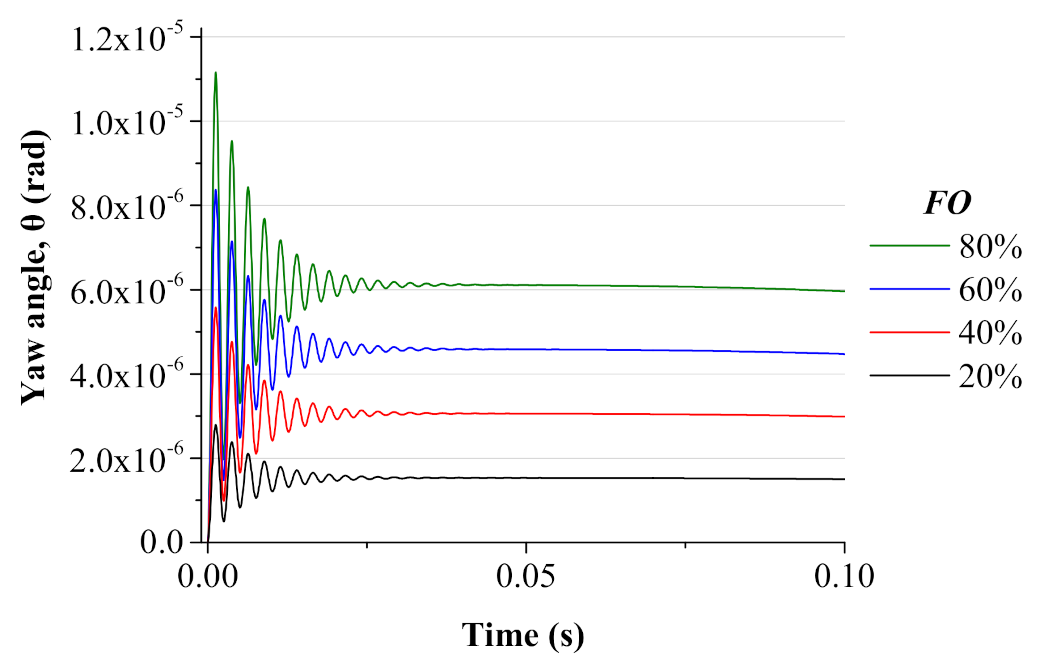
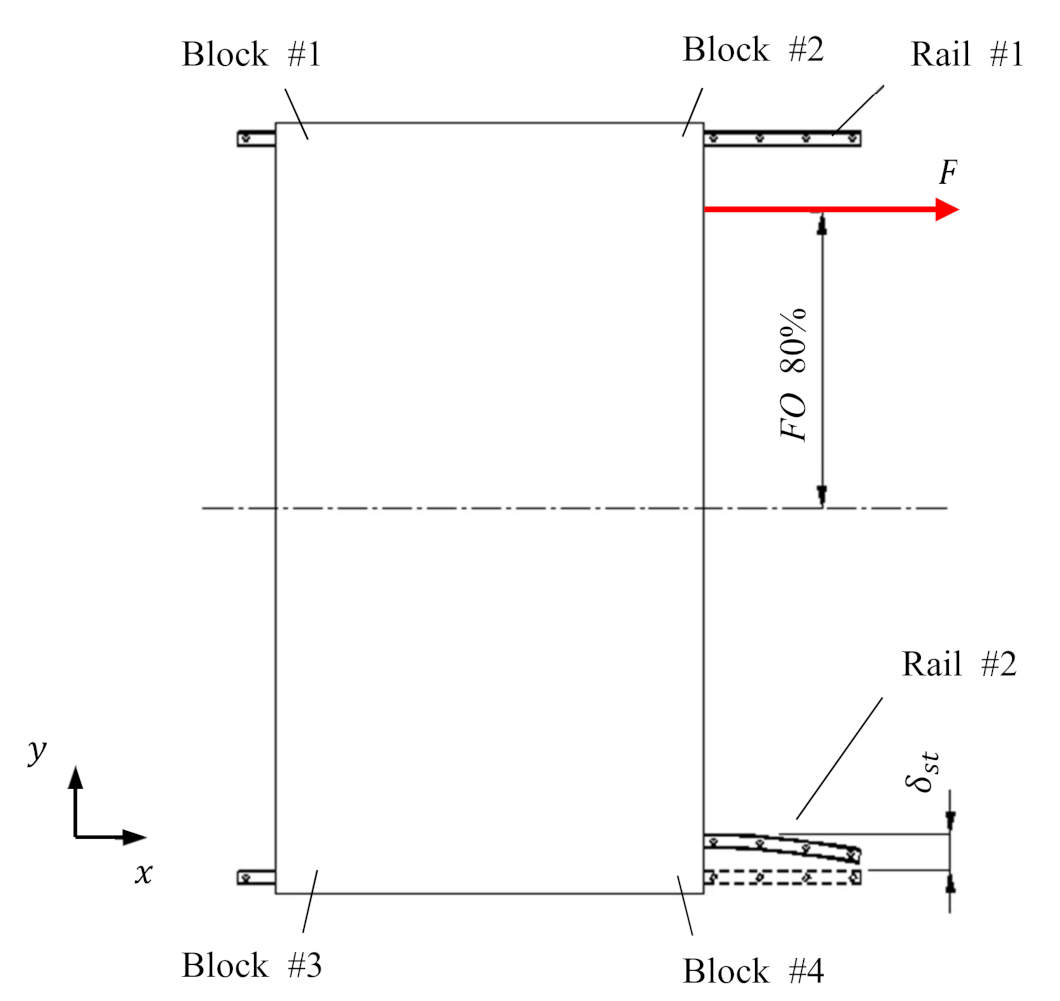
3.1.2. Force Offset
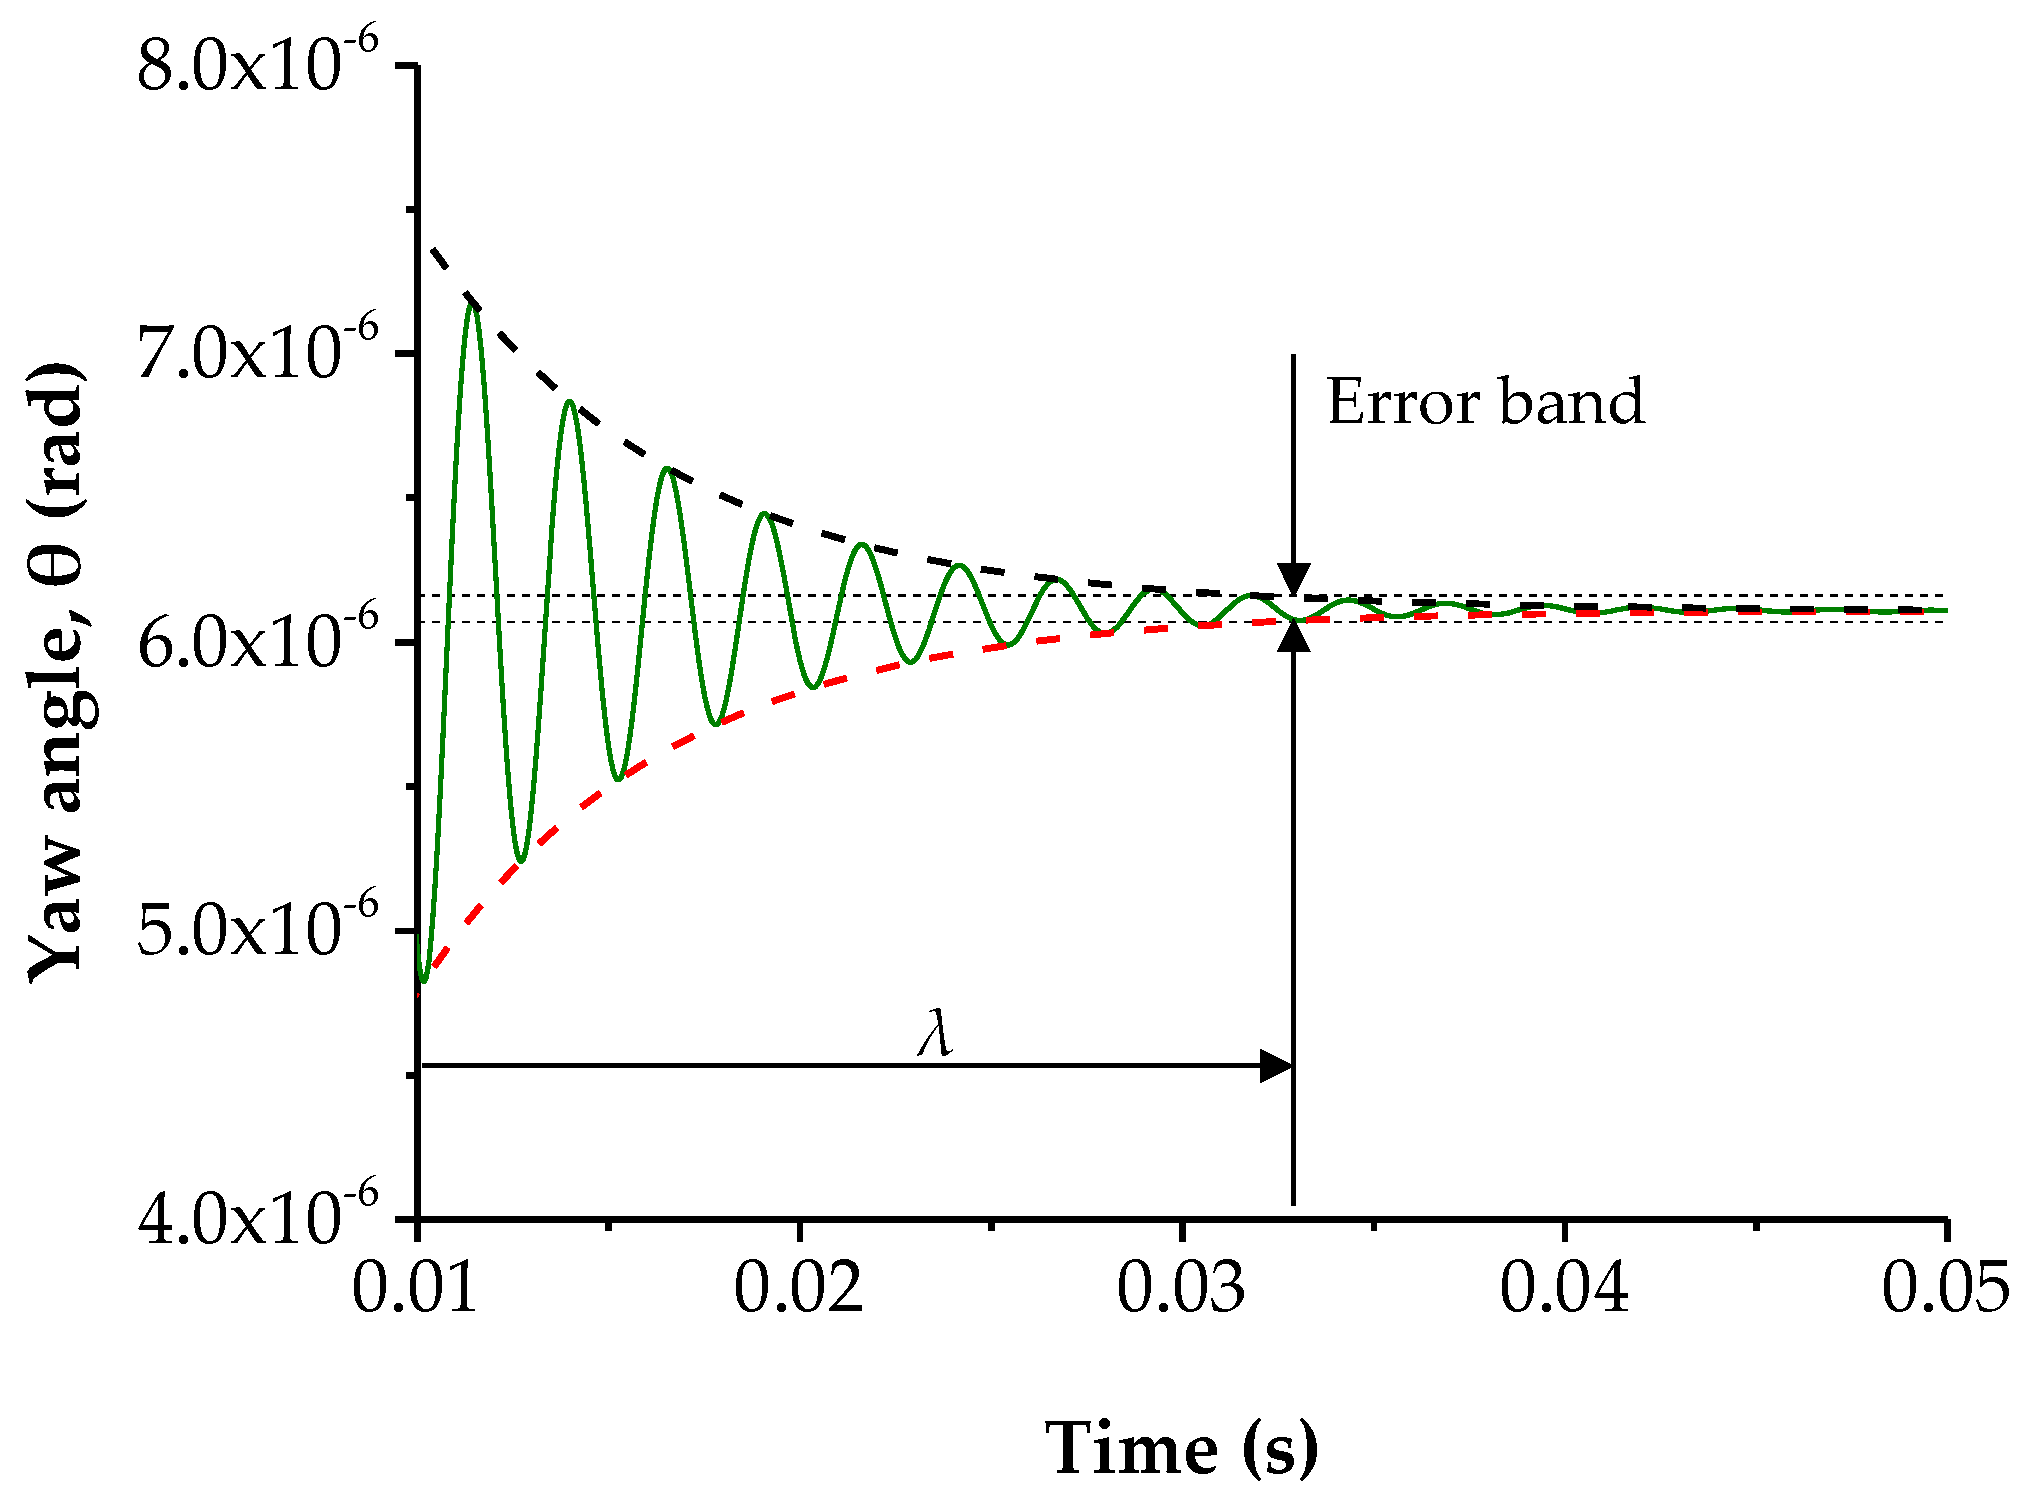
3.1.3. Verification of Dynamics Model
3.2. Controllable Parameters: Design, Manufacturing Conditions
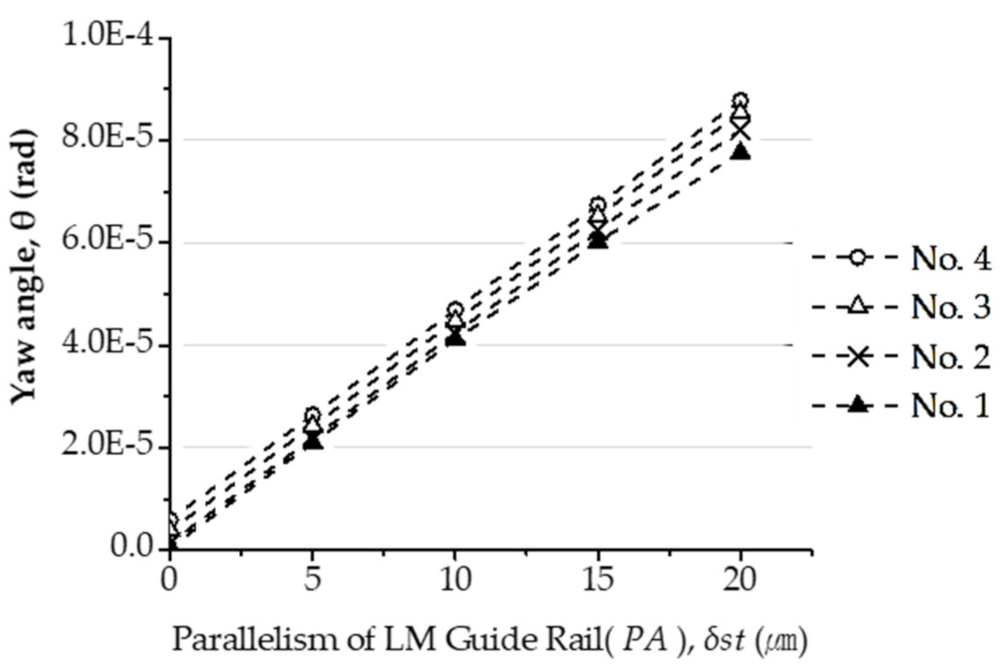
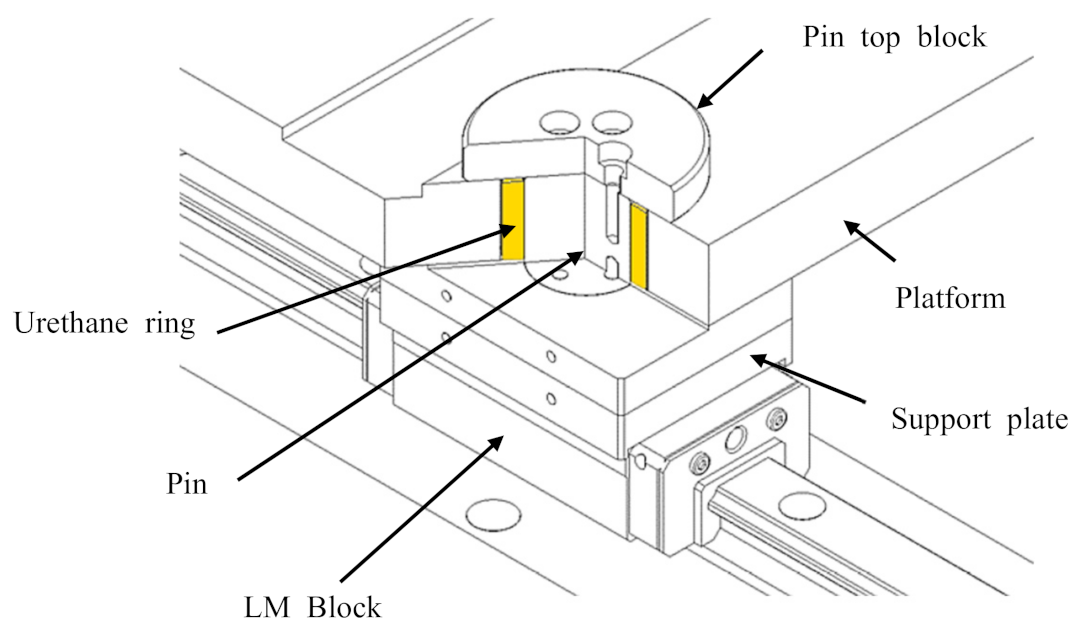
3.2.1. Parallelism between LM Guides
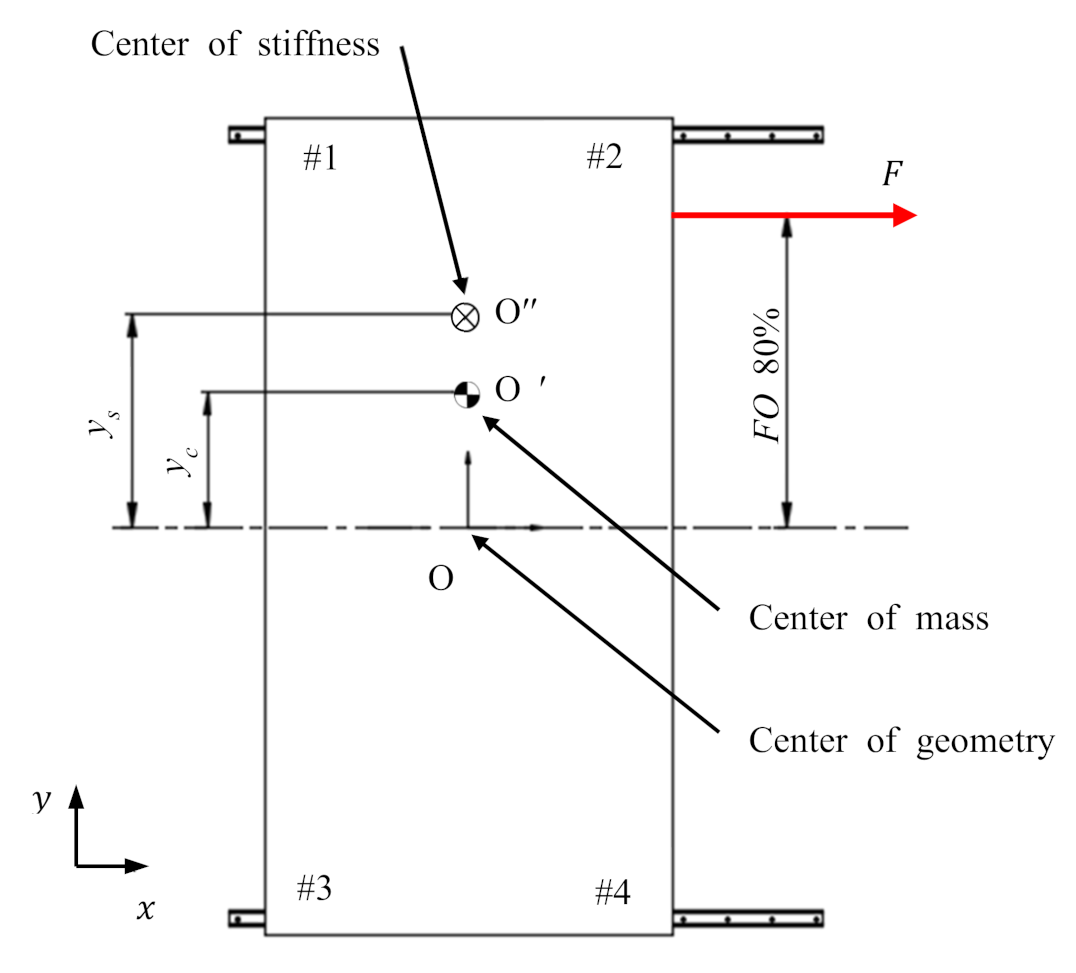
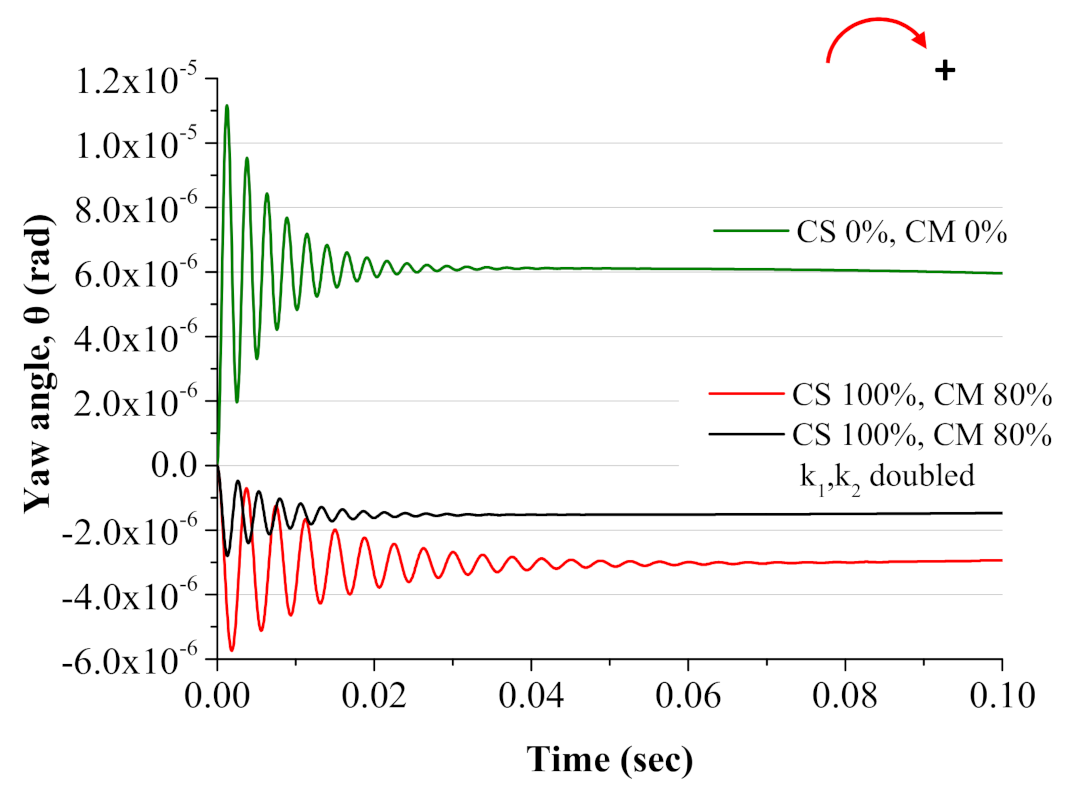
3.2.2. Center of Mass & Center of Stiffness
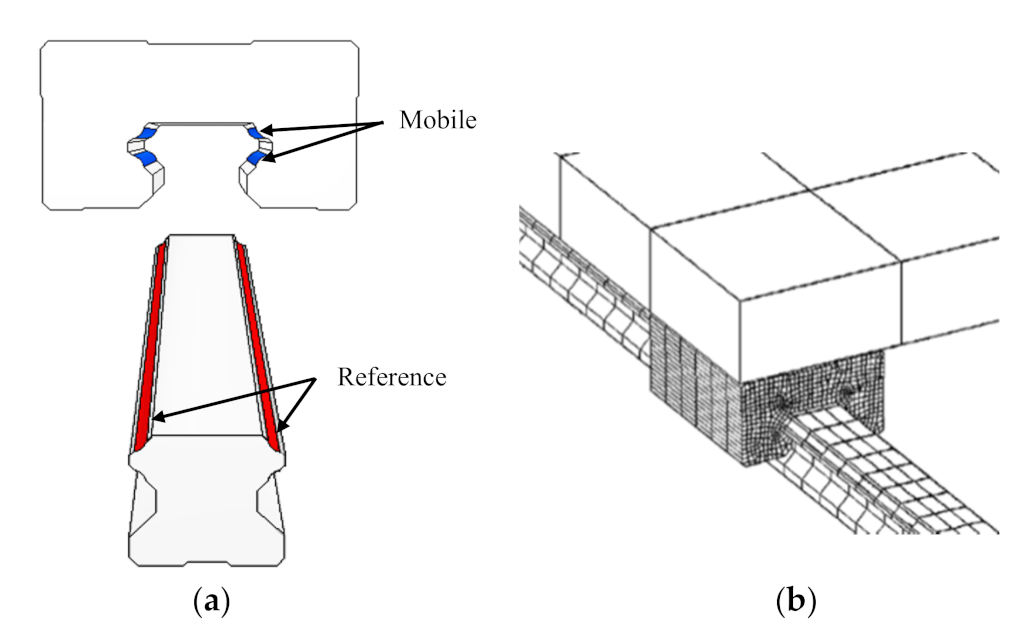
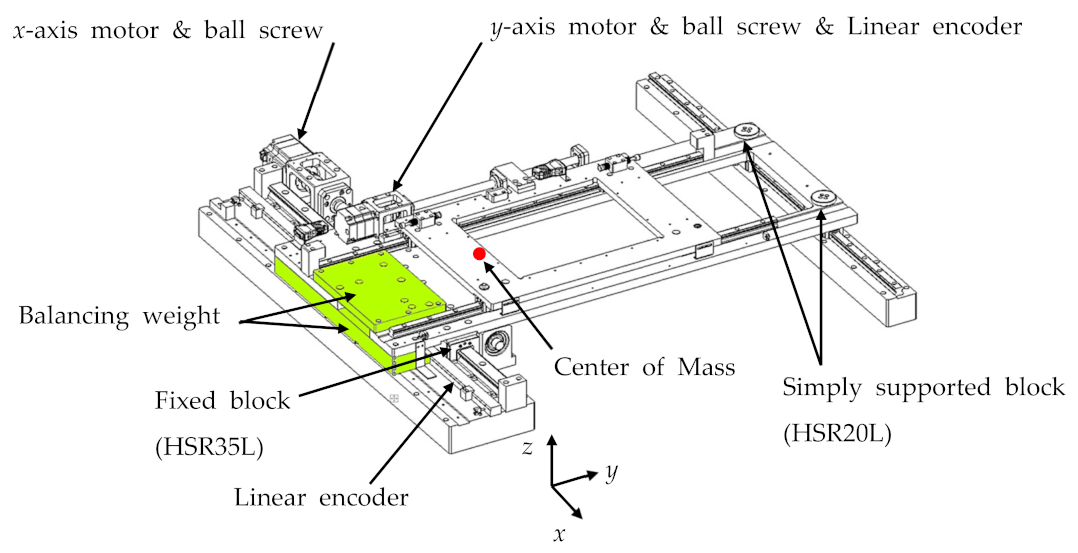
4. Design Improvement of XY Stage
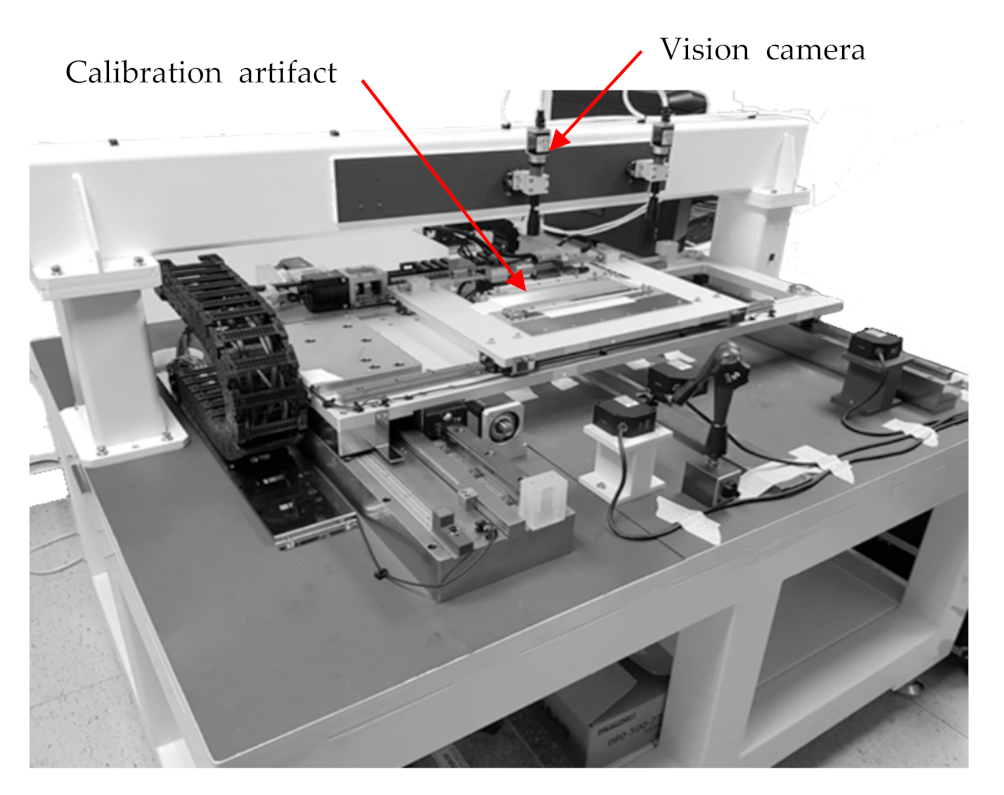
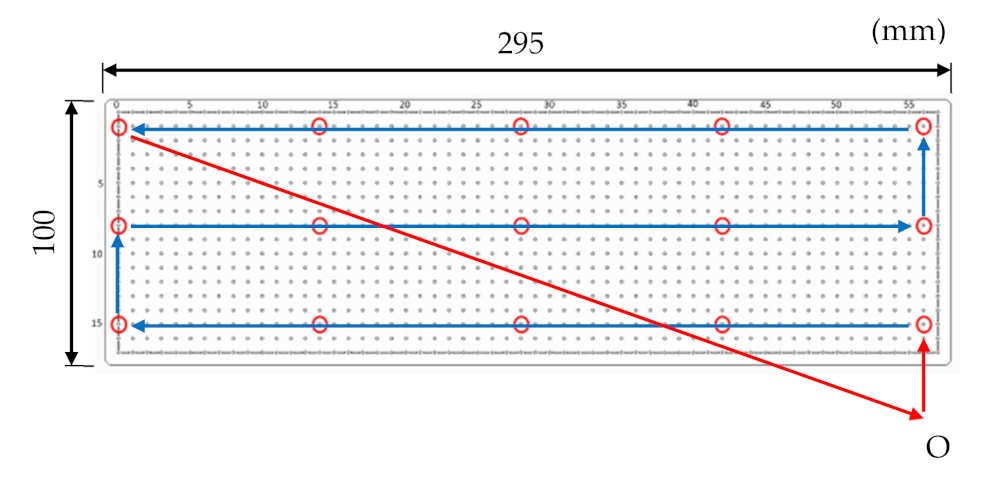
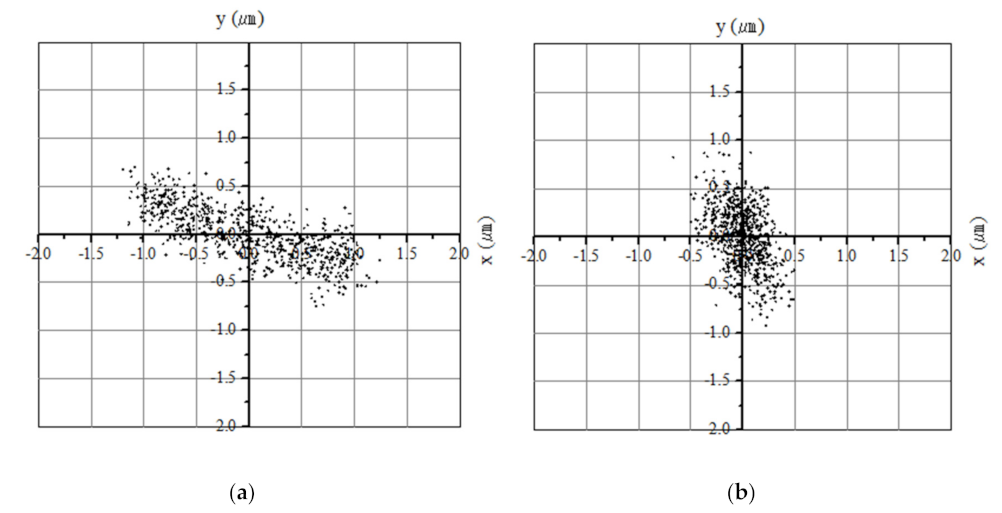
Experimental Verification of Effectivity of the Design Improvement of XY Stage
5. Conclusions
Author Contributions
Funding
Institutional Review Board Statement
Informed Consent Statement
Data Availability Statement
Conflicts of Interest
Nomenclature
| F | Driving force |
| m | Mass of a moving platform |
| kVertical | Vertical stiffness of LM Guide |
| kHorizontal | Horizontal stiffness of LM Guide |
| kn | Horizontal stiffness of nth block |
| PA | Parallelism of LM Guide |
| FO | Normalized coordinate of driving force position |
| CM | Normalized coordinate of platform mass center |
| CS | Normalized coordinate of LM Guide stiffness center |
| θ | Yaw angle of a moving platform |
| c | Damping coefficient |
| cn | Damping coefficient of nth block |
| μ | Friction coefficient |
| σ | Standard deviation |
References
- Slocum, A.H. Precision Machine Design; Society of Manufacturing Engineers Dearborn: Dearborn, MI, USA, 1992. [Google Scholar]
- THK, Co., Ltd. THK Linear Motion Systems Catalog 513-1K. Available online: https://www.thk.com/catalog/?lang=en (accessed on 20 June 2021).
- Shimizu, S. Stiffness Analysis of Linear Motion Rolling Guide. J. Jpn. Soc. Precis. Eng. 1998, 64, 1573–1576. [Google Scholar] [CrossRef]
- Rahmania, M.; Bleicher, F. Experimental and analytical investigations on normal and angular stiffness of linear guides in manufacturing systems. Procedia CIRP 2016, 41, 795–800. [Google Scholar] [CrossRef]
- Shaukharova, A.; Liang, Y.; Feng, H.; Xu, B. Study of Stiffness of Linear Guide Pairs by Experiment and FEA. World J. Eng. Technol. 2016, 4, 115–128. [Google Scholar] [CrossRef]
- Ohta, H.; Hayashi, E. Vibration of Linear Guideway type recirculating Linear Ball Bearings. J. Sound Vib. 2000, 235, 847–861. [Google Scholar] [CrossRef]
- Kim, H.Y.; Jeong, J.K.; Won, J.J.; Jeong, J.I. A Computational Modeling Reflecting Static and Dynamic Characteristics of LM Bearing for Machine Tools. J. Korean Soc. Precis. Eng. 2012, 29, 1062–1069. [Google Scholar] [CrossRef]
- Jeong, J.; Kang, E.; Jeong, J. Equivalent stiffness Modeling of Linear Motion Guideways for Stage Systems. Int. J. Precis. Eng. Manuf. 2014, 15, 1987–1993. [Google Scholar] [CrossRef]
- Chang, J.C.; Hung, J.P. Analytical and Finite Element Modeling of the Dynamic Characteristics of a Linear Feeding Stage with Different Arrangements of Rolling Guides. Math. Probl. Eng. 2014, 11, 1–11. [Google Scholar] [CrossRef]
- Kim, K.H.; Park, C.H.; Lee, H.; Kim, S.W. Analysis of the Motion Errors in Linear Motion Guide. J. Korean Soc. Precis. Eng. 2002, 19, 139–148. [Google Scholar]
- Khim, G.; Park, C.H.; Oh, J.S. A Method of Calculating Motion Error in a Linear Motion Bearing Stage. Sci. World J. 2015, 2015, 696417. [Google Scholar] [CrossRef]
- Rahmania, M.; Bleicher, F. Experimental and numerical studies of the influence of geometric deviations in the performance of machine tools linear guides. Procedia CIRP 2016, 41, 818–823. [Google Scholar] [CrossRef]
- Khim, G.; Park, C.H.; Shamoto, E.; Kim, S.W. Prediction and compensation of motion accuracy in a linear motion bearing table. Precis. Eng. 2011, 35, 393–399. [Google Scholar] [CrossRef]
- Li, X.; Liu, Y.; Liu, J.; Guo, H. Theory and experimental research on static stiffness of linear rolling guide. In Proceedings of the 2012 IEEE International Conference on Computer Science and Automation Engineering (CSAE), Zhangjiajie, China, 25–27 May 2012; pp. 85–87. [Google Scholar]
- Hu, C.; Zhu, Y. Self-Calibration of Two-Dimensional Precision Metrology Systems. New Trends Dev. Metrol. 2016, Ch.8, 185–210. [Google Scholar]
- Yi, Y.S.; Kim, Y.Y.; Choi, J.S.; Yoo, J.H.; Lee, D.J.; Lee, S.W.; Lee, S.J. Dynamic analysis of a linear motion guide having rolling elements for precision positioning devices. J. Mech. Sci. Technol. 2008, 22, 50–60. [Google Scholar]
- Ekinci, T.; Mayer, J. Relationships between straightness and angular kinematic errors in machines. Int. J. Mach. Tools Manuf. 2007, 47, 1997–2004. [Google Scholar] [CrossRef]
- Yanga, P.; Takamuraa, T.; Takahashi, S.; Takamasua, K.; Sato, B.O.; Osawa, B.S.; Takatsuji, T. Development of high-precision micro-coordinate measuring machine: Multiprobe measurement system for measuring yaw and straightness motion error of XY linear stage. Precis. Eng. 2011, 35, 424–430. [Google Scholar] [CrossRef]
- Wit, C.C.D.; Lischinsky, P. Adaptive Friction Compensation with Partially Known Dynamic Friction Model. Int. J. Adapt. Control Signal Processing 1997, 11, 65–80. [Google Scholar] [CrossRef]
- Cheng, D.J.; Yang, W.S.; Park, J.H.; Park, T.J.; Kim, S.J.; Kim, G.H.; Park, C.H. Friction Experiment of Linear Motion Roller Guide THK SRG25. Int. J. Precis. Eng. Manuf. 2014, 15, 545–551. [Google Scholar] [CrossRef]
- Low, K.S.; Keck, M.T. Advanced Precision Linear Stage for Industrial Automation Application. IEEE Trans. Instrum. Meas. 2003, 52, 785–789. [Google Scholar]
- GEKKO, Python Package. Available online: https://gekko.readthedocs.io/en/latest/index.html# (accessed on 19 November 2021).
- Li, H.; Le, M.D.; Gong, Z.M.; Lin, W. Motion Profile Design to Reduce Residual Vibration of High-Speed Positioning Stages. IEEE/ASME Trans. Mechatron. 2009, 14, 264–269. [Google Scholar]


| Horizontal Stiffness (kN/mm) | Vertical Stiffness (kN/mm) | Effective Load (kN) | |
|---|---|---|---|
| HSR20 | 250 | 349 | 1.4 |
| HSR20L | 335 | 472 | 2.3 |
| HSR25L | 335 | 488 | 2.8 |
| HSR30L | 453 | 645 | 3.8 |
| HSR35L | 495 | 681 | 5.5 |
| No. | Length, l (m) | Width, w (m) | Weight (kg) | l/w |
|---|---|---|---|---|
| 1 | 0.5 | 0.3 | 29.3 | 1.7 |
| 2 | 0.5 | 0.5 | 48.8 | 1.0 |
| 3 | 0.5 | 0.8 | 78.0 | 0.6 |
| 4 | 0.5 | 1.0 | 97.5 | 0.5 |
| FO | FEM Simulation ANSYS | Rigid Dynamics Model Equation (10) |
|---|---|---|
| 0% | 0.0 | 0.0 |
| 20% | 0.0 | 1.5 |
| 40% | 2.9 | 3.0 |
| 60% | 5.7 | 4.4 |
| 80% | 6.7 | 6.0 |
| Friction Coefficient (μ) | 0.002 | 0.01 | 0.02 | 0.03 | 0.2 |
|---|---|---|---|---|---|
| Yaw angle (μrad) | 5.93 | 5.94 | 5.96 | 5.98 | 6.17 |
| Damping Coefficient (Nsec/mm) | 0.01 | 0.1 | 10 | 100 |
|---|---|---|---|---|
| Settling time (ms) | 32.02 | 32.02 | 31.92 | 31.87 |
| CS | 0% | 20% | 40% | 60% | 80% | 100% |
|---|---|---|---|---|---|---|
| k3/k1 | 1 | 0.7 | 0.4 | 0.30 | 0.1 | 0 |
| CS | 0% | 20% | 40% | 60% | 80% | 100% | |
|---|---|---|---|---|---|---|---|
| CM | |||||||
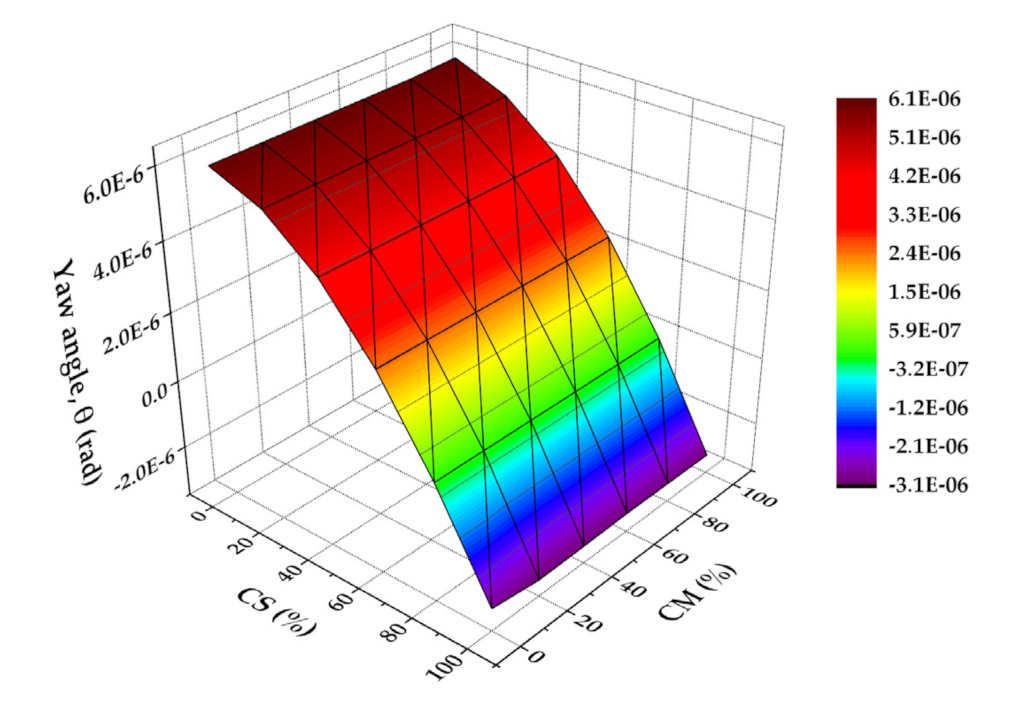
| 0% | 5.96 | 5.38 | 4.19 | 2.39 | 0.0012 | −2.83 | |
| 20% | 5.96 | 5.38 | 4.19 | 2.40 | 0.0018 | −3.01 | |
| 40% | 5.96 | 5.38 | 4.19 | 2.40 | 0.0021 | −2.98 | |
| 60% | 5.96 | 5.38 | 4.19 | 2.40 | 0.0020 | −2.94 | |
| 80% | 5.96 | 5.38 | 4.19 | 2.40 | 0.0020 | −2.94 | |
| 100% | −6.02 | 5.40 | 4.20 | 2.40 | 0.0020 | −2.94 | |
| CS | 0% | 20% | 40% | 60% | 80% | 100% | |
|---|---|---|---|---|---|---|---|
| CM | |||||||
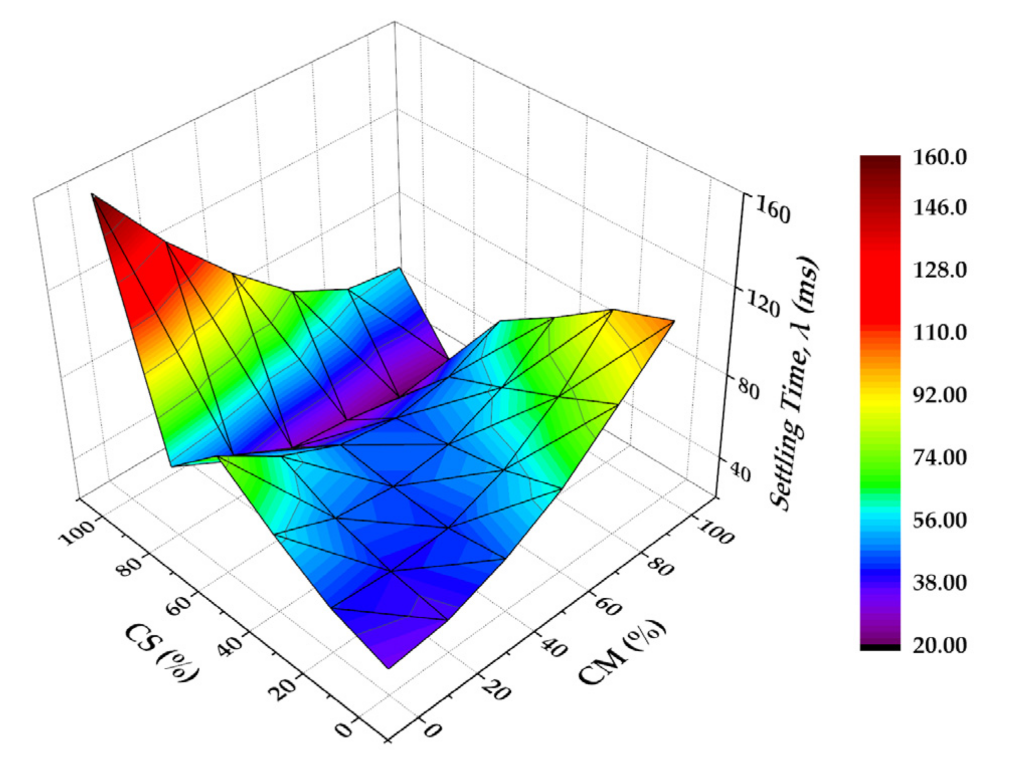
| 0% | 33 | 42 | 58 | 77 | 54 | 162 | |
| 20% | 36 | 40 | 47 | 59 | 42 | 127 | |
| 40% | 46 | 42 | 44 | 47 | 28 | 98 | |
| 60% | 61 | 52 | 47 | 43 | 25 | 74 | |
| 80% | 83 | 70 | 58 | 47 | 22 | 60 | |
| 100% | 105 | 95 | 76 | 59 | 23 | 56 | |
| PA | 0 μm | 5 μm | 10 μm | 15 μm | 20 μm | |
|---|---|---|---|---|---|---|
| CM | ||||||
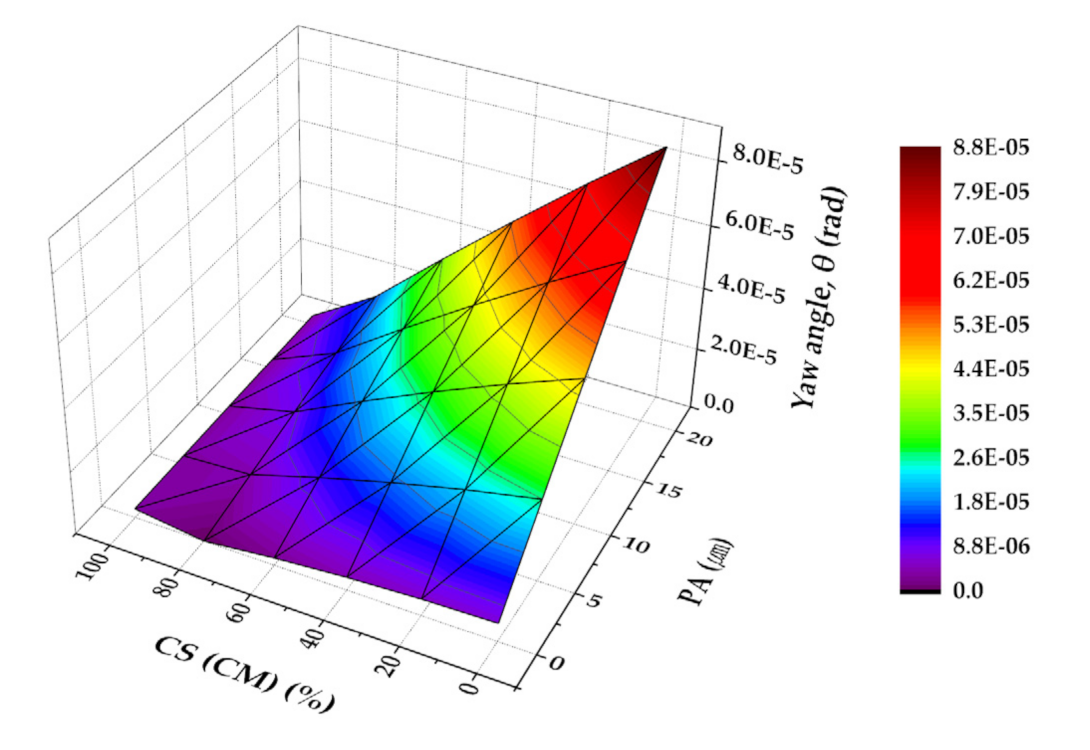
| 0% | 5.96 | 26.4 | 46.9 | 67.4 | 87.8 | |
| 20% | 5.38 | 21.8 | 38.2 | 54.6 | 71.1 | |
| 40% | 4.19 | 16.5 | 28.8 | 41.1 | 53.4 | |
| 60% | 2.40 | 10.6 | 18.7 | 26.9 | 35.1 | |
| 80% | 0.002 | 4.04 | 8.08 | 12.1 | 16.2 | |
| 100% | 2.92 | 2.96 | 3.00 | 3.04 | 3.08 | |
| PA | 0 μm | 5 μm | 10 μm | 15 μm | 20 μm | |
|---|---|---|---|---|---|---|
| CM | ||||||
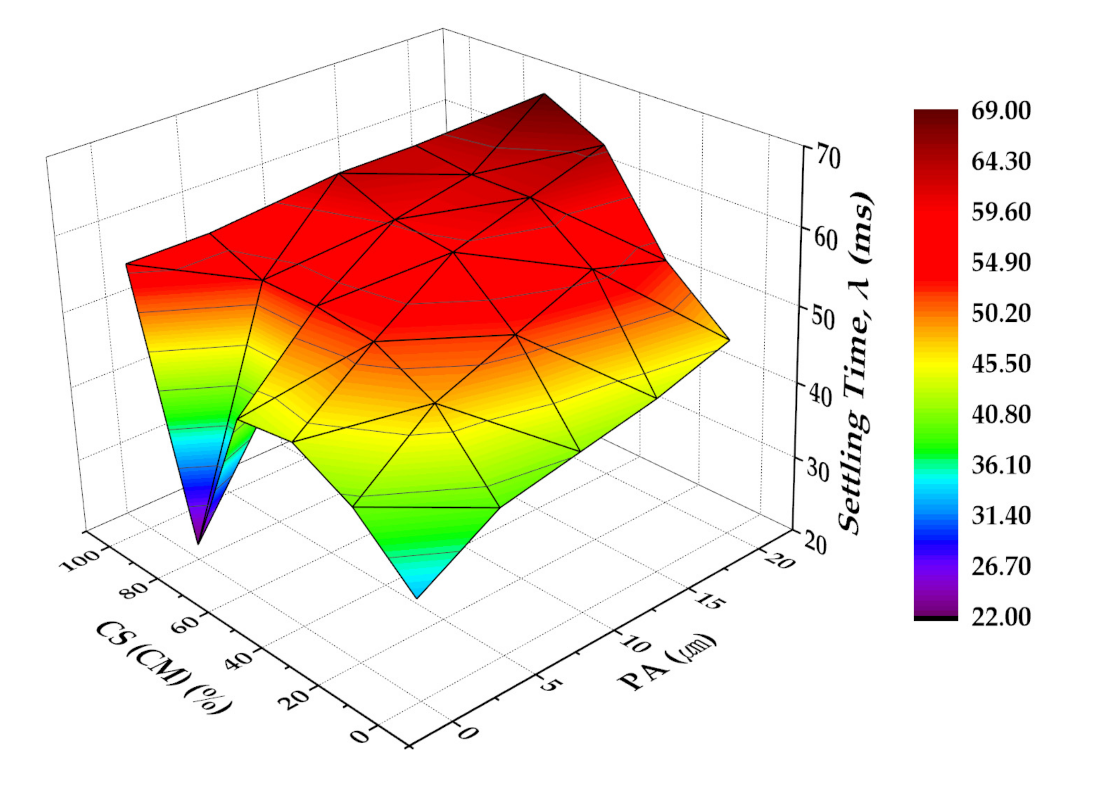
| 0% | 33 | 39 | 41 | 43 | 46 | |
| 20% | 40 | 48 | 52 | 56 | 53 | |
| 40% | 44 | 52 | 59 | 62 | 65 | |
| 60% | 43 | 53 | 60 | 62 | 69 | |
| 80% | 22 | 53 | 63 | 63 | 63 | |
| 100% | 56 | 56 | 56 | 56 | 56 | |
| Axis | Length (mm) | Width (mm) | l/w | Balancing Weight (kg) | FO (%) | Yaw Error (μm) |
|---|---|---|---|---|---|---|
| x | 370 | 895 | 0.41 | 17.8 | 80 | ±0.67 |
Publisher’s Note: MDPI stays neutral with regard to jurisdictional claims in published maps and institutional affiliations. |
© 2022 by the authors. Licensee MDPI, Basel, Switzerland. This article is an open access article distributed under the terms and conditions of the Creative Commons Attribution (CC BY) license (https://creativecommons.org/licenses/by/4.0/).
Share and Cite
Cho, D.-H.; Kwon, H.-C.; Kim, K.-H. Improvement of Position Repeatability of a Linear Stage with Yaw Minimization. Appl. Sci. 2022, 12, 657. https://doi.org/10.3390/app12020657
Cho D-H, Kwon H-C, Kim K-H. Improvement of Position Repeatability of a Linear Stage with Yaw Minimization. Applied Sciences. 2022; 12(2):657. https://doi.org/10.3390/app12020657
Chicago/Turabian StyleCho, Doo-Hyun, Hyo-Chan Kwon, and Kwon-Hee Kim. 2022. "Improvement of Position Repeatability of a Linear Stage with Yaw Minimization" Applied Sciences 12, no. 2: 657. https://doi.org/10.3390/app12020657
APA StyleCho, D.-H., Kwon, H.-C., & Kim, K.-H. (2022). Improvement of Position Repeatability of a Linear Stage with Yaw Minimization. Applied Sciences, 12(2), 657. https://doi.org/10.3390/app12020657