Abstract
Spatial evolution can be traced by land-use change (LUC), which is a frontier issue in the field of geography. Using the limited areas of Koh Chang in Thailand as the research case, this study analyzed the simulation of its spatial evolution from a multi-scenario perspective on the basis of the 1900–2020 thematic mapper/operational land imager (TM/OLI) remote sensing data obtained through the transfer matrix model, and modified LUC and the dynamic land-use change model (Dyna-CLUE). Over the past 30 years, the expansion of recreation areas and urban and built-up land has been very high (2944.44% and 486.99%, respectively) along the western coast of Koh Chang, which replaced the original mangrove forests, orchards, and communities. Logistic regression analysis of important variables affecting LUC revealed that population density variables and coastal plain topography significantly affected LUC, which showed strong β coefficients prominently in the context of a coastal tourist city. The results of the LUC and logistic regression analyses were used to predict future LUCs in the Dyna-CLUE model to simulate 2050 land-use in three scenarios: (1) natural evolution scenario, where a large patch expansion of agricultural land extends along the edge of the entire forest boundary around the island, particularly the southwestern areas of the island that should be monitored; (2) reserved area protection scenario, where the boundary of the conservation area is incorporated into the model, enabling forest preservation in conjunction with tourism development; and (3) recreation area growth scenario, where the southern area is the most susceptible to change at the new road crossing between Khlong Kloi village to Salak Phet village, and where land-use of the recreation area type is expanding. The model-projected LUC maps provide insights into possible changes under multiple pathways, which could help local communities, government agencies, and stakeholders jointly allocate resource planning in a systematic way, so that the development of various infrastructures to realize the potential impact on the environment is a sustainable coastal tourist city development.
1. Introduction
Spatial evolution occurs in areas with infrastructure development; thus, it can be traced it from land-use/land-cover classification [1,2,3,4]. Most studies on land-use change (LUC) are based on remote sensing, a technique used to study global environmental change [5,6]. Socio-economic factors and other physical factors of spatial evolution affect LUC [7,8,9]. The driving factors and scenario simulation of LUC must be studied to understand the spatial pattern in each region where the factors affecting changes vary according to the spatial context. Such information is important to assess environmental impacts and manage land-use planning for systematic sustainable development.
Tourism is a major economic activity worldwide that is closely related to LUC, especially in developing countries in tropical regions that still rely on tourism revenue to provide economic stability and income distribution to the local communities [10,11,12]. Tourism activities inevitably affect the expansion of residential establishments, infrastructure, and leisure activities, etc., which affect LUC, such as the deforestation phenomena in Angkor Basin, Cambodia, to bring charcoal production to the tourism industry and some processing for agricultural activities [13]. In 2002–2013, buildings in the Sudanian Savanna of West Africa were expanded to support tourism, which resulted in a rapid depletion of forests and an impact on natural ecosystems, especially the depletion of wild elephants [14]. A previous study analyzed the land-use evolution of a growth tourism-town from 1986 to 2010 in the area of Sanpo Town, Hebei Province, China, where the expansion of tourism land-use, such as hotel and resort, commercial area, and spatial agglomeration of tourism enterprises, has become the main development type of tourism-town development [15]. As a result, LUC affects ecosystem structure and function. Therefore, tools should be available to visualize future LUCs by analyzing historical LUC and driving factors. The Dyna-CLUE modeling framework was developed to simulate LUC using empirically quantified relations between land use and its driving factors in combination with dynamic modeling [16]. The Dyna-CLUE model was developed from the CLUE-s model by Verburg of Wageningen University in the Netherlands [17,18,19]. In the past decade, the Dyna-CLUE model has been widely applied in research, such as abandoned farmland and mountainous area urbanization in the Swiss Plateau and Alpine Valley in Switzerland [20]. The Dyna-CLUE model has also been applied to examine the expansion and transformation of rural to urban area in the Mahanadi River basin, India in 2025 [21]. A spatial management model for decision maker simulated LUC in 2033, near the boundary line of Phu Ruea National Park and Phu Luang Wildlife Sanctuary to prevent deforestation and the decline of wildlife in Nam San Watershed, Loei Province, Thailand [22]. The Dyna-CLUE model was also used in the research of the groundwater recharge in Ho Chi Minh city, Vietnam to predict land-use that will affect future groundwater changes by 2100 [23] and research on streamflow and sediment resulting from future LUCs in 2030, 2050 and 2070 in the Be River Basin, Vietnam [24]. The Dyna-CLUE model allows understanding and assessing the land-use dynamics for policy decision making.
Koh Chang or Elephant Island is the third largest island in Thailand under the administrative region of Trat Province, in the eastern part of the Gulf of Thailand. Koh Chang is an island of strategic importance and Thailand’s tourism, with the surrounding area of Koh Chang marine national park [25]. According to the Trat Province Development Plan 2017–2021 [26], Koh Chang is an important coastal tourist city in Thailand. It has been popular with Thai and foreign tourists since 1982 [27]. Due to the island and surrounding islands, Koh Chang has the potential for tourism and various tourism activity, including white sandy beaches with soft and fine sand at Hat Sai Khao Beach and Khlong Phrao Beach, which are on the west side of the city [28]. Koh Chang is suitable for activities on the beach, such as watching the sunset, or trekking in the middle of the island, and snorkelling to see coral and sea creatures on the small surrounding islands [29]. From 1996 onwards, a ferry pier was built to travel between Koh Chang and Trat Province, allowing tourists to travel easily to Koh Chang. According to the National Statistical Office of Thailand, 700,752 tourists visited the area in 2002, and this number increased to 2,167,924 in 2012. Within the past 10 years, the proportion of tourists has increased by an average of 309.37% [30], resulting in urban expansion and the creation of recreation areas around the island, with hotels and resorts in many places in Koh Chang, until it gradually developed into a coastal tourist city. At present, there is a plan to build a road in the southern part of Koh Chang to connect Bang Bao village and Salak Phet village to make traveling within the island convenient. This plan is part of a policy aiming to develop infrastructure for the community and accommodate future tourists. The policy will shorten travel by up to an hour from the original detour to the northern islands. However, most of the area where the road will be built is a conservation area of land and sea, which may have environmental impacts. The present study hypothesized which areas are vulnerable to LUC. The Dyna-CLUE model was used to assess environmental impacts, especially the impact of LUC, which may affect the environment on the island and on the coast in the Koh Chang. This model is in line with the principles of the United Nations Sustainable Development Goals (SDGs), specifically Goals 8 and 14, which address the conservation and sustainable use of the oceans, seas, and marine resources for sustainable development. Marine and coastal ecosystems must be sustainably managed and protected by strengthening their resilience and promoting their restoration to avoid significant adverse impacts and achieve healthy and productive oceans [31,32]. A spatial evolution in parallel with the conservation of coastal environments is important to prepare for the future changes in Koh Chang. Most previous research has established a land-use planning management system around the reservation area, focused on preventing external changes from the reserve from affecting the core area of the reservation area, which is a specific research gap. However, Koh Chang and the surrounding islands, which were declared a marine national park area, became an LUC within the Marine National Park itself. Moreover, the limited area of Koh Chang has undergone many spatial evolutions, including the expansion of hotels and resorts, the expansion of farmland, and the development of villages into large communities. Therefore, this research highlights the importance of studying the spatial evolution of Koh Chang for sustainable land-use planning.
This study aimed to analyze the spatial evolution of the coastal tourist city of Koh Chang, Thailand in 1990–2020 and perform a simulation and prediction of LUC over the next 30 years by using the Dyna-CLUE under three dynamic scenarios: Scenario-1, natural evolution scenario (NE); Scenario-2, reserved area protection (NP); and Scenario-3, recreation area growth (RG). Under the scenario of road construction through conservation areas in the south of Koh Chang, Trat Province, Thailand, the results obtained were LUC data under three dynamic scenarios for decision maker implementation to manage land-use planning in the area to reduce environmental impacts, along with systematic sustainable development.
2. Materials and Methods
2.1. Study Area
Koh Chang is an island under the administrative region of Trat Province, located in the eastern part of the Gulf of Thailand, approximately 211.10 km2 in area. The study area is located between latitude 11°55′ to 12°10′, longitude 102°10′ to 102°30′ (Figure 1). Koh Chang has important geomorphological significance due to its igneous mountain range, which was formed in the era of Permo-Triassic volcanic rock; the local people call it “Elephant Island” or “Koh Chang” [33,34]. The main topography of Koh Chang is the altitude between 0–747 m above the mean sea level. The high-altitude terrain is the central part of the island that is characterized by steep mountains. The highest point is Khao Yai with an altitude of 747 m. The west and east coasts of the island are narrow coastal plains, especially the west coast of Koh Chang where white sandy beaches with fine sand appear along Hat Sai Khao beach and Khlong Phrao beach. The east coast of the island has a coastal landscape with lane beaches alternating with bays, and some beaches have black sands and mangrove forests rich in essential nutrients of marine fish nurseries such as Kongkang bay, Salak bay, and Salak Phet bay [35]. The island’s physical diversity makes it an important destination for both tourism and livelihood in the local community.
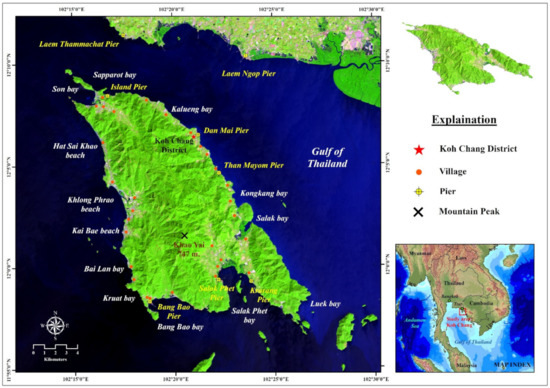
Figure 1.
Location maps of the study area.
2.2. Data Collection and Analysis
2.2.1. Data Collection
Satellite images recorded by Landsat 5 TM and Landsat 8 OLI in 1990, 2005, and 2020 were used in this research. The satellite images were downloaded from the U.S. Geological Survey to analyze LUCs using Erdas Imagine 8.7 software (Table 1). Table 2 is a collection of geo-spatial data (physical factors and socio-economic factors) of Koh Chang, which are statistically processed and displayed in the form of maps using ArcMap version 10.2 software. The LUC driving variables in the Koh Chang, such as elevation, slope, distance to coastline, distance to stream, population density, distance to village, and distance to road are displayed in Figure 2, along with information on the reservation area.

Table 1.
Satellite image data covering Koh Chang area for LUC analysis.
Table 2.
Geo-spatial data (physical factors and socio-economic factors).
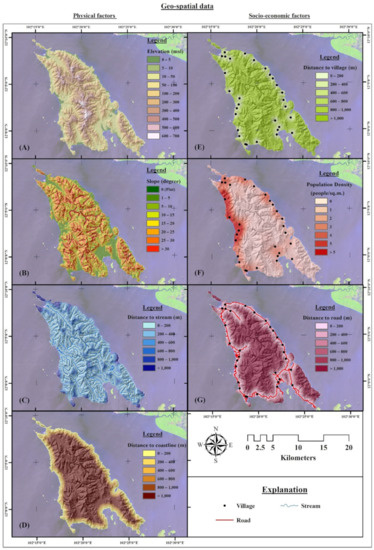
Figure 2.
Geo-spatial data (physical factors and socio-economic factors) in the Koh Chang area. (A) elevation, (B) slope, (C) distance to stream, (D) distance to coastline, (E) distance to village, (F) population density, and (G) distance to road.
2.2.2. Method
The research process includes the geo-informatic approach and the Dyna-CLUE model approach, as shown in Figure 3. Details of each step are briefly explained below:
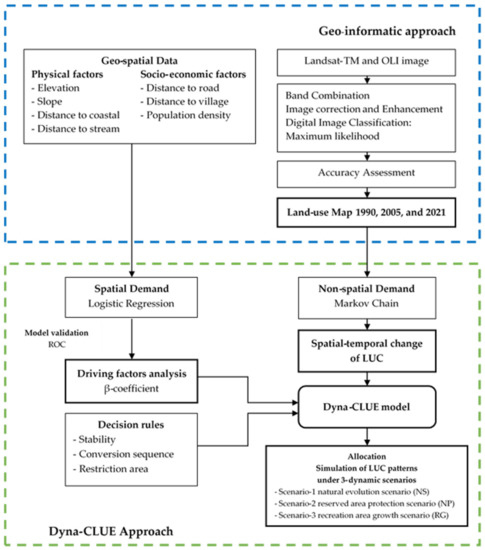
Figure 3.
Flow chart of methodology.
(1) Geo-informatics approach
Each Landsat satellite image data used in this study were performed in a band combination, selecting bands 5 (short-wavelength infrared), 4 (near-infrared), and 3 (red) for the Landsat TM and bands 6 (short-wavelength infrared), 5 (near-infrared), and 4 (red) for Landsat OLI/TIRS, because these bands can clearly visualize forest cover in forest, urban, agricultural and coastal areas [36,37,38]. The next step includes geometric examination and correction based on 1990, 2005 and 2020 data by defining ground control points (GCPs) for geo-referencing. Landsat images were enhanced using the histogram equalization approach to achieve sharp images that are easy to interpret LUC results, and a supervised classification with the maximum likelihood algorithm was applied to a sample of 40 ground control points collected during the GPS-assisted field campaigns and nearly 200 training samples in total for all classes. The maximum likelihood, as its data layer pixel categorized from sample data and based on the premise, is calculated from image points around the mean using the probability function [39]. Land-use result data validation in 1990, 2005, and 2020 from the interpretation of Landsat satellite images were checked for accuracy by random sampling; about 200 different types of land-use were checked together with a reliable and acceptable reference map. The results from land-use classification in 2020 were checked against the actual survey area. The results of the 1995 and 2005 land-use classification were reviewed against land-use data from the Land Development Department (LDD), a trusted and nationally recognized data service agency. After that, the interpretation of the land-use data was post-classified by the supervised classification method.
The resulting images are shown for each class in the LUC model. The results of interpretation of the land-use model by Supervised classification method are presented as Overall Accuracy and Kappa coefficient () [21,24]. The classification criteria are as follows:
- <0 means unacceptable classification data.
- 0.01–0.40 means fair classification data.
- 0.41–0.60 means moderate classification data.
- 0.61–0.80 means good classification data.
- 0.81–1.00 means very good classification data.
Then, a database in the geographic information system from the land-use model data was created, showing land-use data at each time period for the analysis of LUC in each period [22]. As in Equation (1), the result is spatial-temporal change of LUC.
where ∆ is the proportion of the land-use pattern that has changed (percent), A1 is the type of land-use at the first time (T1). A2 is the type of land-use at the second time (T2).
∆ = [(A2 − A1)/A1 × 100]/(T2 − T1)
The results are shown as the proportion of each land-use type on the map. It shows the LUC patterns in 1990, 2005 and 2020 along with the change detection comparison table by analyzing the tabulate area using Spatial Analyst. Tabulate area is a specific tool in ArcGIS used to analyze two time periods of land use change data and to determine the proportion of each land use area that has been displaced by any past land use pattern.
(2) Dyna-CLUE model approach
The Dynamic land-use change model (Dyna-CLUE model) [16,17,18] is an efficient land-use model that can take the demand data of all LUCs, co-processed with factor data that affect LUC changes in a raster-based model, producing in future change information. There are three key data inputs to the model: non-spatial demand data, spatial demand data, and decision rules. Non-spatial demand data is the land-use proportion data between 2021–2050 obtained from the analysis of future land-use forecasts with the Markov chain. Spatial demand data contains variables that affect LUC and β coefficient. Additionally, decision rules define the boundaries of the reservation area to prevent changes in LUC from occurring in that area.
Demand data is land-use requirements data. Detailed information is expressed as the proportion of land use area for each type of land-use projections in the future with the Markov chain, which demand data as one in the input file Dyna-clue model. Two important modules in the functioning of the model are the non-spatial demand module and a spatially explicit allocation module [16]. The non-spatial demand section adopted the Markov chain analysis principle, a stochastic process describing certain types of conditions that change in sequential steps through the land-use geo-spatial dataset. The Markov chain [40] calculated the ratio of change from past to current study year and calculated it as a ratio in the form of a matrix table to forecast future LUCs as a future land-use proportion model, according to the study period by using Equations (2) and (3) [41];
where t is the time (Year), is the transition probability matrix of the land-use class i change to class j.
i and j are the land-use classes in the first year and the second years, respectively.
The results of the demand module were used as input for the spatial allocation module of the Dyna-CLUE model [16]. Then, Markov chain analysis was used to determine the demand for the probability of each land-use pattern, where the probability of transition () is given for every ordered set of conditions. In a Markov chain with a limited number of conditions, such as j, a new transition probability matrix is bounded, as in Equation (4) [42];
where
- × is the proportion of land-use in the second year
- is the land-use activity (f) derived from the transition probability matrix (TPM)
- is the proportion of land-use in the first year
- j is the type of land-use in first year and
- k is the type of land-use in the second year.
The Markov chain model, an efficiently rapid analyzing tool, uses land-use ratios for the reference year to determine the potential distribution of the land-use types.
The Markov chain model can predict future LUCs but cannot determine, control, or explain how the region changes due to physical factors or socio-economic factors. Different from the Dyna-CLUE model, the Markov chain model considers and analyzes variables that affect the study area. In this study, variables affecting the Koh Chang Island area were physical and environmental factors (elevation, slope, distance to coastline, and distance to stream) and socio-economic factors (distance to road, distance to village, and population density). The statistical principles of logistic regression analysis were applied to analyze the collected variables to determine the pixel-to-pixel [43,44] of LUC. Equations (5) and (6) are as follows:
where P denotes the occurrence probability of the event, x denotes the independent variable, α denotes the constant, and β denotes the regression coefficient. The logistic regression model was assessed by the relative operating characteristic (ROC). Validation with an ROC value higher than 0.8 indicates explanatory power and fine prediction [45].
The results of logistic regression analysis from different types of land-use types and variables that affect LUC in Koh Chang are displayed in β coefficient. The value β is used in the Dyna-CLUE model because it is an important result of processing in the model as one of the main parameter files that must be input into an allocation file (alloc). The β coefficient of the logistic regression factor is considered in conjunction with the relative elasticity for change. The boundary condition for LUC to change or not is set between 0 to 1, where values approaching 1 are highly susceptible to changes [17,18]. The results from the Markov chain analysis, which show the proportion of each type of land-use between 2021 and 2050, will be input into the demand file. Under determining the future forecast scenarios, the area restrictions of the model are used under three dynamic scenarios: Scenario-1 natural evolution scenario (NE), Scenario-2 reserved area protection scenario (NP), and Scenario-3 recreation area growth scenario (RG). The NE was formulated based on historical LUC trends. NP included policy-based scenarios, in which a portion of Koh Chang’s land-use (which is defined under state law) is based on the ecological protection and policy orientation, represented in a layer of reserved area, which prevents LUC to occur in the area. RG highlighted the recreation area. Koh Chang is currently designated as a natural resource conservation area and is being pushed as a coastal tourist city. Therefore, the construction of buildings and the expansion of arable land must be strictly controlled, and systematic land-use planning must be carried out. As Koh Chang has limited space, some areas should be reserved to prevent expansion of the recreation area, village area, and agricultural area. Therefore, the Dyna-CLUE model is required to visualize future LUCs in order to monitor encroachment in areas sensitive to LUC.
3. Results
3.1. Spatio–Temporal LUCs in Koh Chang
3.1.1. Land-Use Pattern Analysis
The study area was visually classified into five major land-use classes, namely, (1) forest land (F) consisting of deciduous forest and mangrove forests; (2) agricultural land (A) consisting of para rubber, agalloch, mixed orchard, durian, coconut, and shrimp farm; (3) urban and built-up land (U) consisting of village and institutional land; (4) recreation area (R); and (5) miscellaneous land (M) consisting of beach and waterbodies in 1990, 2005, and 2020 (Figure 4). Results from the interpretation of land-use by supervised classification were used to modify land-use (post-classification and reclassification). The five classes of land use models were resized to the image grid from 30 m resolution to 100 m to optimize size before being analyzed for variables affecting LUC in the Dyna-CLUE model approach. The overall accuracy assessment was 87.3%, 81.5%, and 79.9% in 2020, 2005, and 1990, respectively, with a Kappa coefficient () of 0.85, 0.79 and 0.74, respectively (the Supplementary Materials, Tables S1–S3). Increased classification accuracy had a higher level of accuracy than in the past as current Landsat satellites improved the radiometric accuracy in the Landsat image.
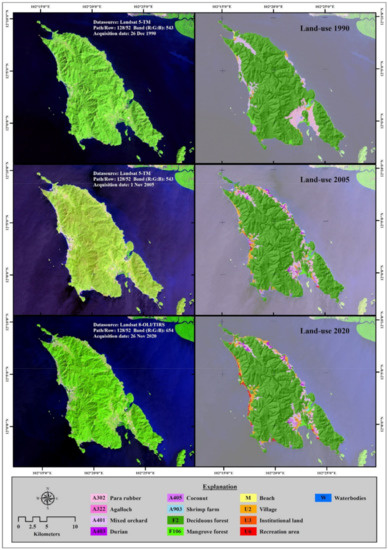
Figure 4.
Land-use pattern and Landsat satellite imagery of Koh Chang Island in 1990, 2005, and 2020.
Koh Chang was mostly covered by a forest land-use type. In 1990 it covered up to 87.56% (184.83 km2), and the area gradually decreased to 84.64% (178.68 km2) in 2005 and 84.66% (178.71 km2) in 2020, respectively. The east and south parts of Koh Chang are covered by deciduous forest and mangrove forest. The agricultural land area is the second most covered land-use, covering the area of Koh Chang, accounting for 11.40% (24.06 km2), 11.04% (23.31 km2), and 9.29% (19.61 km2) in the years 1990, 2005, and 2020, respectively. Agricultural land covers the surrounding islands in the north, east and south of Koh Chang and contains a mixture of orchard, coconut, para rubber, durian, and agalloch. These two types of land-use trends have decreased in the past three decades. By contrast, urban and built-up land, recreational areas, and miscellaneous land, showed an increasing trend. In specific, urban and built-up land covered 0.69%, 3.20%, and 4.06% in 1990, 2005, and 2020, respectively, and recreational areas densely covered 0.04%, 0.29%, and 1.30% of the surrounding narrow plains of Koh Chang, the west, north and east parts of the island. The proportion of land-use area in Koh Chang is shown in Table 3.
Table 3.
Land-use area statistics in Koh Chang in 1990, 2005, and 2020 (km2).
3.1.2. LUC Dynamic Transfer Analysis
LUC dynamic transfer in Koh Chang showed significant changes: (1) recreation expansion, (2) urban expansion, (3) agricultural contraction, and (4) deforestation (Figure 5 and Table 4). Recreation expansion in the past three decades showed a very high expansion from the 0.09 km2 area in 1990 to 2.74 km2 in 2020, representing an increase of 2944.44%. Subsequently, urban expansion increased from 1.46 km2 in 1990 to 8.57 km2 in 2020, representing an increase of 486.99%. The LUC types that have changed in a downward direction were agricultural contraction and deforestation. Agricultural contraction land area decreased from 24.06 km2 to only 19.61 km2, equivalent to a contraction of 18.50%, and deforestation area decreased from 184.83 km2 to only 178.64 km2, equivalent to a contraction of only 3.35%.
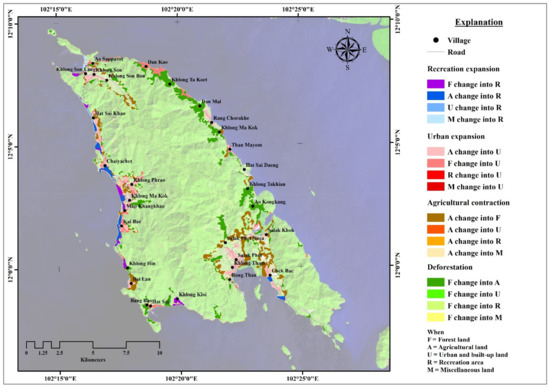
Figure 5.
Land-use change dynamics map from 1990 to 2020 in Koh Chang, Trat Province.
Table 4.
Matrix of LUC in the Koh Chang area, 1990–2020 (km2).
Spatial evolution, especially of recreational areas, has a very high expansion along the west coast of Koh Chang, starting from Hat Sai Khao village, Chaiyachet village, Khlong Phrao village, Khlong Ma Kok village, Map Khangkhao, and Kai Bae village. The area in the past was a land-use type of mangrove forest, orchard, and indigenous communities, today being replaced by hotels and resorts that almost fill the sandy beach area along the way. Urban expansion includes villages and government buildings appearing next to the coast to the inner part of the island around Hat Sai Khao village and Chaiyachet village, and large areas in the north and south of the island around Klong Son village, Dan Kao village, Chek Bae village and Salak Phet village.
Agricultural contraction decreased after the replacement of villages and tourist sites, appearing on the west coast of the island and on the southern part of the island around Salak Phet and Salak Khok. The community promoted and managed community forest areas for conservation to maintain mangrove forests for marine life. Finally, deforestation showed an increase in land area visible along the northern coast, east coast to southern coast of Koh Chang, which displaced mostly agricultural land up to 9.09 km2. The agricultural area in this island contains para rubber, alternated with durian and coconut, which are important cash crops in Koh Chang. It has been promoted by government agencies and is popular with Koh Chang villagers. Therefore, the agricultural area has greatly expanded in Koh Chang.
3.2. Driving Factors Analysis in Koh Chang
Negative and positive β coefficients obtained in logistic regression analysis indicated the positive and negative relationships between various LUCs and the driving variables (Table 5).
Table 5.
Logistic regression results of the spatial distribution of LUC in Koh Chang.
Five driving variables affected the change in forest land area: slope (β = 0.042), elevation (β = 0.033), distance to road (β = 0.005, distance to village (β = 0.001), and distance to coastline (β = 0.001), respectively. Most of them are positive β coefficients. Thus, the higher the slope and the higher the elevation, the more prone to forest transition and the further the distance from village roads and coastlines, thereby affecting the susceptibility to forest type land-use transition.
Meanwhile, negative β coefficients affected changes in the type of agricultural land, urban and built-up land, and recreational areas. The changes in agricultural land area were influenced by five variables, including population density, showing strong negative β coefficients (β = −0.665), followed by elevation (β = −0.020), and distance to road and distance to village (β = −0.001). These results suggest that sparsely populated areas, low elevation of terrain, or flat areas close to roads and villages are susceptible to conversion of land-use into agricultural land. However, only one variable, distance to coastline, showed positive β coefficients (β = 0.001).
Four key driving variables affected urban and built-up land areas, of which population density showed strong positive β coefficients (β = 0.306), indicating a densely populated area, affecting the land-use transformation into urban and built-up land.
Conversely, the negative β coefficients affecting urban and built-up land showed that slope (β = −0.053), elevation (β = −0.029), and distance to road (−0.002), the flat or foothill area with low altitude and close to the road, would easily result in urban and built-up land types.
Similarly, to the recreation area, the major variables included the population density showing strong positive β coefficients (β = 0.700) and negative β coefficients found in elevation variables (β = −0.027), and distance to coastline (−0.007). The variables of miscellaneous land that affected the changes were elevation (β = −0.064), distance to coastline (−0.008), and distance to stream (0.001).
The ROC method was used to verify the effectiveness of the auto logistic regression. Results showed that ROC values of various land-use patterns in Koh Chang were greater than 0.8, which indicated that the auto logistic model was relatively high. ROC values were 0.957 (forest), 0.882 (agricultural), 0.900 (urban/built-up lands), 0.959 (recreation area) and 0.949 (miscellaneous land).
3.3. Simulation of LUC Patterns under Three Dynamic Scenarios in Koh Chang
3.3.1. Scenario-1 NE Scenario
Results from the Dyna-CLUE model analysis in NE showed that the west coast of the study area had the most LUC, reduced forest cover and expansion of urban and built-up land land-use type. Recreational areas covered a large area along the coastline from the north coast to the south. The expansion extended from Hat Sai Khao village to Khlong Kloi village, a village on the south side of Koh Chang. From the northeast to the south-eastern part of the island, a large patch of agricultural land was found continuing along the edge of the forest area. One concern for the NE scenario is agricultural areas extending into large forest areas in the southeast side of the island. In the south of the island, forests transformed into villages and farmland traversed the southern slopes of the island in the areas of Salak Phet Nuea village, Salak Phet village, Khlong Tham village, and Rong Than village. The proportion of urban and built-up land-use in 2020 covered only 8.57 km2, but the study in the NE scenario showed that it will increase to 21.13 km2 by 2050, with 246.56% expansion (Table 6).
Table 6.
The land-use demand in three scenarios of Koh Chang in 2050 (km2).
3.3.2. Scenario-2 NP Scenario
In NP, conservation areas bound to the Dyna-CLUE model are protected areas, declared in accordance with the resolution of the National Environment Board and Cabinet resolution of November 19, 1991. Watershed classification-WC in eastern Thailand has been designated as WC-1A, as an area that is prohibited under all circumstances to preserve a true watershed forest area. It can be designated as a national park area or wildlife sanctuary, prohibiting people from owning or issuing title deeds. The results of this scoping simulation model revealed that the southern area of Koh Chang was able to maintain forest cover even after the road was constructed. The area of forest land in 2020 covering 178.64 km2 was reduced to 151.71 km2, or approximately −84.92%, but still has more forest cover than other scenarios. The transformation of forests into urban and built-up land and recreational areas is also visible in the coastal areas from the north coast to the south, and the east coast of Koh Chang has expanded agricultural land that also appears in the NP scenario.
3.3.3. Scenario-3 RG Scenario
RG is a scenario where the growth rate of attractions and utilities is expected to be approximately 3.15% in the future. The results of the model show that an increase in tourists in the future will greatly affect LUC. Recreation areas around Koh Chang expande, especially in the south, where in the future a new road line will be constructed from Khlong Kloi village to Salak Phet village to shorten travel time. By 2050, the forest area will be transformed into a recreation area along both sides of the road of Salak Phet bay and Salak bay, which are mangrove forests converted to villages, interspersed with recreation areas. Recreation areas in 2020 covered an area of only 2.74 km2, but the results of the study in the RG scenario show that in 2050 it will increase to 12.63 km2 in 2050, an expansion of 460.95% (Table 6).
Land-use simulations in the next three decades showed future land-use patterns and LUC areas between 2020 and 2050 under three dynamic scenarios, namely, NE, NP, and RG, as shown in Figure 6.
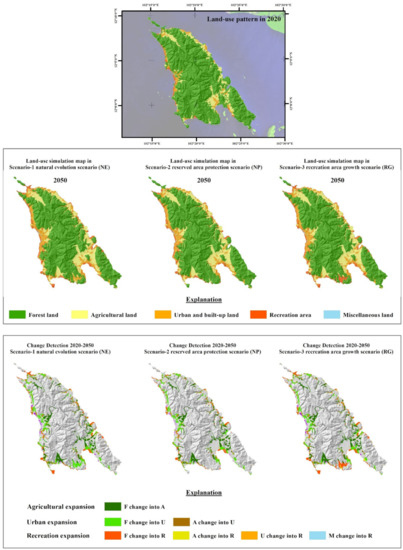
Figure 6.
Land-use simulation maps in 2050 under three dynamic scenarios and predicted LUC in Koh Chang over three decades.
The simulations exhibited similar change trends in urban and built-up land and recreation areas under different scenarios. The expansion of such buildings generally occurs in primitive communities, with most of the expansion appearing quite prominently along the west coast of Koh Chang (Figure 7b–d). The key factor contributing to the expansion of urban and built-up land and recreation areas is population density, which allows the area to replace agricultural land and transform forest into a reserved area. Strategic policy of the Tourism Council of Trat Province from 1978 to 1980 has a vision of “Revitalizing tourism businesses along with safe communities to drive the economy” under a project entitled “Koh Chang Together”. Such land-use types may expand according to the model, especially along the west coast of the island where village density and recreation areas are found, including Chaiyachet village, Khlong Phrao village, Klong Ma Kok, Map Khangkhao village, and Kai Bae village. The village has beautiful landscapes with white sandy beaches that are ideal for tourism in Hat Sai Khao beach, Khlong Phrao beach and Kai Bae beach.
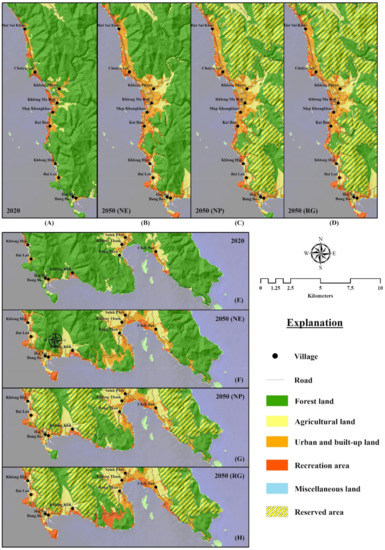
Figure 7.
Land-use simulation maps showing Koh Chang Island areas susceptible to LUC in 2050 for the western coastal area (A) under NE (B); NP (C); and RG (D) scenarios, and for the southern coastal area (E) under NE (F); NP (G); and RG (H) scenarios.
The simulation results show areas susceptible to critical LUC in the southern part of Koh Chang as shown in Figure 7E between Khlong Kloi and Rong Than villages, where roads have not yet been constructed to shorten travel times. After the road construction, a LUC simulation of the next three decades was performed under the three scenarios. The NE scenario transforms forests into villages and arable land along the edge of the forest. The area has a flat terrain between valleys (Figure 7F). Under NP, when a reserved area is defined for the preservation of coastal resources, a certain amount of forest can be preserved along the newly constructed road (Figure 7G). However, the tourism policy promoted by the government aims to expand the tourism industry in Trat Province in the future by 3.15%, which will cause recreation land to appear along both sides of newly constructed roads without breaking into the reserve area (Figure 7H).
The NP and RG scenarios demonstrate the effectiveness and importance of defining conservation boundaries to preserve rainforests and mangroves from being transformed into other types of land-use, preserving coastal ecosystems in order to be sustainable.
4. Discussion
Our results revealed that urban and built-up land and recreation areas have increased exponentially since 1990 to 2020 in Koh Chang, especially during the first 15 years (1990–2005), and the growth rate of the area has increased to 365.07% and 588.89%, respectively. The Seventh National Economic and Social Development Plan 1992–1996 was issued with the government policy of the public administration system to set the national strategy guidelines every 5 years [46]. The development plan focuses on economic development, income distribution to local communities, expansion of infrastructure investment from Bangkok and the perimeter connecting Thailand’s eastern seaboard. This development plan aimed to improve the quality of life of rural people, but inevitably caused Koh Chang to suffer a spatial evolution. Figure 8 shows a photograph taken by Google Earth in 1989. The areas of Hat Sai Khao beach, Khlong Phrao beach, and Kai Bae beach were mostly grown with coconut and rubber crops. In 1990, traces of infrastructure development began to appear in the first phase—the dirt trail, connecting Ban Hat Sai Khao village, Chaiyachet village and Kai Bae village along the western coast—then, there was an expansion of some local communities. In 1996, the construction of a commercial port in the northern part of Koh Chang was initiated to stimulate tourism in eastern Thailand, resulting in the expansion of small communities and resorts along the northern and eastern coast in 2000. Another area is along the west coast of Koh Chang, where expansions was caused by the development of large hotels and buildings. In 2010, the west coast was transformed from crops to large hotels and buildings along the coastline and began to expand into the middle of the island. Finally, in 2020, the land-use pattern is the same.
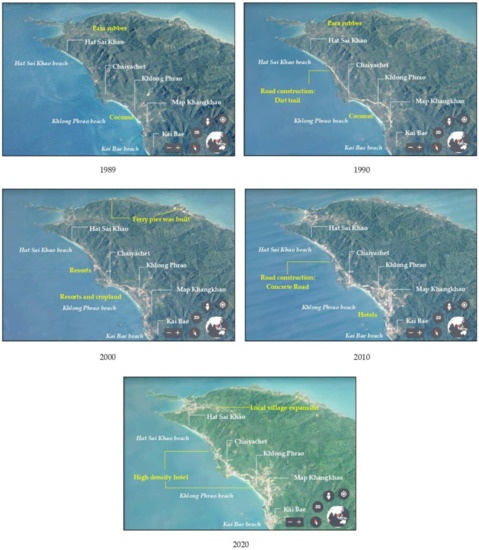
Figure 8.
Spatial evolution from past to present in Koh Chang of Thailand. Map data 2021 © Maxar Technologies.
Tropical rainforests and mangrove forests are heavily affected, especially on the west coast of the island, where most of these forest areas have been transformed into communities and resort hotels. Such impacts are often similar to those of the tourist and economic cities of Portugal’s coastline, from Lagos to Albufeira, where urban growth occurred from 1987 to 2001 into high-density urban zones in Lagos, Portimão, Armação de Pêra and Albufeira [47]. The early expansion of Koh Chang lacked control and consideration for the conservation of forest resources and coastal ecosystems, causing some resorts on the island’s east coast to protrude offshore. Mangrove forests and forests were converted into communities and homestays, similar to the La Côte d’Azur, and Coast of Biguglia areas in the French Mediterranean coastal zone [48]. Although with a low-level of environmental protection measures, it is still susceptible to urban sprawl. The change in urban sprawl during 2005–2020 that occurred in Koh Chang has not yet degraded the traditional community areas around Salak Phet and Salak Khok villages. In contrast to the study by Moschetto et al. [49], urban expansion had a significant impact on mangrove forests in the waterfront slum, Dique Vila Gilda, in the southeast coastal of Sao Paulo, Brazil. Since 2005, the Thai government has formulated The Tenth National Economic and Social Development Plan 2007–2011 [46,50], incorporating King Rama IV’s Sufficiency Economy Philosophy into practice in developing and managing the country.
The main concern of this philosophy is to increase the potential of the community to be connected as a network for development in economy, increase the quality of life, and to conserve and restore the sustainable use of natural resources and the environment, leading to self-sufficiency and integrated poverty reduction. Forest areas have been reduced and agricultural activities have been promoted to enable the community to be self-sustainable, resulting in important cash crops, such as rubber, coconut, and durian, especially Cha Nee Koh Chang Durian, which is widely cultivated along the northeast coast of the island and a premium geographical indication product in eastern Thailand. Some of the mangrove forests have become protected areas under the supervision of local communities and government agencies, including mangrove forest conservation in Salak Phet-Nanai village and Salak Khok village.
Logistic regression shows the influence of factors affecting LUC during 1900–2020. The variable that strongly influenced LUC and showed strong β coefficients was population density, which was concentrated in Hat Sai Khao village, Chaiyachet village, Khlong Phrao village, Khlong Ma Kok village, Map Khangkhao, and Kai Bae village, resulting in the expansion of the original village and community into a dense community to support tourism services. Most of the hotels and resorts are along the west coast, which, in the past, was a former mangrove, agricultural and community area. The current condition can be observed in coastal tourist cities in economic growth regions, such as China’s Shenzhen and Shanghai in China [51]. The second most important variable included physical factors, such as elevation and slope, found in almost all the studies that mentioned such variables. This physical variable is important for urban and built-up land LUC and recreation areas, because urban expansion is prone to low elevation and low slope along the coastline, continuing to the central part of Koh Chang. The west and southeast of Koh Chang are more susceptible to LUC due to the flat coastal plains than the east and north. Unlike a study by Bao et al. [52], the driving variables of LUC in the coastal area of Jiangsu, China occurred due to coastal physical variables with different soil characteristics, which are the key transmission variables affecting coastal erosion towards the north and south of coastal area. Another variable worth mentioning is distance to road, as it affects LU in the category of forest land, agricultural land, and urban and built-up land, respectively, which is the land-use of most of the island because good transport access experiences a higher probability of LUC [53]. Within the study area, such variables are at a secondary level because the transport system is not good enough. Thus, such a system may need to be developed in the future.
The agricultural land in this research had a gradual increase in the model analysis, contrary to other studies in which most of the simulation results in forest and agricultural land areas are often affected with a downward trend. For example, in central Nepal, 24 cities of the Kathmandu valley showed a decline in agricultural and vegetation land [54]. Even in the Jizhou District of China, where LUC is projected in the future to 2030, agricultural land tends to decline, but a similar study showed the trend of urban land, and other construction has more expansion direction [55]. The trend in the future expansion of urban and built-up land and recreation areas along the surrounding coasts of the study area may affect coastal erosion during the monsoon season. As evidenced by the loss of coastal ecosystems, the beach, estuary, and mangroves region has been transformed into an urban integration in Chile’s LaHerradura, Tongoy, Los Vilos, and Pichidangui, where the area has been transformed into ports and aquaculture, residential structure expansion (for tourism and permanent uses), and tourist activities [56].
The results of the Dyna-CLUE model are highly suitable for monitoring land-use areas because this model considers the factors that are analyzed under a given scenario, in accordance with the objectives specified. Each scenario presents a different land-use effect that can simulate future events in a map over the study period from 2021 to 2050. The results of each scenario provide an ideal scenario for use in land-use planning decisions and potential environmental impact assessments for systematic land-use planning. The directionless expansion of buildings such as Phuket [57] and Hua Hin must be reduced [12], especially in the southern part of Koh Chang, as it is an area that should be monitored first to manage the sustainable development of the area to ensure its sustainability in the future.
5. Conclusions
This study analyzed the spatial evolution of Koh Chang from the past to the promising future of potential land-use. A dynamic analysis of LUC was performed using the logistic regression model and Dyna-CLUE model. Driving variables analysis and scenario simulation analysis were also conducted. Results showed a significant expansion of urban and built-up land and recreation areas clearly surrounding Koh Chang, replacing forest areas. The major variables affecting LUC changes were topography, slope, population density, and distance from villages. Such interactions were modeled on future LUCs, providing a spatial context and identifying which areas are susceptible to change, i.e., along the west, south and east coasts, respectively. The results can assist decision-makers in implementing effective protection strategies and sustainable land-use management.
The dynamic change of LUC patterns was analyzed from the perspective of a coastal tourist city. If other areas have different city potential, the factors and variables that affect LUC will change. Therefore, if applied in regions other than coastal tourist cities, variables for logistic regression factor analysis may need to be changed to suit the spatial context. The variables in this research have a certain level of analytical efficiency, indicating a high ROC level. However, the decision support system can be used to evaluate different planning options by using the performance indicators, which can be defined on the basis of the relevant planning agenda. The Dyna-CLUE model and geo-informatics are planning and spatial development tools that show potential future LUCs. In addition, the study can predict the future growth of narrow coastal areas to plan for LUC under rapid tourism development. The environmental impact of infrastructure development in parallel with resource conservation must be assessed carefully, as natural resources are a valuable cost of tourism.
Supplementary Materials
The following are available online at: https://www.mdpi.com/article/10.3390/ijgi11010049/s1, Table S1: Confusion matrix of land-use classification in 1990, Table S2: Confusion matrix of land-use classification in 2005, Table S3: Confusion matrix of land-use classification in 2020, Table S4: Matrix of LUC in the Koh Chang area, 1990–2005 (km2), Table S5: Matrix of LUC in the Koh Chang area, 2005–2020 (km2).
Author Contributions
Conceptualization, Katawut Waiyasusri; methodology, Katawut Waiyasusri; software, Katawut Waiyasusri; validation, Katawut Waiyasusri and Srilert Chotpantarat; formal analysis, Katawut Waiyasusri; investigation, Katawut Waiyasusri; resources, Katawut Waiyasusri and Srilert Chotpantarat; data curation, Katawut Waiyasusri; writing—original draft preparation, Katawut Waiyasusri; writing—review and editing, Srilert Chotpantarat; visualization, Katawut Waiyasusri; supervision, Srilert Chotpantarat; project administration, Katawut Waiyasusri and Srilert Chotpantarat; funding acquisition, Katawut Waiyasusri and Srilert Chotpantarat. All authors have read and agreed to the published version of the manuscript.
Funding
Gratefully acknowledge for Suan Sunandha Rajabhat University Research Grant. This research was partially supported by the Thailand Science research and Innovation fund Chulalongkorn University (CUFRB65_dis(2)_090_23_20) and Ratchadaphisek Sompoch Endowment Fund (2021) Chulalongkorn University (764002-ENV).
Institutional Review Board Statement
Not applicable.
Informed Consent Statement
Not applicable.
Data Availability Statement
Not applicable.
Acknowledgments
Acknowledgments to the U.S. Geological Survey (Earth Explorer Homepage: https://earthexplorer.usgs.gov/) (accessed on 23 May 2021), and the Dyna-CLUE model provided by Tom Veldkamp, Louise Fresco and Peter Verburg from the Institute for Environmental Studies (IVM), VU University, Amsterdam. (The Dyna-CLUE model Homepage: https://www.environmentalgeography.nl/site/data-models/data/clue-model/) (accessed on 5 May 2021).
Conflicts of Interest
The authors declare no conflict of interest.
References
- Bakr, N.; Weindorf, D.C.; Bahnassyb, M.H.; Mareib, S.M.; El-Badawi, M.M. Monitoring land cover changes in a newly reclaimedarea of Egypt using multi-temporal Landsat data. Appl. Geogr. 2010, 30, 592–605. [Google Scholar] [CrossRef]
- Orimoloye, I.R.; Ololade, O.O.; Mazinyo, S.P.; Kalumba, A.M.; Ekundayo, O.Y.; Busayo, E.T.; Nel, W. Spatial assessment of drought severity in Cape Town area, South Africa. Heliyon 2019, 5, e02148. [Google Scholar] [CrossRef]
- Lu, X.; Yao, S.; Fu, G.; Lv, X.; Mao, Y. Dynamic simulation test of a model of ecological system security for a coastal tourist city. J. Destin. Mark. Manag. 2019, 13, 73–82. [Google Scholar] [CrossRef]
- Hjalager, A. Land-use conflicts in coastal tourism and the quest for governance innovations. Land Use Policy 2020, 94, 104566. [Google Scholar] [CrossRef]
- Islam, K.; Jashimuddin, M.; Nath, B.; Kumar, T.N. Land use classification and change detection by using multi-temporal remotely sensed imagery: The case of Chunati wildlife sanctuary, Bangladesh. Egypt. J. Remote Sens. Space Sci. 2018, 21, 37–47. [Google Scholar] [CrossRef]
- Mark, M.; Oshneck, M.; Tatenda, M.; Rameck, D. A GIS and remote sensing aided assessment of land use/cover changes in resettlement areas; a case of ward 32 of Mazowe district, Zimbabwe. J. Environ. Manag. 2020, 276, 111312. [Google Scholar]
- Lambin, E.F.; Geist, H.J.; Lepers, E. Dynamics of land-use and land-cover change in tropical regions. Annu. Rev. Environ. Resour. 2003, 28, 205–241. [Google Scholar] [CrossRef]
- Bertolo, L.S.; Lima, G.T.N.P.; Santos, R.F. Identifying change trajectories and evolutive phases on coastal landscapes. Case study: São Sebastião Island, Brazil. Landsc. Urban Plan. 2012, 106, 115–123. [Google Scholar] [CrossRef]
- Shooshtari, S.J.; Silva, T.; Namin, B.R.; Shayesteh, K. Land Use and Cover Change Assessment and Dynamic Spatial Modeling in the Ghara-su Basin, Northeastern Iran. J. Indian Soc. Remote Sens. 2020, 48, 81–95. [Google Scholar] [CrossRef]
- Cerqua, A. The signalling effect of eco-labels in modern coastal tourism. J. Sustain. Tour. 2017, 25, 1159–1180. [Google Scholar] [CrossRef]
- Andersen, I.M.V.; Blichfeldt, B.S.; Liburd, J.J. Sustainability in coastal tourism development: An example from Denmark. Curr. Issues Tour. 2018, 21, 1329–1336. [Google Scholar] [CrossRef]
- Kityuttachai, K.; Tripathi, N.K.; Tipdecho, T.; Shrestha, R. CA-Markov Analysis of Constrained Coastal Urban Growth Modeling: Hua Hin Seaside City, Thailand. Sustainability 2013, 5, 1480–1500. [Google Scholar] [CrossRef]
- Gaughan, A.E.; Binford, M.W.; Southworth, J. Tourism, forest conversion, and land transformations in the Angkor basin, Cambodia. Appl. Geogr. 2009, 29, 212–223. [Google Scholar] [CrossRef]
- Dimobe, K.; Goetze, D.; Ouédraogo, A.; Forkuor, G.; Wala, K.; Porembski, S.; Thiombiano, A. Spatio-temporal dynamics in land use and habitat fragmentation within a protected area dedicated to tourism in a Sudanian savanna of West Africa. Landsc. Ecol. 2017, 10, 75–95. [Google Scholar] [CrossRef]
- Xi, J.C.; Zhao, M.F.; Wang, K. Land use evolution of growth tourism-town from 1986 to 2010: A case study of sanpo town in yesanpo tourism attraction in Hebei province. Geogr. Res. 2013, 32, 11–19. [Google Scholar]
- Verburg, P.H.; Overmars, K.P. Combining top-down and bottom-up dynamics in land use modeling: Exploring the future of abandoned farmlands in Europe with the Dyna-CLUE model. Landsc. Ecol. 2009, 24, 1167–1181. [Google Scholar] [CrossRef]
- Verburg, P.H.; Soepboer, W.; Veldkamp, A. Modeling the spatial dynamics of regional land use: The CLUE-S model. Environ. Manag. 2002, 3, 391–405. [Google Scholar] [CrossRef]
- Verburg, P.H.; Overmars, K.P.; Witte, N. Accessibility and land-use patterns at the forest fringe in the northeastern part of the Philippines. Geogr. J. 2004, 170, 238–255. [Google Scholar] [CrossRef]
- Verburg, P.; Overmars, K. Dynamic Simulation of Land-Use Change Trajectories with the Clue-S Model. In Modelling Land-Use Change; Koomen, E., Stillwell, J., Bakema, A., Scholten, H.J., Eds.; The GeoJournal Library: Dordrecht, The Netherlands; Springer: Dordrecht, The Netherlands, 2007; Volume 90, pp. 321–337. [Google Scholar]
- Price, B.; Kienast, F.; Seidl, I.; Ginzler, C.; Verburg, P.H.; Bolliger, J. Future landscapes of Switzerland: Risk areas for urbanisation and land abandonment. Appl. Geogr. 2015, 57, 32–41. [Google Scholar] [CrossRef]
- Das, P.; Behera, M.D.; Pal, S.; Chowdary, V.M.; Behera, P.R.; Singh, T.P. Studying land use dynamics using decadal satellite images and Dyna-CLUE model in the Mahanadi River basin, India. Environ. Monit. Assess. 2019, 191, 804. [Google Scholar] [CrossRef]
- Waiyasusri, K.; Wetchayont, P. Assessing Long-Term Deforestation in Nam San Watershed, Loei Province, Thailand Using A Dyna-Clue Model. Geogr. Environ. Sustain. 2020, 13, 81–97. [Google Scholar] [CrossRef]
- Adhikari, R.K.; Mohanasundaram, S.; Shrestha, S. Impacts of land-use changes on the groundwater recharge in the Ho Chi Minh city, Vietnam. Environ. Res. 2020, 185, 109440. [Google Scholar] [CrossRef]
- Khoi, D.N.; Loi, P.T.; Sam, T.T. Impact of Future Land-Use/Cover Change on Streamflow and Sediment Load in the Be River Basin, Vietnam. Water 2021, 13, 1244. [Google Scholar] [CrossRef]
- Srinonil, S.; Nittivattananon, V.; Noithammaraj, P.; Nitisoravut, R. Tourism Governance for Coastal Urbanization and Environment with Changing Climate on Koh Chang Island, Thailand. GMSARN Int. J. 2020, 14, 82–88. [Google Scholar]
- Ministry of Tourism and Sports (MOTS). The Second National Tourism Development Plan, 2017–2021; MOTS: Bangkok, Thailand, 2017.
- Lunn, K.E.; Dearden, P. Fishers’ Needs in Marine Protected Area Zoning: A Case Study from Thailand. Coast. Manag. 2006, 34, 183–198. [Google Scholar] [CrossRef]
- Tourism Authority of Thailand. Koh Chang. Available online: https://www.tourismthailand.org/Destinations/Provinces/ko-chang/467 (accessed on 8 August 2021).
- Nitivattananon, V.; Srinonil, S. Enhancing coastal areas governance for sustainable tourism in the context of urbanization and climate change in eastern Thailand. Adv. Clim. Chang. Res. 2019, 10, 47–58. [Google Scholar] [CrossRef]
- National Statistical Office of Thailand, Tourism and Sports Statistics. Available online: http://statbbi.nso.go.th/staticreport/page/sector/en/17.aspx (accessed on 8 August 2021).
- Department of Economic and Social Affairs. Sustainable Development, Goals 8 Promote Sustained, Inclusive and Sustainable Economic Growth, Full and Productive Employment and Decent Work for All. Available online: https://sdgs.un.org/topics/sustainable-tourism (accessed on 9 August 2021).
- Department of Economic and Social Affairs. Sustainable Development, Goals 14 Conserve and Sustainably Use the Oceans, Seas and Marine Resources for Sustainable Development. Available online: https://sdgs.un.org/topics/oceans-and-seas (accessed on 9 August 2021).
- Pumijumnong, N.; Payomrat, P. The Effective Ecological Factors and Vegetation at Koh Chang Island, Trat Province, Thailand. Open J. For. 2013, 3, 41–48. [Google Scholar] [CrossRef]
- Englong, A.; Punwong, P.; Selby, K.; Marchant, R.; Traiperm, P.; Pumijumnong, N. Mangrove dynamics and environmental changes on Koh Chang, Thailand during the last millennium. Quat. Int. 2019, 500, 128–138. [Google Scholar] [CrossRef]
- Bissen, R.; Chawchai, S. Microplastics on beaches along the eastern Gulf of Thailand—A preliminary study. Mar. Pollut. Bull. 2020, 157, 111345. [Google Scholar] [CrossRef] [PubMed]
- United States Geological Survey, Landsat 8. Available online: https://www.usgs.gov/core-science-systems/nli/landsat/landsat-8?qt-science_support_page_related_con=0#qt-science_support_page_related_con (accessed on 11 August 2021).
- Kiefer, R.W.; Lillesand, T.M.; Chipman, J. Remote Sensing and Image Interpretation, 7th ed.; Wiley: New York, NY, USA, 2015; p. 736. [Google Scholar]
- Forkuor, G.; Dimobe, K.; Serme, I.; Tondoh, J.E. Landsat-8 vs. Sentinel-2: Examining the added value of sentinel-2′s red-edge bands to land-use and land-cover mapping in Burkina Faso. GISci. Remote Sens. 2018, 55, 331–354. [Google Scholar] [CrossRef]
- Egorov, A.V.; Hansen, M.C.; Roy, D.P.; Kommareddy, A.; Potapov, P.V. Image interpretation-guided supervised classification using nested segmentation. Remote Sens. Environ. 2015, 165, 135–147. [Google Scholar] [CrossRef]
- Guan, D.; Li, H.; Inohae, T.; Su, W.; Nagaie, T.; Hokao, K. Modeling urban land use change by the integration of cellular automaton and Markov model. Ecol. Model. 2011, 222, 3761–3772. [Google Scholar] [CrossRef]
- Muller, M.R.; Middleton, J. A Markov model of land-use change dynamics in the Niagara, Ontario, Canada. Landsc. Ecol. 1994, 9, 151–157. [Google Scholar]
- Wang, S.Y.; Liu, J.S.; Ma, T.B. Dynamics and changes in spatial patterns of land use in Yellow River Basin, China. Land Use Policy 2010, 27, 313–323. [Google Scholar] [CrossRef]
- Achmad, A.; Hasyim, S.; Dahlan, B.; Aulia, D.N. Modeling of urban growth in tsunami-prone city using logistic regression: Analysis of Banda Aceh, Indonesia. Appl. Geogr. 2015, 62, 237–246. [Google Scholar] [CrossRef]
- Lang, Y.; Song, W.; Zhang, Y. Responses of the water-yield ecosystem service to climate and land use change in Sancha River Basin, China. Phys. Chem. Earth 2017, 101, 102–111. [Google Scholar] [CrossRef]
- Schneider, L.C.; Pontius, R.G. Modeling land-use change in the Ipswich watershed, Massachusetts, USA. Agric. Ecosyst. Environ. 2001, 85, 83–94. [Google Scholar] [CrossRef]
- The National Economic and Social Development Board, Office of The Prime Minister of Thailand. The National Economic and Social Development Plan. Available online: https://www.nesdc.go.th/nesdb_en/ewt_w3c/ewt_dl_link.php?filename=develop_issue&nid=3782 (accessed on 20 August 2021).
- Martins, V.N.; Pires, R.; Cabral, P. Modelling of coastal vulnerability in the stretch between the beaches of Porto de Mós and Falésia, Algarve (Portugal). J. Coast. Conserv. 2012, 16, 503–510. [Google Scholar] [CrossRef]
- Robert, S.; Fox, D.; Boulay, G.; Grandclément, A.; Garrido, M.; Pasqualini, V.; Prévost, A.; Schleyer-Lindenmann, A.; Trémélo, M. A framework to analyse urban sprawl in the French Mediterranean coastal zone. Reg. Environ. Chang. 2019, 19, 559–572. [Google Scholar] [CrossRef]
- Moschetto, F.A.; Ribeiro, R.B.; De Freitas, D.M. Urban expansion, regeneration and socioenvironmental vulnerability in a mangrove ecosystem at the southeast coastal of São Paulo, Brazil. Ocean Coast. Manag. 2021, 200, 105418. [Google Scholar] [CrossRef]
- Waiyasusri, K.; Kulpanich, N.; Worachairungreung, M.; Sae-ngow, P.; Chaysmithikul, P. Flood Prone Risk area Analysis during 2005–2019 in Lam Se Bok Watershed, Ubon Ratchathani Province, Thailand. Geogr. Tech. 2021, 16, 141–153. [Google Scholar] [CrossRef]
- Lu, D.; Li, L.; Li, G.; Fan, P.; Ouyang, Z.; Moran, E. Examining Spatial Patterns of Urban Distribution and Impacts of Physical Conditions on Urbanization in Coastal and Inland Metropoles. Remote Sens. 2018, 10, 1101. [Google Scholar] [CrossRef]
- Bao, G.Y.; Huang, H.; Gao, Y.N.; Wang, D.B. Study on driving mechanisms of land use change in coastal area of Jiangsu, China. J. Coast. Res. 2017, 79, 104–108. [Google Scholar] [CrossRef]
- Amézquita-López, J.; Valdés-Atencio, J.; Angulo-García, D. Understanding Traffic Congestion via Network Analysis, Agent Modeling, and the Trajectory of Urban Expansion: A Coastal City Case. Infrastructures 2021, 6, 85. [Google Scholar] [CrossRef]
- Rimal, B.; Zhang, L.; Keshtkar, H.; Haack, B.N.; Rijal, S.; Zhang, P. Land Use/Land Cover Dynamics and Modeling of Urban Land Expansion by the Integration of Cellular Automata and Markov Chain. ISPRS Int. J. Geo-Inf. 2018, 7, 154. [Google Scholar] [CrossRef]
- Li, H.; Song, W. Pattern of spatial evolution of rural settlements in the Jizhou District of China during 1962–2030. Appl. Geogr. 2020, 122, 102247. [Google Scholar] [CrossRef]
- Aguilera, M.A.; Tapia, J.; Gallardo, C.; Núñez, P.; Varas-Belemmi, K. Loss of coastal ecosystem spatial connectivity and services by urbanization: Natural-to-urban integration for bay management. J. Environ. Manag. 2020, 276, 111297. [Google Scholar] [CrossRef]
- Nguyen, H.A.T.; Sophea, T.; Gheewala, S.H.; Rattanakom, R.; Areerob, T.; Prueksakorn, K. Integrating remote sensing and machine learning into environmental monitoring and assessment of land use change. Sustain. Prod. Consum. 2021, 27, 1239–1254. [Google Scholar] [CrossRef]


Publisher’s Note: MDPI stays neutral with regard to jurisdictional claims in published maps and institutional affiliations. |
© 2022 by the authors. Licensee MDPI, Basel, Switzerland. This article is an open access article distributed under the terms and conditions of the Creative Commons Attribution (CC BY) license (https://creativecommons.org/licenses/by/4.0/).