Article

Impacts of Slow-Release Nitrogen Fertilizer Rates on the Morpho-Physiological Traits, Yield, and Nitrogen Use Efficiency of Rice under Different Water Regimes

1
College of Water Conservancy and Civil Engineering, South China Agricultural University, Guangzhou 510642, China
2
College of Agricultural Science and Engineering, Hohai University, Nanjing 210098, China
3
National Center for International Collaboration Research on Precision Agricultural Aviation Pesticides Spraying Technology (NPAAC), College of Engineering, South China Agriculture University, Guangzhou 510642, China
4
College of Chemical Engineering, Nanjing Forestry University, Nanjing 210037, China
5
Department of Agronomy, Faculty of Agriculture, Mansoura University, Mansoura 35516, Egypt
6
Guangdong Key Laboratory for New Technology Research of Vegetables, Guangdong Academy of Agricultural Sciences, Vegetable Research Institute, Guangzhou 510640, China
*
Author to whom correspondence should be addressed.
These authors contributed equally to this work.
Agriculture 2022, 12(1), 86; https://doi.org/10.3390/agriculture12010086
Submission received: 14 November 2021 / Revised: 16 December 2021 / Accepted: 22 December 2021 / Published: 10 January 2022

Abstract

:
The efficient use of water and fertilizer is vital for optimizing plant growth and yield in rice production. To achieve sustainable rice production and resource management, the ways in which applied water and nitrogen affect the root and shoot morpho-physiology, as well as yield, must be understood. In this study, a pot experiment was conducted to investigate the effects of slow-release nitrogen fertilizer (sulfur-coated urea) application at three levels (light nitrogen (NL), medium nitrogen (NM), and heavy nitrogen (NH)) on the growth, yield, and nitrogen use efficiency (NUE) of rice grown under three water regimes (wetting and soil saturation (WSS), wetting and moderate drying (WMD) and wetting and severe drying (WSD)). The results revealed that differences in water regimes and fertilizer rates led to significant differences in the roots, shoots, yield, and NUE of rice. Increasing the N dosage by 5% enhanced the root and biomass production by 16% in comparison with that of the other groups. The NH×WSS treatment produced the greatest root length, weight, density, active absorption, and oxidation. However, the integration of WSS × NL generated the maximum value of nitrogen apparent recovery efficiency (63.1% to 67.6%) and the greatest value of nitrogen partial factor productivity (39.9 g g−1 to 41.13 g g−1). Transmission electron microscopy (TEM) images showed that plants grown under high and medium nitrogen fertilizer rates with WSS had improved leaf mesophyll structure with normal starch grains, clear cell walls, and well-developed chloroplasts with tidy and well-arranged thylakoids. These results show that TEM images are useful for characterizing the nitrogen and water status of leaves in the sub-micrometer range and providing specific information regarding the leaf microstructure. The findings of this study suggest that the application of NH×WSS can produce improvements in growth traits and increase rice yield; however, the NL×WSS treatment led to greater NUE, and the authors recommend its usage in rice agriculture.

1. Introduction

In the 21st century, agriculture faces the challenge of producing enough food to feed the world’s rapidly expanding population under conditions of increasing water scarcity. Rice is one of the most popular staple food crops worldwide, feeding over 40% of the global population and 60% of the Chinese population [1]. Rice farming consumes most of the world’s freshwater for irrigation [2], and approximately 70–80% of China’s freshwater is used for this purpose [3]. Several water-saving technologies have been implemented to optimize rice yield when water is scarce, including aerobic rice systems, drought-tolerant genotypes, and alternate wetting and soil drying (AWD) irrigation [4]. AWD methods were developed to reduce the amount of water utilized for irrigation in paddy fields by allowing them to dry out to soil field capacity before rewatering [5,6].
Crop roots are the primary organ responsible for water and nutrient uptake, and their growth is influenced by the soil moisture content and levels of available nutrients. The integration of watering regimes and fertilization to increase available nitrogen (N) produces an interactive effect on rice growth in paddy soils. Continuous flooding (CF) irrigation alters soil characteristics and enhances the permeation of nutrients into roots. In comparison with AWD, CF provides greater concentrations of soluble nutrients and less nutrient loss [7]. Soil subjected to AWD irrigation undergoes significant changes during the transition from flooded to non-flooded conditions [8]. AWD shifts result in a relatively dramatic change in the soil’s physiochemical environment, which can regulate the root and shoot growth of rice [9]. Furthermore, AWD shifts affect many soil chemical properties, such as soil pH and redox potential [10]. Moreover, in comparison with CF irrigation, N uptake by rice is impaired by AWD irrigation because of physiological responses to N and water stress [11], which lead to inefficient water absorption by roots and reduce N accessibility in the rhizosphere [12]. Thus, inadequate water and N supply affect root growth processes and overall plant growth [6,13]. Therefore, the interactive effect of water regimes and N fertilization strategies on root zone chemistry must be comprehensively understood to allow rice growers to compensate for N inefficiency and improve root and shoot growth, thereby increasing grain yield and nitrogen use efficiency (NUE) [14].
Rice crops deplete soil nutrients, and N fertilizer is essential for optimal rice yields [15]. However, the NUE of rice is only 20–30%, and a large amount of N applied in fertilizer is lost to the environment [16,17]. The low NUE of rice has led to excessive and ineffective use of N fertilizer, which has caused serious soil degradation, groundwater pollution, and the emission of ammonia and greenhouse gases [3] as a result of surface runoff losses, leaching into groundwater, and volatilization into the atmosphere. Therefore, many studies have shown that slow-release N fertilizers (SRNFS) are effective in increasing yield and NUE for rice cultivation [18,19], as well as in reducing negative environmental impacts [20]. Hence, the development of water and N-fertilizer-efficient technologies should be pursued, because they can allow rice growers to consistently achieve high grain yields and NUE [21].
Rice roots react differently under different water regimes and provide the first line of defense against water and N stress [22]. The availability of water and N nutrients influences the growth of plant roots [23], and the rice root morphology plays an essential role in N absorption from soil [14]. High root activity causes strong N uptake and supports high rice yield and NUE [24]. Therefore, the impacts of different rates of SRNF application on rice grown under various water regimes merit additional investigation.
China has become the largest N fertilizer consumer in the world, and rice farming has grown dependent on CF irrigation [25], threatening rice production [26]. Therefore, rice growers have been advised to utilize AWD irrigation to overcome the consequences of water scarcity. Given the urgent need for the introduction of rice water and N fertilizer management practices, the development of water-saving and N-fertilizer-efficient technologies is required. In addition, water and N supply options should provide optimum soil water conditions, thereby providing a favorable growth medium for the absorption of N, leading to optimal plant growth and rice yield. Therefore, the main aim of the present study was to evaluate the effects of different application rates of SRNFs under diverse water regimes on the morpho-physiological attributes and their relations to the N uptake, NUE, and productivity of rice in a pot trial.

2. Materials and Methods

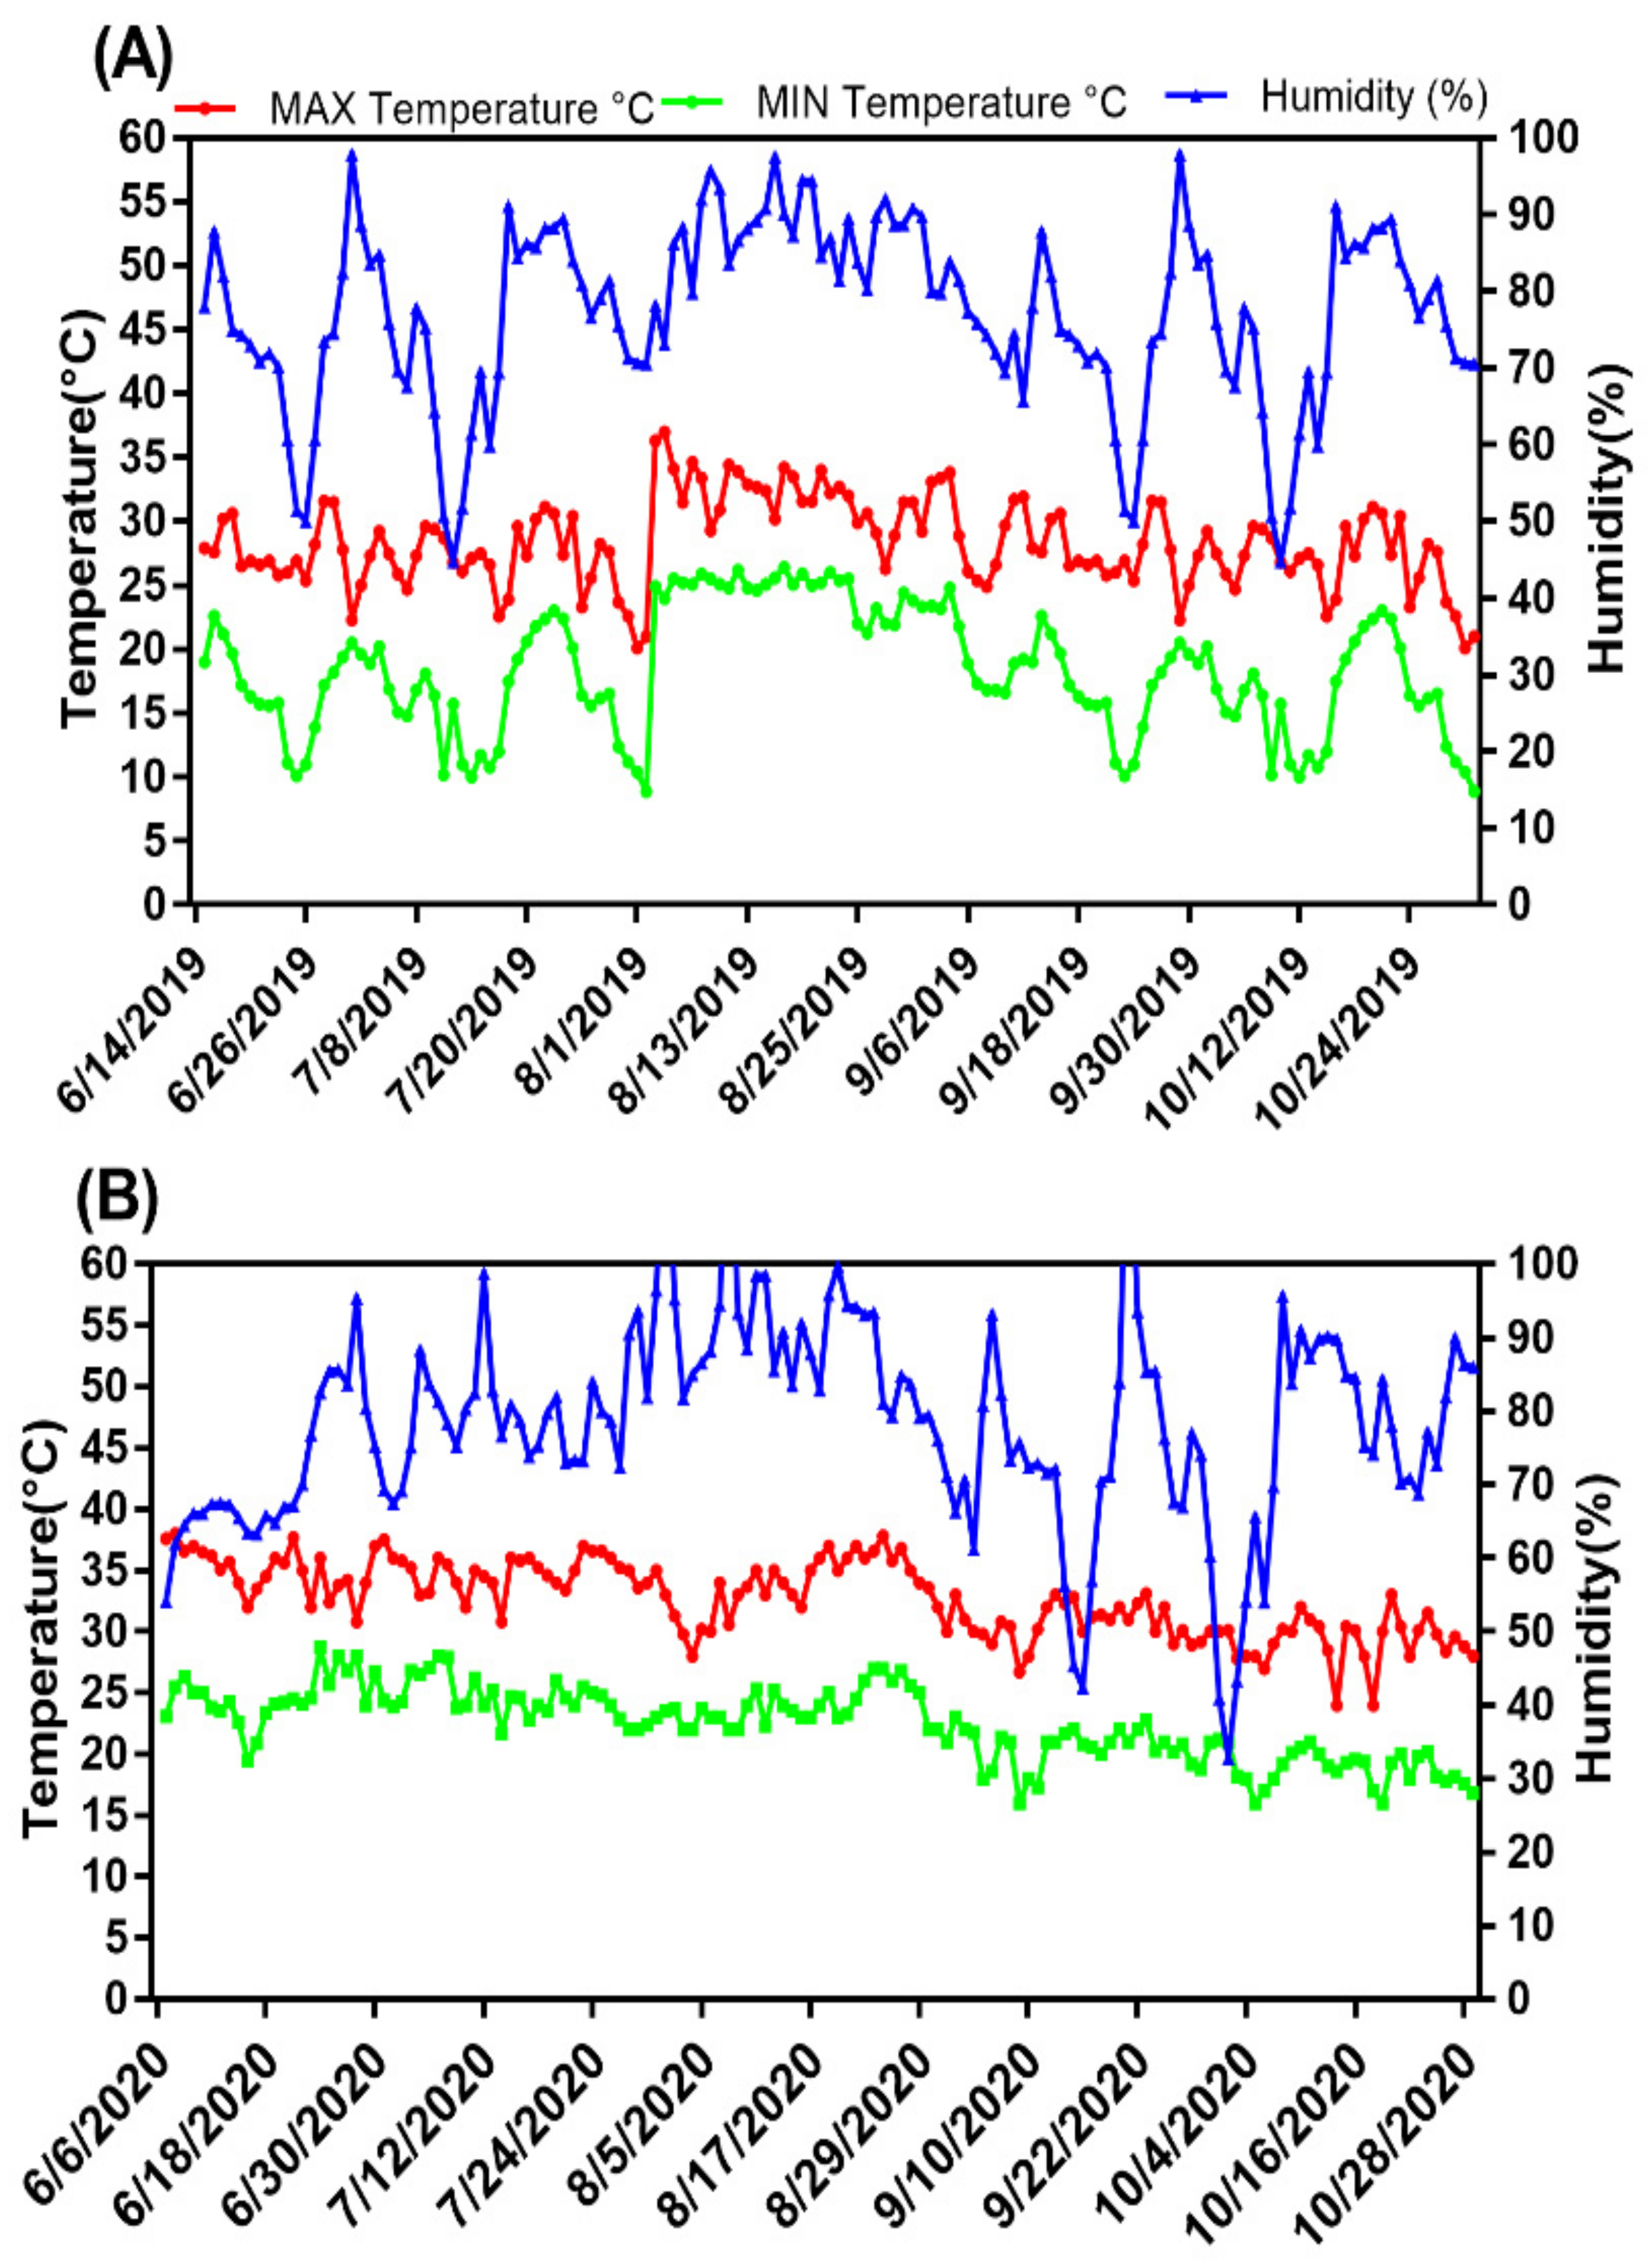
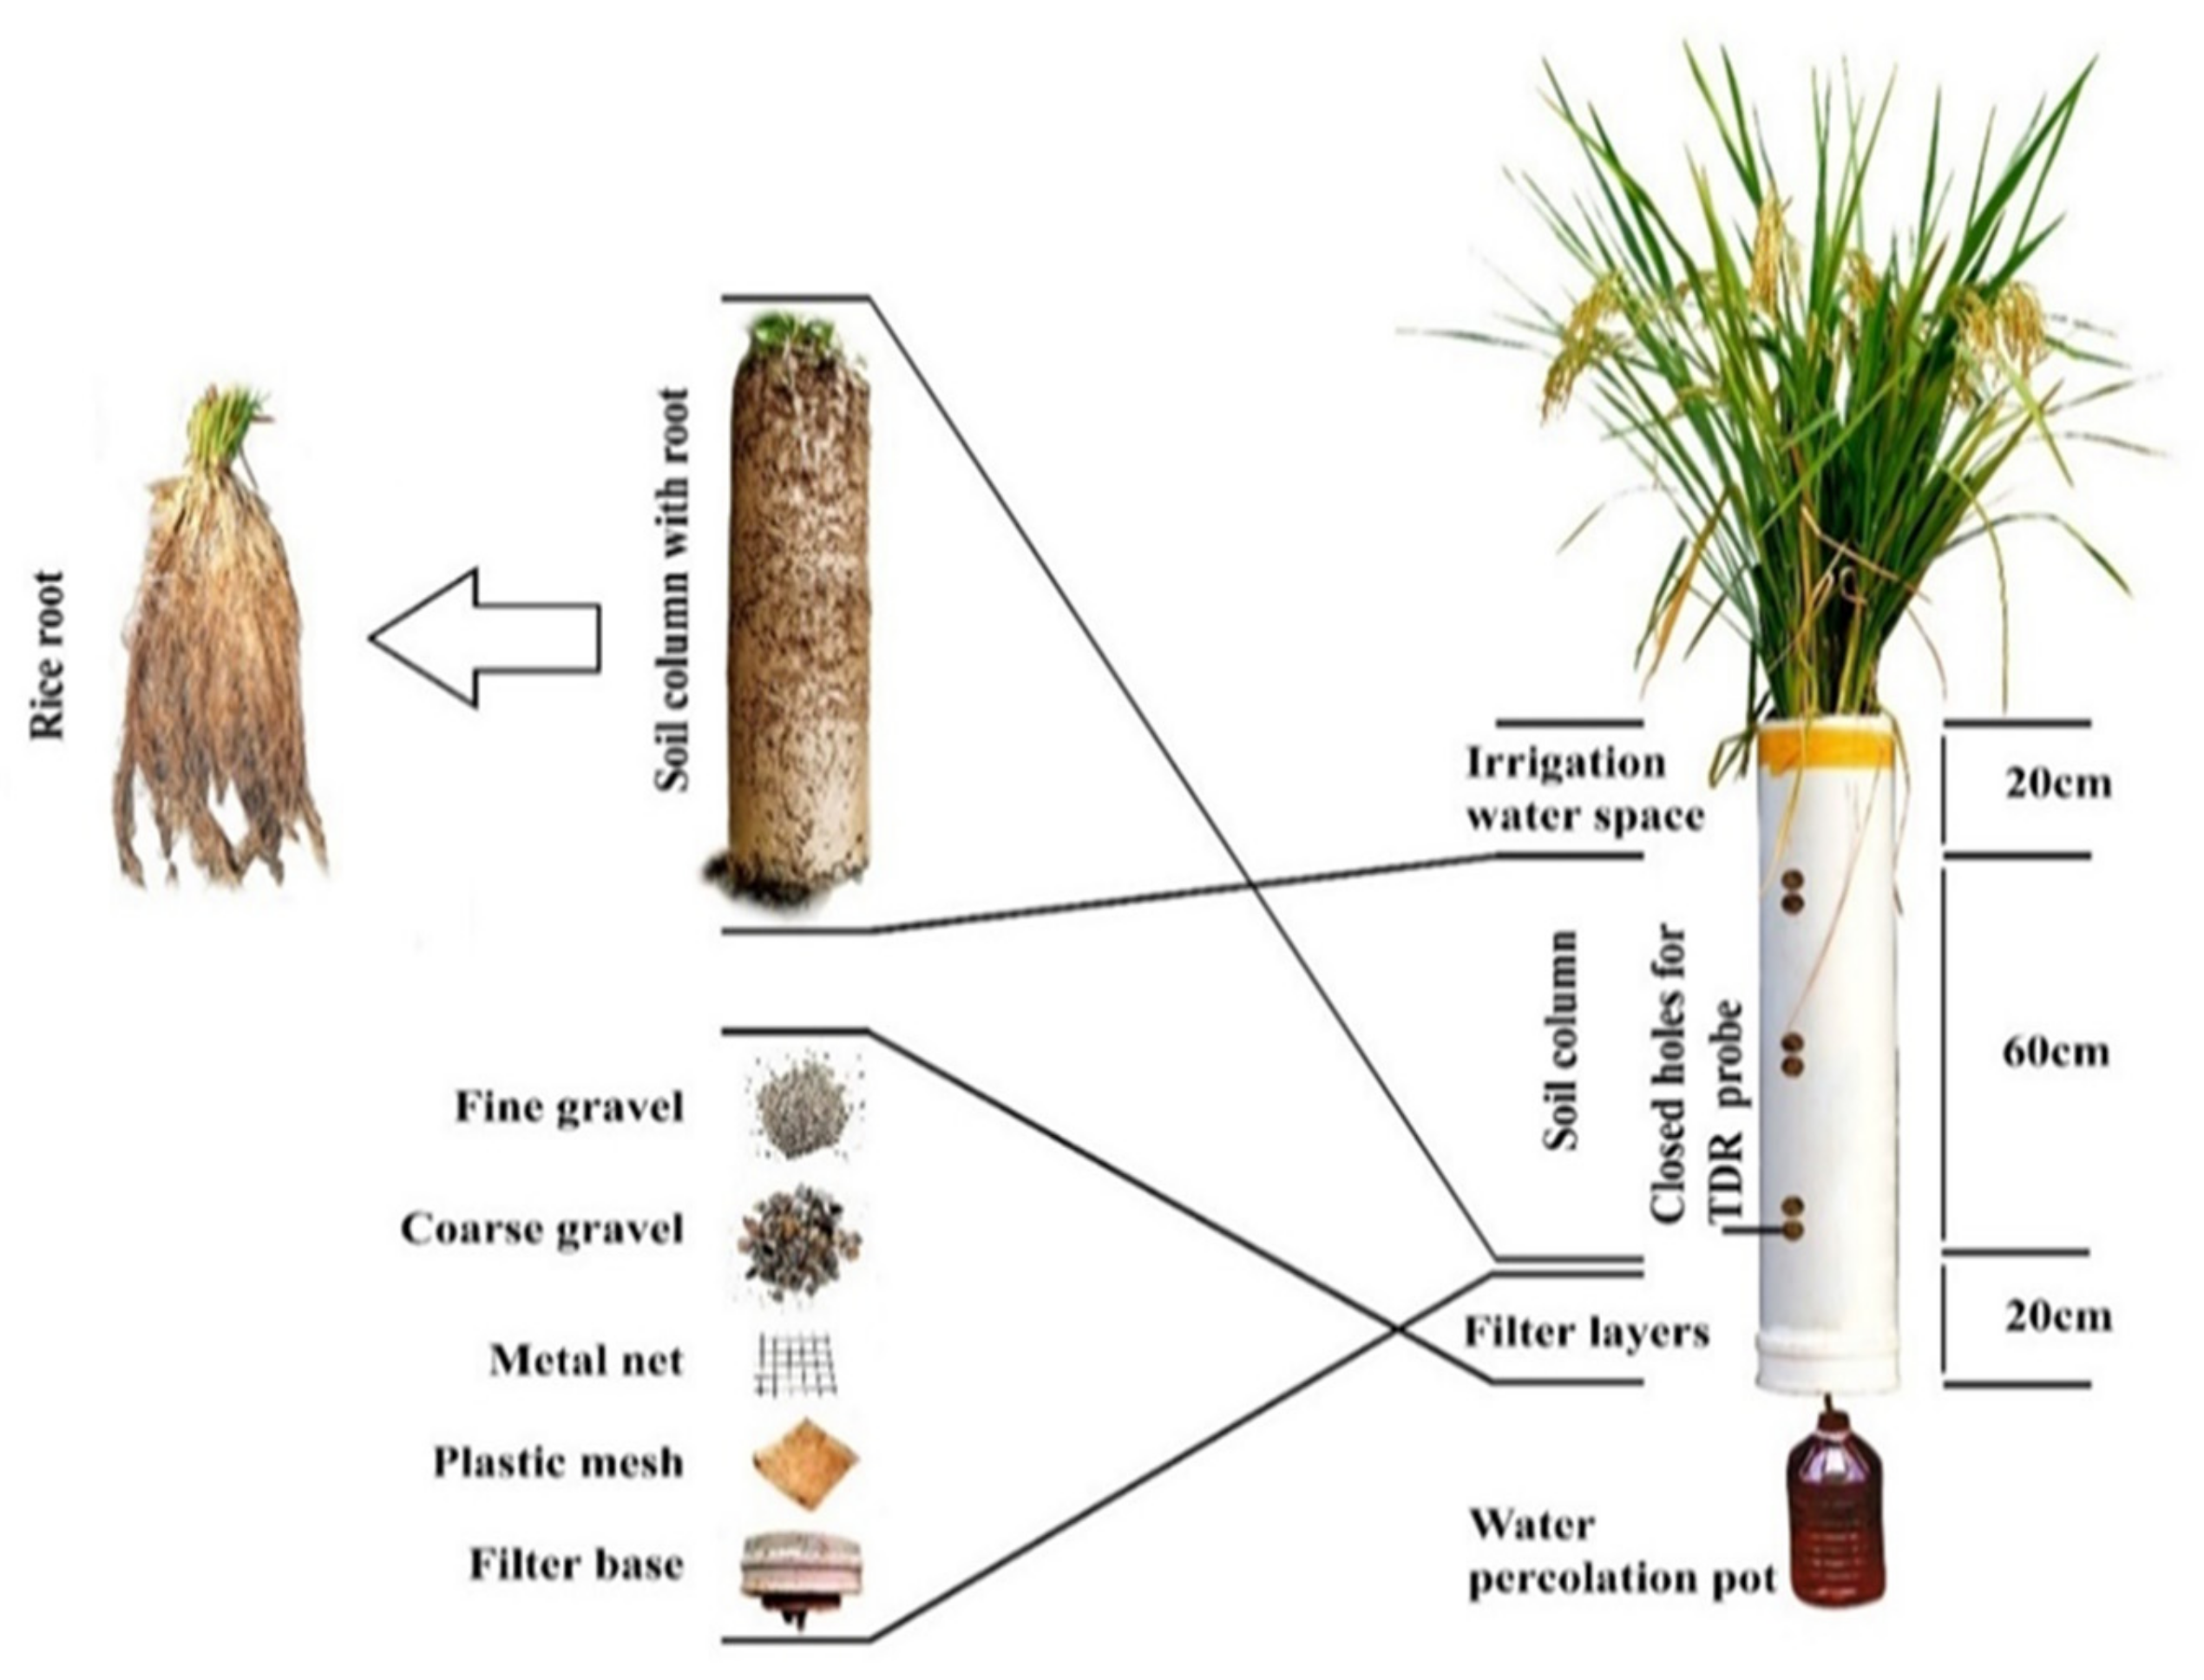
2.1. Experimental Site and Pipe Setup

Three groups of experimental PVC pipes were set under an open-side shelter covered with transparent plastic film at the farm of Guangdong Academy of Agricultural Sciences, located in Guangzhou (23°13′ N, 113°81′ 10” E, altitude 11 m), China. The experimental treatments were applied in both late seasons of 2019 and 2020. The Guangzhou region has a subtropical monsoon climate. The maximum temperature, minimum temperature, and humidity under the shelter were recorded daily as displayed in Figure 1.
Here, 36 PVC pipes (length, 100 cm; diameter, 200 mm) filled with dry loam soil were prepared for two rice seedlings (Oryza sativa L.). A layer of gravel was placed in the first 20 cm of each pipe as a filter, and each pipe was equipped with an opening to allow water to drain (Figure 2). During filling of the pipes and before the addition of any nutrients, soil samples were collected from each pipe, bagged, and sent to a laboratory for soil analysis. The physical and chemical characteristics of the soil are listed in Table 1. To germinate the rice seeds, they were soaked and fully immersed in non-chlorinated water for 36 h at temperatures between 25 and 35 °C. At this time tiny rootlets formed on the seeds, which were then removed from the water and allowed to dry for 24 h. Then, the dried seeds were transferred into a pot filled with rich nutrient soil and flooded for 10 days in a sunny location (water level was maintained at two inches above the soil during germination), after which the rice stalks were monitored until they had grown to about 6 inches in height, then two seedlings were transplanted into each pipe.

2.2. Soil Analysis

The Bouyoucos hydrometer was used to determine the soil texture (TM-85, SHTG, Shanghai, China) [27]. The core sampler technique and the following equations were applied to measure the particle density and soil bulk density:
P D g   cm 3 =   Ws g / Vs cm 3  
B D g   cm 3 = Ws g / V cm 3  
Total soil porosity was utilized to measure the soil moisture content (θs%) at saturation point, and the total porosity of the soil was determined according to Equation (3):
P T % =   1 B D g   cm 3 / P D g   cm 3   × 100
where PD is the particle density, BD is the bulk density, WS is the soil sample weight, V is the soil sample volume, Vs. is the volume of the solid, and PT is total soil porosity.
A calibrated pH meter was used to test the pH of a 1:5 extract of soil and water [28]. Organic matter (OM) was quantified by the oxidation method [29]. A YKM-36 (Shanghai, China) test tube heater was exploited to digest a 2 g soil sample inside a solution containing selenium sulfate and salicylic acid. The temperature was maintained at 100 °C for 30 min and then raised to 380 °C for 3 h [30]. A spectrophotometer was employed to determine the amount of available soil N in each digest (UV1901, Kejie, Nanjing, China) [31,32]. Soil phosphorus was quantified using spectrophotometry, while soil potassium was measured with a flame photometer (FB640 N, Wincom, Hunan, China) [33].

2.3. Experimental Design and Treatments

The experiment was organized in a randomized complete block design constituting a 3 × 3 factorial experiment with two factors (water regime and N fertilizer SRNFs) and three replications. The first factor was the water regime, which included three distinct water management strategies: wetting and soil saturation (WSS), wetting and moderate drying (WMD), and wetting and severe drying (WSD). For WSS, the soil was submerged under 50 mm of water after the soil moisture content reached 100%SP. For WMD, the soil was submerged under 50 mm of water after the soil moisture content reached 90%SP. For WSD, the soil was submerged under 50 mm of water after the soil moisture content reached 70%SP. The second factor was SRNF application, which was tested at 4 levels: without added N fertilizer (N0) (0 mg N kg−1 soil) as a control treatment, light nitrogen (NL) application (100 mg N kg−1 soil), moderate nitrogen (NM) application (200 mg N kg−1 soil), and heavy nitrogen (NH) application (350 mg N kg−1 soil). The SRNF was sulfur-coated urea provided by Taian Guangyuan International Trade Co., Ltd, (Jinan, China). (37% N, 17% S, theoretical release longevity >120 days, 37% mass fraction of total nitrogen, initial nutrient release rate ≤27, static nitrogen dissolution rate ≤45).
Accordingly, 36 experimental pipes (3 irrigation regimes × 4 fertilizer levels × 3 replicates) were set up under a shelter tunnel. Nutrient-free freshwater was utilized throughout the experiment. The volume of water supplied to the soil to achieve the specified limit was determined using the following equation [21]:
I =   M + SWC AWC ×   DSM / A × 1000
where I is the irrigation water (mm), M is the volume of immersion water (mm; constant for all treatments), SWC is the soil water content on saturation point (%; constant for all treatments), AWC is the actual water of the soil when irrigating (%), and DSM is the dry soil mass (kg; constant for all treatments).
The area covered by the soil in the cylindrical pipe was calculated using the following equation:
A = 3.14 × ( D / 2 ) 2
where A is the area of the pipe and D is the inner diameter of the pipe (mm).
The actual volumetric soil water content was determined using an HD2 precise moisture measurement TDR instrument by IMKO, Germany, after calibrating the device.

2.4. Data Collection

2.4.1. Chemical Characteristics of the Soil in the Root Zone

At the ripening stage, soil samples were taken from the root zone with sampling sippers. A calibrated pH meter was applied to determine the soil pH [28], the soil redox potential (Eh) of the soil was established using a portable redox potential meter, and available forms of N in the rhizosphere soil were determined according to the methods described in Section 2.2.

2.4.2. Measurement of Plant Sampling and Yield Indicators

The numbers of tillers and panicles, as well as the length of panicles, were recorded throughout the heading and grain filling stages. At the end of the maturity stage, the plants were hand-harvested and weighed and the data were recorded. The grains were separated from the straw and packaged individually in paper bags before being dried in an oven set to 75 °C for three days. Dried samples were weighed and processed into powder form to detect nutrient concentrations in plant tissues and grains [34].

2.4.3. Root Growth Measurements

Total root mass was obtained by washing the soil carefully with water to remove all debris. Roots were centrifuged according to Cavalca et al. (2010) [35] and weighed to obtain root fresh weight (RFW) values. Roots were sub-sampled and oven-dried at 75 °C for 72 h. The RDW was estimated by deducting the moisture content of the root from root fresh weight. The root-to-shoot ratio was calculated by dividing the root dry weight by shoot dry weight and multiplying it by one hundred. The total root length (RL) was estimated using the line intersection method described by [36]. The root volume was also measured using the water displacement method [37]. The root length density (RLD) (mm cm−3) was calculated as shown in Equation (6), the root weight density (RWD) (g cm−3) was calculated using Equation (7), the specific root length (SRL) (m/g) was calculated using Equation (8), and the total surface area (TSA) (m2) and root diameter (RD) (mm) were calculated using Equation (9). All the equations used were recommended by Hamoud et al. (2019b) [14]:
RLD =   RL / V
RWD = RDW / V
SRL = RL / RDW
RD =   RDW / RL * π 0.5
where RL is the root length (cm), V is the soil core volume (cm3), and RDW is the root dry weight (g).
However, Barber (1995) [38] suggested that if fresh roots are cylindrical and have a density of 1.0 g cm−3, then the mean radius of the roots (r0) and total surface area TSA can be determined using Equations (10) and (11), respectively:
r 0 =   RFW / RL * π 0.5
TSA = 2 × π × r 0 × RL
where RFW is the root fresh weight (g). The root active adsorption area (AAA) values of fresh root samples were estimated using the methylene blue dyeing method [39].

2.4.4. Plant Tissues N Concentrations Measurements and the Amount of Nutrient Removed by the Crop

Oven-dried (75 °C for 72 h) tissues of grain, straw, and roots were used to determine N concentrations. Three wet-ashing digestion sets were prepared. Each set contained 36 digestion tubes, with each tube containing 0.5 g of powder from each plant component. Here, 1 g of selenium reagent mixture and 10 mL of concentrated sulfuric acid were added to the tube, as used by [30]. The indophenol blue method was used for N estimation in plants tissues as proposed by Novamsky et al. (1974) [40], while the moisture content in the plant tissues was measured by taking 2 g of the subsample powder for grains and straw, which was oven-dried at 75 °C for 72 h. The moisture content (%) was determined by reweighing the sample to calculate the amount of water lost. According to Hamoud et al. (2019a) [21], the following equations can be used to calculate the amount of N removed with the crop:
Ñ CR = Ñ AG + Ñ AS = Ñ CG % × DWG / 100 + Ñ CS % × DWS / 100
where ÑCR is the nitrogen crop removal (mg hill−1), ÑAG is the nitrogen accumulation in grain (mg hill−1), ÑAS is the nitrogen accumulation in straw (mg hill−1), ÑCG is the nitrogen content in the grain (%), DWG is the dry weight of the grain (g), ÑCS is the nitrogen content in the straw (%), and DWS is the dry weight of the straw (g).

2.4.5. Transmission Electron Microscopy Observation

The ultrastructure changes in the leaf cell mesophyll were detected as described by Oi et al. (2017) and Sheteiwy et al. (2019) [41,42]. Rice leaf blades were fixed chemically by applying the method for conventional TEM observation, embedded in resin, and subsequently set in the FIB-SEM chamber. The sectioning and imaging were repeated overnight for 200–500 slices with 50 nm thickness. The resultant large-volume image stacks at (x = 25 μm, y = 25 μm, z = 10–25 μm) contained one or two whole mesophyll cells.

2.4.6. Determination of the NUE

The NUE was estimated in rice growth as the relation of the crop N uptake to the total applied or available soil N fertilizer. Accordingly, the amount of N accumulation in plant tissues, nitrogen agronomic efficiency (NAE), nitrogen apparent recovery efficiency (NARE), nitrogen partial factor productivity (NPFP), and nitrogen harvest index (NHI) were calculated using the following equations recommended by [19,43].
NAE = Yn Y 0 / Fn  
NARE = Un U 0 / Fn
NPFP = Yn / Fn
NHI = Ng / Un
where Fn is the amount of nitrogen fertilizer applied (kg ha−1), Yn is the crop yield with applied N (kg ha−1), Y0 is the crop yield (kg ha−1) in a control treatment with no N, Un is the total plant N uptake in aboveground biomass at maturity (kg ha−1) in a plot that received N, U0 is the total N uptake in aboveground biomass at maturity (kg ha−1) in the treatment that received no N, and Ng is the uptake in grain.

2.5. Statistical Analysis

The statistical program SPSS (IBM-SPSS,19, USA) was adopted to statistically analyze experimental data. To conduct a variance analysis, a general linear model approach was utilized with two-way ANOVA (p ≤ 0.05). Duncan’s multiple range test at the 0.05 level was applied to compare the mean values. The results from this analysis are represented in the tables.

3. Results

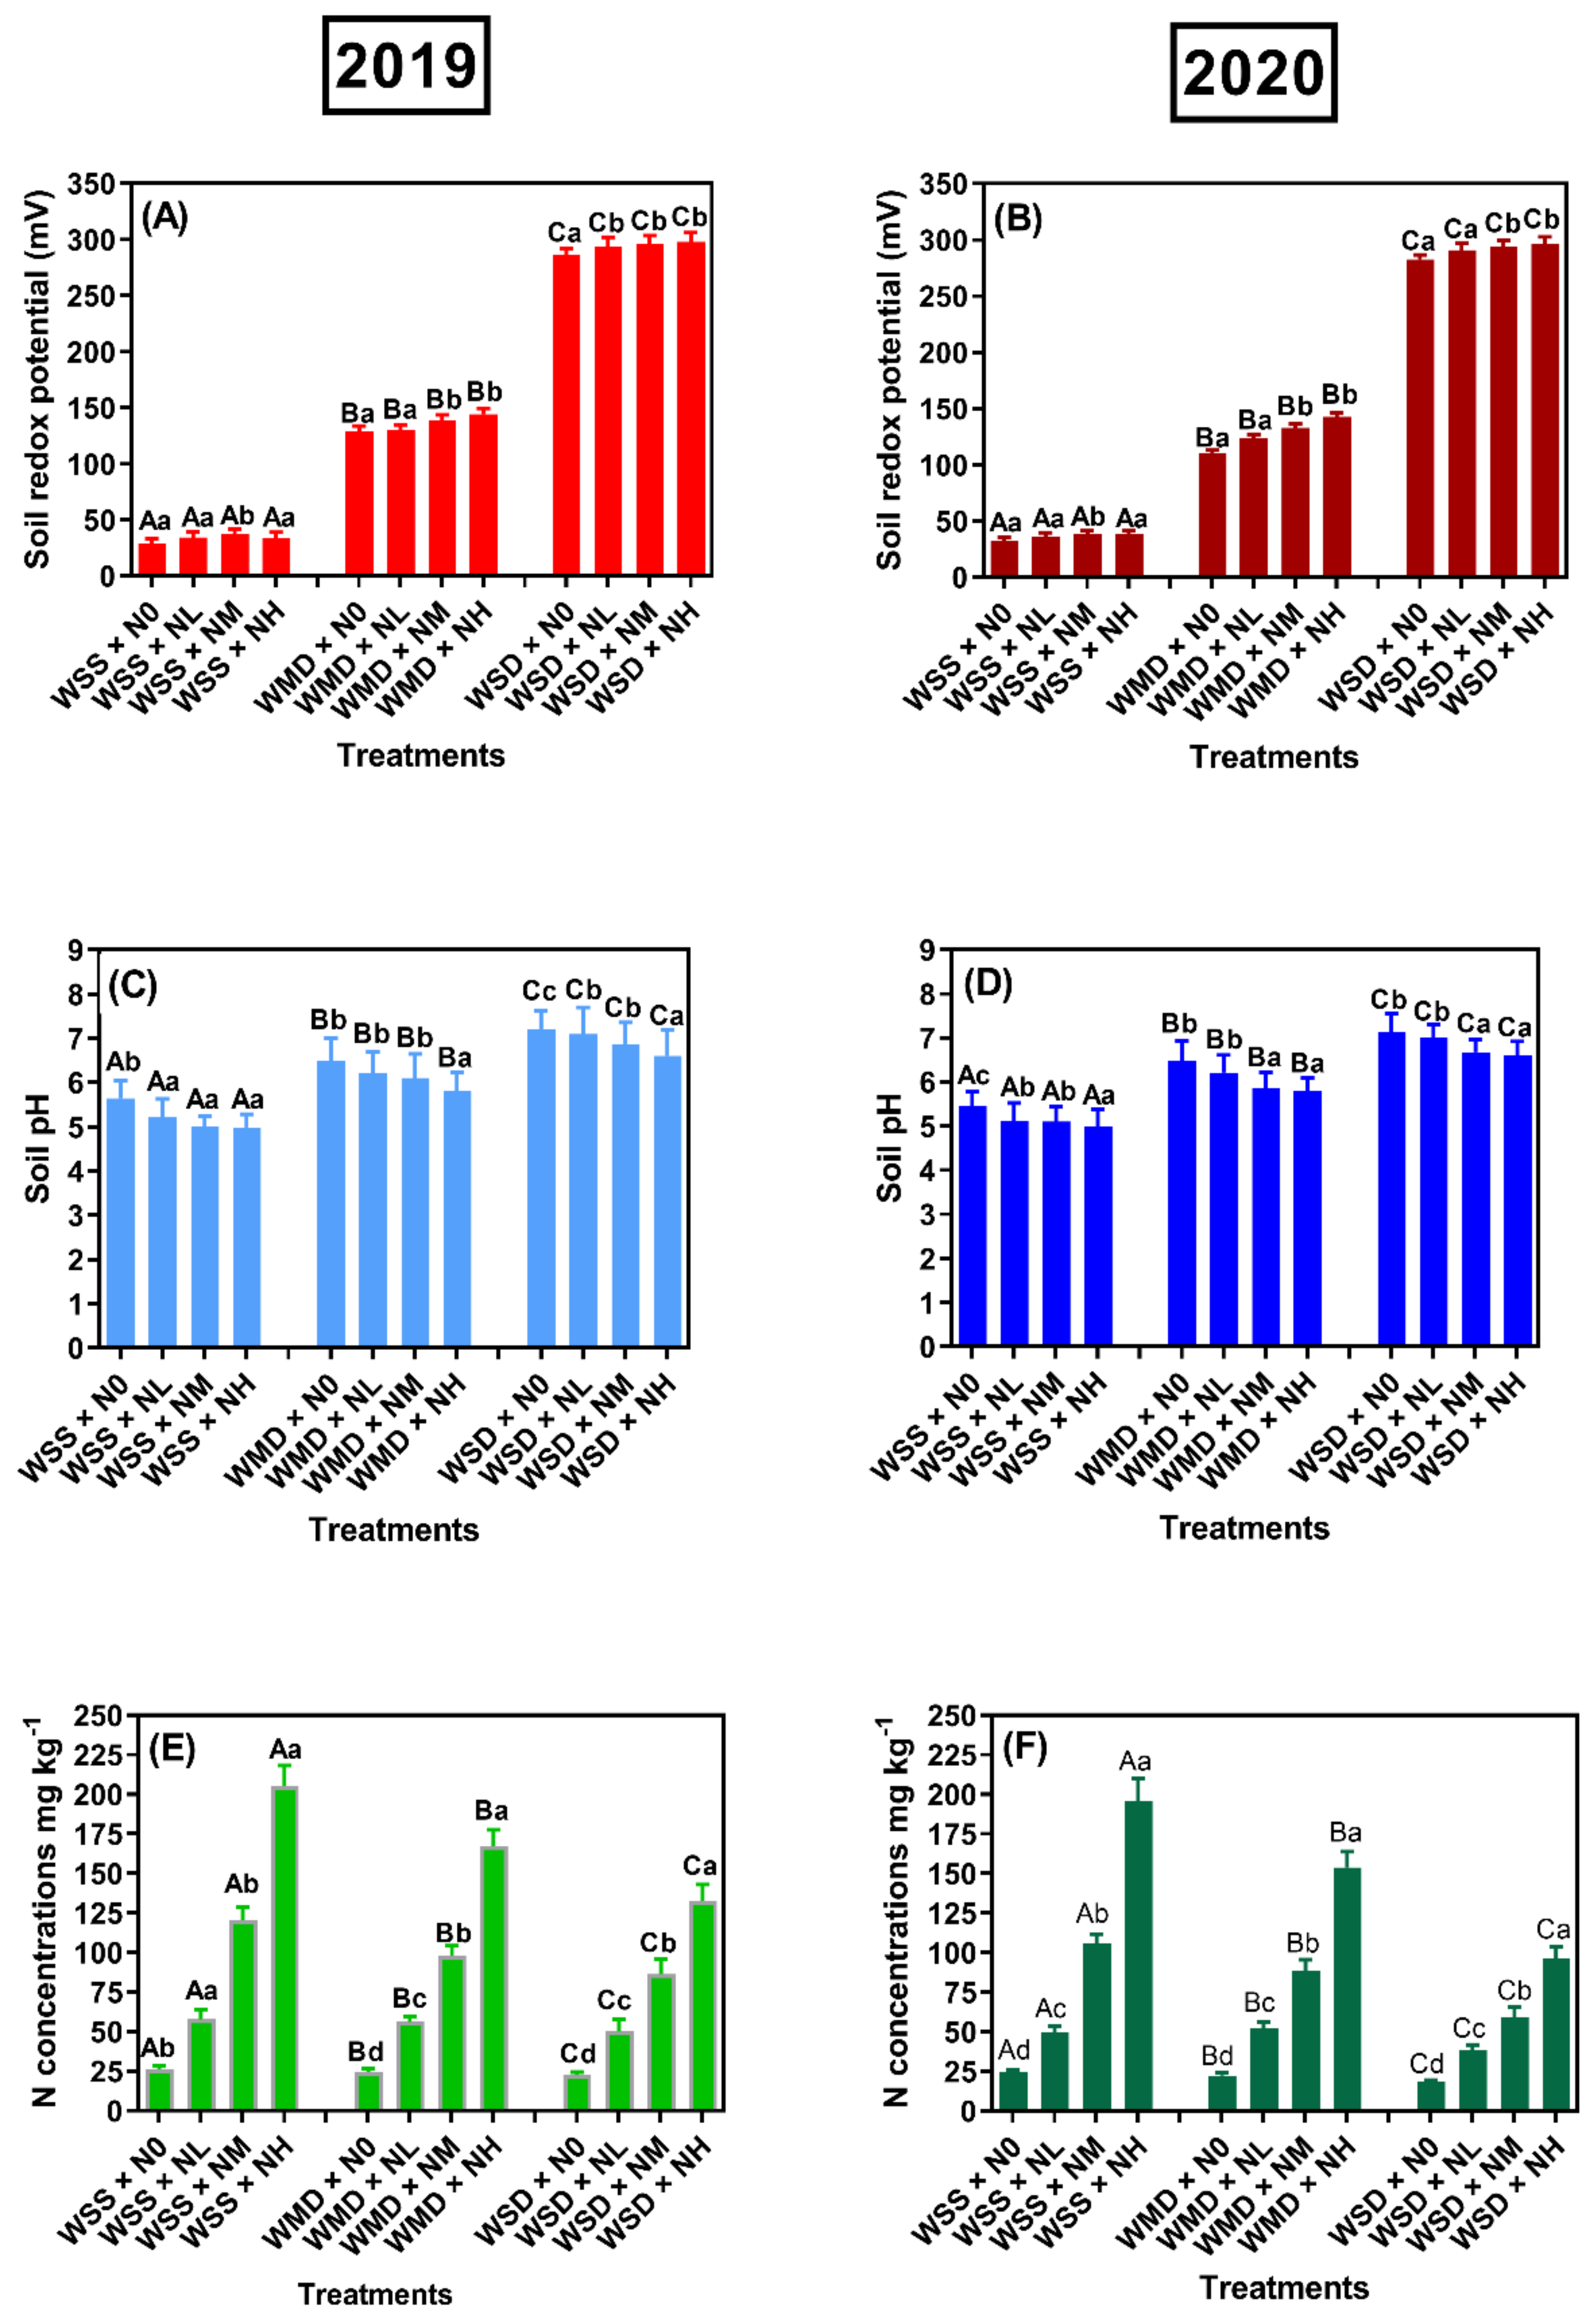
3.1. Effects of SRNF on the Environmental Chemical Parameters of Soil in the Root Zone under Different AWD Regimes

Under each fertilizer treatment, increasing the soil water content (WSD to WMD to WSS) resulted in substantial decreases in the soil Eh and soil pH, while the soil-available N in the root zone was significantly increased. For the control treatment, increasing the soil water content decreased the soil Eh (286, 129, and 28 mV) and soil pH (7, 6.5, and 5.6), while increasing the soil-available N (22, 24, and 26 mg kg−1) in the 2019 season. Similarly, in the 2020 cropping season, increasing the soil water content decreased the soil Eh (282, 110, and 32 mV) and soil pH (7.1, 6.5, and 5.4), while the soil-available N content in the rhizosphere gradually increased (18.6, 22.4, and 24.5 mg kg−1). Under the same irrigation treatment, increasing the SNFR application (N0, NL, NM, and NH) enhanced the soil-available N concentration in the root zone in the 2019 (26, 57, 120, and 205 mg kg−1) and 2020 (24, 49, 105, and 195 mg kg−1) cropping seasons. In 2019 and 2020, the WSS × NH combination produced the lowest soil Eh values (34 and 38 mV) and the greatest available N contents in the root zone (205 and 195 mg kg−1), whereas the WSD × N0 combination produced the highest soil Eh values (286 and 282 mV) and the lowest soil-available N contents (26 and 24 mg kg−1) (Figure 3).

3.2. Effects of SRNF Application on Rice Root Morphology under Different AWD Regimes

The morphological characteristics of rice roots varied significantly according to watering mode, SRNF application rate, and their interactions (Table 2). For each SRNF application rate, the RWD, RLD, TSA, and RDW were enhanced significantly (p ≤ 0.001) as the soil water content increased (WSD to WMD to WSS). For each watering method, increasing the N fertilizer rate generally enhanced the RWD, RLD, TSA, and RDW of rice roots; the NH group had the highest values, followed by the NM and ML groups, while the N0 group had the lowest values. Due to the integration of treatments, the WSS × NH treatment produced the largest values of RWD (0.78 g cm−3 and 0.83 g cm−3), RLD (12.98 mm cm−1 and 13.38 mm cm−1), TSA (95.86 m2 hill−1 and 98.78 m2 hill−1), and RDW (9.81 g hill−1 and 10.37 g hill−1) for the 2019 and 2020 cropping seasons. However, the WSD × N0 treatment produced the lowest values of RWD (0.48 g cm−3 and 0.51 g cm−3), RLD (5.32 mm cm−1 and 7.25 mm cm−1), TSA (58.39 m2 hill−1 and 56.44 m2 hill−1), and RDW (6.00 g hill−1 and 6.4 g hill−1) for the 2019 and 2020 cropping seasons (Table 2).

3.3. Effects of SRNF Application on Rice Biomass and Yield Indicators under Different AWD Regimes

Rice biomass and grain production were affected by N and water stress. The irrigation methods, N fertilizer rates, and their interactions significantly affected rice biomass and grain production, as presented in Table 3. Rice biomass and yield were improved when the soil water content was increased (WSD to WMD to WSS), while the fertilizer application rate was unchanged. Moreover, for each irrigation method, the N0 group produced the least rice biomass, followed by the NL and NM groups, while the NH group produced the greatest rice biomass. Similarly, the number of panicles, panicle length, grain filling rate, grain yield, and total biomass increased significantly (p ≤ 0.05) as the soil water content and N fertilizer rate increased, and the WSS × NH combination produced the maximum observed values in 2019 and 2020 (38 and 41 panicle hill−1, 24.16 and 25.7 cm, 90.6% and 91.35%, 90.7 and 112.1 g hill−1, and 185.4 and 242.23 g hill−1, respectively). In 2019 and 2020, the WSD × N0 combination produced the minimum respective values in terms of number of panicles (21 and 23.7 panicles hill−1), panicle length (14.05 and 16 cm), grain filling rate (63.2% and 65.05%), grain yield (34.7 and 40.47 g hill−1), and total biomass (65.5 and 65.71 g hill−1) (Table 3).

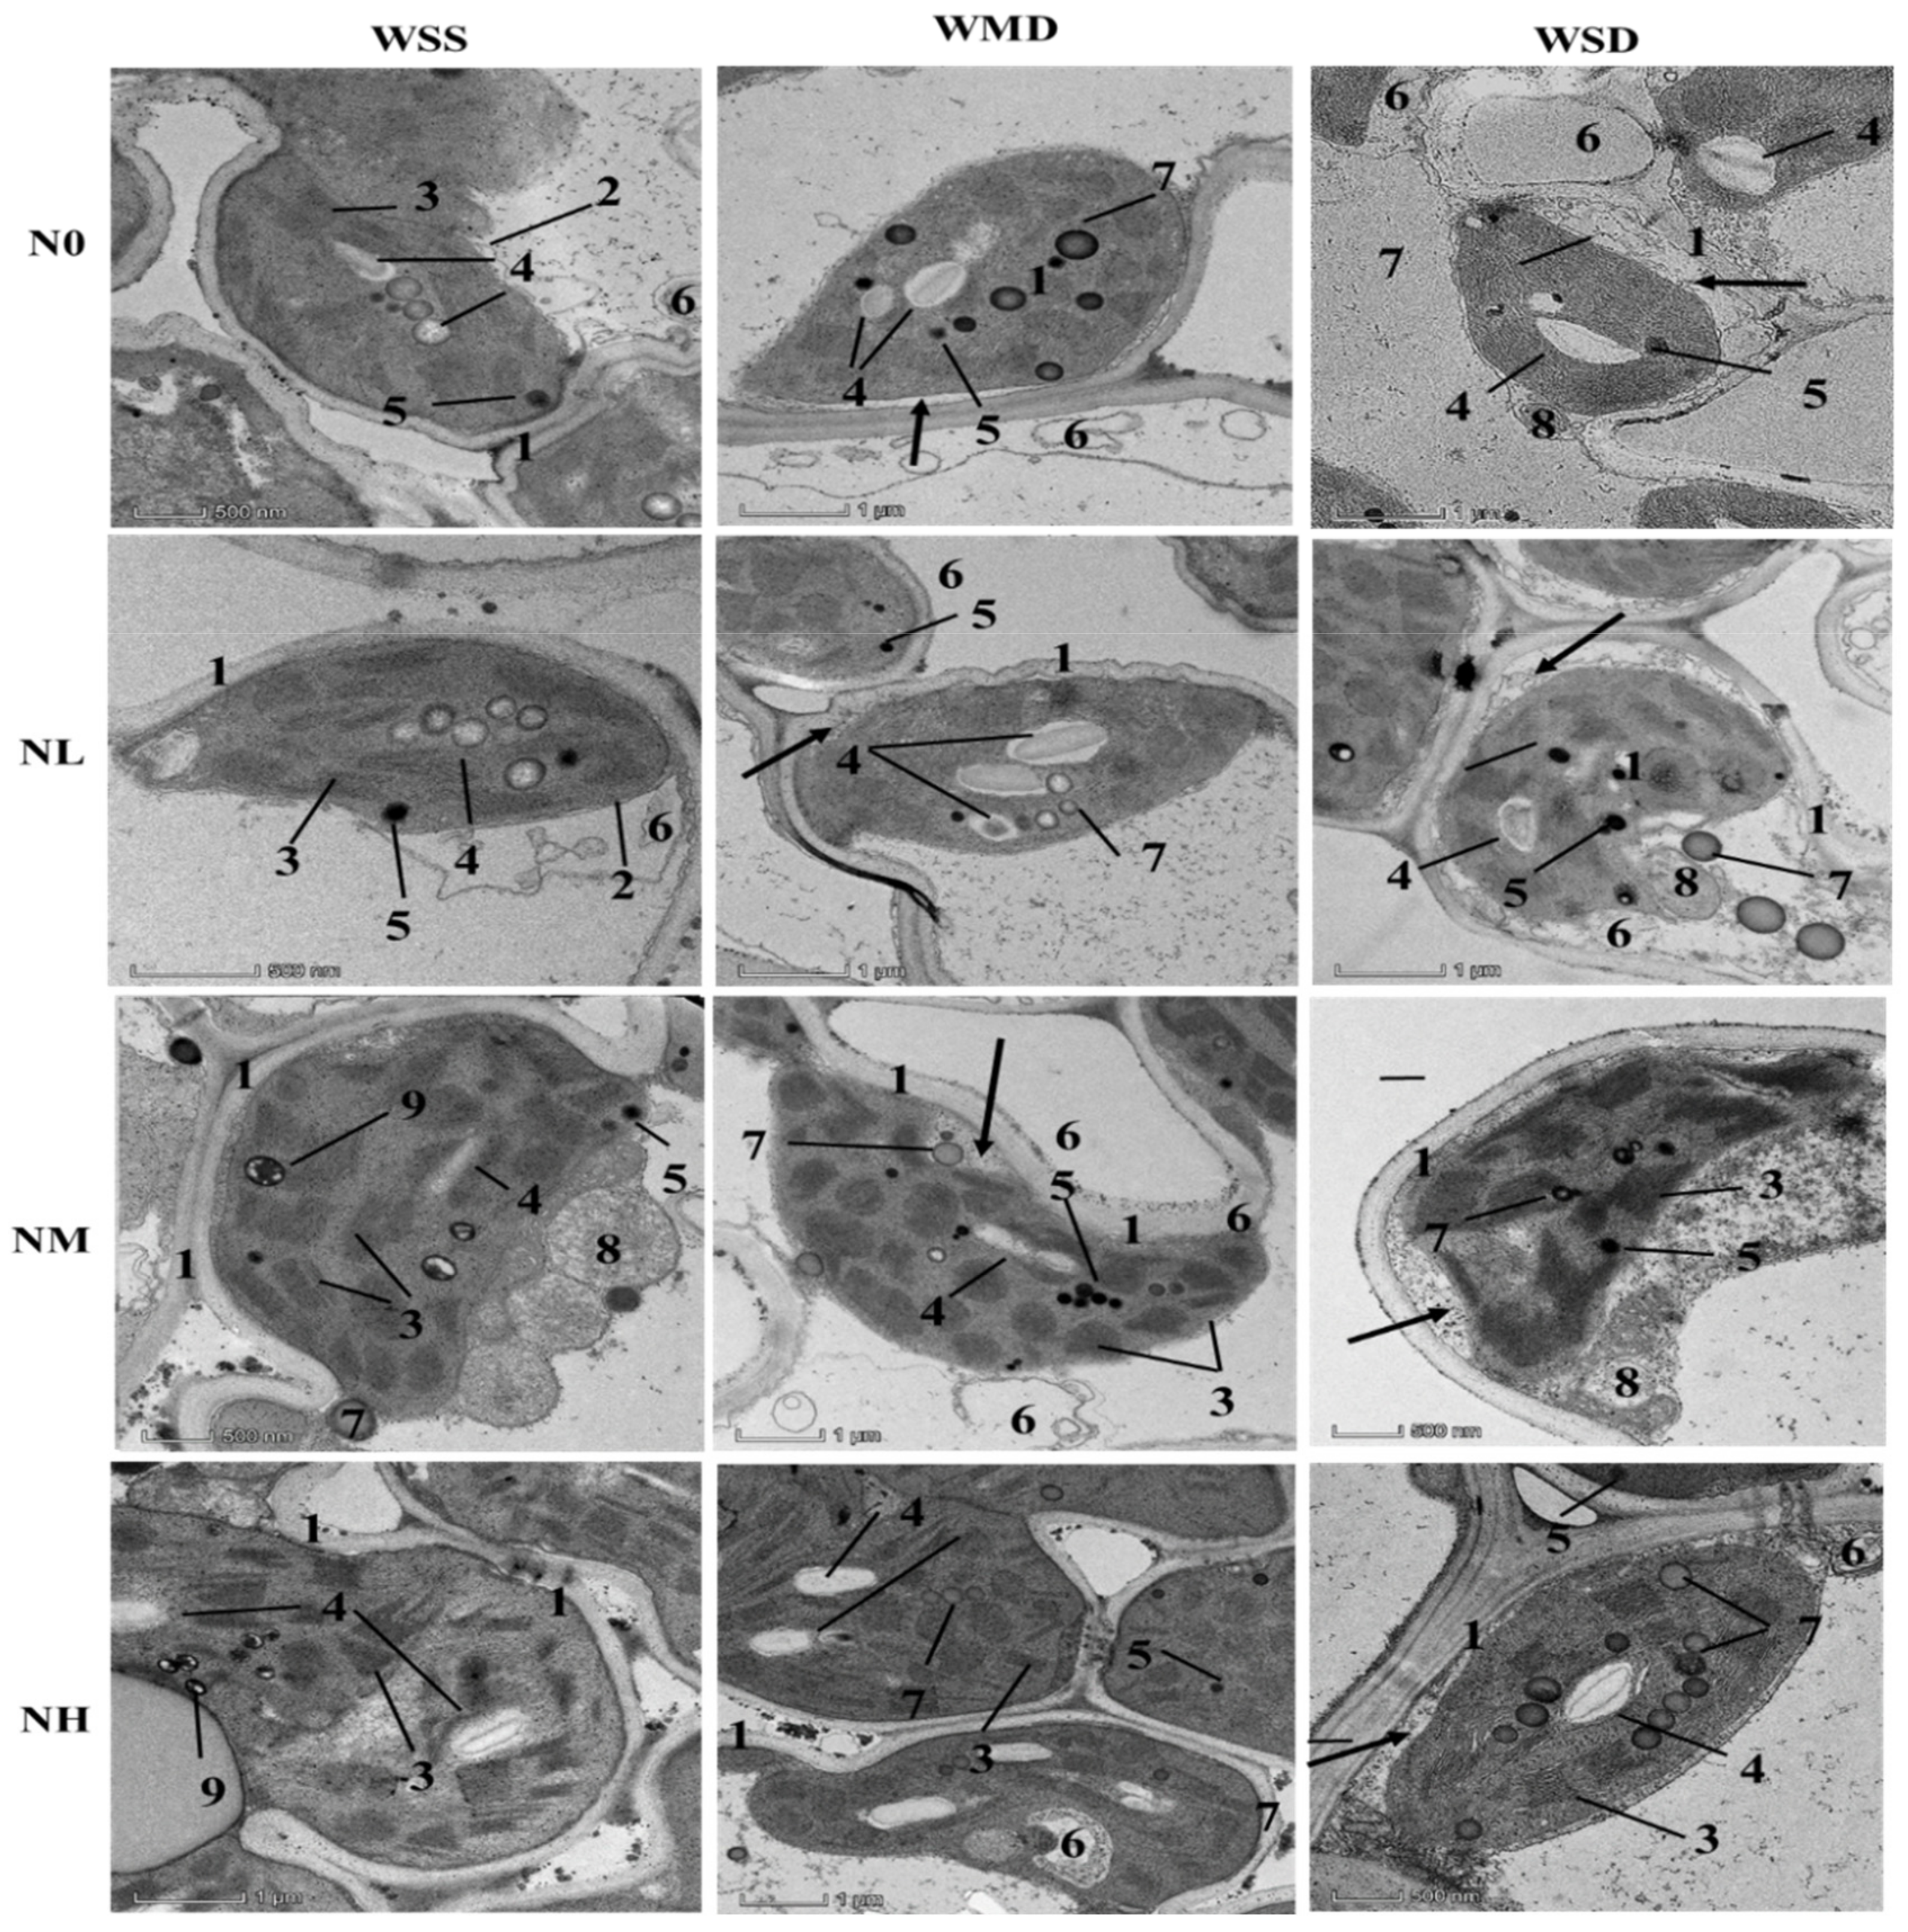
3.4. Effects of SRNF Application on Leaf Mesophyll Cell Ultrastructure under Different AWD Regimes

As shown in Figure 4, the high and medium N fertilizer rates with the WSS regime improved the leaf mesophyll structure; the TEM images showed normal starch grains, clear cell walls, and well-developed chloroplasts with tidy and well-arranged thylakoids. However, the leaf mesophyll structures of plants grown under the WMD and WSD regimes, as well as those subjected to the N0 and NL fertilizer rates, were undeveloped. The plants subjected to low N fertilizer rates and water stress had fewer starch grains, weaker cell walls, large numbers of vacuoles, and decreased mesophyll lipid contents.

3.5. Effects of SRNF Application on N Tissue Concentration and N Uptake under Different AWD Regimes

The N tissue contents of rice plants grown using different irrigation methods increased as the SRNF application rate was increased (Table 4). The NL, NM, and NH groups showed increased N concentrations in different parts of the plant in comparison with the N0 group under each irrigation method. The WSS group had the highest N concentrations in grain and straw, followed by the WMD group, while the WSD group had the lowest concentrations (Table 4). In 2019 and 2020, the WSS × NH combination produced the highest respective mean N concentrations in grain (2.32% and 2.43%) and straw (0.79% and 1.07%), whereas the WSD × N0 combination produced the lowest respective mean N concentrations in grain (0.40% and 0.66%) and straw (0.22% and 0.46%) (Table 4).

3.6. Effects of SRNF Application on NUE under Different AWD Regimes

Changes in N uptake associated with different irrigation methods, SRNF application rates, and their interactions had a great impact on rice growth and development. The irrigation method affected N accumulation in the straw and grain, as well as plant uptake of N. The N accumulation and N plant uptake in grain and straw were highest in the WSS group, followed by the WMD group, while the WSD group showed the lowest values; similarly, the N accumulation and N plant uptake rates in grain and straw for the SRNF application groups were ranked as follows: NH > NM > NL > N0. In the analysis of the interactions between irrigation regimes and N fertilizer rates, the highest N accumulation rates in grain were in the WSS ×NH treatment at 1919.7 mg hill−1 in 2019 and 1953.27 mg hill−1 in 2020, whereas in straw the rates were 714.7 mg hill−1 in 2019 and 953.95 mg hill−1 in 2020. The WSS × NH treatment produced the highest N plant uptake rates in 2019 (2634.2 mg hill−1) and 2020 (2907.22 mg hill−1). In 2019 and 2020, the WSD × N0 treatment produced the lowest values of N accumulation in grain (147.9 mg hill−1 and 244.27 mg hill−1) and straw (115.3 mg hill−1 and 172.1 mg hill−1), as well as low N plant uptake values (263.1 mg hill−1 and 416.38 mg hill−1, respectively) (Table 4).
The irrigation regimes and SRNF treatments significantly affected the NUE values of rice. In 2019 and 2020, the WSS and WMD treatments increased the NAE (maximum values of 37.3% and 39.5%), NARE (maximum values of 63.1% and 67.61%), NPFP (maximum values of 39.8 g g−1 and 41.13 g g−1), NHI (maximum values of 76.6% and 77.43%), total biomass, and grain yield values. In 2019 and 2020, the WSD treatment produced reductions in NAE (14.7% and 14.87%), NARE (26.7% and 28.65%), NPFP (16.4 g g−1 and 17.13 g g−1), and NHI (61.3% and 63.13%) (Table 5).

4. Discussion

Eh and pH substantially impact nutrient availability and mobility in the root zone [44], while the soil water content and soil constituents with large amplitude redox numbers, such as N, P, or S, affect Eh and pH [45]. In the present study, the results showed significant differences in soil pH, Eh, and available soil N contents between the treatments. WSS improved soil Eh and enhanced N absorption by the roots, which was in accordance with the results of previous studies [46]. The results also showed that the average soil pH following WWS was 5.6 (Figure 3C,D), which was within the range of optimal soil pH for rice cultivation [47,48]. A previous study reported that decreasing the rhizosphere pH and boosting the availability of N to the plant enhanced root development [14]. Therefore, roots under the WSS conditions may reduce the rhizosphere pH by creating H+ via oxidation of Fe++ to balance the excess cations for plant uptake [49]. Consequently, soil Eh and pH have the potential to optimize rice productivity because pH regulates the activities of macro- and micronutrients, poisons, and reducing agents in soil solution. The highest amounts of N observed in the WSS × NH treatment during the growing season can be attributed to the acidification of the rhizosphere and the high soil moisture content, which stimulated the release of available nutrients, causing SRNFs to discharge large amounts of N into the soil [29,44].
A previous study found that CF enhanced the acidification of the rice root zone and stimulated N solubilization [50]. In contrast, the WSD treatment in this study reduced the soil nutrient availability, in agreement with previous studies [51,52], showing that increasing the soil pH affects the SRNF solubility, resulting in a significant decline in the soil N concentration. Fluctuations in soil conditions due to the transition between aeration and immersion alter the biogeochemical processes of the soil and influence nutrient availability to crops [53]. In this study, changes in biogeochemical processes in the soil due to the watering regime affected N uptake by rice roots.
This study also revealed that the root morphology was affected significantly by the water regime and SRNF application rate. However, the root morphology was enhanced under WSS and the combination of WSS × NH, which generated massive TSA, revealing an abundance of accessible available N to support strong root development. These findings are in accordance with previous studies [54,55]. As shown in Table 2, the greatest RWD, RLD, TSA and, RDW were produced by the WSS × NH combination as a result of the regular release of a large amount of N ions during rice growth, thereby improving root N uptake and producing large root systems and huge shoot biomass. These results corroborated previous reports [56,57] that SRNFs release N slowly according to the available soil moisture and the rhizosphere pH, thereby increasing the availability of soil nutrients and improving the morphological characteristics of rice roots. The scarcity of N under WSD with different rates of SRNF application (due to the low level of soil moisture) reduced the growth and TSA of rice roots. Water stress can affect the morphology and physiology of roots, causing a reduction in plant growth and hindering development due to nutrient pathways being altered [58,59]. In addition, water stress affects root penetration, which may inhibit rice root formation [60]. Additionally, the rice root morphology was significantly different under AWD conditions compared to CF conditions [61]. This study revealed that the root total surface area was increased significantly under the WSS × NH treatment compared to the WSS ×N0, WSS × NL, and WSS × NM treatments, because the WSS × NH treatment increased the available N during rice growth. Furthermore, increasing the contact between rice roots and soil enhances water and nutrient absorption and improves root morphological traits. CF conditions cause the rice aerenchyma to form root extensions that ensure effective root–soil contact and allow oxygen delivery from the shoots to the roots [61,62]. According to a previous study [63], oxygen enhances root cell growth and development, and this effect explains the increased dry mass of the roots in the WSS plants. This finding is in agreement with previous studies showing that rice plants develop strong roots and transport large quantities of O2 from shoots to roots via the aerenchyma [64,65]. Our results indicated that the WSS and WSS × NH treatments increased nutrient absorption, resulting in high rice shoot biomass formation. The findings of the present study also revealed that morphological characteristics of rice roots, such as RWD, RLD, TSA, and RDW, affect N absorption from the lower layers of the soil and alter the amount of soil accessed by the plant roots. However, rice growth under WSD treatment conditions produced minimal root growth due to excessive aeration in the soil. According to a previous study [64], soil fractures may cause root damage due to water stress, even when roots are adequately ventilated. These outcomes were in agreement with previous studies [55,66] reporting that water stress in rice paddy lands stimulated oxygen flow from the shoots to the roots, which resulted in a decrease in the dry mass of roots and generally lower root parameters (RWD, RLD, TSA, and RDW). As shown in Table 3, the total rice biomass and yield increased with the available soil water content (AWC) under the WSS treatment, and SRNF application released an adequate amount of soluble N for rice growth under the WSS × NH treatment. These results confirm that the effects of N release on rice growth and yield optimization are usually affected by the volume of water available in the soil. In addition, these findings confirm the results of previous reports on the effects of controlled-release fertilizer on the growth and yield of rice [55,67].
As shown in Table 3, rice cultivated under the WSS × NH conditions showed increases in the diameter of the stem, number of panicles, panicle length, grain filling rate, grain yield, and total biomass, as well as the number of effective panicles, secondary branches, and spikelets. These results are in accordance with previous findings [6,66]. However, in 2019 and 2020, the rice yield of the WSS × NH group was significantly higher than that of the N0 (by 44.8% and 49.47%), NL (by 22.16% and 15.48%), and NM (by 11.91% and 7.14%) groups. The high SRNF dose altered the soil fertility and boosted N availability in the rhizosphere for the 2020 cropping season, which increased the rice yield. Therefore, although N is highly volatile, SRNFs have the potential to reduce N volatility, making N readily available for plant growth. These findings suggest that the WSS×NH interaction can enhance rice yield. Similarly, a previous study reported that SRNFs increased rice grain yield because N leached into the soil, increasing the concentrations of NO3- and NH4+ in soil layers, while another study found that SRNFs also boosted the amounts of total N and organic matter in the soil [12,52]. Previous results also revealed that SRNFs can remain inactive during the off-season and can be subsequently reactivated to release ionized N for plant growth without polluting soil or soil water resources, saving money and time. N loss through denitrification, NH3 volatilization, leaching, and surface runoff decreases the efficiency of N recovery [67]. Using the AWD regime and SRNFs as basal fertilizers to increase rice productivity minimizes N loss to achieve higher NAE, NARE, NPFP, and NHI values.

5. Conclusions

Among different water regimes, WSS was proven to be the optimal irrigation system for rice cultivation, as the rice possessed greater yield potential and better yield performance under AWD-based water-saving irrigation conditions. On the other hand, increasing the SRNFs application rate enhanced the rice plants’ morpho-physiological characteristics significantly. The combination of WSS and HN enhanced rice growth, yield, and NUE, which was mainly attributed to the larger root biomass, deeper root distribution, improved leaf structure, stronger ability for aboveground biomass production, and improved canopy quality. The present study suggests that the combination of AWD with SRNFs enhances plant morpho-physiology to ensure vigorous plant growth with optimal biomass yield by providing a sufficient N nutrient supply while inducing efficient N acquisition. Crop management policies utilizing the combination of AWD and SRNFs should be investigated in larger fields, where different conditions and limitations may exist.

Author Contributions

Conceptualization, A.A.A.; data curation, A.A.A. and K.E.A.; formal analysis, A.A.A.; funding acquisition, J.L. and Y.L.; investigation, H.S. and Y.A.H.; methodology, A.A.A.; project administration, H.W. and S.Q.; resources, J.L., Y.L. and C.Y.; software, A.A.A.; supervision, J.L. and Y.A.H.; validation, A.A.A., K.E.A., S.A.A. and S.Q.; visualization, A.A.A., J.L., Y.A.H., Y.L., K.E.A., S.A.A., H.S., M.S., H.W. and C.Y.; writing—review and editing, J.L., Y.A.H., Y.L., K.E.A., S.A.A., H.S., M.S., H.W., S.Q. and C.Y. All authors have read and agreed to the published version of the manuscript.

Funding

This research work was funded by the Key-Area Research and Development Program of Guangdong Province, project number: 2019B020214003.

Data Availability Statement

Data is contained within the article.

Conflicts of Interest

The authors declare no conflict of interest.

References

  1. Cheng, S.-H.; Cao, L.-Y.; Zhuang, J.-Y.; Chen, S.-G.; Zhan, X.-D.; Fan, Y.-Y.; Zhu, D.-F.; Min, S.-K. Super Hybrid Rice Breeding in China: Achievements and Prospects. J. Integr. Plant Biol. 2007, 49, 805–810. [Google Scholar] [CrossRef]
  2. He, L.; Wu, Q.; Gao, X.; Wu, K. Population Life Tables for the Invasive Fall Armyworm, Spodoptera Frugiperda Fed on Major Oil Crops Planted in China. J. Integr. Agric. 2021, 20, 745–754. [Google Scholar] [CrossRef]
  3. Peng, S.; Buresh, R.J.; Huang, J.; Zhong, X.; Zou, Y.; Yang, J.; Wang, G.; Liu, Y.; Hu, R.; Tang, Q.; et al. Improving Nitrogen Fertilization in Rice by Sitespecific N Management. A Review. Agron. Sustain. Dev. 2010, 30, 649–656. [Google Scholar] [CrossRef]
  4. Liu, H.; Hussain, S.; Zheng, M.; Peng, S.; Huang, J.; Cui, K.; Nie, L. Dry Direct-Seeded Rice as an Alternative to Transplanted-Flooded Rice in Central China. Agron. Sustain. Dev. 2015, 35, 285–294. [Google Scholar] [CrossRef] [Green Version]
  5. Lampayan, R.M.; Rejesus, R.M.; Singleton, G.R.; Bouman, B.A.M. Adoption and Economics of Alternate Wetting and Drying Water Management for Irrigated Lowland Rice. Field Crops Res. 2015, 170, 95–108. [Google Scholar] [CrossRef]
  6. Carrijo, D.R.; Lundy, M.E.; Linquist, B.A. Rice Yields and Water Use under Alternate Wetting and Drying Irrigation: A Meta-Analysis. Field Crops Res. 2017, 203, 173–180. [Google Scholar] [CrossRef]
  7. Prasad, R.; Shivay, Y.S.; Kumar, D. Current status, challenges, and opportunities in rice production. In Rice Production Worldwide; Springer: Berlin/Heidelberg, Germany, 2017; pp. 1–32. [Google Scholar]
  8. Linquist, B.A.; Anders, M.M.; Adviento-Borbe, M.A.A.; Chaney, R.L.; Nalley, L.L.; Da Rosa, E.F.F.; Van Kessel, C. Reducing Greenhouse Gas Emissions, Water Use, and Grain Arsenic Levels in Rice Systems. Glob. Chang. Biol. 2015, 21, 407–417. [Google Scholar] [CrossRef]
  9. Hamoud, Y.A.; Guo, X.; Wang, Z.; Chen, S.; Rasoul, G. Effects of Irrigation Water Regime, Soil Clay Content and Their Combination on Growth, Yield, and Water Use Efficiency of Rice Grown in South China. Int. J. Agric. Biol. Eng. 2018, 11, 144–155. [Google Scholar]
  10. Djaman, K.; Mel, V.C.; Diop, L.; Sow, A.; El-Namaky, R.; Manneh, B.; Saito, K.; Futakuchi, K.; Irmak, S. Effects of Alternate Wetting and Drying Irrigation Regime and Nitrogen Fertilizer on Yield and Nitrogen Use Efficiency of Irrigated Rice in the Sahel. Water 2018, 10, 711. [Google Scholar] [CrossRef] [Green Version]
  11. Yang, C.; Yang, L.; Yang, Y.; Ouyang, Z. Rice Root Growth and Nutrient Uptake as Influenced by Organic Manure in Continuously and Alternately Flooded Paddy Soils. Agric. Water Manag. 2004, 70, 67–81. [Google Scholar] [CrossRef]
  12. Zhang, Y.; Xu, J.; Cheng, Y.; Chen, W.; Liu, G.; Yang, J. The Effects of Water and Nitrogen on the Roots and Yield of Upland and Paddy Rice. J. Integr. Agric. 2020, 19, 1363–1374. [Google Scholar] [CrossRef]
  13. Sander, T.; Gerke, H.H. Preferential Flow Patterns in Paddy Fields Using a Dye Tracer. Vadose Zone J. 2007, 6, 105–115. [Google Scholar] [CrossRef]
  14. Hamoud, Y.A.; Shaghaleh, H.; Sheteiwy, M.; Guo, X.; Elshaikh, N.A.; Khan, N.U.; Oumarou, A.; Rahim, S.F. Impact of Alternative Wetting and Soil Drying and Soil Clay Content on the Morphological and Physiological Traits of Rice Roots and Their Relationships to Yield and Nutrient Use-Efficiency. Agric. Water Manag. 2019, 223, 105706. [Google Scholar] [CrossRef]
  15. Amanullah; Ullah, H.; Soliman Elshikh, M.; Alwahibi, M.S.; Alkahtani, J.; Muhammad, A.; Khalid, S.; Imran. Nitrogen Contents in Soil, Grains, and Straw of Hybrid Rice Differ When Applied with Different Organic Nitrogen Sources. Agriculture 2020, 10, 386. [Google Scholar] [CrossRef]
  16. Paungfoo-Lonhienne, C.; Redding, M.; Pratt, C.; Wang, W. Plant Growth Promoting Rhizobacteria Increase the Efficiency of Fertilisers While Reducing Nitrogen Loss. J. Environ. Manag. 2019, 233, 337–341. [Google Scholar] [CrossRef]
  17. Frye, W. Nitrification Inhibition for Nitrogen Efficiency and Environment Protection. In Proceedings of the IFA International Workshop on Enhanced-Efficiency Fertilizers, Frankfurt, Germany, 28–30 June 2005; pp. 28–30. [Google Scholar]
  18. Guo, Y.; Zhang, M.; Liu, Z.; Zhao, C.; Lu, H.; Zheng, L.; Li, Y.C. Applying and Optimizing Water-Soluble, Slow-Release Nitrogen Fertilizers for Water-Saving Agriculture. ACS Omega 2020, 5, 11342–11351. [Google Scholar] [CrossRef]
  19. Fu, Y.; Zhong, X.; Zeng, J.; Liang, K.; Pan, J.; Xin, Y.; Liu, Y.; Hu, X.; Peng, B.; Chen, R.; et al. Improving Grain Yield, Nitrogen Use Efficiency and Radiation Use Efficiency by Dense Planting, with Delayed and Reduced Nitrogen Application, in Double Cropping Rice in South China. J. Integr. Agric. 2021, 20, 565–580. [Google Scholar] [CrossRef]
  20. Fu, J.; Wang, C.; Chen, X.; Huang, Z.; Chen, D. Classification Research and Types of Slow Controlled Release Fertilizers (SRFs) Used-a Review. Commun. Soil Sci. Plant Anal. 2018, 49, 2219–2230. [Google Scholar] [CrossRef]
  21. Hamoud, Y.A.; Guo, X.; Wang, Z.; Shaghaleh, H.; Chen, S.; Hassan, A.; Bakour, A. Effects of Irrigation Regime and Soil Clay Content and Their Interaction on the Biological Yield, Nitrogen Uptake and Nitrogen-Use Efficiency of Rice Grown in Southern China. Agric. Water Manag. 2019, 213, 934–946. [Google Scholar] [CrossRef]
  22. Petricka, J.J.; Winter, C.M.; Benfey, P.N. Control of Arabidopsis Root Development. Annu. Rev. Plant Biol. 2012, 63, 563–590. [Google Scholar] [CrossRef] [Green Version]
  23. Alordzinu, K.E.; Jiuhao, L.; Appiah, S.A.; Aasmi, A.A.L.; Blege, P.K.; Afful, E.A. Water Stress Affects the Physio-Morphological Development of Tomato Growth. Afr. J. Agric. Res. 2021, 17, 733–742. [Google Scholar]
  24. Shen, J.; Li, C.; Mi, G.; Li, L.; Yuan, L.; Jiang, R.; Zhang, F. Maximizing Root/Rhizosphere Efficiency to Improve Crop Productivity and Nutrient Use Efficiency in Intensive Agriculture of China. J. Exp. Bot. 2013, 64, 1181–1192. [Google Scholar] [CrossRef]
  25. He, W.; Liu, Y.; Sun, H.; Taghizadeh-Hesary, F. How Does Climate Change Affect Rice Yield in China? Agriculture 2020, 10, 441. [Google Scholar] [CrossRef]
  26. Lin, Y.; Huabin, Z.; Jianxia, L.; Hui, H.; Huang, H. Current Situation and Prospect of Rice Water-Saving Irrigation Technology in China. Chin. J. Ecol. 2014, 33, 1381–1387. [Google Scholar]
  27. Gupta, P.K.; Gupta, P.K.; Gupta, P.K. Soil, Plant, Water and Fertilizer Analysis; Agro Botanica: Jodhpur, India, 1999. [Google Scholar]
  28. Marx, E.S.; Hart, J.; Stevens, R.G. Soil Test Interpretation Guide; EC 1478; Oregon State University: Corvallis, OR, USA, 1999. [Google Scholar]
  29. Nelson, D.W.; Sommers, L.E. Total Carbon, Organic Carbon, and Organic Matter. Methods Soil Anal. Part 3 Chem. Methods 2018, 5, 961–1010. [Google Scholar] [CrossRef]
  30. Jackson, M.L. Soil Chemical Analysis: Advanced Course; UW-Madison Libraries Parallel Press: Madison, WI, USA, 2005. [Google Scholar]
  31. Sims, J.R.; Jackson, G.D. Rapid Analysis of Soil Nitrate with Chromotropic Acid. Soil Sci. Soc. Am. J. 1971, 35, 603–606. [Google Scholar] [CrossRef]
  32. Henriksen, A.; Selmer-Olsen, A.R. Automatic Methods for Determining Nitrate and Nitrite in Water and Soil Extracts. Analyst 1970, 95, 514–518. [Google Scholar] [CrossRef]
  33. Dhyan, S.; Chhonkar, P.K.; Dwivedi, B.S. Manual on Soil, Plant and Water Analysis; Westville Publishing House: New Delhi, India, 2005. [Google Scholar]
  34. Tang, S.H.; Xu, P.Z.; Chen, J.S.; Ai, S.Y.; Zhang, F.B.; Huang, Y. Effects of Single Basal Application of Controlled-Release Fertilizer on Root Activity and Nutrient Absorption of Rice (Oryza satava L.). Plant Nutr. Fert Sci. 2007, 3, 586–596. [Google Scholar]
  35. Cavalca, L.; Zanchi, R.; Corsini, A.; Colombo, M.; Romagnoli, C.; Canzi, E.; Andreoni, V. Arsenic-Resistant Bacteria Associated with Roots of the Wild Cirsium arvense (L.) Plant from an Arsenic Polluted Soil, and Screening of Potential Plant Growth-Promoting Characteristics. Syst. Appl. Microbiol. 2010, 33, 154–164. [Google Scholar] [CrossRef]
  36. Tennant, D. A Test of a Modified Line Intersect Method of Estimating Root Length. J. Ecol. 1975, 63, 995–1001. [Google Scholar] [CrossRef]
  37. Pang, W.; Crow, W.T.; Luc, J.E.; Mcsorley, R.; Kruse, J.K. Comparison of Water Displacement and WinRHIZO Software for Plant Root Parameter Assessment. Plant Dis. 2011, 95, 1308–1310. [Google Scholar] [CrossRef] [PubMed] [Green Version]
  38. Barber, S.A. Soil Nutrient Bioavailability: A Mechanistic Approach; John Wiley & Sons: Hoboken, NJ, USA, 1995. [Google Scholar]
  39. Zhang, X.Z.; Tan, G.; Huang, Y. Experimental Technology of Plant Physiology; Liaoning Science and Technology Press: Shenyang, China, 1994; pp. 123–126. [Google Scholar]
  40. Novamsky, I.; Van Eck, R.; Van Schouwenburg, C.H.; Walinga, I. Total Nitrogen Determination in Plant Material by Means of the Indophenol-Blue Method. Neth. J. Agric. Sci. 1974, 22, 3–5. [Google Scholar] [CrossRef]
  41. Sheteiwy, M.S.; Shao, H.; Qi, W.; Hamoud, Y.A.; Shaghaleh, H.; Khan, N.U.; Yang, R.; Tang, B. GABA-Alleviated Oxidative Injury Induced by Salinity, Osmotic Stress and Their Combination by Regulating Cellular and Molecular Signals in Rice. Int. J. Mol. Sci. 2019, 20, 5709. [Google Scholar] [CrossRef] [PubMed] [Green Version]
  42. Oi, T.; Enomoto, S.; Nakao, T.; Arai, S.; Yamane, K.; Taniguchi, M. Three-Dimensional Intracellular Structure of a Whole Rice Mesophyll Cell Observed with FIB-SEM. Ann. Bot. 2017, 120, 21–28. [Google Scholar] [CrossRef] [Green Version]
  43. Deng, F.; Li, W.; Wang, L.; Hu, H.; Liao, S.; Pu, S.-L.; Tao, Y.-F.; Li, G.-H.; Ren, W.-J. Effect of Controlled-Release Fertilizers on Leaf Characteristics, Grain Yield, and Nitrogen Use Efficiency of Machine-Transplanted Rice in Southwest China. Arch. Agron. Soil Sci. 2020, 67, 1739–1753. [Google Scholar] [CrossRef]
  44. Sahrawat, K.L. Redox Potential and PH as Major Drivers of Fertility in Submerged Rice Soils: A Conceptual Framework for Management. Commun. Soil Sci. Plant Anal. 2015, 46, 1597–1606. [Google Scholar] [CrossRef]
  45. Husson, O. Redox Potential (Eh) and PH as Drivers of Soil/Plant/Microorganism Systems: A Transdisciplinary Overview Pointing to Integrative Opportunities for Agronomy. Plant Soil 2013, 362, 389–417. [Google Scholar] [CrossRef] [Green Version]
  46. Wang, J.; Halder, D.; Wegner, L.; Brüggenwirth, L.; Schaller, J.; Martin, M.; Said-Pullicino, D.; Romani, M.; Planer-Friedrich, B. Redox Dependence of Thioarsenate Occurrence in Paddy Soils and the Rice Rhizosphere. Environ. Sci. Technol. 2020, 54, 3940–3950. [Google Scholar] [CrossRef]
  47. Marin, A.R.; Masscheleyn, P.H.; Patrick, W.H. Soil Redox-PH Stability of Arsenic Species and Its Influence on Arsenic Uptake by Rice. Plant Soil 1993, 152, 245–253. [Google Scholar] [CrossRef]
  48. Ren, X.; Chen, F.; Ma, T.; Hu, Y. Soil Quality Characteristics as Affected by Continuous Rice Cultivation and Changes in Cropping Systems in South China. Agriculture 2020, 10, 443. [Google Scholar] [CrossRef]
  49. Kirk, G.J.D.; Begg, C.B.M.; Solivas, J.L. The Chemistry of the Lowland Rice Rhizosphere. Plant Soil 1993, 155, 83–86. [Google Scholar] [CrossRef]
  50. Pii, Y.; Mimmo, T.; Tomasi, N.; Terzano, R.; Cesco, S.; Crecchio, C. Microbial Interactions in the Rhizosphere: Beneficial Influences of Plant Growth-Promoting Rhizobacteria on Nutrient Acquisition Process. A Review. Biol. Fertil. Soils 2015, 51, 403–415. [Google Scholar] [CrossRef]
  51. Bandaogo, A.; Bidjokazo, F.; Youl, S.; Safo, E.; Abaidoo, R.; Andrews, O. Effect of Fertilizer Deep Placement with Urea Supergranule on Nitrogen Use Efficiency of Irrigated Rice in Sourou Valley (Burkina Faso). Nutr. Cycl. Agroecosystems 2015, 102, 79–89. [Google Scholar] [CrossRef]
  52. Guo, C.; Li, P.; Lu, J.; Ren, T.; Cong, R.; Li, X. Application of Controlled-Release Urea in Rice: Reducing Environmental Risk While Increasing Grain Yield and Improving Nitrogen Use Efficiency. Commun. Soil Sci. Plant Anal. 2016, 47, 1176–1183. [Google Scholar] [CrossRef]
  53. Xu, X.; He, P.; Pampolino, M.F.; Qiu, S.; Zhao, S.; Zhou, W. Spatial Variation of Yield Response and Fertilizer Requirements on Regional Scale for Irrigated Rice in China. Sci. Rep. 2019, 9, 3589. [Google Scholar] [CrossRef] [Green Version]
  54. Chen, Y.; Li, S.; Zhang, Y.; Li, T.; Ge, H.; Xia, S.; Gu, J.; Zhang, H.; Lü, B.; Wu, X.; et al. Rice Root Morphological and Physiological Traits Interaction with Rhizosphere Soil and Its Effect on Methane Emissions in Paddy Fields. Soil Biol. Biochem. 2019, 129, 191–200. [Google Scholar] [CrossRef]
  55. Xie, X.; Machikowa, T.; Wonprasaid, S. Fertigation Based on a Nutrient Balance Model for Cassava Production in Two Different Textured Soils. Plant Prod. Sci. 2020, 23, 407–416. [Google Scholar] [CrossRef] [Green Version]
  56. Beig, B.; Niazi, M.B.K.; Jahan, Z.; Hussain, A.; Zia, M.H.; Mehran, M.T. Coating Materials for Slow Release of Nitrogen from Urea Fertilizer: A Review. J. Plant Nutr. 2020, 43, 1510–1533. [Google Scholar] [CrossRef]
  57. Liu, X.; Chen, L.; Hua, Z.; Mei, S.; Wang, P.; Wang, S. Comparing Ammonia Volatilization between Conventional and Slow-Release Nitrogen Fertilizers in Paddy Fields in the Taihu Lake Region. Environ. Sci. Pollut. Res. 2020, 27, 8386–8394. [Google Scholar] [CrossRef]
  58. Wang, X.; Zhao, C.; Guo, N.; Li, Y.; Jian, S.; Yu, K. Determining the Canopy Water Stress for Spring Wheat Using Canopy Hyperspectral Reflectance Data in Loess Plateau Semiarid Regions. Lett. Spectrosc. 2015, 48, 492–498. [Google Scholar] [CrossRef]
  59. Zhang, L.; Zhang, H.; Niu, Y.; Han, W. Mapping Maize Water Stress Based on UAV Multispectral Remote Sensing. Remote Sens. 2019, 11, 605. [Google Scholar] [CrossRef] [Green Version]
  60. Kondhia, A.; Tabien, R.E.; Ibrahim, A. Evaluation and Selection of High Biomass Rice (Oryza sativa L.) for Drought Tolerance. Am. J. Plant Sci. 2015, 6, 1962. [Google Scholar] [CrossRef] [Green Version]
  61. Sriphirom, P.; Chidthaisong, A.; Towprayoon, S. Effect of Alternate Wetting and Drying Water Management on Rice Cultivation with Low Emissions and Low Water Used during Wet and Dry Season. J. Clean. Prod. 2019, 223, 980–988. [Google Scholar] [CrossRef]
  62. Mishra, A.; Uphoff, N. Morphological and Physiological Responses of Rice Roots and Shoots to Varying Water Regimes and Soil Microbial Densities. Arch. Agron. Soil Sci. 2013, 59, 705–731. [Google Scholar] [CrossRef]
  63. Al-Yahyai, R.; Schaffer, B.; Davies, F.S.; Muñoz-Carpena, R. Characterization of Soil-Water Retention of a Very Gravelly Loam Soil Varied with Determination Method. Soil Sci. 2006, 171, 85–93. [Google Scholar] [CrossRef] [Green Version]
  64. Kotula, L.; Ranathunge, K.; Steudle, E. Apoplastic Barriers Effectively Block Oxygen Permeability across Outer Cell Layers of Rice Roots under Deoxygenated Conditions: Roles of Apoplastic Pores and of Respiration. New Phytol. 2009, 184, 909–917. [Google Scholar] [CrossRef]
  65. Shiono, K.; Yamauchi, T.; Yamazaki, S.; Mohanty, B.; Malik, A.I.; Nagamura, Y.; Nishizawa, N.K.; Tsutsumi, N.; Colmer, T.D.; Nakazono, M. Microarray Analysis of Laser-Microdissected Tissues Indicates the Biosynthesis of Suberin in the Outer Part of Roots during Formation of a Barrier to Radial Oxygen Loss in Rice (Oryza sativa). J. Exp. Bot. 2014, 65, 4795–4806. [Google Scholar] [CrossRef] [Green Version]
  66. Wang, C.; Lv, J.; Xie, J.; Yu, J.; Li, J.; Zhang, J.; Tang, C.; Niu, T.; Patience, B.E. Effect of Slow-Release Fertilizer on Soil Fertility and Growth and Quality of Wintering Chinese Chives (Allium tuberm Rottler Ex Spreng.) in Greenhouses. Sci. Rep. 2021, 11, 8070. [Google Scholar] [CrossRef]
  67. Hou, P.; Xue, L.; He, S.; Zhou, Y.; Li, G.; Feng, Y.; Yang, L.; Xue, L. Controlled-Release Fertilizer Affects Growth and Yield of Japonica Rice. J. Anim. Plant Sci. 2021, 31, 97–102. [Google Scholar]
Figure 1. Averages of temperature and humidity during both experiment seasons for (A) 2019 and (B) 2020.
Agriculture 12 00086 g001
Figure 2. Experimental pot setup.
Agriculture 12 00086 g002
Figure 3. Effects of SRNFS rates and water regimes on soil fertility in the root zone. (A,B) represent the soil redox potential in 2019 and 2020 respectively. (C,D) represent the soil pH in 2019 and 2020 respectively. (E,F) represent the soil N concentration in 2019 and 2020 respectively. WSS, WMD, and WSD donate wetting and saturation, wetting and moderate drying, and wetting and severe drying, respectively. N0, NL, NM, and NH donate without adding SRNFS, light SRNFS, moderate SRNFS, and heavy SRNFS, respectively. Means are not significantly different between different water regimes (p ≤ 0.05) when followed by the same uppercase letter. During the same irrigation treatment, the means are not significantly different between different SRNFS rates (p ≤ 0.05), according to Duncan’s multiple range test, when followed by the same lowercase letter.
Agriculture 12 00086 g003
Figure 4. Transmission electron microscopy (TEM) images of the leaf mesophyll rates of rice under different SRNS fertilizer rates and different water regimes: (1) cell walls; (2) chloroplasts; (3) thylakoid; (4) starch grains; (5) plastoglobuli; (6) vacuoles; (7) lipid drop; (8) mitochondria; (9) loop of DNA.
Agriculture 12 00086 g004
Table 1. Physical and chemical soil properties.
ParametersValues
Soil textureLoam
Sand (%)33.53 ± 1.7
Silt (%)41.6 ± 0.28
Clay (%)24.87 ± 0.45
Bulk density (g cm−3)1.2 ± 0.09
Particle density (g cm−3)2.32 ± 0.03
Total soil porosity %54.71 ± 3.57
Soil pH6.1 ± 0.11
Soil organic matter (g kg−1)12.96 ± 1.36
Total Nitrogen (g kg−1)0.6 ± 0.02
Total Phosphorus (g kg−1)0.47 ± 0.01
Total Potassium (g kg−1)14.92 ± 0.12
Available nitrogen (mg kg−1)32.15 ± 0.15
Available Phosphorus (mg kg−1)2.85 ± 0.26
Exchangeable potassium (mg kg−1)165.63 ± 17.2
Table 2. Mean values of root morphology indicators for different irrigation methods and N fertilizer rates, and a summary of the ANOVA analysis of the main effects of different irrigation methods and N fertilizer rates on the rice root morphology.
TreatmentRoot Growth Morphology Indicator
RWD (g cm−3)RLD (mm cm−3)TSA (m2 hill−1)RDW (g hill−1)
20192020201920202019202020192020
WSS × N00.52 ± 0.02 Ac0.54 ± 0.03 Ac10.37 ± 1.23 Ac10.72 ± 1.8 Ac62.82 ± 7.89 Ac64.96 ± 5.5 Ac6.57 ± 0.25 Ab6.77 ± 0.32 Ac
WSS × NL0.60 ± 0.03 Ab0.61 ± 0.02 Ab11.75 ± 1.07 Ab12.1 ± 0.61 Ab72.20 ± 4.68 Ab74.36 ± 8.1 Ab7.57 ± 0.35 Ab7.63 ± 0.28 Ab
WSS × NM0.64 ± 0.07 Ab0.68 ± 0.11 Ab11.51 ± 2.35 Ab11.85 ± 0.58 Aa75.93 ± 11.25 Ab78.16 ± 10.38 Ab8.10 ± 0.83 Aa8.57 ± 1.32 Ab
WSS × NH0.78 ± 0.03 Aa0.83 ± 0.03 Aa12.98 ± 2.92 Aa13.38 ± 1 Aa95.86 ± 15.63 Aa98.78 ± 1.1 Aa9.81 ± 0.33 Aa10.37 ± 0.40 Aa
WMD × N00.49 ± 0.01 Bb0.54 ± 0.04 Bc7.89 ± 1.85 Bb8.25 ± 0.34 Bc56.25 ± 7.59 Bb58.68 ± 2.6 Bc6.19 ± 0.19 Bc6.8 ± 0.46 Bc
WMD × NL0.57 ± 0.06 Bb0.63 ± 0.08 Bb8.92 ± 1.46 Bb9.37 ± 0.42 Bb64.30 ± 9.55 Bc67.57 ± 2.98 Bb6.91 ± 0.75 Bb7.87 ± 0.94 Bb
WMD × NM0.55 ± 0.08 Bb0.59 ± 0.07 Bb10.58 ± 2.2 Ba11.03 ± 0.49 Ba73.44 ± 10.21 Ba76.58 ± 4.21 Bb7.10 ± 0.97 Bb7.4 ± 0.87 Bb
WMD × NH0.73 ± 0.02 Ba0.71 ± 0.05 Ba11.79 ± 1.41 Ba12.19 ± 0.03 Ba90.94 ± 7.83 Ba93.97 ± 2.81 Ba9.17 ± 0.20 Ba8.97 ± 0.65 Ba
WSD × N00.48 ± 0.02 Cc0.51 ± 0.03 Cc5.32 ± 3.57 Cc7.25 ± 1.32 Cc58.39 ± 9.17 Cb56.44 ± 8.68 Cc6.00 ± 0.26 Cb6.4 ± 0.35 Cc
WSD × NL0.49 ± 0.02 Ca0.56 ± 0.02 Cb7.09 ± 1.87 Cb8.59 ± 0.57 Cb65.26 ± 4.57 Cb74.79 ± 8.61 Cb6.13 ± 0.23 Ca7 ± 0.2 Cb
WSD × NM0.53 ± 0.02 Cb0.59 ± 0.05 Cb8.19 ± 2.02 Ca9.25 ± 0.19 Ca80.76 ± 5.43 Ca68.38 ± 3.13 Cb6.71 ± 0.29 Ca7.37 ± 0.65 Cb
WSD × NH0.54 ± 0.06 Cb0.52 ± 0.03 Ca8.82 ± 1.15 Ca7.43 ± 1.14 Ca88.17 ± 11.72 Ca61.24 ± 6.5 Ca6.98 ± 0.72 Ca6.53 ± 0.42 Ca
ANOVA
Water regime************************
N rate**********************
Water × N rate*nsnsnsnsnsns***
Water regime × Yearnsnsnsnsnsnsnsns
N rate × Yearnsnsnsnsnsnsnsns
Water regime × N rate × Yearnsnsnsnsnsnsnsns
Notes: Means of the same uppercase and lowercase letters indicate no significant differences among different irrigation techniques and N fertilizer rates. Means are significantly different between different irrigation treatments (p ≤ 0.05) when tailed by a different uppercase letter. Under the same irrigation technique, the means are significantly different between different N fertilizer rates (p ≤ 0.05) when tailed by a different lowercase letter, according to the ANOVA analysis; ns, not significant; *, **, *** signify significant differences among treatments at p ≤ 0.05, 0.01, and 0.001, respectively.
Table 3. Mean values of rice yield indicators for different irrigation techniques and N fertilizer rates, and a summary of the ANOVA analysis of the main effects of different irrigation techniques and N fertilizer rates on yield indicators of rice.
TreatmentNumber of Panicles (Panicle hill−1)Panicle Length (cm)Grain Filling Rate (%)Grain Yield (g hill−1)Total Biomass (g hill−1)
2019202020192020201920202019202020192020
WSS × N028.00 ± 1 Ac29.7 ± 1.5 Ad17.3 ± 1.4 Ab20.3 ± 0.6 Ac70.5 ± 3.2 Ac74.92 ± 2.8 Ac50.1 ± 2.7 Ac56.67 ± 5.3 Ad99.4 ± 5.2 Ac100.37 ± 9.5 Ad
WSS × NL33.08 ± 1 Ab34.3 ± 1.1 Ac21.17 ± 1.8 Aa20.7 ± 1.2 Ab76.1 ± 2.2 Ab77.84 ± 2.0 Ab70.6 ± 3.4 Ab94.83 ± 3.5 Ac139.6 ± 1.8 Ab164.87 ± 7.2 Ac
WSS × NM34.67 ± 1.5 Aa36.7 ± 1.5 Ab22.05 ± 1.5 Aa23.7 ± 0.6 Aa84.5 ± 4.1 Aa84.95 ± 5.9 Aa79.9 ± 2.2 Aa104.2 ± 3.5 Ab159.0 ± 3.2 Aa191.97 ± 4.8 Ab
WSS × NH38.00 ± 2 Aa41.00 ± 1.5 Aa24.16 ± 0.8 Aa25.7 ± 1.5 Aa90.6 ± 1.3 Aa91.35 ± 5.3 Aa90.7 ± 1.5 Aa112.1 ± 4.3 Aa185.4 ± 2.4 Aa242.23 ± 3.9 Aa
WMD × N023.67 ± 2.1 Bc25.7 ± 1.5 Bd15.67 ± 0.4 Bb17.3 ± 2.5 Bc65.9 ± 3.3 Bb68.12 ± 1.3 Bc41.9 ± 2.7 Bb48.37 ± 1.9 Bd83.2 ± 2.3 Bb84 ± 2.3 Bd
WMD × NL29.10 ± 1 Bb32 ± 3 Bc19.59 ± 0.7 Ba20.3 ± 2.1 Bb72.8 ± 1.4 Bb75.55 ± 1.7 Bb66.0 ± 2.2 Bb65.57 ± 3.7 Bc131.1 ± 2.1 Bb125.1 ± 7.4 Bc
WMD × NM31.34 ± 2.1 Ba33 ± 3.5 Bb21.10 ± 1.3 Ba23.7 ± 0.6 Ba75.1 ± 1.5 Ba77.22 ± 0.6 Ba71.1 ± 2.1 Ba83.87 ± 3.5 Bb139.3 ± 2.9 Ba146.43 ± 9.7 Bb
WMD × NH35.31 ± 1.5 Ba36.7 ± 2.1 Ba22.83 ± 1.0 Ba24.2 ± 2.0 Ba82.3 ± 2.2 Ba79.49 ± 8.3 Ba86.8 ± 1.4 Ba92.71 ± 2.1 Ba164.2±1.4 Ba200.3 ± 6.4 Ba
WSD × N021.00 ± 2.5 Cc23.7 ± 4.5 Cd14.05 ± 0.8 Cb16 ± 2 Cc63.2 ± 3.5 Cc65.05 ± 3.8 Cc34.7 ± 1.8 Cc40.47 ± 3.1 Cd65.5 ± 1.8 Cc65.17 ± 1.6 Cd
WSD × NL26.56 ± 3.1 Cb27 ± 4 Cc15.63 ± 0.8 Ca19 ± 1 Cb72.9 ± 1.1 Cb73.01 ± 1.5 Cb63.8 ± 3.2 Cb52.53 ± 1.1 Cc125.4 ± 3.2 Cb108.63 ± 4.6 Cc
WSD × NM28.43 ± 2.5 Ca31.3 ± 4.1 Cb18.27 ± 1.5 Ca20.5 ± 0.5 Ca71.9 ± 1.0 Ca74.62 ± 2.4 Ca67.9 ± 2.3 Ca63.73 ± 3.2 Cb136.9 ± 2.3 Ca127.1 ± 6.2 Cb
WSD × NH28.29 ± 2.5 Ca30 ± 3 Ca19.75 ± 1.7 Ca18.5 ± 0.9 Ca79.1 ± 2.8 Ca75.89 ± 2.1 Ca78.1 ± 1.8 Ca78.33 ± 2.1 Ca146.6 ± 2.7 Ca141.27 ± 6.0 Ca
ANOVA
Water regime******************************
N rate****************************
Water × N ratensns*****nsnsnsnsnsns
Water regime × Yearnsnsnsnsnsnsnsnsnsns
N rate × Yearnsnsnsnsnsnsnsnsnsns
Water regime × N rate × Yearnsnsnsnsnsnsnsnsnsns
Notes: Means of the same uppercase and lowercase letters indicate no significant difference among different irrigation techniques and N fertilizer rates. Means are significantly different between different irrigation treatments (p ≤ 0.05) when tailed by a different uppercase letter. Under the same irrigation technique, the means are significantly different between different N fertilizer rates (p ≤ 0.05) when tailed by a different lowercase letter, according to the ANOVA analysis; ns, not significant; **, *** signify significant differences among treatments at p ≤ 0.05, 0.01, and 0.001, respectively.
Table 4. Mean values of NCG, NCS, NAG, and NAS of rice plants for different irrigation methods and N fertilizer rates, and a summary of the ANOVA analysis of the effects of the irrigation method and N fertilizer rate on nutrient uptake in rice.
TreatmentN Concentration (%)N Accumulation (mg hill−1)NTU (mg hill−1)
NCGNCSNAGNAS(NAG+NAS)
2019202020192020201920202019202020192020
WSS × N01.02 ± 0.05 Ac1.28 ± 0.1 Ad0.57 ± 0.04 Ab0.63 ± 0.03 Ac534.6 ± 36.3 Ad682.79 ± 42.0 Ad363.0 ± 40.2 Ac459.97 ± 52.5 Ad897.6 ± 73.5 Ad1142.75 ± 88.5 Ad
WSS × NL1.68 ± 0.06 Ab1.81 ± 0.2 AC0.71 ± 0.05 Aa0.75 ± 0.04 Ac1112 ± 81.8 Ac1206.77 ± 178 Ac507.6 ± 23.8 Ab666.69 ± 30.7 Ac1619.3 ± 99.6 Ac1873.46 ± 205.8 Ac
WSS × NM1.97 ± 0.10 Ab2.0 ± 0.1 Ab0.74 ± 0.09 Aa0.82 ± 0.03 Ab1421 ± 53.3 Ab1454.86 ± 41.4 Ab559.2 ± 53.7 Ab751.75 ± 66.8 Ab1980.0 ± 58.9 Ab2206.61 ± 25.8 Ab
WSS × NH2.32 ± 0.13 Aa2.43 ± 0.2 Aa0.79 ± 0.11 Aa1.07 ± 0.07 Aa1919.7 ± 10 Aa1953.27 ± 94.9 Aa714.5 ± 70.7 Aa953.95 ± 69.8 Aa2634.2 ± 141 Aa2907.22 ± 133.5 Aa
WMD × N00.70 ± 0.05 Bb0.97 ± 0.1 Bd0.52 ± 0.04 Bb0.81 ± 0.13 Bc310.6 ± 41.1 Bd431.66 ± 48.7 Bd322.1 ± 49.6 Bc391.00 ± 40.3 Bd632.7 ± 76.4 Bc822.66 ± 74.6 Bd
WMD × NL1.48 ± 0.08 Ba1.53 ± 0.1 Bc0.57 ± 0.06 Bb0.72 ± 0.07 Bc857.8 ± 26.5 Bc895.42 ± 23.7 Bc387.3±45.2 Bb541.95±52.5 Bc1245.1±79.9 Bc1437.37 ± 74.5 Bc
WMD × NM1.65 ± 0.03 Ba1.7 ± 0.1 Bb0.63 ± 0.03 Ba0.77 ± 0.00 Bb1044 ± 42.5 Bb1081.18 ± 48.4 Bb445.8 ± 39.7 Bb606.88 ± 60.0 Bb1490.1 ± 93.5 Bb1688.06 ± 106.5 Bb
WMD × NH1.87 ± 0.05 Ba1.93 ± 0.1 Ba0.72 ± 0.03 Ba1.00 ± 0.04 Ba1479.2 ± 47 Ba1534.45 ± 47.9 Ba565.0 ± 46.5 Ba750.31 ± 63.1 Ba2044.2 ± 32.2 Ba2284.76 ± 109.9 Ba
WSD × N00.40 ± 0.03 Cc0.66 ± 0.1 Cd0.22 ± 0.02 Cb0.46 ± 0.01 Cc147.9 ± 17.9 Cd244.27 ± 22.7 Cd115.3 ± 14.5 Cc172.10 ± 24.0 Cd263.1 ± 54.8 Cd416.38 ± 46.7 Ad
WSD × NL0.85 ± 0.05 Cb0.98 ± 0.1 Cc0.33 ± 0.05 Cb0.66 ± 0.06 Cc476.7 ± 58.1 Cc550.24 ± 60.7 Cc213.0 ± 30.7 Cb371.03 ± 36.5 Cc689.8 ± 43.4 Cc921.279 ± 76.3 Ac
WSD × NM0.96 ± 0.06 Cb1.08 ± 0.0 Cb0.51 ± 0.04 Ca0.84 ± 0.04 Cb578.2 ± 13.3 Cb653.61 ± 12.8 Cb365.1 ± 36.4 Ca535.82 ± 45.3 Cb943.3 ± 21.2 Cb1189.44 ± 41.0 Ad
WSD × NH1.08 ± 0.06 Ca1.20 ± 0.1 Ca0.53 ± 0.05 Ca0.86 ± 0.04 Ca756.2 ± 61.1 Ca846.58 ± 62.1 Ca374.7 ± 7.1 Ca542.88 ± 21.0 Ca1130.9 ± 67.7 Ca1389.46 ± 74.1 Aa
ANOVA
Water regime******************************
N fertilizer rate******************************
Water × N rate****************************
Water regime × Yearnsnsnsnsnsnsnsnsnsns
N rate × Yearnsnsnsnsnsnsnsnsnsns
Water regime × N rate × Yearnsnsnsnsnsnsnsnsnsns
Notes: Means of the same uppercase and lowercase letters indicate no significant difference among different irrigation techniques and N fertilizer rates. Means are significantly different between different irrigation treatments (p ≤ 0.05) when tailed by a different uppercase letter. Under the same irrigation technique, the means are significantly different between different N fertilizer rates (p ≤ 0.05) when tailed by a different lowercase letter, according to the ANOVA analysis; ns, not significant; **, *** signify significant differences among treatments at p ≤ 0.05, 0.01, and 0.001, respectively.
Table 5. Mean values of the NUE indicators of rice for different irrigation techniques and N fertilizer rates, and a summary of the ANOVA analysis of the impacts of irrigation regimes and N fertilizer rates on the NUE indicators of rice.
TreatmentNUE Indicators
NAE (%)NARE (%)NPFP (g g−1)NHI (%)
20192020201920202019202020192020
WSS × NL37.3 ± 1.31 Aa39.5 ± 1.50 Aa63.1 ± 4.33 Aa67.61 ± 4.95 Aa39.9 ± 1.50 Aa41.13 ± 1.94 Aa76.6 ± 1.39 Aa77.43 ± 1.72 Aa
WSS × NM22.0 ± 0.55 Ab22.8 ± 0.53 Ab54.4 ± 1.91 Ab56.25 ± 2.70 Ab24.5 ± 0.55 Ab25.2 ± 0.80 Ab71.8 ± 2.20 Aa73.2 ± 2.62 Ab
WSS × NH17.4 ± 0.2 Ac18.07 ± 0.31 Ac52.8 ± 3.00 Ab54.99 ± 3.49 Ac19.0 ± 0.20 Ac21.03 ± 0.86 Ac68.6 ± 0.94 Ab69.97 ± 0.67 Ac
WMD × NL32.9 ± 1.2 Ba32.4 ± 1.83 Ba59.1 ± 230 Ba61.28 ± 3.18 Ba37.3 ± 0.98 Ba38.1 ± 1.01 Ba72.4 ± 0.81 Ba73.5 ± 1.10 Aa
WMD × NM19.3 ± 0.9 Bb20.37 ± 1.06 Bb44.9 ± 2.42 Bb46.52 ± 2.73 Bb21.8 ± 0.73 Bb22.87 ± 0.12 Bb70.0 ± 0.73 Ba71.23 ± 0.75 Ab
WMD × NH16.5 ± 0.3 Bb17.4 ± 0.35 Bc41.4 ± 1.01 Bb44.45 ± 0.73 Bc18.2 ± 0.25 Bb19.33 ± 0.61 Bc69.6 ± 0.34 Bb70.13 ± 0.70 Ac
WSD × NL31.5 ± 1.7 Ca32.5 ± 0.98 Ca38.6 ± 1.78 Ca41.53 ± 3.05 Ca36.0 ± 1.46 Ca37.4 ± 2.12 Ca69.0 ± 3.91 Ca70.44 ± 4.80 Ba
WSD × NM18.4 ± 0.7 Cb19.07 ± 1.21 Cb31.6 ± 1.10 Cb33.84 ± 1.50 Cb20.8 ± 0.57 Cb21.67 ± 0.61 Cb66.8 ± 1.19 Ca68.07 ± 1.79 Bb
WSD × NH14.7 ± 0.6 Cb14.87 ± 1.42 Cc26.7 ± 1.04 Cc28.65 ± 1.61 Cc16.4 ± 0.46 Cc17.13 ± 0.70 Cc61.3 ± 2.46 Cb63.13 ± 1.90 Bc
ANOVA
Water regime***********************
N rate**********************
Water × N ratensnsnsnsnsnsnsns
Water regime × Yearnsnsnsnsnsnsnsns
N rate × Yearnsnsnsnsnsnsnsns
Water regime × N rate × Yearnsnsnsnsnsnsnsns
Notes: Means of the same uppercase and lowercase letters indicate no significant difference among different irrigation techniques and N fertilizer rates. Means are significantly different between different irrigation treatments (p ≤ 0.05) when tailed by a different uppercase letter. Under the same irrigation technique, the means are significantly different between different N fertilizer rates (p ≤ 0.05) when tailed by a different lowercase letter, according to the ANOVA analysis; ns, not significant; **, *** signify significant differences among treatments at p ≤ 0.05, 0.01, and 0.001, respectively.
Publisher’s Note: MDPI stays neutral with regard to jurisdictional claims in published maps and institutional affiliations.

