Article

Dynamics of Tree outside Forest Land Cover Development and Ecosystem Carbon Storage Change in Eastern Coastal Zone, Bangladesh

1
Key Laboratory of Urban Environment and Health, Institute of Urban Environment, Chinese Academy of Sciences, Xiamen 361021, China
2
International School, University of Chinese Academy of Sciences, Beijing 100049, China
3
Xiamen Key Lab of Urban Metabolism, Institute of Urban Environment, Chinese Academy of Sciences, Xiamen 361021, China
4
Department of Agricultural Extension and Rural Development, Bangabandhu Sheikh Mujibur Rahman Agricultural University, Gazipur 1706, Bangladesh
5
Department of Agroforestry and Environment, Bangabandhu Sheikh Mujibur Rahman Agricultural University, Gazipur 1706, Bangladesh
6
Coastal and Ocean Management Institute, Xiamen University, Xiamen 361005, China
7
Department of Geosciences, Mississippi State University, Starkville, MS 39762, USA
*
Author to whom correspondence should be addressed.
Land 2022, 11(1), 76; https://doi.org/10.3390/land11010076
Submission received: 29 November 2021 / Revised: 28 December 2021 / Accepted: 29 December 2021 / Published: 4 January 2022

Abstract

:
Tree outside forest (TOF) has immense potential in economic and environmental development by increasing the amount of tree vegetation in and around rural settlements. It is an important source of carbon stocks and a critical option for climate change regulation, especially in land-scarce, densely populated developing countries such as Bangladesh. Spatio-temporal changes of TOF in the eastern coastal zone of Bangladesh were analyzed and mapped over 1988–2018, using Landsat land use land cover (LULC) maps and associated ecosystem carbon storage change by linking the InVEST carbon model. Landsat TM and OLI-TIRS data were classified through the Maximum Likelihood Classifier (MLC) algorithm using Semi-Automated Classification (SAC). In the InVEST model, aboveground, belowground, dead organic matter, and soil carbon densities of different LULC types were used. The findings revealed that the studied landscapes have differential features and changing trends in LULC where TOF, mangrove forest, built-up land, and salt-aquaculture land have increased due to the loss of agricultural land, mudflats, water bodies, and hill vegetation. Among different land biomes, TOF experienced the largest increase (1453.9 km2), and it also increased carbon storage by 9.01 Tg C. However, agricultural land and hill vegetation decreased rapidly by 1285.8 km2 and 365.7 km2 and reduced carbon storage by 3.09 Tg C and 4.89 Tg C, respectively. The total regional carbon storage increased by 1.27 Tg C during 1988–2018. In addition to anthropogenic drivers, land erosion and accretion were observed to significantly alter LULC and regional carbon storage, necessitating effective river channel and coastal embankment management to minimize food and environmental security tradeoff in the studied landscape.

1. Introduction

Trees in the forest provide valuable ecosystem services (e.g., soil quality improvement, timber production, climate regulation, and biodiversity conservation), sustaining 80% of the global biological diversity, including endangered and endemic species [1]. Forest trees release a mass of oxygen, hold carbon dioxide (CO2) to make the earth livable, and play a critical role in the global carbon cycle [2]. Almost 25% of the global population is primarily dependent on forest-resource-based livelihoods [3]. However, according to Global Forest Watch [4], from 2001 to 2018, there was a total of 361 Mha of tree cover loss globally, which was equivalent to a 9.0% decrease in tree cover since 2000 and caused 98.7 Gt of CO2 emissions. Other than the anthropogenic causes such as urbanization, industrialization, land abandonment and fragmentation, and reclamation for agricultural production [5,6], there was significant forest destruction due to natural hazards such as forest fires [7], cyclones [8], erosion [9], and diseases [10]. In addition, commodity-driven (business, international trade, tourism, and development) land use change resulted in a 27% loss of global forest [7,11]. Land use changes, especially due to the cultivation of deforested land, can cause uncountable damage to soil quality, biodiversity, and ecosystems [1]. Hence, planting trees in and around converted settlements and farmland areas of land-scarce developing economies might help to control global climate change by boosting regional carbon storage (CS) [12] while also assisting to protect livelihoods and ecosystems [12].
Global initiatives such as policies and actions have been taken to counter forest loss. One example is the Sustainable Development Goals (SDGs) Indicator, “15.1.1—Forest area as a percentage of total land area and Indicator 15.2.1—Progress towards sustainable forest management is directly linked to ensuring forest resource conservation”. Particularly in developing countries, reducing emissions from deforestation and forest degradation (REDD+) are now being taken into consideration, and these countries are implementing conservation and the sustainable management of forests and enhancing forest carbon stocks [13,14]. Bangladesh is considered a highly populated and developing country (population density of 1095 per km2), and a large proportion of this population heavily depends on natural-resource-based livelihoods such as forests and agriculture [15,16,17,18]. Considering this need, the tree outside forest (TOF), a particular type of social forestry, was introduced in Bangladesh in the 1990s that later significantly contributed to achieving the national target of having 20% vegetation cover and a strategy towards REDD+ activity in Bangladesh [14,19].
TOF includes the plantation of forest, fruit, timber, and fuelwood species in fallow land, roadsides, homesteads, and rural social institutions [19]. In many climate-vulnerable areas, especially in the coastal (salinity/tidal surge) region of Bangladesh, farmers choose to grow tree crops or grow trees and crops together, as trees have an inherent capacity to withstand drought, salinity, soil erosion, and flood impacts [20]. Species in the TOF are chosen in such a way that people can meet their needs. These particular types of forests are becoming popular not only for the potential to reduce the natural forest burden [21] but also for the benefits of human livelihood, e.g., food, fuel, timber, medicine, fodder, shade, the modification of microclimates, and as ecosystem goods and services [22]. Despite its huge potential, TOF is underutilized due to a lack of understanding of these valuable resources. The acreage of TOF is unknown, and thereby, the amount/number of benefits derived is also unexplored [19]. The TOF system fulfils around 40% vegetable, 70% fruit, 90% firewood, and 70% timber and bamboo requirements in Bangladesh [22].
Remote Sensing (RS) and Geographical Information Systems (GIS) are very useful to analyze and map quantitative change of different land use land cover (LULC) by utilizing multispectral satellite imageries [23] that can also be applied to quantify the TOF land cover development. In particular, RS offers the advantage of time-series data to investigate the TOF land cover development [12]. A moderate-resolution (10–30 m) satellite system (Landsat) has been used to analyze the extent of the waterlogged area [20], urban growth [24], and transboundary pollution loading [25]. Therefore, we used RS to document the spatiotemporal dynamics of TOF in coastal Bangladesh. Existing research has shown that the integrated valuation of ecosystem services and tradeoffs (InVEST) model is frequently used to estimate regional CS services using carbon density data [26]. This model is particularly valuable in estimating the effects of regional land policy on CS dynamics, as it combines the benefits of several estimation approaches [27,28,29].
While increasing TOF is a vibrant solution for climate regulation [19], previous studies merely addressed the time-series nature of changing TOF in coastal Bangladesh [9,12,30,31,32,33]. Moreover, TOF-based LULC change and their impacts on regional CS dynamics studies are lacking in Bangladesh and the coastal region. However, there have been some superficial assessments of carbon stocks in roadside trees by the algometric method. We, therefore, quantified the TOF-based LULC dynamics in the eastern coastal region of Bangladesh and estimated their contribution to the regional carbon reserves by analyzing historical Landsat imageries and equivalent carbon densities. The specific objectives of this study were (1) to analyze the dynamics of LULC changes in the eastern coastal zone between 1988 and 2018; (2) to assess and visualize the spatio-temporal distribution of TOF during 1988–2018; and (3) to calculate the regional carbon storage change during 1988–2018 in the eastern coastal region of Bangladesh. The novelty of the study lies in assessing and visualizing the TOF land cover development and its contribution to regional carbon reserves. The findings of the study will provide new insights to the policymakers to meet the national targets of increasing forest land cover under the commitment of REDD+ activity.

2. Materials and Methods
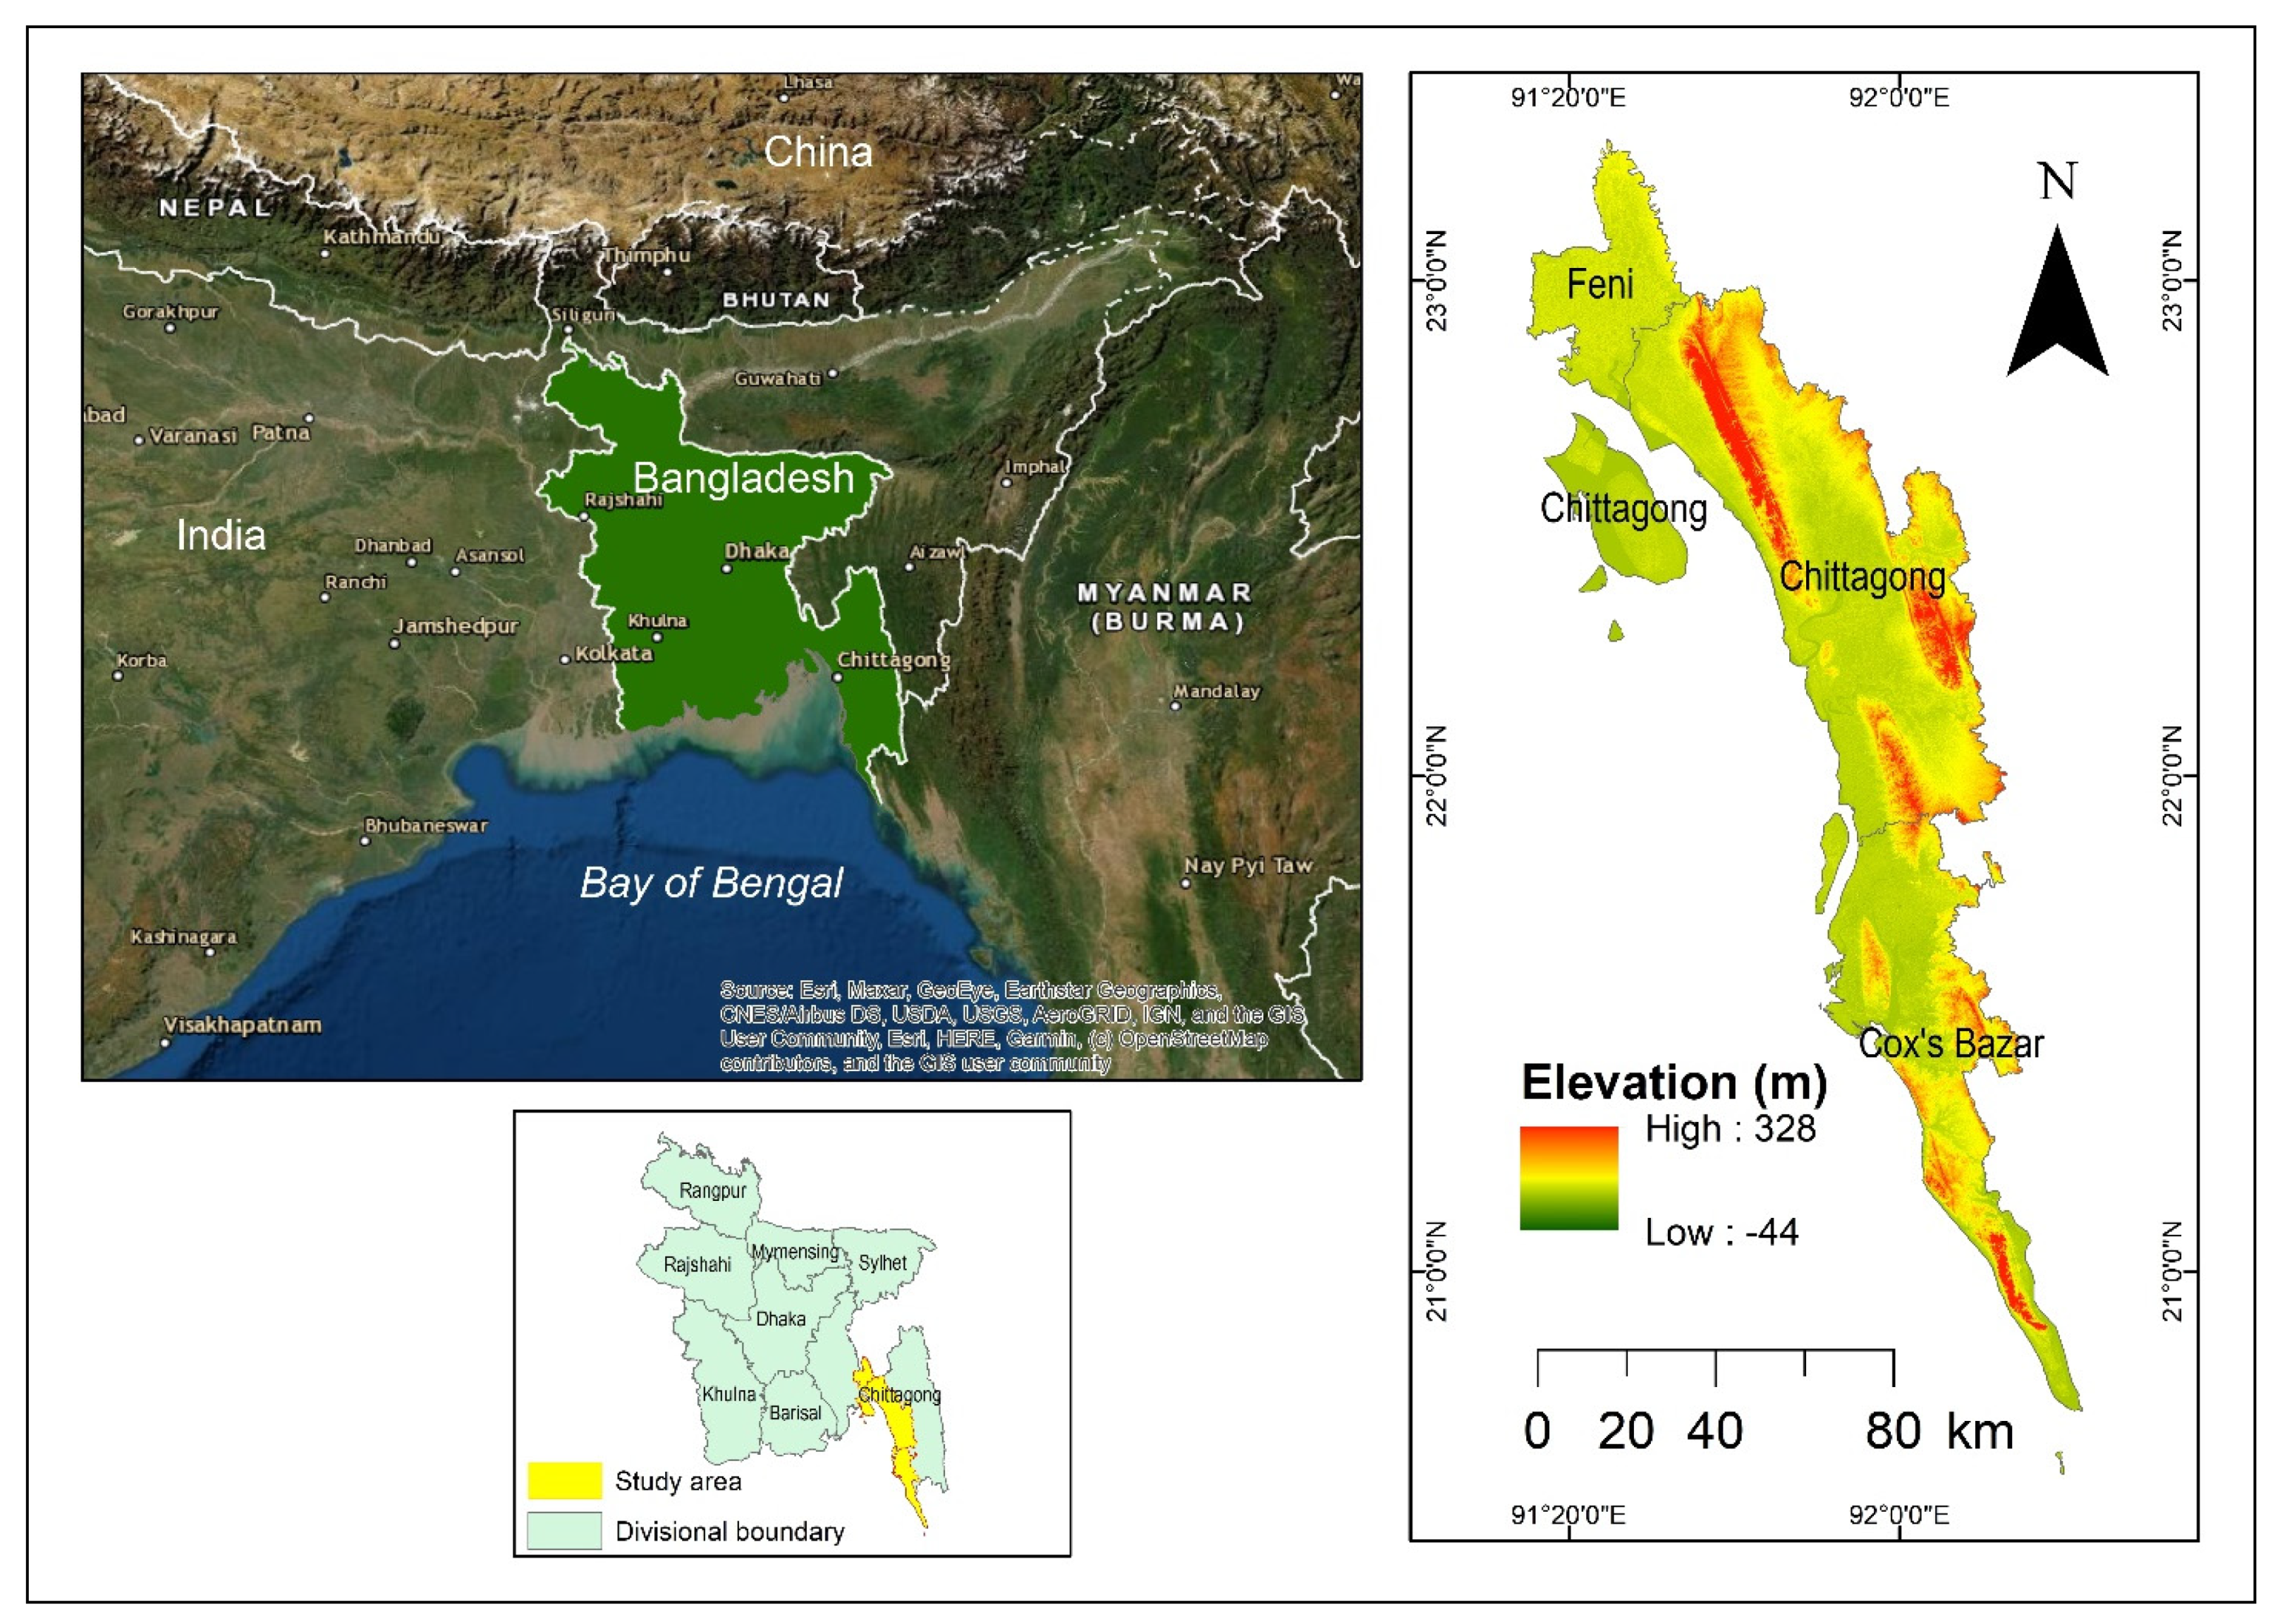
2.1. Study Area

The study was conducted in the eastern coastal zone of Bangladesh, which lies between 20°2′ N to 23°2′ N latitude and 90°9′ E to 92°3′ E longitude (Figure 1). It constituted three administrative districts, namely Feni, Chittagong, and Cox’s Bazar, covering a 7959.4 km2 area and accommodating 11.34 million populations [34]. This region is unique from ecological and economic points of view, containing the world’s longest natural sea beach (120 km), coral islands, mountains, tidal estuaries, renewable and non-renewable energy resources, productive agricultural lands, and marine resources [18,35]. Higher elevations and stable landmasses characterize the eastern coast experiencing massive land use changes [36]. The area features sunny and tropical weather along with a monsoon climate. The annual average temperature is 25.74 ℃, and the annual average precipitation is 3207 mm [12]. The elevation of the study area varies from −44.0 to 328 m. This region is characterized by sandy beaches, natural and planted mangrove forests, salt-panning, and a shrimp production zone. Moreover, the eastern coastal zone harbors coastal trails, estuaries, deltas, and lagoons [37,38].

2.2. Satellite Data Acquisition

Three Landsat Thematic Mapper (TM) and one Operational Land Imager and Thermal Infrared Sensor (OLI-TIRS) scenes with 30 × 30 m resolution covering the study area were obtained for four specific years—1988, 1998, 2008, and 2018 (Table S1). Consequently, between 1988 and 2018, a total of twelve scenes were collected (path/row: 135/46, 136/44, 136/45) from the LSDS Science Research and Development (LSRD) database of the United States Geological Survey (USGS) free of charge (https://espa.cr.usgs.gov/; accessed on 1 June 2021). All the surface-reflectance Landsat imagery (atmospherically corrected product) of the dry season with 0% cloud cover was downloaded to minimize the seasonal variation in vegetation pattern and distribution.

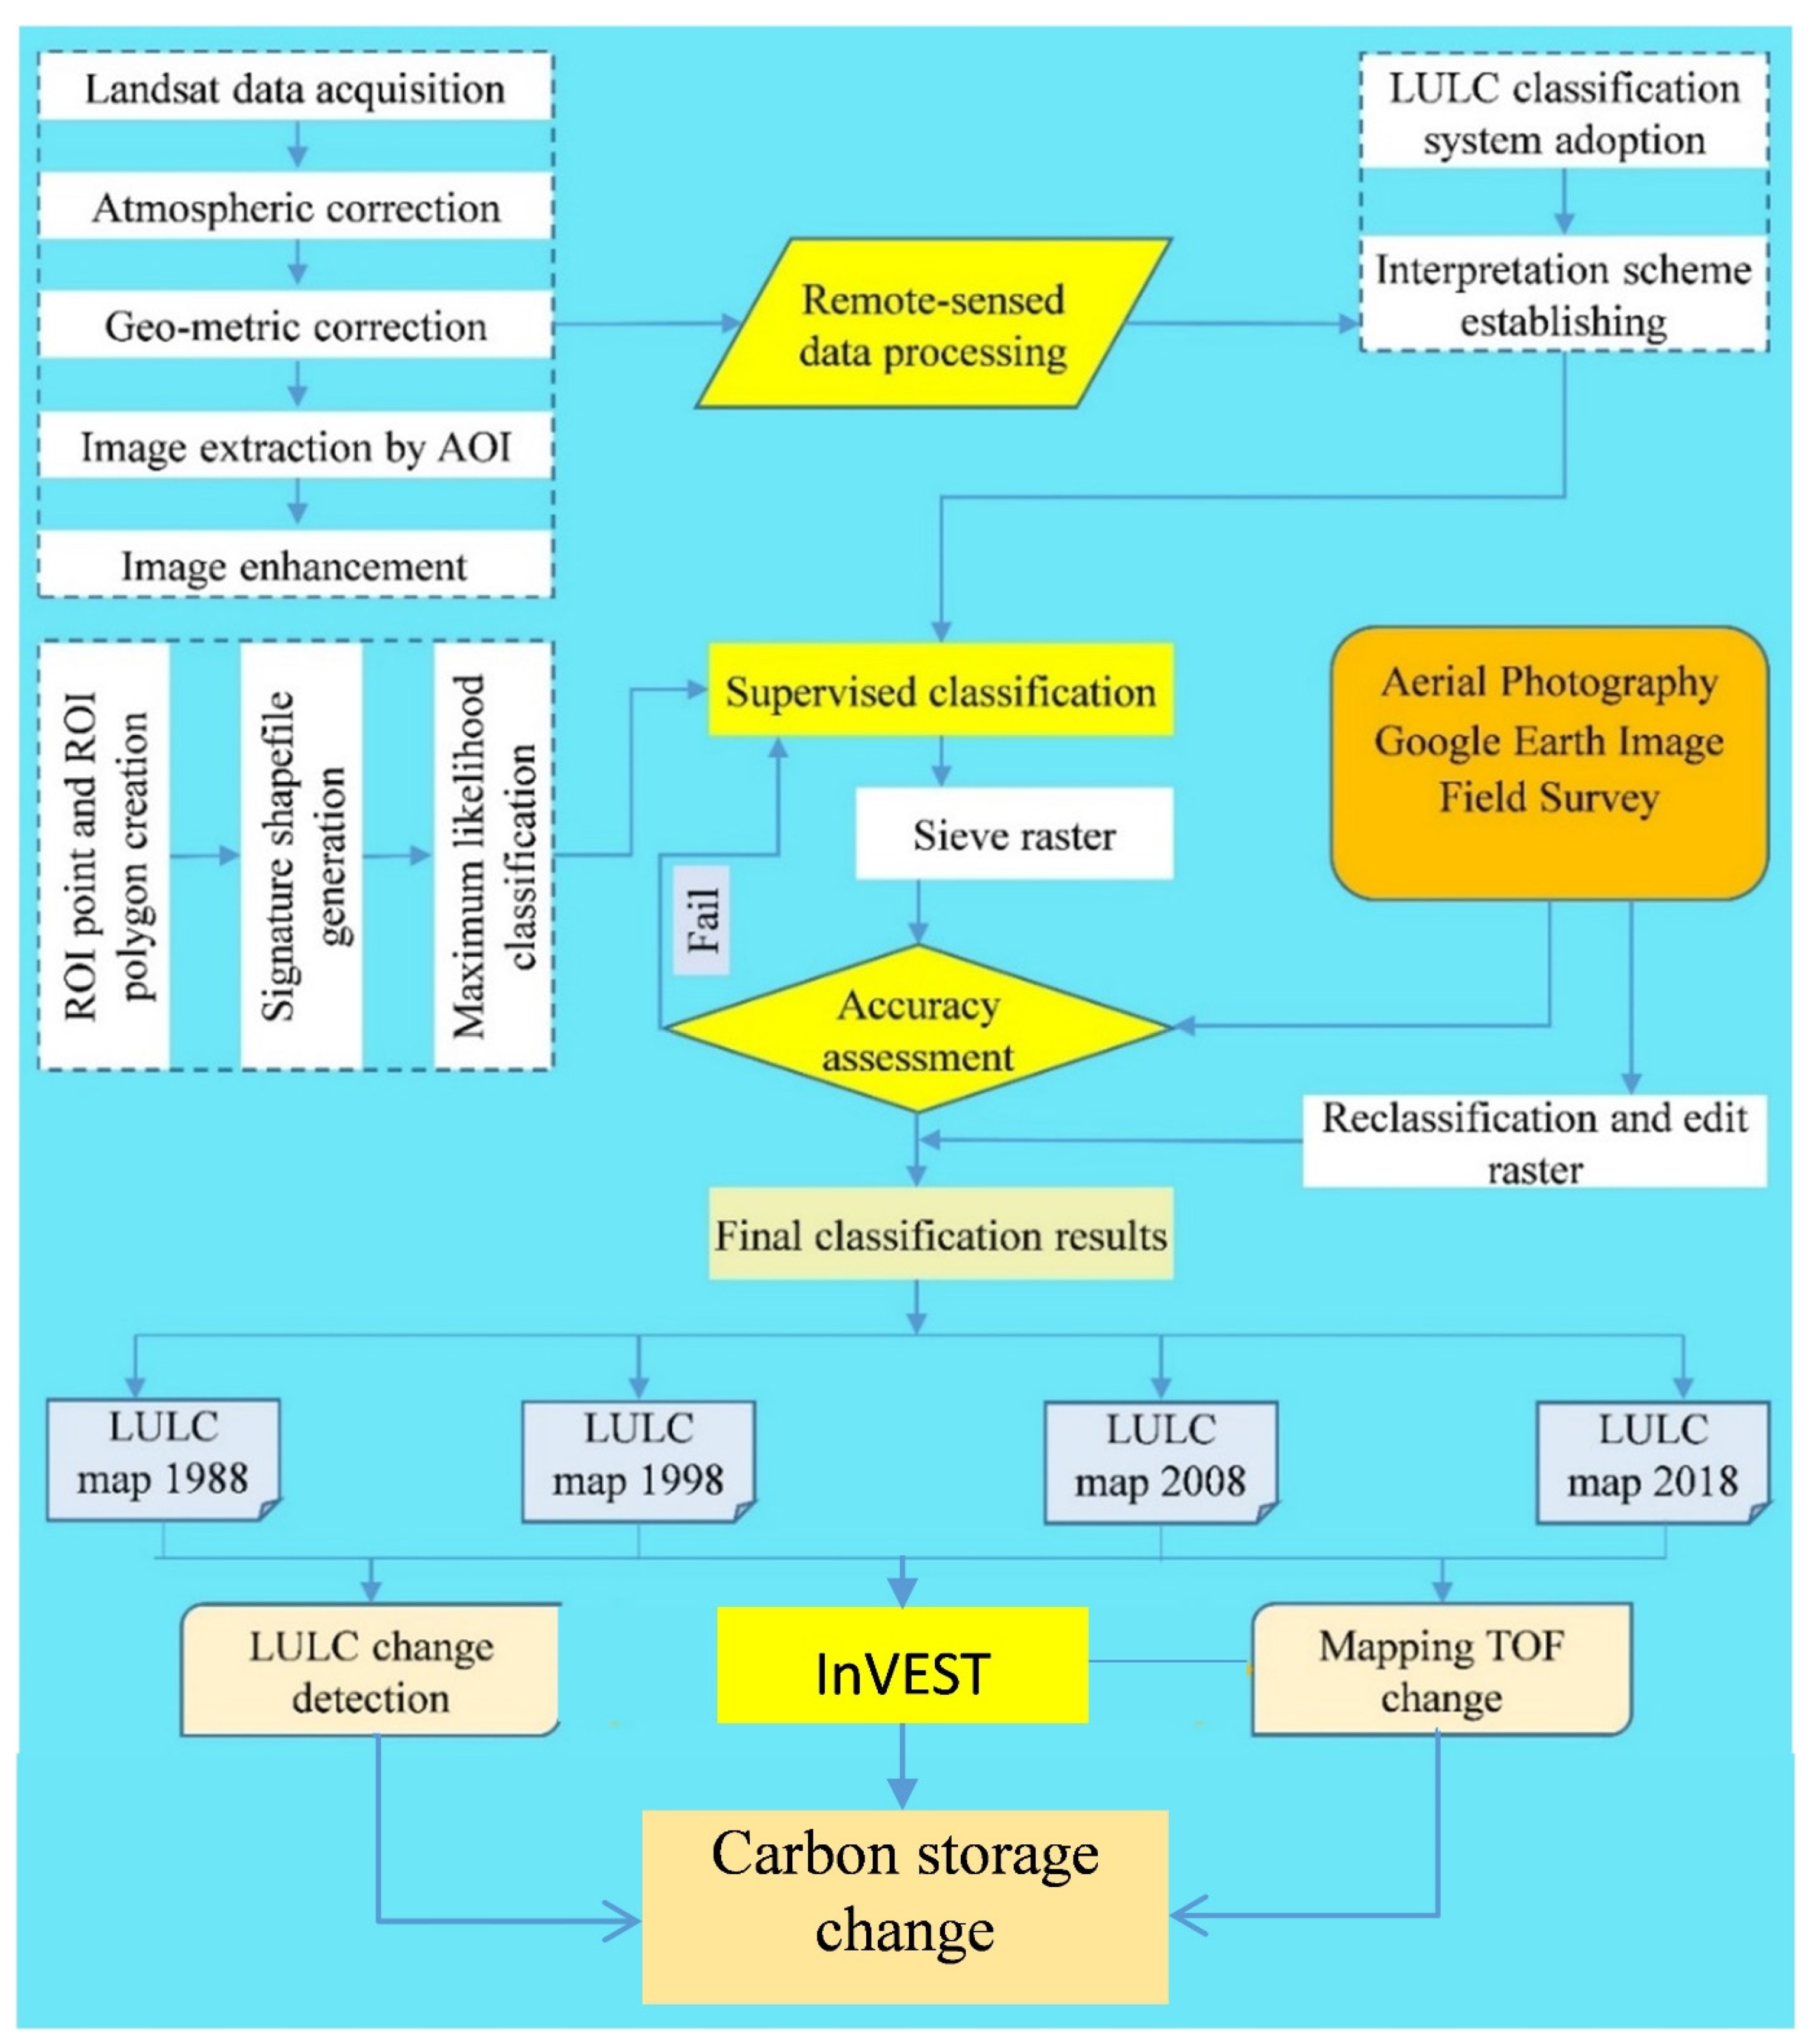
2.3. Image Processing

Atmospheric correction and image projection were performed through R statistical software version R-3.4.2 [40]. Layer stacking and mosaicking were performed through the QGIS application and ArcMap software. The ArcGIS software was used to clip the area of interest (AOI) to form a mosaic raster image using the central and eastern zone boundaries (shapefile). Multiband images were set as false-color composites—a Red:Green:Blue (4:3:2) channel (Figure S1). An experimental input file was created for predefined “classes”, e.g., agricultural land, TOF, mangroves, mudflats, built-up land, water bodies, saltpan/shrimp, and hill vegetation (Table 1). Google Earth imagery, the global positioning system (GPS), ground monitoring points, and digital elevation models (DEMs) were the sources of the experimental data (Figure 2).

2.4. Image Classification

A semi-automatic classification plug-in (also known as supervised classification) was implemented for image processing. Geospatial analysis was used to identify the materials in an image according to their spectral signatures in QGIS. First, we set the multiband images as false-color composites: R G B = 5 4 3 of Landsat 8 images and R G B = 4 3 2 of Landsat 4–5 TM images. A Macroclass ID is a batch of regions of interest (ROIs) having numerous Class IDs, which helps to classify materials that have various spectral signatures in the same type of land cover class. This study considered eight macro land cover classes: agricultural land, TOF, mangrove forests, bare land, built-up land, water bodies, aquaculture/saltpan, and hilly vegetation by composing different micro classes (Table 1). The maximum likelihood algorithm was used for image classification (Figure 2).

2.5. Accuracy Assessment

After the classification process, we developed an error matrix to assess the accuracy of the land cover classification to identify and measure map errors. The error matrix provided the user’s accuracy, producer’s accuracy, kappa statistics, and overall accuracy. Accuracy assessment results (Table S2) revealed that overall Kappa statistics were found to be 0.97, 0.99, 0.91, and 0.99, while overall accuracy was found to be 0.98, 0.97, 0.94, and 0.99 for the LULC images of 1988, 1998, 2008, and 2018, respectively. The producer’s and user’s accuracy values of each LULC class were relatively high, ranging from 0.71 to 1.00 and 0.63 to 1.00, respectively. Kappa indices and the overall accuracy of LULC classification indicated that the LULC classification was consistently accurate enough for long-term quantitative research on land use change [9].

2.6. LULC Map Creation, Change Analysis and Mapping TOF Change

The finalization of LULC classification was directed towards creating LULC maps of 1988, 1998, 2008, and 2018 using the ArcMap 10.3 software. From the LULC maps, we calculated the land area under each LULC category. Then, inter-land transformation among different LULC categories was measured by cross-tabulation functions. We estimated the amount of land gain or loss over each 10-year interval and their change rates by using the following equation [41]:
Total   LULC   gain   or   loss = A 2 A 1
Percentage   of   LULC   gain   or   loss = A 2 A 1 A t × 100
where A1, A2, and At represent the initial, final, and total areas (km2) of LULC, respectively.
From the LULC maps of different years, we extracted the area of TOF land cover via the reclassification function. The historical changes of TOF were calculated from the change detection results and mapped through ArcMap 10.3.

2.7. Carbon Storage Estimation

Developing a database of carbon reserves for the efficient monitoring and maintenance of the earth’s ecosystems requires the assessment of the effects of LULC changes on regional carbon storage. Model-based assessment has increased in relevance among the numerous approaches to assess carbon storage in diverse ecosystems due to its ability to evaluate carbon stores and sequestration capability at various geographical scales utilizing LULC change data. Sun et al. (2018) used the InVEST model to quantify changes in LULC types in the Atlanta metropolitan region, USA, and estimate their implications on carbon storage in various nations. The InVEST model is an ecosystem assessment tool that may be used to quantitatively analyze and present the outcomes of various ecosystem service functions such as carbon storage, habitat quality, soil retention, water yield, food production, and so on. To quantify the carbon storage of eastern coastal region of Bangladesh, we used the InVEST carbon model [26,42]. Based on four carbon pools, this model calculated the quantity of carbon stored and sequestered at a 30 m spatial resolution (above-ground biomass, belowground biomass, soil carbon, and carbon in dead litter) [12]. The CS quantity of the study area was estimated by multiplying the average carbon density of each LULC type’s four carbon pools by their respective regions using the formula:
C = k = 1 n A k × ( C k , a + C k , b + C k , s + C k , d )
where C is the total carbon storage in the study area, Ak is the area of LULC type k, and the four parameters of carbon density in LULC type k are above-ground biomass (Ck,a, Mg ha−1), belowground biomass (Ck,b, Mg ha−1), soil organic carbon (Ck,s, Mg ha−1), and dead organic matter (Ck,d, Mg ha−1).
In 2015, the Forest Department, Bangladesh undertook a carbon inventory in several ecological zones to estimate the carbon pools of various LULC types, focusing on CS in forest and tree vegetation [13,14,43]. However, no particular investigations on the carbon pools in the research region have been carried out so far. As a result, we used the carbon coefficients from the government’s carbon inventory reports and other scientific papers with similar landscape settings to calculate the carbon coefficients (Table 2) of all four carbon pools [13,14,44,45]. TOF comprises agroforestry systems, village woodlots, and tree planting on degraded areas, near buildings, and along highways [46]. In contrast, hill vegetation consists of tropical evergreen and semi-evergreen vegetation with a great diversity of trees, bamboo, and shrub species of ecological value [47].

3. Results

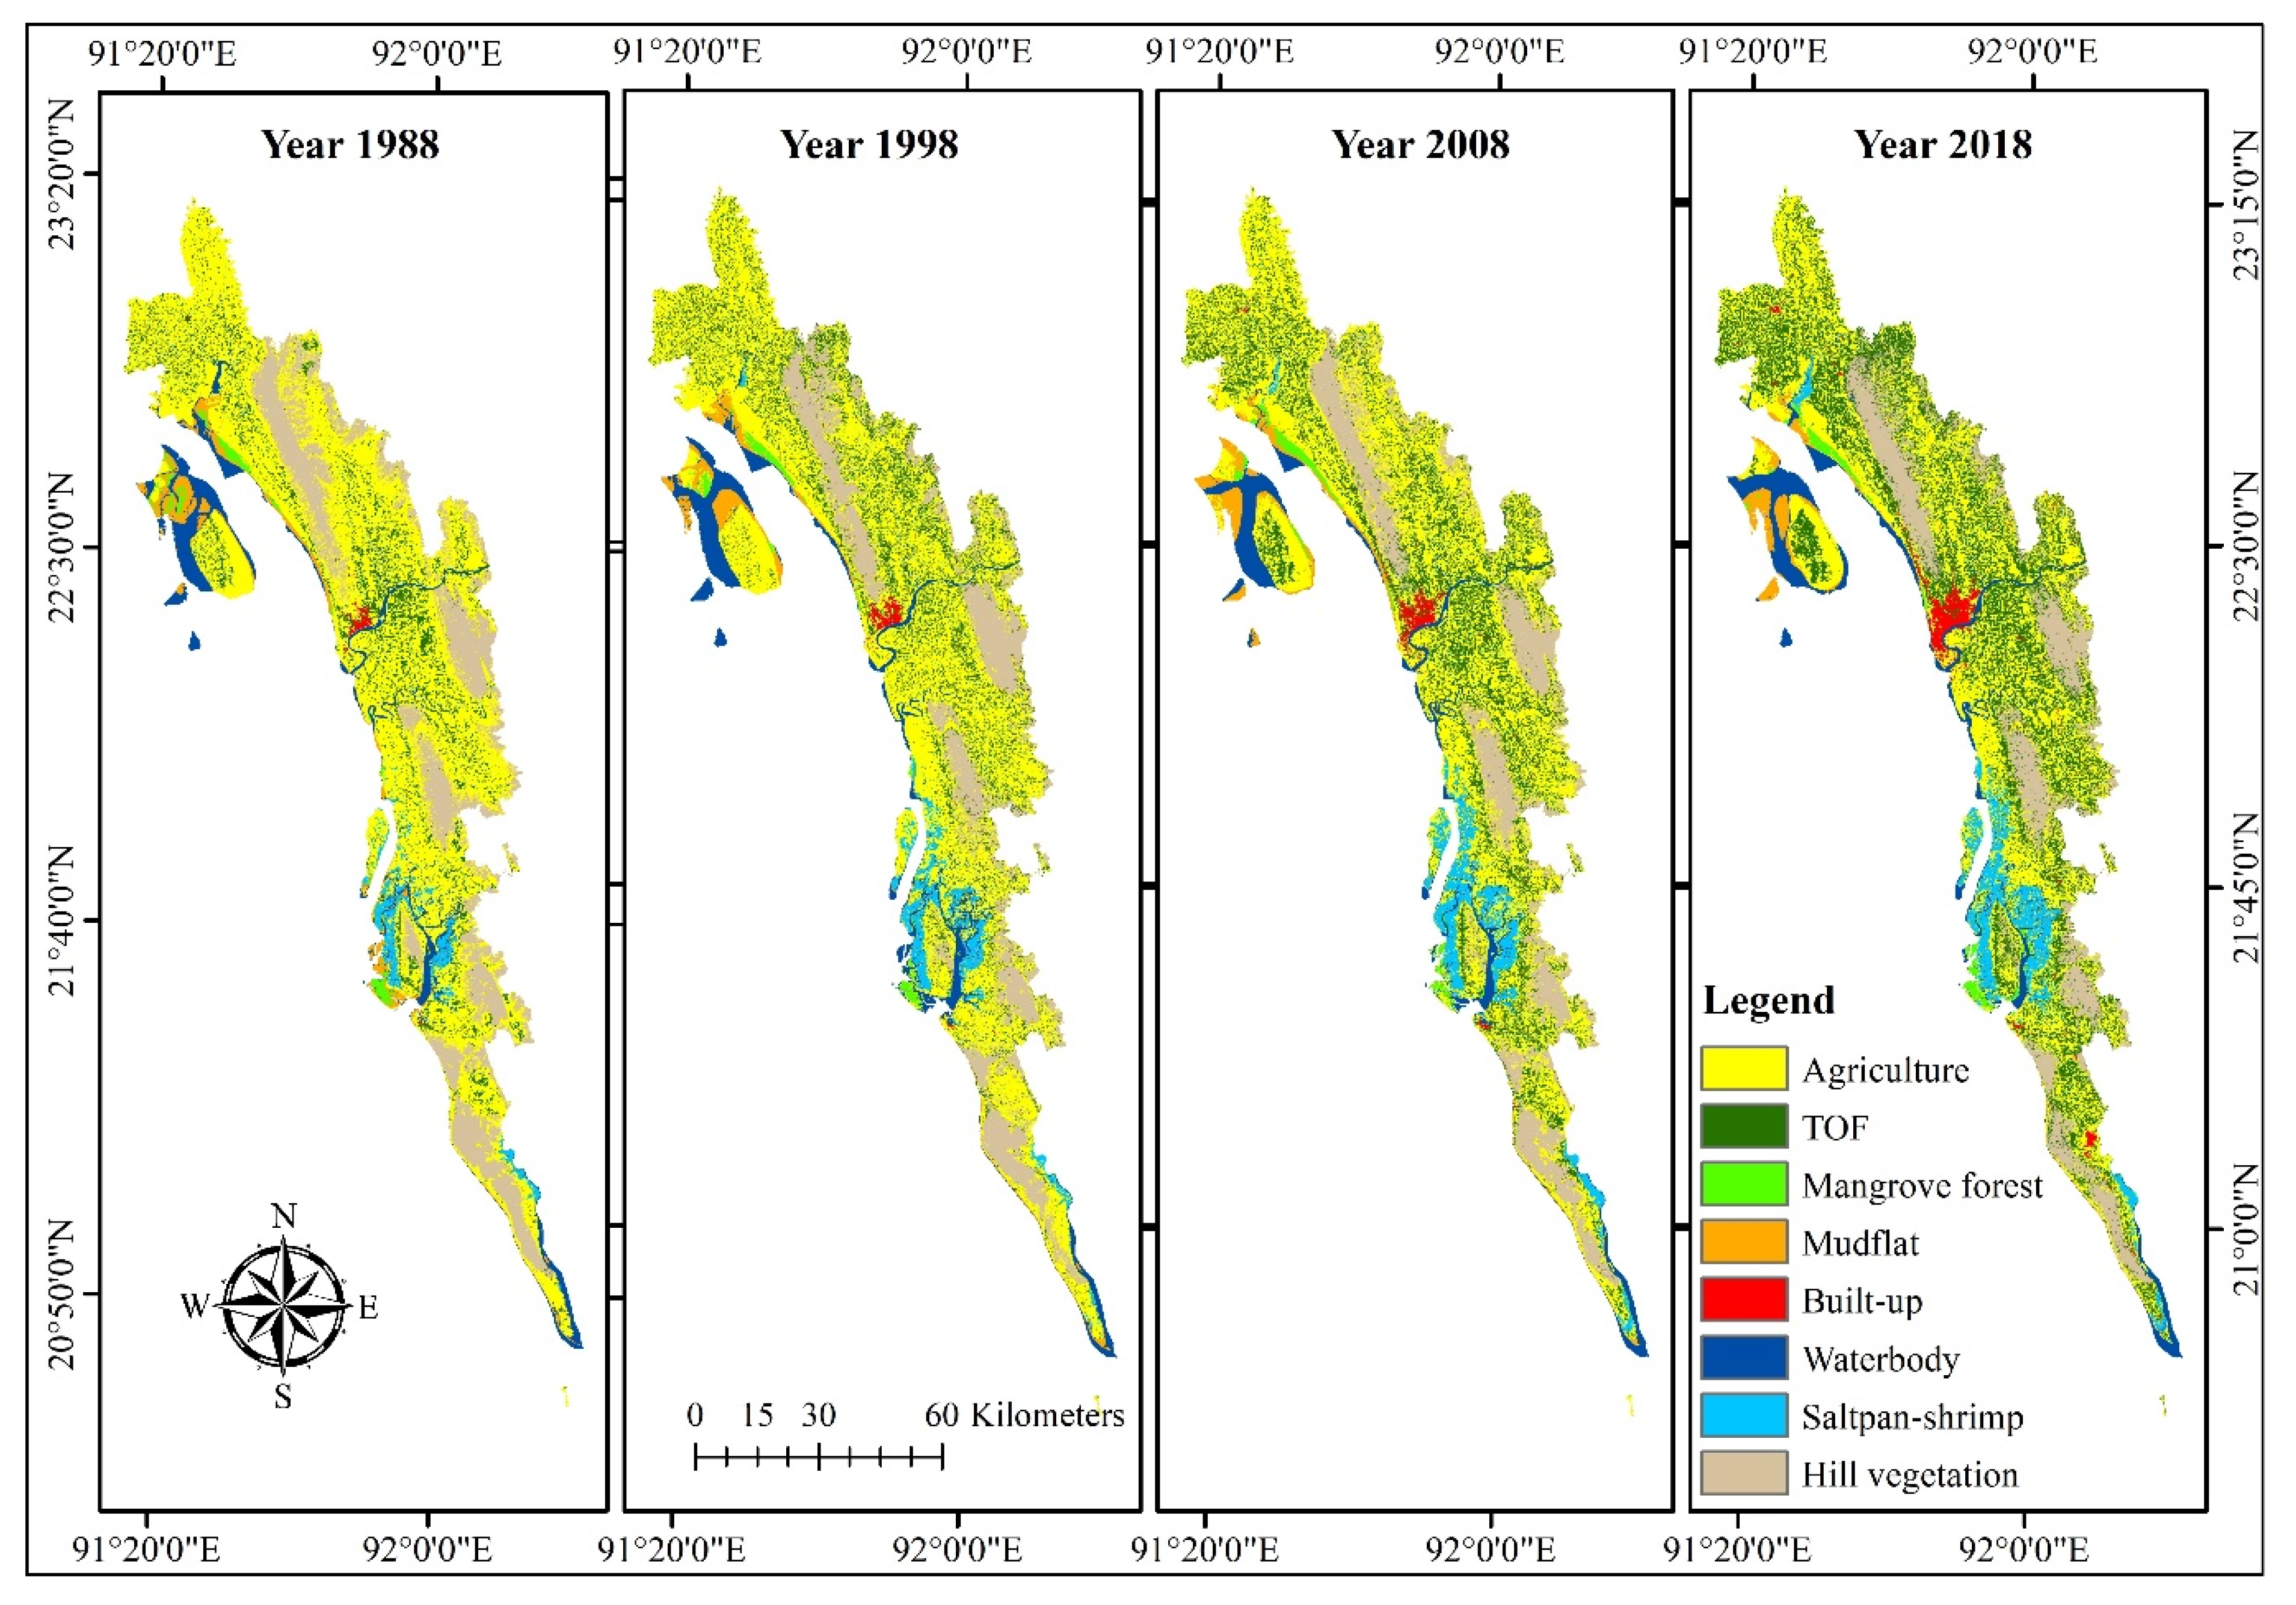
3.1. LULC Change during 1988–2018

Agricultural lands are the dominant LULC types in the eastern coastal zone of Bangladesh, constituting 56.1% of the study area in 1988, which dropped to 52.7% in 1998, 47.3% in 2008, and 40% in 2018, with an overall annual decreasing rate of 0.54% (Table 3). Similarly, the proportion of mudflats, water bodies, and hill vegetation decreased from 1988 to 2018. The hill vegetation significantly decreased from 20.7% in 1988 to 16.1% in 2018, when water bodies and mudflats decreased to comparatively low proportions (7.1% and 3.2% in 1988 to 6.3% and 2.2% in 2018, respectively). However, the proportion of TOF, built-up land, and salt pan areas increased significantly from 1988 to 2018. Although the saltpan/shrimp production and built-up areas shared a minor portion of the total land area, significant increasing rates of those land classes were observed from 2.1% to 4.9% and from 0.3% to 1.7%, respectively, over the 30 years. The proportion of TOF in the study area was 9.5% of the study area in 1988, dramatically increasing to 27.7% in 2018 with an annual increase rate of 0.61% (Table 3, Figure 3).
In addition to the agricultural and hill vegetation land, the TOF becomes another major LULC type in the study area. For 1988–1998, 1998–2008, and 2008–2018, the agricultural land and hill vegetation experienced the highest decline, whereas TOF showed the highest increase.
The spatio-temporal distribution of LULC of the study area is presented in Figure 3 for 1988, 1998, 2008, and 2018. The decrease in agricultural land was almost unevenly distributed across the entire study area. However, the expansion of the built-up areas was mostly confined around the Chittagong metropolitan area, the district headquarters of Feni and Cox’s Bazar. Some rural areas such as Kutuplang of Tekhnaf Upazilla in Cox’s Bazar district displayed an increasing built-up area from the later period of 2017 to accommodate the Rohingya population being fled from Myanmar. This also caused the severe destruction of hill vegetation. Moreover, the expansion of salt pan was mostly distributed near the sea shoreline, intermittent areas of wetlands, and water bodies in Moheshkali, Chakaria, and Sadar Upazilla of Cox’s Bazar district (Figure 3).

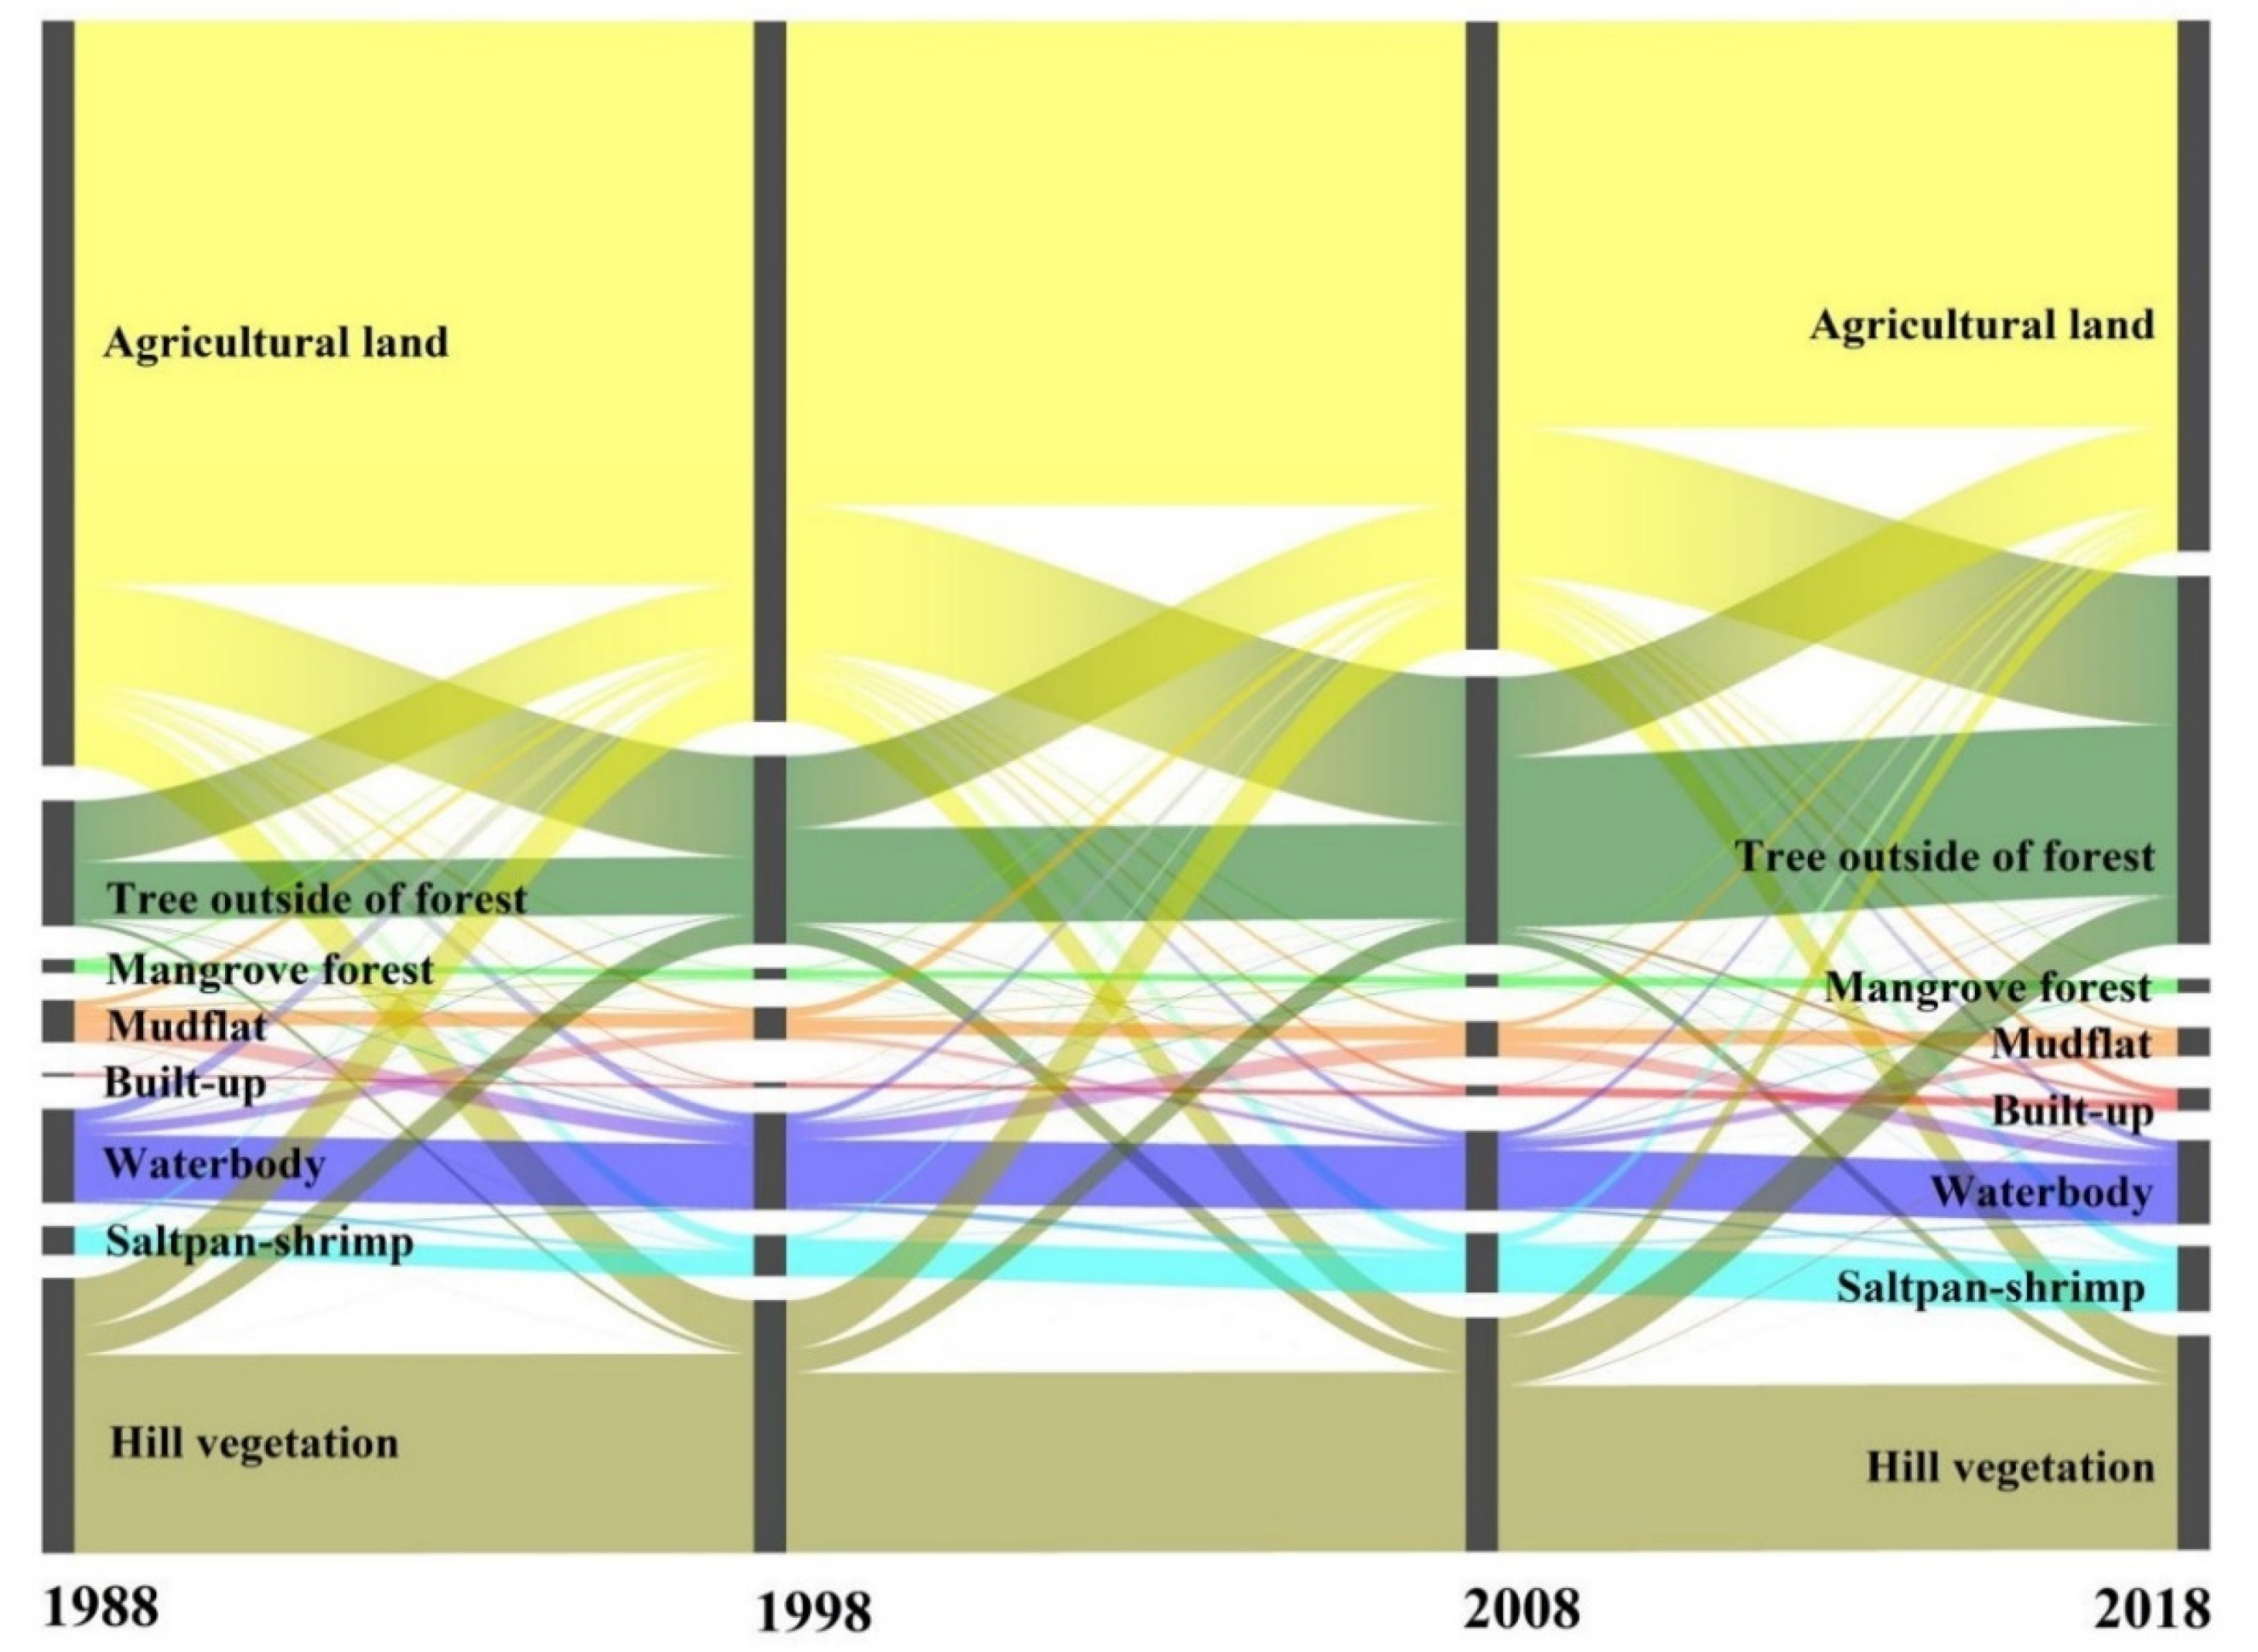
3.2. Dynamics of LULC Transformation during 1988–2018

The long-term analysis of LULC change in eastern coastal Bangladesh showed that the region experienced complex LULC transitions. The LULC transition matrix was developed for 1988–1998, 1998–2008, and 2008–2018. The LULC transition matrix calculated the acreage of land areas gained, lost, or persisted under different land use classes (Table S3, Figure 4). During 1988–1998, the transfer amount of agricultural land, TOF, mudflats, and hill vegetation was rather significant (Figure 4). Between 1988 and 1998, 60,748 ha of agricultural land was converted to TOF, 28,881 ha to hill vegetation, 7989 ha to saltpan/aquaculture, and 6531 ha to water bodies, while reversely, 36,653 ha of TOF, 28,976 ha of hill vegetation, 7771 ha water bodies, and 4125 ha of mudflats were transformed to agricultural land. In total, 10,039 ha of mudflat land was converted to water bodies, and 4126 ha to agricultural land, while reversely, 6824 ha of water bodies and 2821 ha of agricultural land was converted to mudflats. In total, 16,714 ha of hill vegetation was converted to TOF, which indicated the widespread destruction of hill vegetation for human settlement construction and the plantation of trees around them later. Between 1998 and 2008, 88,155 ha of agricultural land was converted to TOF, 20,772 ha to hill vegetation, 9568 ha to saltpan/aquaculture, and 4543 ha to water bodies, while reversely, 43,282 ha of TOF, 28,860 ha of hill vegetation, 4808 ha water bodies, and 6036 ha of mudflats were transformed to agricultural land. In total, 3327 ha of mudflat land was converted to water bodies, while conversely, 9785 ha of water bodies, and 2536 ha of agricultural land was converted to mudflats. In total, 14,309 ha of hill vegetation was converted to TOF, while conversely, 11,506 ha of TOF was converted to hill vegetation. Between 2008 and 2018, 89,108 ha of agricultural land was converted to TOF, 22,085 ha to hill vegetation, 8782 ha to saltpan/aquaculture, and 4878 ha to water bodies, while reversely, 47,947 ha of TOF, 11,419 ha of hill vegetation, 3960 ha of water bodies, and 3600 ha of mudflats were transformed to agricultural land. A total of 8130 ha of mudflat land was converted to water bodies, while conversely, 5304 ha of water bodies and 2428 ha of agricultural land was converted to mudflats. In total, 28,243 ha of hill vegetation was converted to TOF, while conversely, 6684 ha of TOF was converted to hill vegetation. From the LULC transformation pattern of three decadal periods, it can be seen that both natural and anthropogenic factors influence land use changes. The anthropogenic causes were mainly agricultural reclamation and settlement construction, while erosion and accretion were the natural causes [9,12].

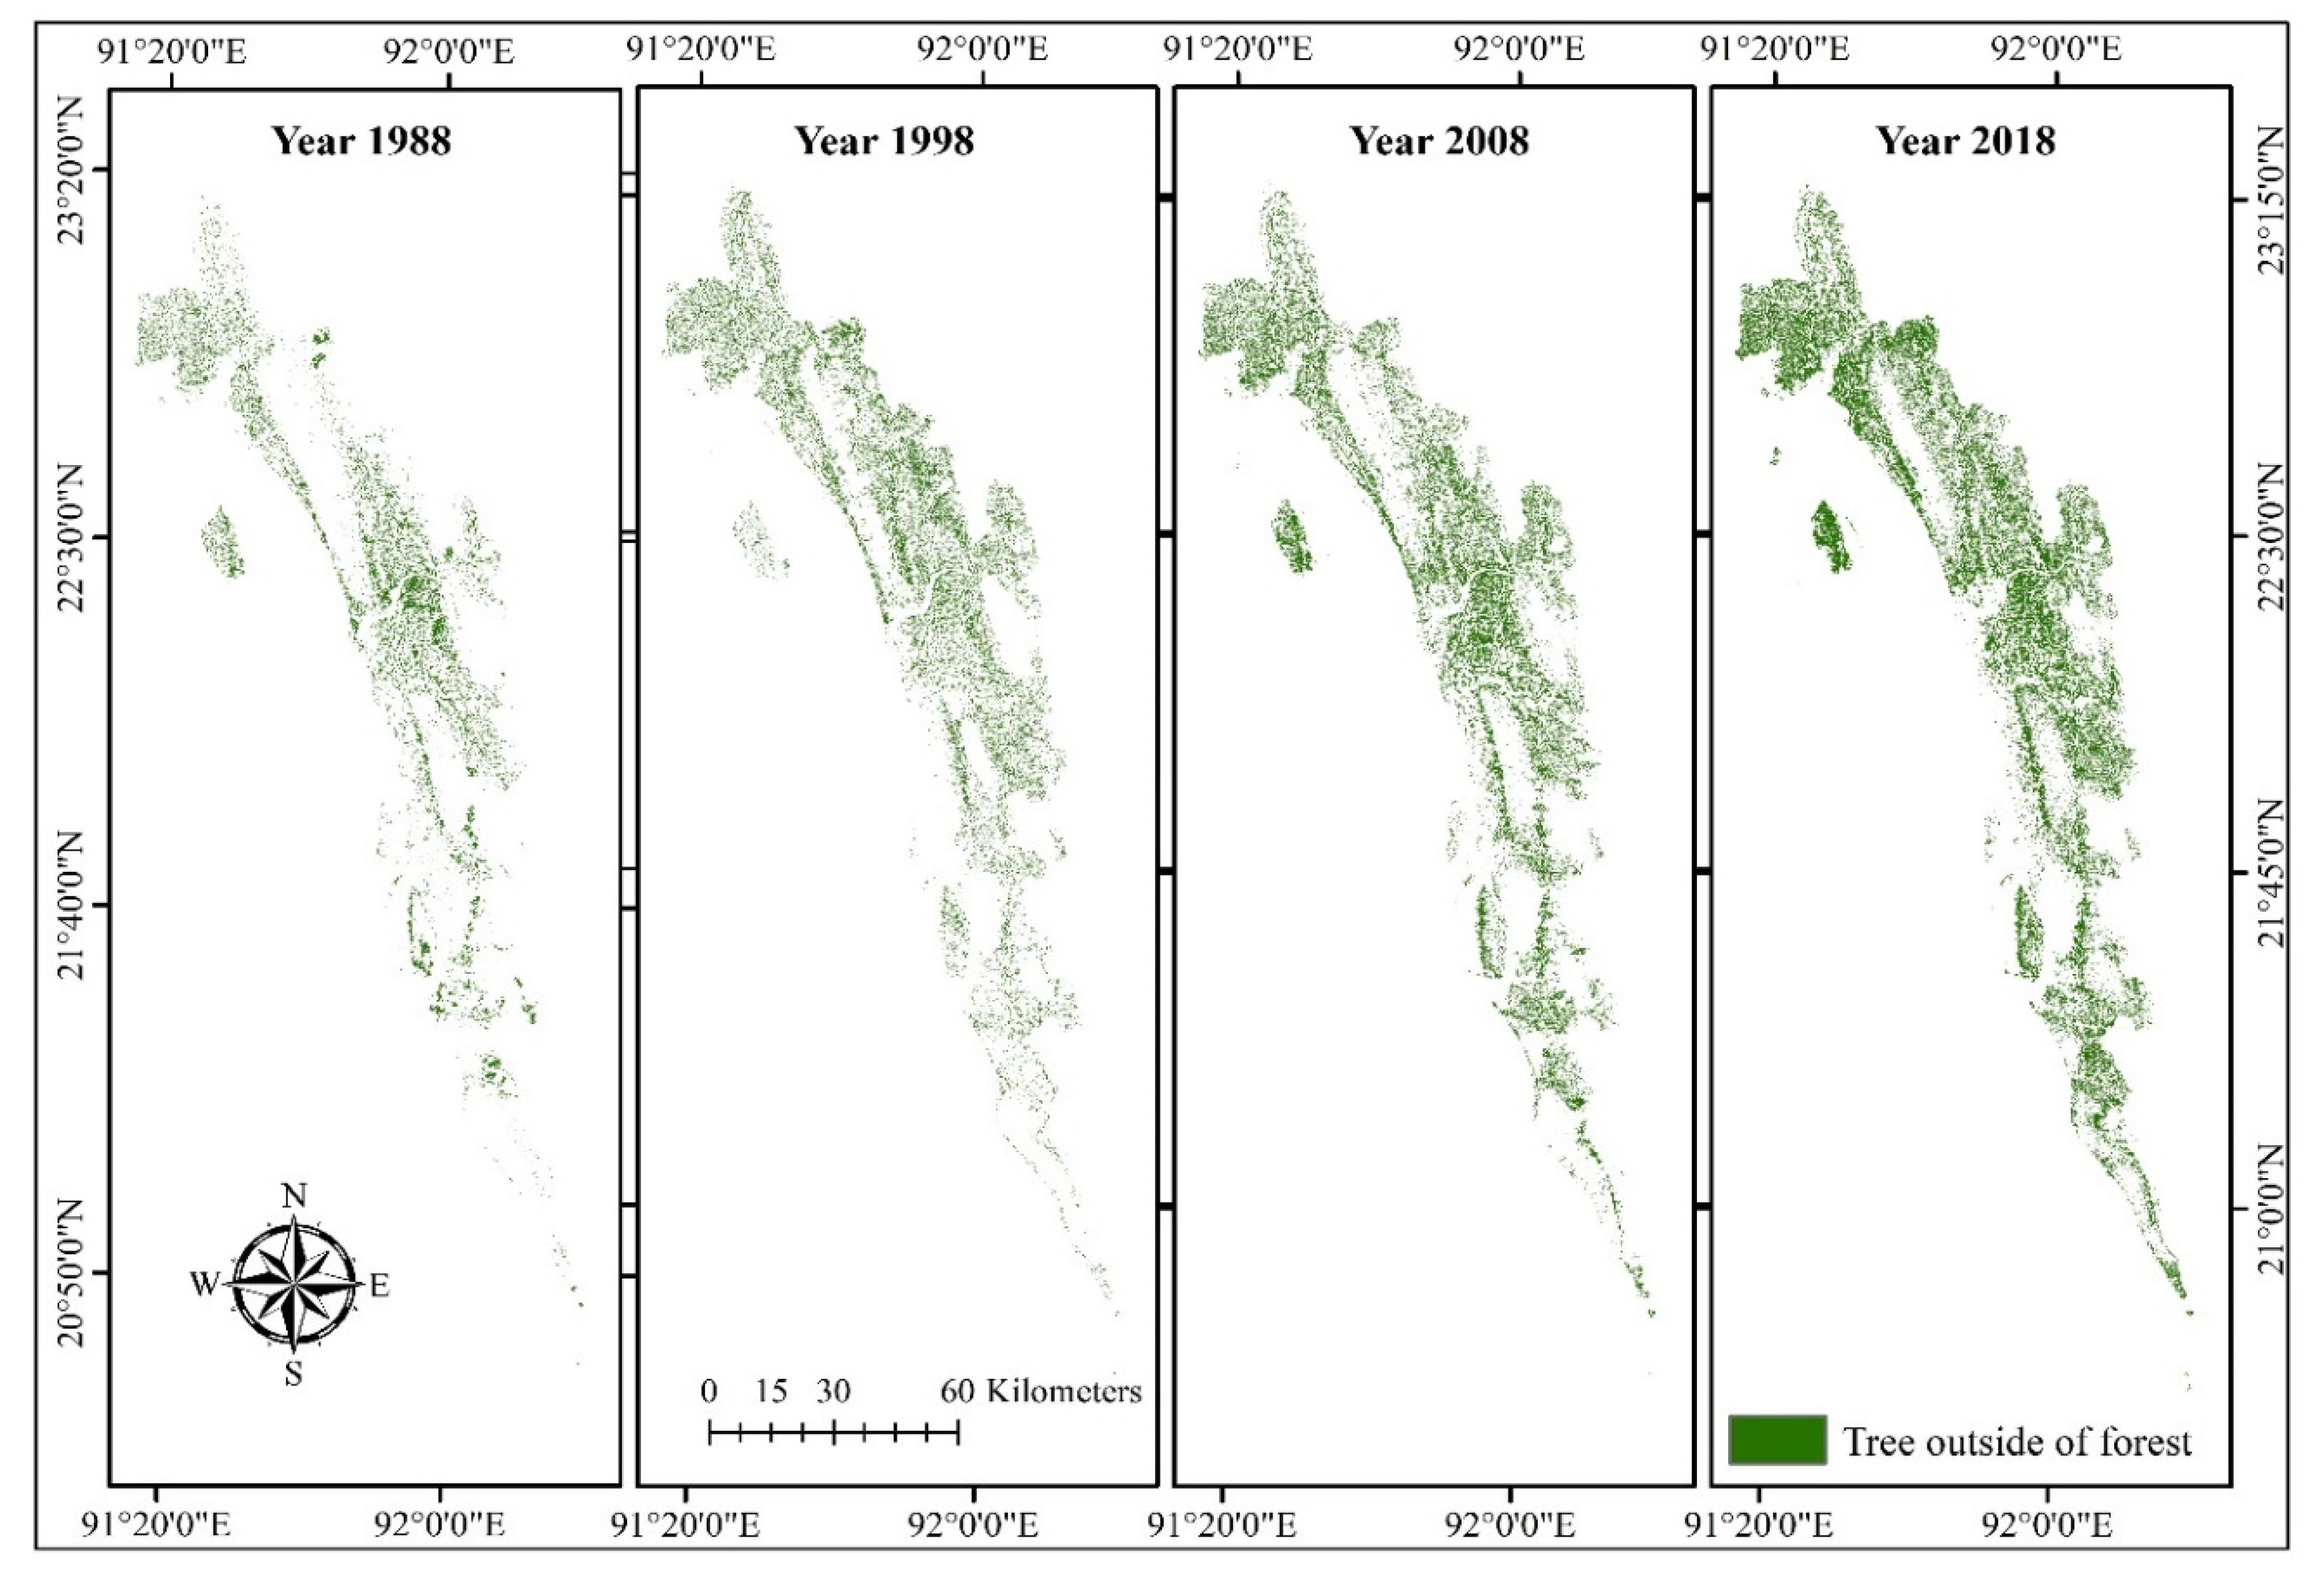
3.3. Spatio-Temporal Distribution of TOF Development during 1988–2018

From 75,322 ha in 1988, the TOF was gradually increased to 220,715 ha in 2018, with a net increase of 145,393 ha during the last three decades (Table S3). The net increase in TOF followed a rank of 2008–2018 > 1998–2008 > 1988–1998 with an area of 60,220 ha, 47,564 ha, and 37,609 ha, respectively. The gain of TOF in all three decadal periods was mostly recorded from agricultural land and hill vegetation. The total land gain from agricultural land was 89,108 ha, 88,155 ha, and 60,748 ha between 2008 and 2018, 1998 and 2008, and 1988 and 1998, respectively for TOF, whereas 28,243 ha, 14,309 ha, and 16,715 ha of TOF was gained from hill vegetation, respectively. The loss of TOF caused by agricultural land reclamations were 47,947 ha, 43,281 ha, and 36,653 ha during 2008–2018, 1998–2008, and 1988–1998, respectively (Table S3). The spatial distribution of TOF over three decadal times is presented in Figure 5. Most gains in TOF took place in the rural areas of newly developed Charland and hilly areas, though the distribution was not consistent over three decades. It was observed during the field visit that these TOF were developed by planting different species of fruit, timber, and fuelwood trees in and around the rural settlements. Hence, there is a strong linkage between population growth and the expansion of TOF. However, the expansion of rural agricultural settlements has some significant tradeoffs for the food security of Bangladesh. This conversion would be profitable in Bangladesh if = TOF could regulate climate change by supplying high carbon stocks.

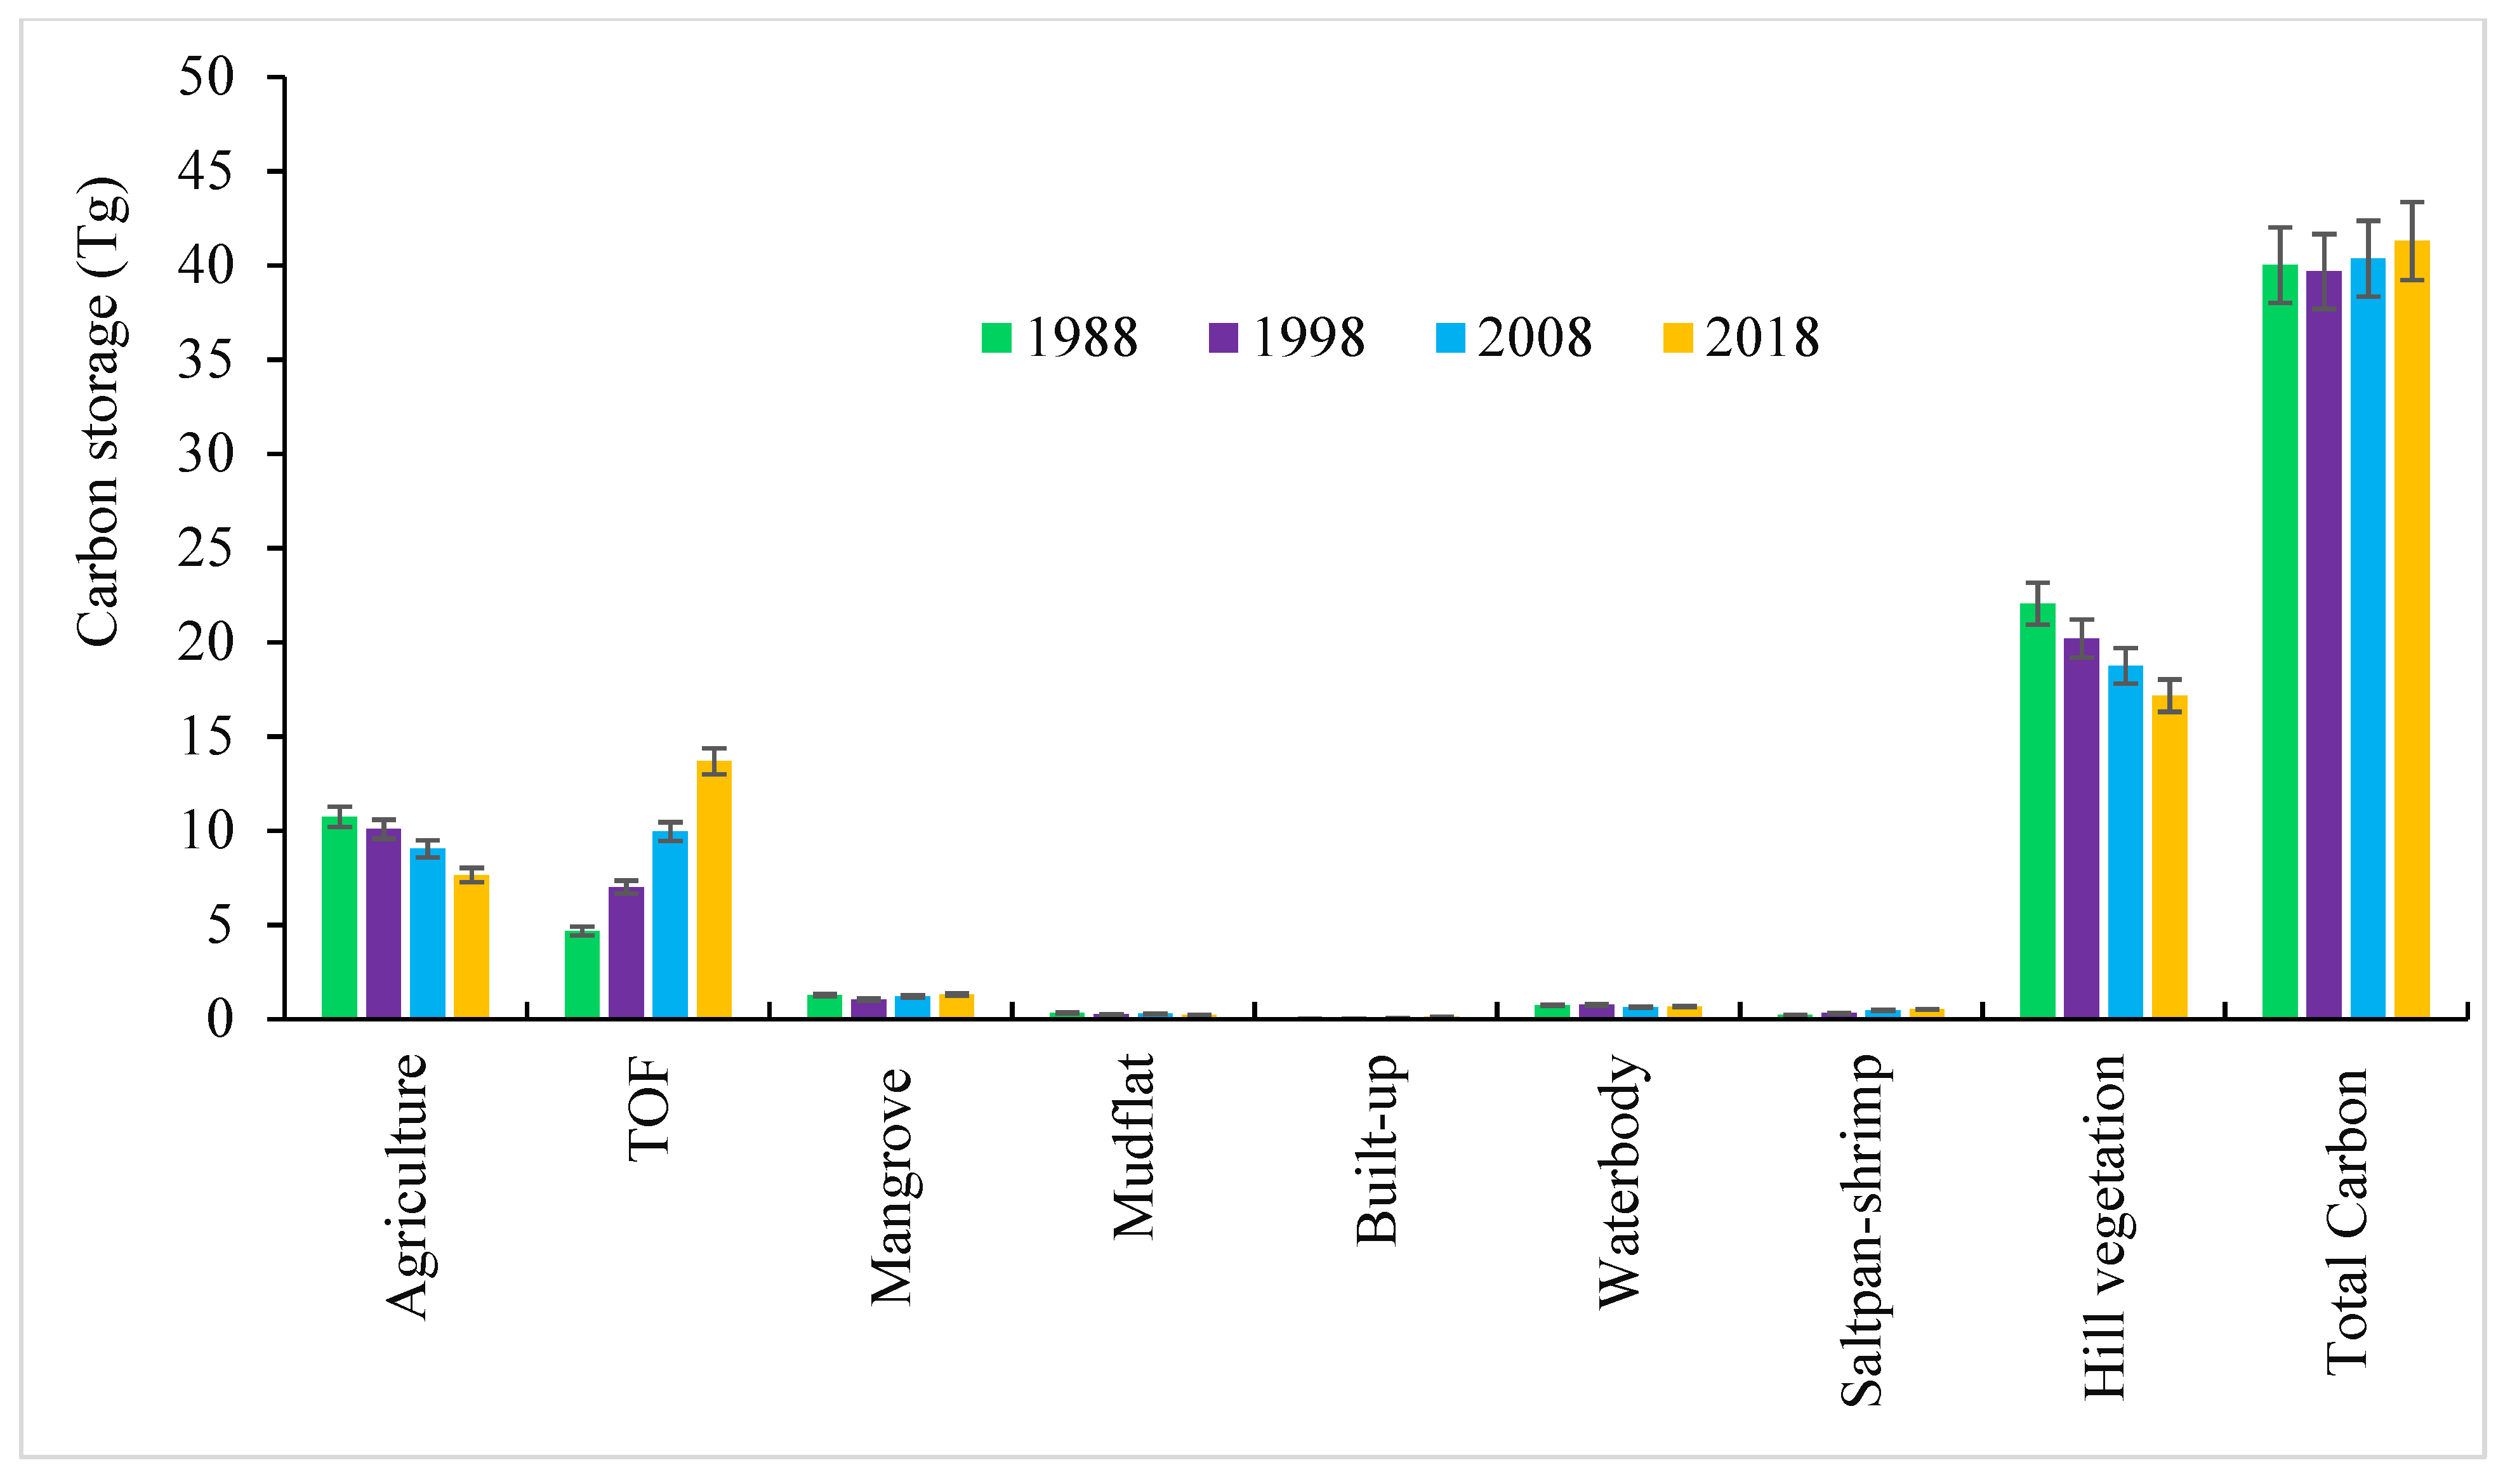
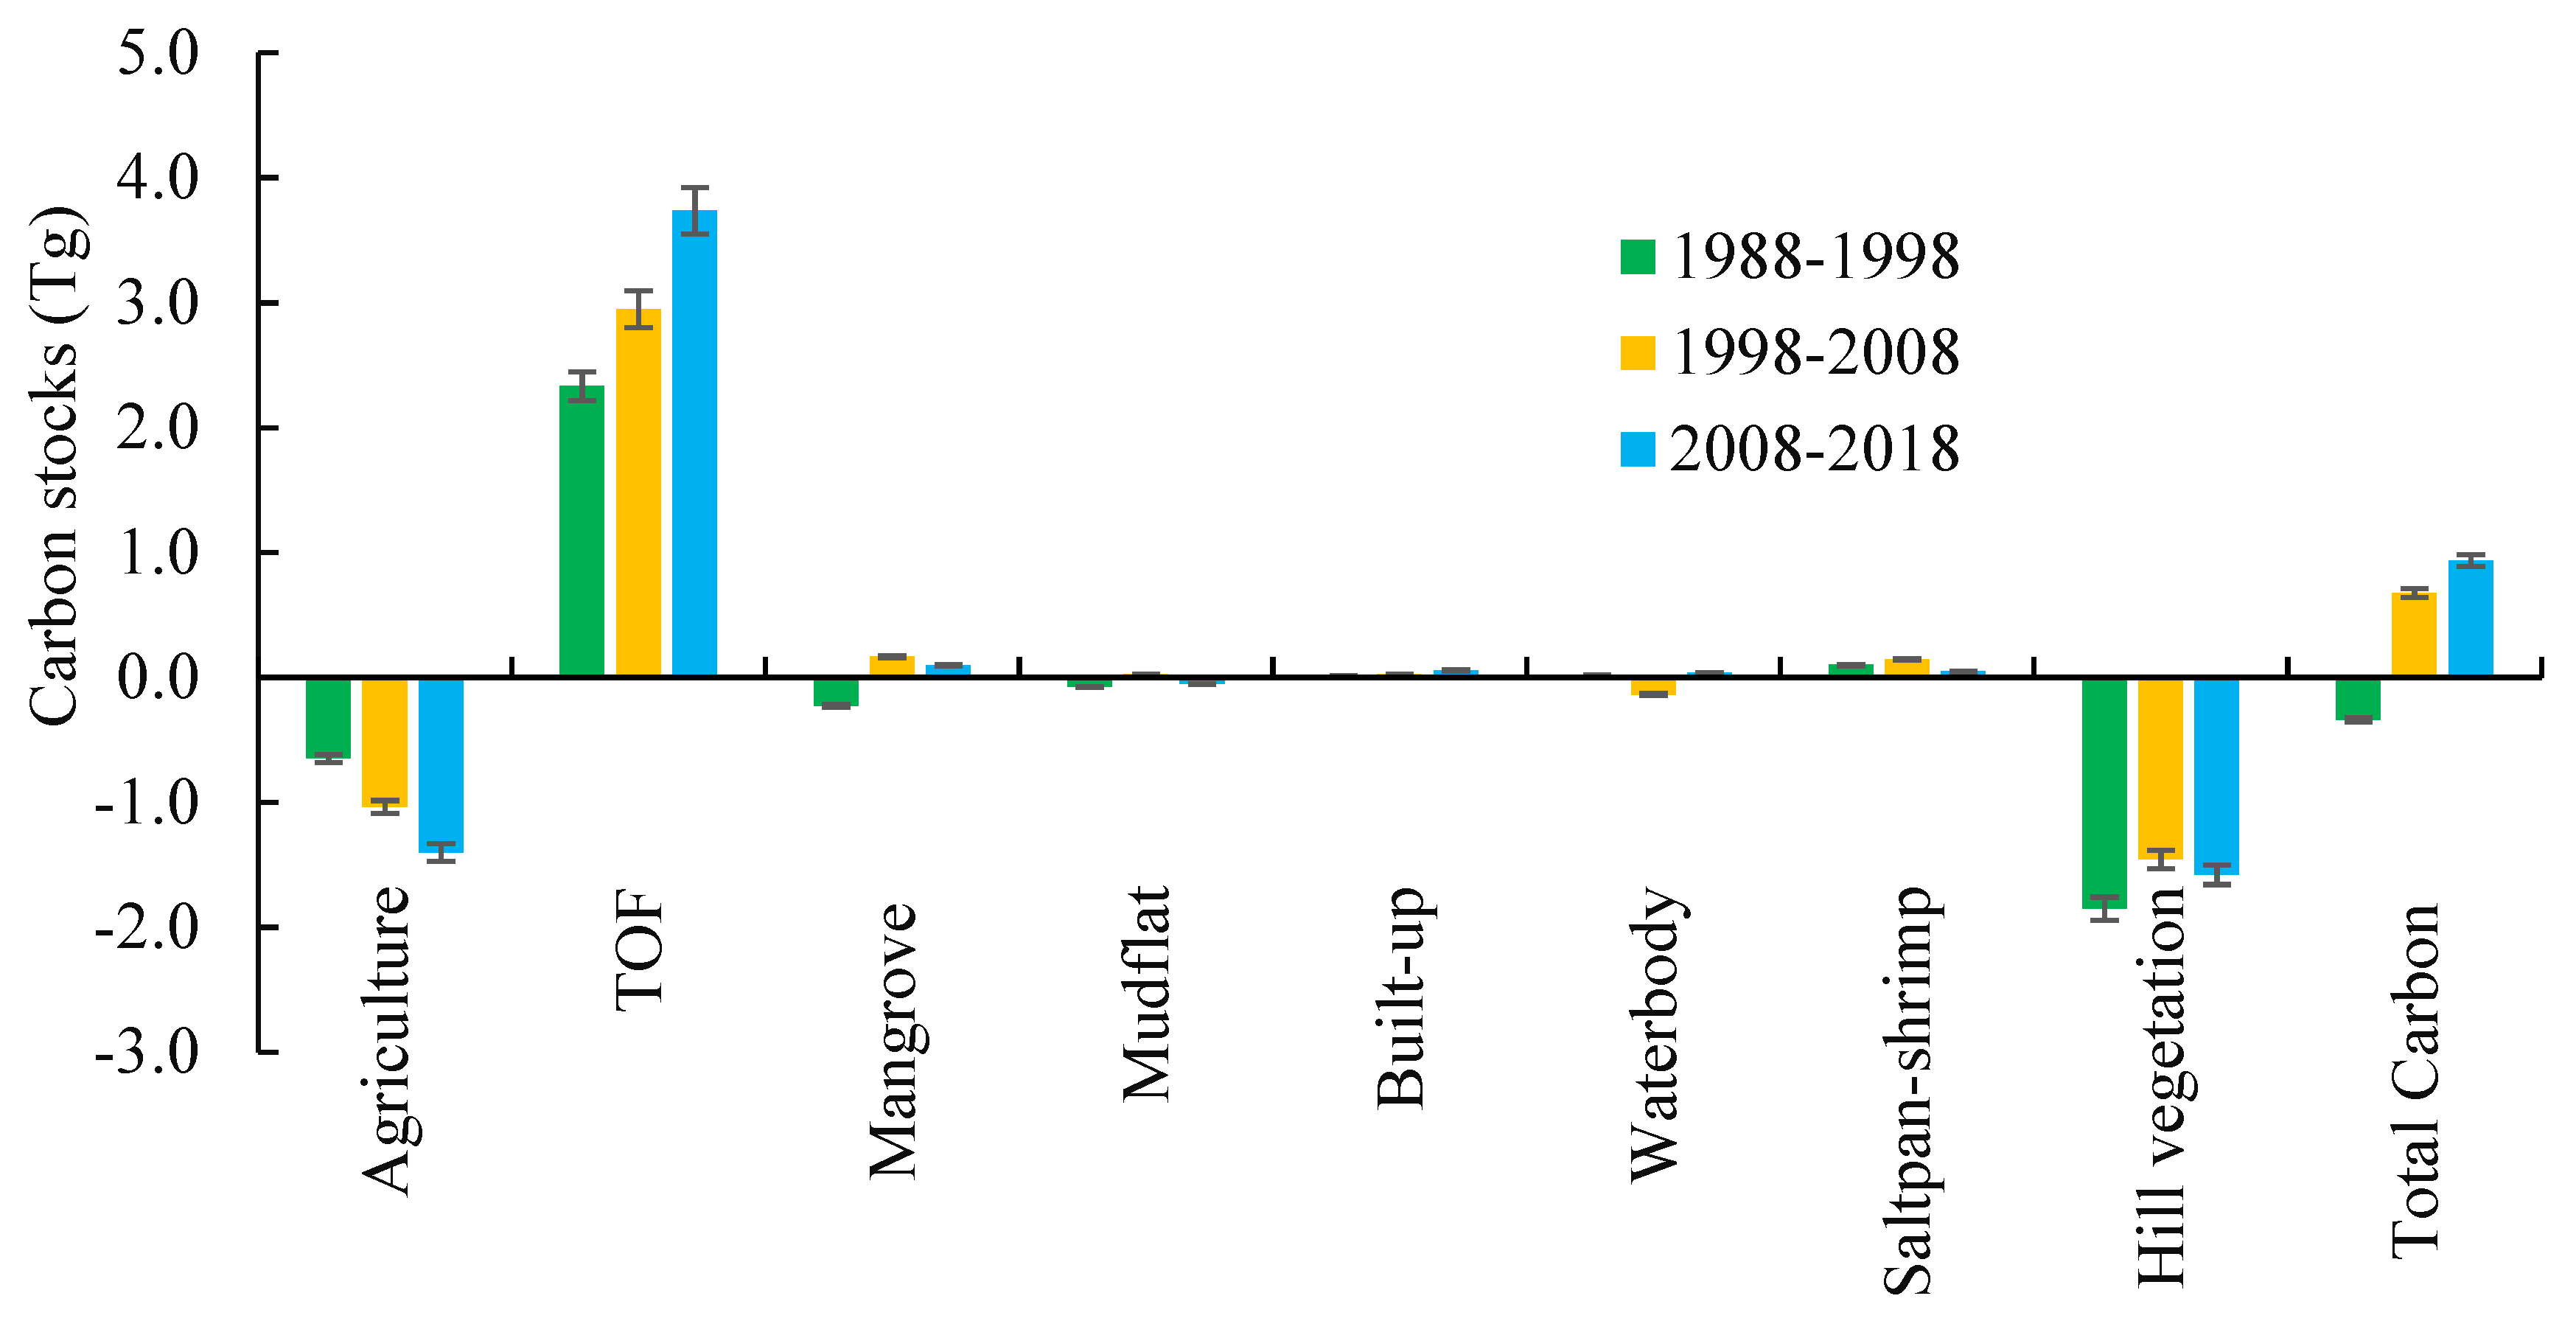
3.4. Carbon Storage Change during 1988–2018

The results of the InVEST model revealed that the total CS of the study area in 1988, 1998, 2008, and 2018 were 40.01, 39.67, 40.35, and 41.28 Tera-grams of Carbon (Tg C), respectively (Figure 6). During 1988–2018, CS increased by 1.27 Tg C, indicating that the ecosystem carbon sequestration capacity improved. Carbon reserves in the first decade (1988–1998) decreased by 0.34 Tg C, of which the loss of agricultural land and hill vegetation to rural settlement contributed more. Moreover, in 1990, the government undertook a coastal afforestation program to grow mangrove species as an effort toward REDD+ activity [12]. During 1998–2008 and 2008–2018, carbon reserves increased due to TOF and plantation mangrove forest land expansion. However, a large decrease in agricultural land, mudflats, and hill vegetation led to a sharp overall decline in regional carbon reserves during 2008–2018 (Figure 6).
Corresponding carbon stock changes in different LULC types over 1988–2018 are displayed in Figure 7. During 1988–1998, the carbon sequestration by TOF was highest (2.33 Tg C), followed by saltpan-shrimp (0.10 Tg C), water bodies (0.02 Tg C), and built-up land (0.01 Tg C). In contrast, the highest loss of carbon was reported from hill vegetation (−1.85 Tg C) followed by agricultural land (−0.65 Tg C), mangroves (−0.23 Tg C) and mudflats (−0.08 Tg C). Over 1998–2008, the largest carbon sequestration was evident in TOF (2.95 Tg C), followed by mangrove (0.17 Tg C), saltpan (0.14 Tg C), mudflats (0.02 Tg C), and built-up land (0.02 Tg C). The largest decrease in carbon storage was found in hill vegetation (−1.46 Tg C), followed by agricultural land (−1.04 Tg C), and water bodies (−0.14 Tg C). During 2008–2018, the maximum carbon sequestration was found in TOF (3.73 Tg C), while the largest decrease in carbon storage was caused by hill vegetation (−1.85 Tg C), followed by agricultural land (−1.40 Tg C) and mudflats (−0.05 Tg C). Overall, about 9.0 Tg C of carbon was sequestered by TOF development during 1988–2018, while the loss of agriculture and hill vegetation decreased carbon storage by 3.09 Tg C and 5.16 Tg C, respectively (Figure 7). During 1988−2018, 7.98 Tg C was reduced due to the conversion of agricultural and hill vegetation land to other land uses, while the large development of TOF increased carbon storage by 9.01 Tg C.

4. Discussion

4.1. TOF Development, Carbon Storage Change, and Their Drivers

This study showed that during 1988–2018, TOF in the eastern coastal region of Bangladesh increased nearly threefold. The increased TOF significantly contributed to regional carbon sequestration. The LULC transition matrix indicated that agricultural land was the primary source of rural settlement and other construction development, followed by hill vegetation. Considering this, the Forest Department of Bangladesh has undertaken many initiatives to develop TOF through different projects such as a community-based social forestry program, a roadside plantation program, and a homestead forestry program to compensate for the loss of CS from decreased agricultural and hill vegetation lands [12,14]. The total population of the coastal zone increased from 36.8 million in 2001 to 43.9 million in 2015, which will reach 60.8 million in 2030 [48]. With this population explosion and the consequent need for housing, agricultural land may be further transformed to other land uses in the future. Bangladesh has been sacrificing about 80,000 ha of agricultural land each year due to urbanization, the development of new housing, and the undertaking of other development projects [49]. Under this huge population/urbanization strain, LULC transition analysis can offer critical knowledge for the effective management of coastal areas. Therefore, reliable data should be collected to support the proper regulation of coastal resources at both regional and national levels [50,51,52,53,54].
Agricultural production on the coast was hindered by the salinity of the water, low fertility on the soil surface, heavy soil composition, minimal winter periods, and weak polder control [55,56]. Therefore, the rate of agricultural production and cropping intensity was considerably lower than in other areas of the country [16,55,56]. As a result, most farmers moved from conventional agricultural production to salt farms and/or shrimp farming by allowing saltwater into the cropland [57,58]. The area under salt panning with sequential shrimp production in the eastern coastal zone steadily increased over the last two decades, e.g., the shrimp production increased from 1.60 lakh MT in 2002 to 2.54 lakh MT in 2018 [59]. Shrimp farming has evolved as a potent sector in Asia, and shrimp is one of the leading export products in Bangladesh, which are protected by coastal barriers in farmland and mangroves [60]. However, switching to shrimp farming has had socio-environmental effects that involve agricultural land destruction, rural unemployment, marginalization, social instability, sedimentation, biodiversity loss, mangrove depletion, saltwater intrusion, contamination, and disease outbreak [61,62]. Nonetheless, rising sea levels may flood some salt pans and dramatically worsen the condition of the salt industry along with the livelihoods of approximately 20 million people engaged in salt production and/or trade [63].
Due to the sediment flow from the Meghna Deltaic zone, new lands have been gained, and the entire Meghna Deltaic zone expanded south and southwestward, acquiring a new land area of 2,146 km2 [64]. Long-term planning requires an understanding of the characteristics and value for the proper utilization of emerging new land such as forestry, agriculture, livestock, or fisheries. In the coastal region of Bangladesh, the new land has mostly been converted into agricultural land and TOF. Newly developed soils are full of nutrients, and much of this land has been put to productive uses. Since 2000, the dynamics of water and sediment flow have caused dramatic morphological changes in the coastal region and the offshore islands of Bangladesh. In addition, erosion, sedimentation, and the accretion of the Ganges–Brahmaputra–Meghna river system [65,66] reduced the land in some areas even as new land has been added in other areas. Moreover, cyclonic storms can cause the further destruction of plants as well as human life and property [67]. Under these circumstances, a series of actions have been proposed, such as plugging infringements and enhancing polders near the coastline to prevent erosion and speed up accretion [32,65].
Between 1988 and 2018, built-up land and TOF increased steadily, which can be observed by per capita annual GDP growth of 0.21% to 6.74% and urban population growth of nearly 41 million [68]. On the other hand, rapid urbanization indicates economic development, which puts more strain on the environment; even the urban population is exposed to environmental disruptions and disturbances [69]. In contrast to other cities, those in coastal areas are highly vulnerable to natural and human-made disasters. Some of this urbanization has been driven by climate disasters such as droughts, floods, cyclones, etc., which damage crops and housing, driving rural people into built-up land to pursue more stable modes of livelihood and increase their standard of living [70,71]. Landslides, for example, are the most common human-caused catastrophes in built-up areas; they are caused primarily by the (often illegal) removal of trees from hillsides [17].
Since ancient times, TOF has been an integral part of Bangladesh’s rural economy and has supplied millions of rural households with essential goods and services [17]. It is a multi-strata production system in which various plant species grow associated with animals for biodiversity conservation [72]. TOF size and structure are related to social, economic, and ecological factors. TOFs in rural Bangladesh are usually small, but the number of households proliferates with the increase in population. From 1988 to 2018, Bangladesh’s rural population increased by almost 23 million [73]. This increased population added strain on rural communities, which compelled many families to convert their TOFs to agricultural production units. TOF provides new employment opportunities, especially for women [22]. In the past, women only participated in household activities in Bangladesh, such as looking after children and other family members, preparing and serving food, etc. However, situations have gradually changed, and women are now involved in TOF farming activities such as saving seeds, planting, storing food, and advertising [74,75]. TOF gardening, particularly fruit production, is considered a significant household activity that contributes to economic well-being and family diets [76]. TOF operations are rising on a daily basis, although at the expense of agricultural land. Although rural people benefit from this increased level of TOF farming, the consequent decrease in agricultural land is a severe issue for the future food security of Bangladesh.
During the period 1988–2018, the large conversion of agricultural land to TOF and others increased regional carbon storage by 1.27 Tg C, but in the future, ensuring food security for an expanding population may prompt the further reclamation of farmland from wetlands and mangroves, resulting in a decline in total carbon storage because mangroves have a higher carbon density than TOF. The LULC pattern on the eastern coast is predicted to change rapidly in the future, owing to ongoing climate change impacts and anthropogenic activities, which might have serious repercussions for both ecosystems and livelihood wellbeing in this region. Following the growth of TOF surrounding rural settlements, it is possible that overall carbon storage may rise in the future. However, if TOF is expanded on mangrove and other natural land uses, it would have a bigger detrimental influence on the ecosystem’s biodiversity and will jeopardize their ability to protect interior areas from storms, cyclones, and other natural disasters. Furthermore, the conversion of agricultural land may result in a reduction in regional food supply, resulting in food shortages and livelihood risks for the region’s growing population as well as existing residents.

4.2. Limitations of the Study

This study came across some potential limitations that should be addressed in future research. First, we employed a supervised classification system to analyze the LULC patterns using open-source Landsat images. However, the land use pattern in coastal Bangladesh was highly complicated, with seasonal variations that might lead to misinterpretation [9]. To overcome the problem, we adopted the edit classification function of SCP in QGIS based on knowledge gained from a field visit, existing literature, and Google Earth pictures [9,12]. In addition, this study used the carbon density of distinct LULC types based on diverse carbon sources to quantify regional carbon storage [14,45,77]. As a result, it was thought that the computed carbon stocks were a rough estimate, which necessitates more research to increase accuracy by taking into account seasonal fluctuation and a local carbon estimate for each terrestrial biome. However, this deficiency has no bearing on the overall findings of the study, and it is still expected to provide significant information for government decision making. Finally, we employed the InVEST model to quantify carbon storage at a geographic scale with certain constraints in terms of assessing water bodies and undeveloped land [78].

5. Conclusions

Long-term land use and land cover change analysis for the eastern coastal region of Bangladesh, emphasizing TOF in particular, were highlighted in this study, which used satellite images and GIS/RS to analyze rapid land transformations and their impact on regional carbon storage change over thirty years during 1988 to 2018. This study revealed that rapid growth of rural settlement with the cost of agricultural and hill vegetation land and subsequent TOF development was the most significant LULC transformations. Among the different land biomes, TOF development was increased by 145,393 ha and augmented 9.01 Tg C carbon. However, agricultural land and hill vegetation decreased by 128,586 ha and 36,571 ha, which decreased carbon reserves by 3.09 Tg C and 4.89 Tg C carbon, respectively. Overall, the regional carbon reserve increased by 1.27 Tg C during 1988–2018. Land use changes in the study area affected crop production and are likely to affect the ecosystem, which could be a significant long-term threat to regional food security and ecological restoration. Nevertheless, TOF establishment is more resilient to the impacts of climate change and can withstand salinity, flooding, and control land erosion, where conventional cropping is not suitable. Moreover, it can serve as a barrier to cyclones and strong winds exposed to the coast. Massive urban expansion in Bangladesh has also created problems concerning social stabilization, reducing the overall quality of urban life and environmental balance. To support the appropriate use of Bangladesh’s limited land resources, these research findings and the geospatial data produced from land use maps can provide helpful information for policymakers, stakeholders, planners, and other concerned groups.

Supplementary Materials

The following supporting information can be downloaded at: https://www.mdpi.com/article/10.3390/land11010076/s1, Figure S1: Multiband Landsat image of eastern coastal zone of Bangladesh; Table S1: List of the satellite imageries used in this study; Table S2: Classification accuracy of different land classes for 1988, 1998, 2008, and 2018; Table S3: LULC transition matrix.

Author Contributions

Conceptualization, I.I., S.C. and M.Z.H.; methodology, I.I., S.C., M.Z.H. and H.M.A.; software, S.C.; validation, I.I. and H.M.A.; formal analysis, I.I. and M.Z.H.; investigation, I.I. and M.Z.H.; resources, S.C.; data curation, I.I.; writing—original draft preparation, I.I. and M.Z.H.; writing—review and editing, S.C., H.M.A., K.F.T., M.A., J.F., L.X. and S.D.; visualization, I.I. and M.Z.H.; supervision, S.C.; project administration, S.C.; funding acquisition, S.C. All authors have read and agreed to the published version of the manuscript.

Funding

This study was jointly funded by the Chinese Academy of Sciences—The Belt and Road Master’s Program for international students at the University of Chinese Academy of Sciences (UCAS); National Natural Science Foundation of China (41661144032); The National Key Research and Development Program of China (2017YFC0506600).

Acknowledgments

Authors extend their sincere gratitude to the experts and employees of different organizations in Bangladesh who spared us their valuable time during the data collection. USGS is acknowledged for making the Landsat data available online. We also extend earnest gratitude to the editor and anonymous reviewers for their productive comments and valuable suggestions.

Conflicts of Interest

The authors declare no conflict of interest.

Abbreviations

AOIArea of Interest
CO2Carbon Dioxide
CSCarbon Storage
DEMDigital Elevation Model
GISGeographical Information Systems
Gt Gigatonnes
haHectare
InVESTIntegrated Valuation of Ecosystem Services and Tradeoffs
km2Square Kilometers
Landsat TMLandsat Thematic Mapper
LULCLand Use/Land Cover
Mg CMegagramme Carbon (1 Mg = 1 ton)
MtMetric ton
OLI-TIRSOperational Land Imager and Thermal Infrared Sensor
Pg CPetagram Carbon (1 Pg = 1 billion tons)
REDD+Reducing Emissions from Deforestation and Forest Degradation
ROIRegion of Interest
RSRemote Sensing
SCPSemi-Automated Classification Plugins
SDGsSustainable Development Goals
TOFTree Outside Forests
Tg CTera-grams of Carbon

References

  1. Islam, K.R.; Weil, R.R. Land use effects on soil quality in a tropical forest ecosystem of Bangladesh. Agric. Ecosyst. Environ. 2000, 79, 9–16. [Google Scholar] [CrossRef]
  2. Le Quéré, C.; Andrew, R.M.; Friedlingstein, P.; Sitch, S.; Pongratz, J.; Manning, A.C.; Ivar Korsbakken, J.; Peters, G.P.; Canadell, J.G.; Jackson, R.B.; et al. Global Carbon Budget. Earth Syst. Sci. Data 2018, 10, 405–448. [Google Scholar] [CrossRef] [Green Version]
  3. FAO Forestry and Poverty Reduction. Available online: http://www.fao.org/forestry/livelihoods/en/ (accessed on 29 September 2021).
  4. GFW Global Deforestation Rates & Statistics by Country. Global Forest Watch. Available online: https://www.globalforestwatch.org/dashboards/global/?category=summary&dashboard (accessed on 25 May 2021).
  5. Leberger, R.; Rosa, I.M.D.; Guerra, C.A.; Wolf, F.; Pereira, H.M. Global patterns of forest loss across IUCN categories of protected areas. Biol. Conserv. 2020, 241, 108299. [Google Scholar] [CrossRef]
  6. Liu, Y.; Feng, Y.; Zhao, Z.; Zhang, Q.; Su, S. Socioeconomic drivers of forest loss and fragmentation: A comparison between different land use planning schemes and policy implications. Land Use Policy 2016, 54, 58–68. [Google Scholar] [CrossRef]
  7. Curtis, P.G.; Slay, C.M.; Harris, N.L.; Tyukavina, A.; Hansen, M.C. Classifying drivers of global forest loss. Science 2018, 361, 1108–1111. [Google Scholar] [CrossRef]
  8. Osland, M.J.; Feher, L.C.; López-Portillo, J.; Day, R.H.; Suman, D.O.; Guzmán Menéndez, J.M.; Rivera-Monroy, V.H. Mangrove forests in a rapidly changing world: Global change impacts and conservation opportunities along the Gulf of Mexico coast. Estuar. Coast. Shelf Sci. 2018, 214, 120–140. [Google Scholar] [CrossRef]
  9. Hoque, M.Z.; Cui, S.; Islam, I.; Xu, L.; Tang, J. Future impact of land use/land cover changes on ecosystem services in the lower meghna river estuary, Bangladesh. Sustainability 2020, 12, 2112. [Google Scholar] [CrossRef] [Green Version]
  10. Ghelardini, L.; Pepori, A.L.; Luchi, N.; Capretti, P.; Santini, A. Drivers of emerging fungal diseases of forest trees. For. Ecol. Manag. 2016, 381, 235–246. [Google Scholar] [CrossRef]
  11. Matuoka, M.A.; Benchimol, M.; Morante-Filho, J.C. Tropical forest loss drives divergent patterns in functional diversity of forest and non-forest birds. Biotropica 2020, 52, 738–748. [Google Scholar] [CrossRef]
  12. Hoque, M.Z.; Cui, S.; Islam, I.; Xu, L.; Ding, S. Dynamics of plantation forest development and ecosystem carbon storage change in coastal Bangladesh. Ecol. Indic. 2021, 130, 107954. [Google Scholar] [CrossRef]
  13. Latif, M.A.F.; Netzer, M.; Banik, H.; Chowdhury, R.M. Forest carbon inventory 2014 at eight protected areas in Bangladesh. Bangladesh For. Dep. Winrock Int. Dhaka 2015, 58, 41–42. [Google Scholar]
  14. BFD Forestry Types and Management, Bangladesh Forest Department (BFD), Dhaka. Available online: http://www.bforest.gov.bd/ (accessed on 24 February 2020).
  15. Nasim, F.A.; Hoque, M.Z.; Haque, M.E.; Islam, M.S.; Parveen, N.; Chakma, S.; Afrad, M.S.I. How Does Adoption of Crop Variety Reduce the Impact of Drought in Agriculture and Mitigate Food Insecurity of Smallholder Farmers? A Case Study on BUdhan1 Rice Variety in Bangladesh. Asian J. Agric. Ext. Econ. Sociol. 2019, 30, 1–12. [Google Scholar] [CrossRef]
  16. Hoque, M.Z.; Cui, S.; Xu, L.; Islam, I.; Tang, J.; Ding, S. Assessing agricultural livelihood vulnerability to climate change in coastal Bangladesh. Int. J. Environ. Res. Public Health 2019, 16, 4552. [Google Scholar] [CrossRef] [Green Version]
  17. Hoque, M.; Rahman, M.; Haque, M.; Afrad, M.; Rahman, M. Comparative Contribution of Crops and Homestead Forest Enterprises to Rural Household Economy: A Case Study of Keshorita Village in Bangladesh. Asian J. Adv. Agric. Res. 2018, 7, 1–16. [Google Scholar] [CrossRef]
  18. Huq, N.; Hugé, J.; Boon, E.; Gain, A.K. Climate change impacts in agricultural communities in rural areas of coastal bangladesh: A tale of many stories. Sustainability 2015, 7, 8437–8460. [Google Scholar] [CrossRef] [Green Version]
  19. Barua, S.K.; Boscolo, M.; Animon, I. Valuing forest-based ecosystem services in Bangladesh: Implications for research and policies. Ecosyst. Serv. 2020, 42, 101069. [Google Scholar] [CrossRef]
  20. Islam, M.R.; Abdullah, H.M.; Ahmed, Z.U.; Islam, I.; Ferdush, J.; Miah, M.G.; Miah, M.M.U. Monitoring the spatiotemporal dynamics of waterlogged area in southwestern Bangladesh using time series Landsat imagery. Remote Sens. Appl. Soc. Environ. 2018, 9, 52–59. [Google Scholar] [CrossRef]
  21. Abdullah, H.M.; Islam, I.; Miah, M.G.; Ahmed, Z. Quantifying the spatiotemporal patterns of forest degradation in a fragmented, rapidly urbanizing landscape: A case study of Gazipur, Bangladesh. Remote Sens. Appl. Soc. Environ. 2019, 13, 457–465. [Google Scholar] [CrossRef]
  22. Miah, M.; Ahmed, M. Traditional agroforestry in Bangladesh: Livelihood activities of the rural households. In Proceedings of the A Poster Presented at the XII World Forestry Congress, Quebec, QC, Canada, 21–28 September 2003. [Google Scholar]
  23. Irons, J.R.; Dwyer, J.L.; Barsi, J.A. The next Landsat satellite: The Landsat Data Continuity Mission. Remote Sens. Environ. 2012, 122, 11–21. [Google Scholar] [CrossRef] [Green Version]
  24. MacLachlan, A.; Biggs, E.; Roberts, G.; Boruff, B. Urban growth dynamics in Perth, Western Australia: Using applied remote sensing for sustainable future planning. Land 2017, 6, 9. [Google Scholar] [CrossRef] [Green Version]
  25. Abdullah, H.M.; Mahboob, M.G.; Banu, M.R.; Seker, D.Z. Monitoring the drastic growth of ship breaking yards in Sitakunda: A threat to the coastal environment of Bangladesh. Environ. Monit. Assess. 2013, 185, 3839–3851. [Google Scholar] [CrossRef]
  26. Liang, Y.; Hashimoto, S.; Liu, L. Integrated assessment of land-use/land-cover dynamics on carbon storage services in the Loess Plateau of China from 1995 to 2050. Ecol. Indic. 2021, 120, 106939. [Google Scholar] [CrossRef]
  27. Hernández-Guzmán, R.; Ruiz-Luna, A.; González, C. Assessing and modeling the impact of land use and changes in land cover related to carbon storage in a western basin in Mexico. Remote Sens. Appl. Soc. Environ. 2019, 13, 318–327. [Google Scholar] [CrossRef]
  28. Nelson, E.; Mendoza, G.; Regetz, J.; Polasky, S.; Tallis, H.; Cameron, D.R.; Chan, K.M.A.; Daily, G.C.; Goldstein, J.; Kareiva, P.M.; et al. Modeling multiple ecosystem services, biodiversity conservation, commodity production, and tradeoffs at landscape scales. Front. Ecol. Environ. 2009, 7, 4–11. [Google Scholar] [CrossRef]
  29. Zennaro, F.; Furlan, E.; Simeoni, C.; Torresan, S.; Aslan, S.; Critto, A.; Marcomini, A. Exploring machine learning potential for climate change risk assessment. Earth-Sci. Rev. 2021, 220, 103752. [Google Scholar] [CrossRef]
  30. Huq, N.; Bruns, A.; Ribbe, L. Interactions between freshwater ecosystem services and land cover changes in southern Bangladesh: A perspective from short-term (seasonal) and long-term (1973–2014) scale. Sci. Total Environ. 2019, 650, 132–143. [Google Scholar] [CrossRef]
  31. Hassan, M.S.; Mahmud-Ul-Islam, S.; Rahman, M.T. Integration of Remote Sensing and GIS to Assess Vulnerability of Environmental Degradation in North-Western Bangladesh. J. Geogr. Inf. Syst. 2015, 7, 494–505. [Google Scholar] [CrossRef] [Green Version]
  32. Islam, M.R.; Miah, M.G.; Inoue, Y. Analysis of Land use and Land Cover Changes in the Coastal Area of Bangladesh Using Landsat Imagery. Land Degrad. Dev. 2016, 27, 899–909. [Google Scholar] [CrossRef]
  33. Abdullah, A.Y.; Masrur, A.; Sarfaraz, M.; Adnan, G. Spatio-Temporal Patterns of Land Use/Land Cover Change in the Heterogeneous Coastal Region of Bangladesh between 1990 and 2017. Remote Sens. 2017, 7, 790. [Google Scholar] [CrossRef] [Green Version]
  34. BBS Population and Housing Census 2011, Bangladesh Bureau of Statistics, Ministry of Planning, Peoples’ Republic of Bangladesh, Dhaka, Bangladesh. 2011. Available online: http://203.112.218.65:8008/ (accessed on 27 November 2021).
  35. CDS. Coastal Development Strategy (CDS); Ministry of Water Resources: Dhaka, Bangladesh, 2006.
  36. Chowdhury, Q.S.; Hossain, Q. Bengal Delta in Banglapedia, National Encyclopedia of Bangladesh; Asiatic Society of Bangladesh: Dhaka, Bangladesh, 2006. [Google Scholar]
  37. Hossain, M.S. Biological aspects of the coastal and marine environment of Bangladesh. Ocean Coast. Manag. 2001, 44, 261–282. [Google Scholar] [CrossRef]
  38. Iftekhar, M.S. Conservation and management of the Bangladesh coastal ecosystem: Overview of an integrated approach. In Proceedings of the Natural Resources Forum; Wiley-Blackwell: Oxford, UK, 2006; Volume 30, pp. 230–237. [Google Scholar]
  39. ESRI ArcGIS Desktop: Release 10. Available online: https://www.esri.com/about/newsroom/arcnews/new-training-and-certification-offerings-from-esri-9/ (accessed on 27 September 2021).
  40. R Core Team. R version 3.4.2.; R Foundation for Statistical Computing: Vienna, Austria, 2017. [Google Scholar]
  41. Dibaba, W.T.; Demissie, T.A.; Miegel, K. Drivers and Implications of Land Use/Land Cover Dynamics in Finchaa Catchment, Northwestern Ethiopia. Land 2020, 9, 113. [Google Scholar] [CrossRef] [Green Version]
  42. Zhao, M.; He, Z.; Du, J.; Chen, L.; Lin, P.; Fang, S. Assessing the effects of ecological engineering on carbon storage by linking the CA-Markov and InVEST models. Ecol. Indic. 2019, 98, 29–39. [Google Scholar] [CrossRef]
  43. MoEFCC The Submission of Bangladesh’s Forest Reference Level for REDD+ under the UNFCCC; Ministry of Environment, Forest and Climate Change (MoEFCC), Government of Bangladesh: Dhaka, Bangladesh, 2018. Available online: https://redd.unfccc.int/files/2019_submiss (accessed on 1 June 2021).
  44. Ma, T.; Li, X.; Bai, J.; Ding, S.; Zhou, F.; Cui, B. Four decades’ dynamics of coastal blue carbon storage driven by land use/land cover transformation under natural and anthropogenic processes in the Yellow River Delta, China. Sci. Total Environ. 2019, 655, 741–750. [Google Scholar] [CrossRef]
  45. Sahu, S.C.; Kumar, M.; Ravindranath, N.H. Carbon stocks in natural and planted mangrove forests of Mahanadi Mangrove Wetland, East Coast of India. Curr. Sci. 2016, 110, 2253–2260. [Google Scholar] [CrossRef]
  46. FAO Training Mannual on Inventory of Trees Outside of Forests (TOF). Available online: https://www.fao.org/3/i5588e/i5588e.pdf (accessed on 1 June 2021).
  47. Banglapedia National Encyclopedia of Bangladesh-Forest and Forestry. Asiatic Society of Bangladesh, Dhaka. Available online: https://en.banglapedia.org/index.php/Hill_Forest (accessed on 1 June 2021).
  48. Ahmed, M.; Suphachalasai, S. Assessing the Costs of Climate Change and Adaptation in South Asia; Asian Development Bank: Mandaluyong, Philippines, 2014. [Google Scholar]
  49. Ahmed, A. Some of the major environmental problems relating to land use changes in the coastal areas of Bangladesh: A review. J. Geogr. Reg. Plan. 2011, 4, 1–8. [Google Scholar]
  50. Butt, A.; Shabbir, R.; Ahmad, S.S.; Aziz, N. Land use change mapping and analysis using Remote Sensing and GIS: A case study of Simly watershed, Islamabad, Pakistan. Egypt. J. Remote Sens. Sp. Sci. 2015, 18, 251–259. [Google Scholar] [CrossRef] [Green Version]
  51. Zoran, M.; Anderson, E. The use of multi-temporal and multispectral satellite data for change detection analysis of the Romanian Black Sea coastal zone. J. Optoelectron. Adv. Mater. 2006, 8, 252–256. [Google Scholar]
  52. Zhang, R.; Zhu, D. Study of land cover classification based on knowledge rules using high-resolution remote sensing images. Expert Syst. Appl. 2011, 38, 3647–3652. [Google Scholar] [CrossRef]
  53. Wu, S.Y.; Yarnal, B.; Fisher, A. Vulnerability of coastal communities to sea-level rise: A case study of Cape May County, New Jersey, USA. Clim. Res. 2002, 22, 255–270. [Google Scholar] [CrossRef] [Green Version]
  54. Kaliraj, S.; Chandrasekar, N.; Ramachandran, K.K.; Srinivas, Y.; Saravanan, S. Coastal landuse and land cover change and transformations of Kanyakumari coast, India using remote sensing and GIS. Egypt. J. Remote Sens. Sp. Sci. 2017, 20, 169–185. [Google Scholar] [CrossRef]
  55. Haque, S.A. Salinity problems and crop production in coastal regions of Bangladesh. Pak. J. Bot. 2006, 38, 1359–1365. [Google Scholar]
  56. Chowdhury, A.K.M.H.U.; Haque, M.E.; Hoque, M.Z.; Rokonuzzam, M. Adoption of BRRI Dhan47 in the Coastal Saline areas of Bangladesh. Agric. J. 2012, 7, 286–291. [Google Scholar] [CrossRef]
  57. Alam, S.M.N.; Philips, M.J. Coastal Shrimp Aquaculture Systems in Southwestern Bangladesh. Asian Fish. Sci. 2004, 17, 175–189. [Google Scholar] [CrossRef]
  58. Haque, A.; Alam, J.B.; Shaha, N.K.; Raihan, F. Study on Land Use Pattern Change and Its Causes. Int. J. Environ. Res. 2008, 2, 199–204. [Google Scholar]
  59. Do, F. Yearbook of Fisheries Statistics of Bangladesh; Director General Department of Fisheries: Dhaka, Bangladesh, 2018; Volume 35, p. 129. [Google Scholar]
  60. Islam, M.R. Managing Diverse Land Uses in Coastal Bangladesh: Institutional Approaches. Environ. Livelihoods Trop. Coast. Zones 2006, 18, 237. [Google Scholar]
  61. Minar, M.H.; Hossain, M.B.; Shamsuddin, M.D. Climate change and coastal zone of Bangladesh: Vulnerability, resilience and adaptability. Middle East J. Sci. Res. 2013, 13, 114–120. [Google Scholar] [CrossRef]
  62. Rahman, M.M.; Giedraitis, V.R.; Lieberman, L.S.; Akhtar, M.T.; Taminskienė, V. Shrimp Cultivation with Water Salinity in Bangladesh: The Implications of an Ecological Model. Univers. J. Public Health 2013, 1, 131–142. [Google Scholar] [CrossRef]
  63. Sarwar, M.G.M. Impacts of Sea Level Rise on the Coastal Zone of Bangladesh. Available online: https://www.lumes.lu.se/sites/lumes.lu.se/files/golam_sarwar.pdf (accessed on 1 June 2021).
  64. Rashid, S.; Alam, M.; Shamsuddin, S. Development of Island in the Meghna Estuary Over the Past 250 Years. In Climate Change: Issues and Perspectives for Bangladesh; Ahmed, R., Shamsuddin, S.D., Eds.; Sahitya Prokash: Dhaka, Bangladesh, 2011. [Google Scholar]
  65. Alam, M.; Uddin, K. A study of morphological changes in the coastal areas and offshore islands of Bangladesh using remote sensing. Am. J. Geogr. Inf. Syst. 2013, 2, 15–18. [Google Scholar] [CrossRef]
  66. Mörner, N. Climate change and Sea level changes in Bangladesh. Energy Environ. 2010, 21, 235–249. [Google Scholar] [CrossRef]
  67. Hoque, M.Z.; Cui, S.; Lilai, X.; Islam, I.; Ali, G.; Tang, J. Resilience of coastal communities to climate change in Bangladesh: Research gaps and future directions. Watershed Ecol. Environ. 2019, 1, 42–56. [Google Scholar] [CrossRef]
  68. World Economic Forum Here’s What You Need to Know about Bangladesh’s Rocketing Economy. Available online: https://www.weforum.org/agenda/2019/11/bangladesh-gdp-economy-asia/ (accessed on 24 February 2020).
  69. UN Digital Library. The World’s Cities in 2016-DATA; Department of Economic and Social Affairs, Population Division, United Nations: New York, NY, USA, 2016. [Google Scholar]
  70. Khatun, M. Climate Change and Migration in Bangladesh: Golden Bengal to Land of Disasters. Bangladesh E-J. Sociol. 2013, 10, 64–79. [Google Scholar]
  71. Prodhan, F.A.; Zhang, J.; Sharma, T.P.P.; Nanzad, L.; Zhang, D.; Seka, A.M.; Ahmed, N.; Hasan, S.S.; Hoque, M.Z.; Mohana, H.P. Projection of future drought and its impact on simulated crop yield over South Asia using ensemble machine learning approach. Sci. Total Environ. 2022, 807, 151029. [Google Scholar] [CrossRef]
  72. Latif, M.; Alam, M.; Mustafa, M. Floristic Diversity, Growth Statistics and Indigenous Management Techniques of Traditional Homegardens in Bangladesh. In Final Report of a Contract; Research Project of BARC; BFRI and IFESCU: Chittagong, Bangladesh, 2001. [Google Scholar]
  73. The World Bank. Rural Population-Bangladesh; World Bank: Washington, DC, USA, 2019. [Google Scholar]
  74. Chowdhury, M.; Islam, M.; Satter, M. Homestead Vegetable Production in Bangladesh. In Proceedings of the a Workshop on Vegetable Production and Marketing, Gazipur, Bangladesh, 26–29 January 1992; AVRDC: Dhaka, Bangladesh, 1992; pp. 64–77. [Google Scholar]
  75. FSES. Fact Searching and Intervention, 1996–FSES Publication No. 71, FSES; Bangladesh Agricultural University (BAU): Mymensingh, Bangladesh, 1999. [Google Scholar]
  76. Helen Keller International. Monitoring of activities in village nurseries and household gardens. In A Summary Report of Surveys 14–17 under NGO Gardening and Nutrition Education Surveillance Project; Helen Keller International: Dhaka, Bangladesh, 2001. [Google Scholar]
  77. Ma, S.; Smailes, M.; Zheng, H.; Robinson, B.E. Who is Vulnerable to Ecosystem Service Change? Reconciling Locally Disaggregated Ecosystem Service Supply and Demand. Ecol. Econ. 2019, 157, 312–320. [Google Scholar] [CrossRef]
  78. Li, J.; Gong, J.; Guldmann, J.M.; Li, S.; Zhu, J. Carbon dynamics in the northeastern qinghai-tibetan plateau from 1990 to 2030 using landsat land use/cover change data. Remote Sens. 2020, 12, 528. [Google Scholar] [CrossRef] [Green Version]
Figure 1. Study area map. The maps were designed using ArcGIS 10.3 [39] from the Environmental Systems Research Institute (ESRI) by a co-author, M.Z.H., available at www.esri.com (accessed on 20 December 2021).
Land 11 00076 g001
Figure 2. Framework of the study.
Land 11 00076 g002
Figure 3. LULC maps of the study area depicting the increasing trend of TOF development.
Land 11 00076 g003
Figure 4. LULC transformation in the eastern coastal zone between 1988 and 2018.
Land 11 00076 g004
Figure 5. Supervised image classification of the eastern coastal zone depicting the increasing trend of TOF and the other land use and land cover.
Land 11 00076 g005
Figure 6. Carbon storage by different land biomes in the eastern coast of Bangladesh over 1988–2018.
Land 11 00076 g006
Figure 7. Carbon sequestration by different LULC over the period 1988–2018.
Land 11 00076 g007
Table 1. Description of different land cover classes in the study area.
LULC ClassHigh Resolution Google Earth Image of Different LULCAerial Photography of Different LULC Description
Agricultural land Land 11 00076 i001 Land 11 00076 i002
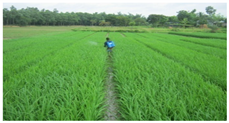
Cultivated and uncultivated crop field, short fallow land
Tree outside of forest (TOF) Land 11 00076 i003 Land 11 00076 i004
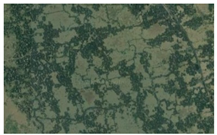
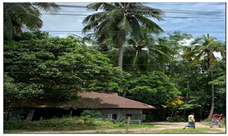
Planted fruit, timber, and fuel wood trees in and around the rural settlements
Mangroves Land 11 00076 i005 Land 11 00076 i006
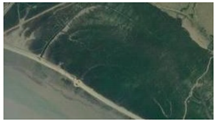
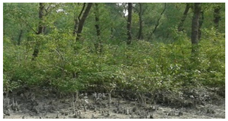
Natural/plantation mangrove forest ecosystem near the sea shoreline
Mudflats Land 11 00076 i007 Land 11 00076 i008Newly accreted land (char land), sandy beach, and wetlands
Built-up land Land 11 00076 i009 Land 11 00076 i010
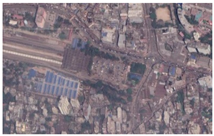
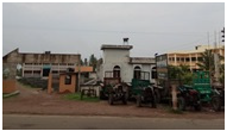
Urban settlement, industrial areas, highways, and other construction areas
Water bodies Land 11 00076 i011 Land 11 00076 i012
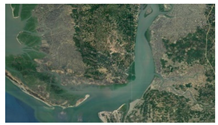
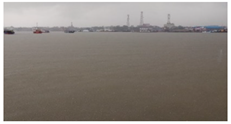
Rivers, ponds, canals, and other active hydrological units
Saltpan-shrimp Land 11 00076 i013 Land 11 00076 i014
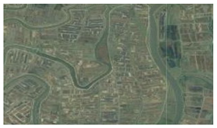
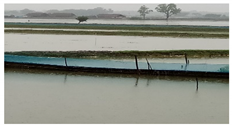
Salt pan and aquaculture rice dual farming areas
Hill vegetation Land 11 00076 i015 Land 11 00076 i016
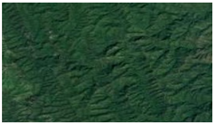
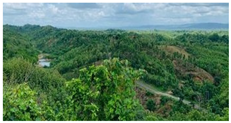
Dense shrubs and tree vegetation in hilly areas
Table 2. Carbon densities (Mg/ha) for different LULC types.
LULC TypesAbove-Ground BiomassBelow-Ground BiomassSoil Organic MatterDead Organic MatterSource
Agriculture82131[13,14,43]
TOF363212[13,14,43]
Mangroves6228612[14,43,45]
Mudflats10120[44]
Built-up land0080[44]
Water bodies21100[44]
Saltpan-shrimp10120[44]
Hill vegetation101.18.416.28.0[13,14,43]
Table 3. Area and annual change of LULC in the eastern zone.
LULC
Class
1988Year 1998Year 2008Year 20181988–2018
Ha%Ha%Ha%Ha%Ha% Change Yr−1
Agricultural land446,86356.1419,90352.7376,68747.3318,27740.0−128,586−0.54
TOF75,3229.5112,93114.2160,49520.2220,71527.7+145,3930.61
Mangroves82831.067870.978711.085071.1+2240.00
Mudflats25,4263.219,4502.421,3162.717,2332.2−8193−0.03
Built-up land20320.334090.464230.813,5511.7+11,5190.05
Water bodies56,5717.158,2007.347,6616.050,3796.3−6192−0.03
Saltpan-shrimp16,9562.124,6243.135,7554.539,3634.9+22,4070.09
Hill vegetation164,91920.7151,06919.0140,16417.6128,34716.1−36,571−0.15
Publisher’s Note: MDPI stays neutral with regard to jurisdictional claims in published maps and institutional affiliations.

