1. Introduction
Nanoemulsions are colloidal systems formed by the homogeneous blending of two mutually insoluble liquids, stabilized by surfactants and co-surfactants that preserve a thermodynamically consistent single phase [
1]. Their potential as platforms for drug delivery has attracted considerable scientific investigation [
2]. Among the earliest formulations were oil-in-water (O/W) systems, defined by droplet sizes ranging between 50 and 1000 nm in diameter. Based on their internal architecture, nanoemulsions are broadly categorized into three structural types: O/W, in which oil globules are dispersed throughout an aqueous continuous phase; W/O, where water droplets are embedded within an oily matrix; and bi-continuous systems, in which both aqueous and lipid domains coexist in an interpenetrating network [
3]. When both O/W and W/O configurations are simultaneously present within a single formulation, the resulting system is referred to as a multiple emulsion, which necessitates the concurrent use of both hydrophilic and lipophilic surfactants to achieve dual-phase stabilization [
4]. From a therapeutic standpoint, nanoemulsions offer substantial benefits for the oral administration of poorly water-soluble compounds. They achieve this by enhancing the apparent aqueous solubility of such compounds and by providing a protective microenvironment that limits enzymatic degradation within the gastrointestinal tract. The incorporated surfactants and co-surfactants further contribute by modulating the permeability of intestinal membranes, facilitating more efficient drug absorption. Notably, nanoemulsion-based formulations have also demonstrated the capacity to minimize pharmacokinetic variability, yielding more consistent drug exposure profiles across diverse patient populations [
4].
Among the various lipid-based nanocarrier platforms available for poorly water-soluble drugs, an oil-in-water (O/W) nanoemulsion was selected over alternative systems such as Self-Nanoemulsifying Drug Delivery Systems (SNEDDS), Solid Lipid Nanoparticles (SLNs), and Nanostructured Lipid Carriers (NLCs) for several formulation-specific reasons. SNEDDS typically require high surfactant concentrations (often 30–60% w/w) to achieve spontaneous self-emulsification upon dilution in gastrointestinal fluids, raising concerns regarding surfactant-induced mucosal irritation and dose-dependent gastrointestinal intolerance on chronic or repeated administration. In contrast, the nanoemulsion developed in this study achieved stable, sub-150 nm droplets using a comparatively modest surfactant load, reducing this risk while retaining the permeation-enhancing benefits associated with Tween 80 and Span 80.
SLNs and NLCs, meanwhile, rely on a solid or partially solid lipid matrix at body temperature, which constrains drug loading capacity for lipophilic actives such as ART, since a highly ordered crystalline lipid lattice provides limited accommodating space compared with a fully liquid oil core; this can also predispose SLN/NLC systems to drug expulsion during storage as the lipid matrix undergoes polymorphic transitions toward a more stable crystalline form. Garg et al. [
5], for example, reported an ART-loaded SLN system with an entrapment efficiency of approximately 78%, notably lower than the 95.42 ± 1.18% entrapment efficiency achieved by the fully liquid dual-oil nanoemulsion core developed in the present study, consistent with the generally higher drug-loading capacity of liquid lipid systems for lipophilic actives. On this basis, an O/W nanoemulsion was considered the most suitable platform for maximizing ART solubilization and loading while minimizing excipient-related tolerability concerns.
Artemether (ART) is a lipid-soluble derivative of artemisinin, used alone or as a fixed-dose combination with lumefantrine as a first-line artemisinin-based combination therapy for uncomplicated falciparum malaria. Despite its potent and rapidly acting antimalarial action, the clinical performance of oral ART is constrained by its very low aqueous solubility, which results in poor and erratic dissolution-limited absorption. Even the fraction that is absorbed undergoes extensive first-pass metabolism, principally via the CYP3A4 isoenzyme, to its active metabolite dihydroartemisinin, and its short elimination half-life further contributes to variable, often subtherapeutic systemic drug exposure. Together, these solubility, permeability, and metabolic limitations mean that conventional oral dosage forms of ART, such as plain tablets or suspensions, frequently show incomplete and inter-individually variable absorption, underscoring the need for delivery strategies capable of improving the drug’s apparent solubility and dissolution rate at the intestinal level.
Several groups have investigated lipid-based nanocarriers to address these limitations. An early precedent for this approach in antimalarial therapy was established by Singh and Vingkar [
2], who developed an oral lipid nanoemulsion of primaquine and demonstrated improved antimalarial activity and altered biodistribution relative to the plain drug. Building on this general strategy specifically for ART, Laxmi et al. [
6] developed an ART nanoemulsion using coconut oil with Span 80 and Tween 80, prepared by ultrasonication, obtaining a droplet size of approximately 79 nm and a zeta potential of −15 mV; in Wistar rats, this formulation achieved an oral bioavailability approximately 2.6-fold higher than the plain drug. Working with the related artemisinin derivative arteether, Dwivedi et al. [
7] prepared nanoemulsions by high-pressure homogenization and reported improved oral bioavailability, confirmed by LC–MS pharmacokinetic analysis, together with enhanced antimalarial efficacy in
Plasmodium yoelii nigeriensis-infected mice. Beyond nanoemulsions, Garg et al. [
5] formulated ART-loaded solid lipid nanoparticles (~362 nm, zeta potential −17.6 mV, ~78% entrapment efficiency) and, using DSC, demonstrated molecular dispersion of the drug within the lipid matrix together with improved intestinal permeability relative to the plain drug.
Beyond lipid-based systems, nanocarrier engineering more broadly has demonstrated considerable success in overcoming the biological barriers that limit the delivery of poorly bioavailable therapeutics. For instance, biomineralized inorganic nanocarriers have been employed to improve the in vivo stability and barrier penetration of macromolecular drugs [
8], while biocompatible polyphenol-based nanoplatforms have been developed to enhance the intracellular delivery of protein therapeutics [
9]. These examples illustrate the broader principle underlying the present work: that rationally engineered nanocarrier systems—whether lipid-, polymer-, or biomineral-based—can be tailored to the specific physicochemical and biological barriers relevant to a given therapeutic class, motivating the lipid nanoemulsion strategy adopted here for the small-molecule antimalarial Artemether.
Collectively, these studies confirm that lipid-based nanocarriers can improve the apparent solubility, dissolution, and/or intestinal permeability of ART and related artemisinin derivatives. However, the existing ART nanoemulsion literature has relied on conventional oils such as coconut oil and has not, to our knowledge, evaluated the non-conventional Vippa oil as an oil-phase component, nor combined systematic, statistically validated Quality by Design (QbD) optimization with ex vivo intestinal permeation testing under a unified experimental design. In the present work, Sunflower oil and Vippa oil were selected as the oil-phase components, and the ART nanoemulsion was optimized using a QbD approach employing a three-factor, three-level Box–Behnken statistical design, with formulation performance further assessed by ex vivo permeation across excised intestinal mucosa. This combination of a novel, non-conventional oil phase with a statistically driven QbD optimization framework and ex vivo permeation evaluation constitutes the specific novelty of the present study relative to prior ART/Artemether nanoemulsion work.
2. Results
2.1. HPLC Analysis of Artemether
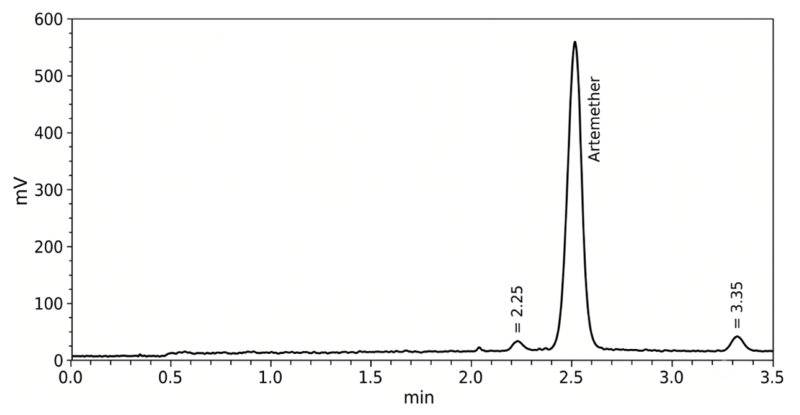
The chromatogram obtained from the analysis of the Artemether standard is shown in
Figure 1. The chromatogram demonstrates a sharp, highly prominent, and symmetrical peak, confirming the successful identification and adequate resolution of Artemether under the established chromatographic conditions. Based on the data, the retention time for the main Artemether analyte is approximately 2.5 min, and its maximum signal intensity approaches 600 mV, indicating a strong detector response. The baseline appears exceptionally clean and stable, reflecting the presence of negligible detector noise and the use of well-equilibrated reagents.
Furthermore, the analytical method exhibits good sensitivity by resolving two smaller, distinct peaks that denote the presence of related compounds or minor impurities within the Artemether standard material. These secondary components were successfully eluted at retention times of roughly 2.25 min and 3.35 min, respectively. Despite their relatively low abundances compared to the principal peak, their clear resolution from the Artemether peak demonstrates the developed method’s selectivity for distinguishing related substances.
- a.
Sensitivity (LOD and LOQ)
The sensitivity of the UV-Visible spectrophotometric method was established through calculation of the LOD and LOQ. The LOD, defined as the lowest concentration of Artemether that can be reliably detected, was found to be 0.71 µg/mL, while the LOQ, defined as the lowest concentration that can be quantified with acceptable precision and accuracy, was found to be 2.15 µg/mL. Since the calculated LOQ (2.15 µg/mL) lies well below the lowest concentration of the linear calibration range (5 µg/mL), the method demonstrates adequate sensitivity for the accurate and reliable quantification of Artemether in both the nanoemulsion formulations and the dissolution/permeation media.
2.2. Solubility
The saturation solubility of Artemether in various aqueous and organic solvents, as well as selected lipidic excipients, was quantitatively determined to guide selection of the oil phase and surfactant system. The results are summarized in
Table 1. Artemether exhibited negligible solubility in distilled water (0.02 ± 0.01 mg/mL), confirming its pronounced hydrophobic nature. The slightly improved solubility in phosphate buffer (pH 6.8, 0.15 ± 0.03 mg/mL) remains insufficient for standard oral delivery, reinforcing the necessity for a lipid-based nanocarrier. Among the tested oil phases, the non-conventional Vippa oil demonstrated a superior solubilization capacity for Artemether (68.40 ± 2.15 mg/mL) compared to Sunflower oil (45.25 ± 1.54 mg/mL), a result consistent with Artemether’s highly lipophilic (BCS Class II) character. This quantitative solubility differential provided the basis for selecting Vippa oil as the primary oil phase in the optimized dual-oil matrix, to maximize drug loading while minimizing the risk of precipitation. Span 80 similarly showed higher ART solubility (62.15 ± 1.90 mg/mL) than Tween 80 (55.30 ± 1.75 mg/mL), supporting the surfactant system selected for the formulation.
2.3. Screening and Selection of Excipients
The excipient selection based on solubility, the ranges of the independent variables for the Box–Behnken Design (
Table 2) were established from preliminary phase-behavior trials conducted prior to formal optimization. Trial formulations spanning a wider composition range (aqueous phase: 60–95%; oil:surfactant ratio: 0.5–4.0%; sonication time: 2–15 min) were screened visually for clarity, phase separation, and creaming after 24 h at room temperature. Formulations with an aqueous phase below 75% showed visible turbidity/phase inversion, while those above 85% did not accommodate sufficient oil-phase volume for adequate drug loading. Oil:surfactant ratios below 1% resulted in incomplete emulsification of the oil phase, whereas ratios above 2% did not further improve clarity or stability. Similarly, sonication times below 5 min produced coarse, polydisperse emulsions, while times beyond 10 min offered no further reduction in droplet size. On this basis, the ranges of 75–85% (aqueous phase, A), 1–2% (oil:surfactant ratio, B), and 5–10 min (sonication time, C) were selected as the design space for the Box–Behnken optimization (
Table 2). This preliminary range-finding step directly addresses the three Critical Process Parameters (CPPs) identified in the QbD risk assessment, ensuring that the subsequent Box–Behnken Design was conducted only after the practically formulable design space had been established, rather than over an arbitrarily wide or unscreened range.
2.4. FT-IR Studies
The FT-IR spectrum of pure Artemether exhibited characteristic absorption bands at 3172.9 cm
−1 (aromatic C–H), 2946.8 cm
−1 (aliphatic C–H stretching), 1715.3 cm
−1 (C=O stretching), 1463.2 cm
−1 (–CH
2 bending), and 1104.6 cm
−1 (C–O stretching), confirming the chemical identity of the drug (
Figure 2,
Table 2).
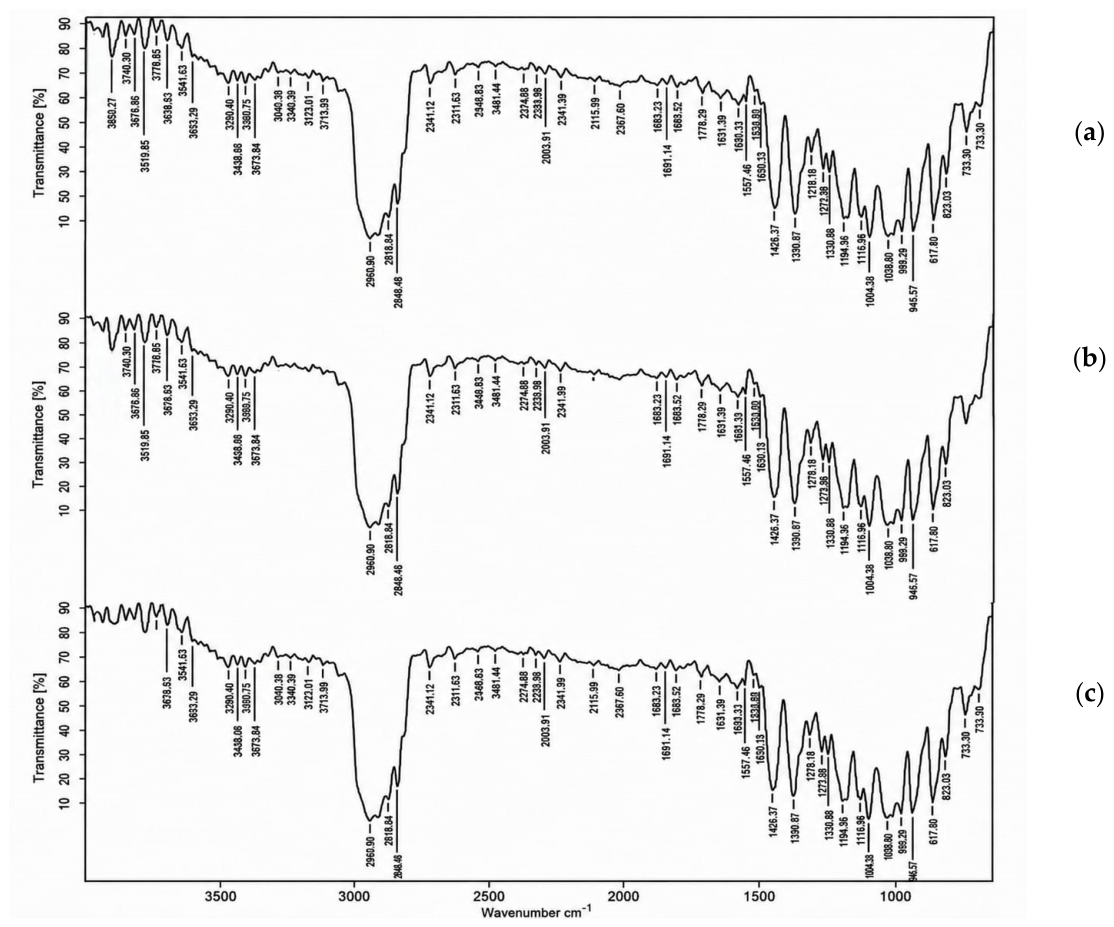
To assess drug–excipient compatibility, FT-IR spectra of the drug–excipient physical mixture and the optimized nanoemulsion were recorded under identical conditions and overlaid with that of the pure drug (
Figure 2a). The three spectra were essentially superimposable: all principal absorption bands of Artemether were retained in both the physical mixture and the formulation at their original positions, with no measurable shift in the major functional-group vibrations, no disappearance of characteristic peaks, and no emergence of new bands. In particular, the diagnostic C=O stretching (1715.3 cm
−1), –CH
2 bending (1463.2 cm
−1), and C–O stretching (1104.6 cm
−1) bands remained unchanged across all three samples. The absence of any significant shift confirms that no chemical interaction occurred between Artemether and the selected excipients (Sunflower oil, Vippa oil, Tween 80, and Span 80), establishing their compatibility and the retention of drug integrity within the nanoemulsion (
Figure 2b,c).
2.5. DSC Studies
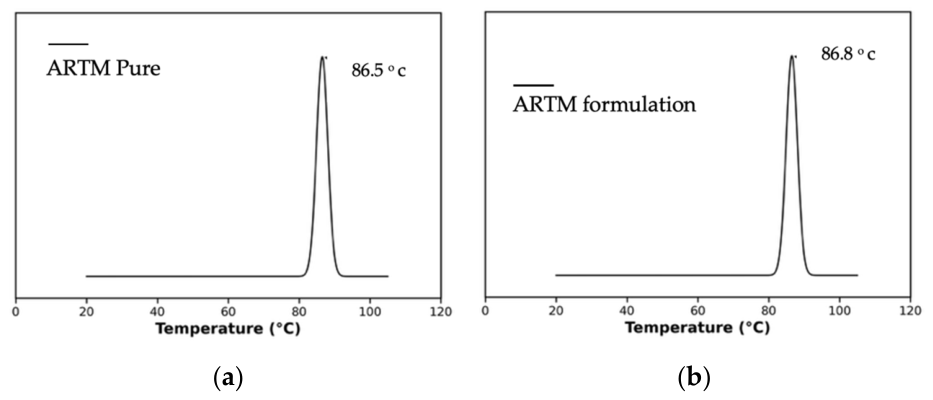
The DSC thermogram of pure Artemether and the Artemether-loaded nanoemulsion formulation showed an endothermic transition at 86.5 °C and 86.8 °C, respectively, corresponding to the reported melting point of ART. The enthalpy of fusion (ΔHm) was 78.5 J/g for pure Artemether, compared with only 8.4 J/g for the formulation, corresponding to a relative crystallinity of approximately 10.7% (i.e., an ~89.3% reduction in crystallinity) in the formulated product. Notably, the endothermic peak in the formulation was broader and of markedly reduced enthalpy compared with the sharp, well-defined melting endotherm of the pure crystalline drug, consistent with a substantial reduction in the proportion of ART present in an ordered crystalline state within the formulation. The thermogram is presented in
Figure 3a,b.
2.6. Design of Experiments (DoE)
A Box–Behnken Design with three factors at three levels was employed. The independent variables and their levels are summarized in
Table 2, and the 17 experimental runs with observed responses are presented in
Table 3.
2.7. Particle Size and Polydispersity Index (F1–F17)
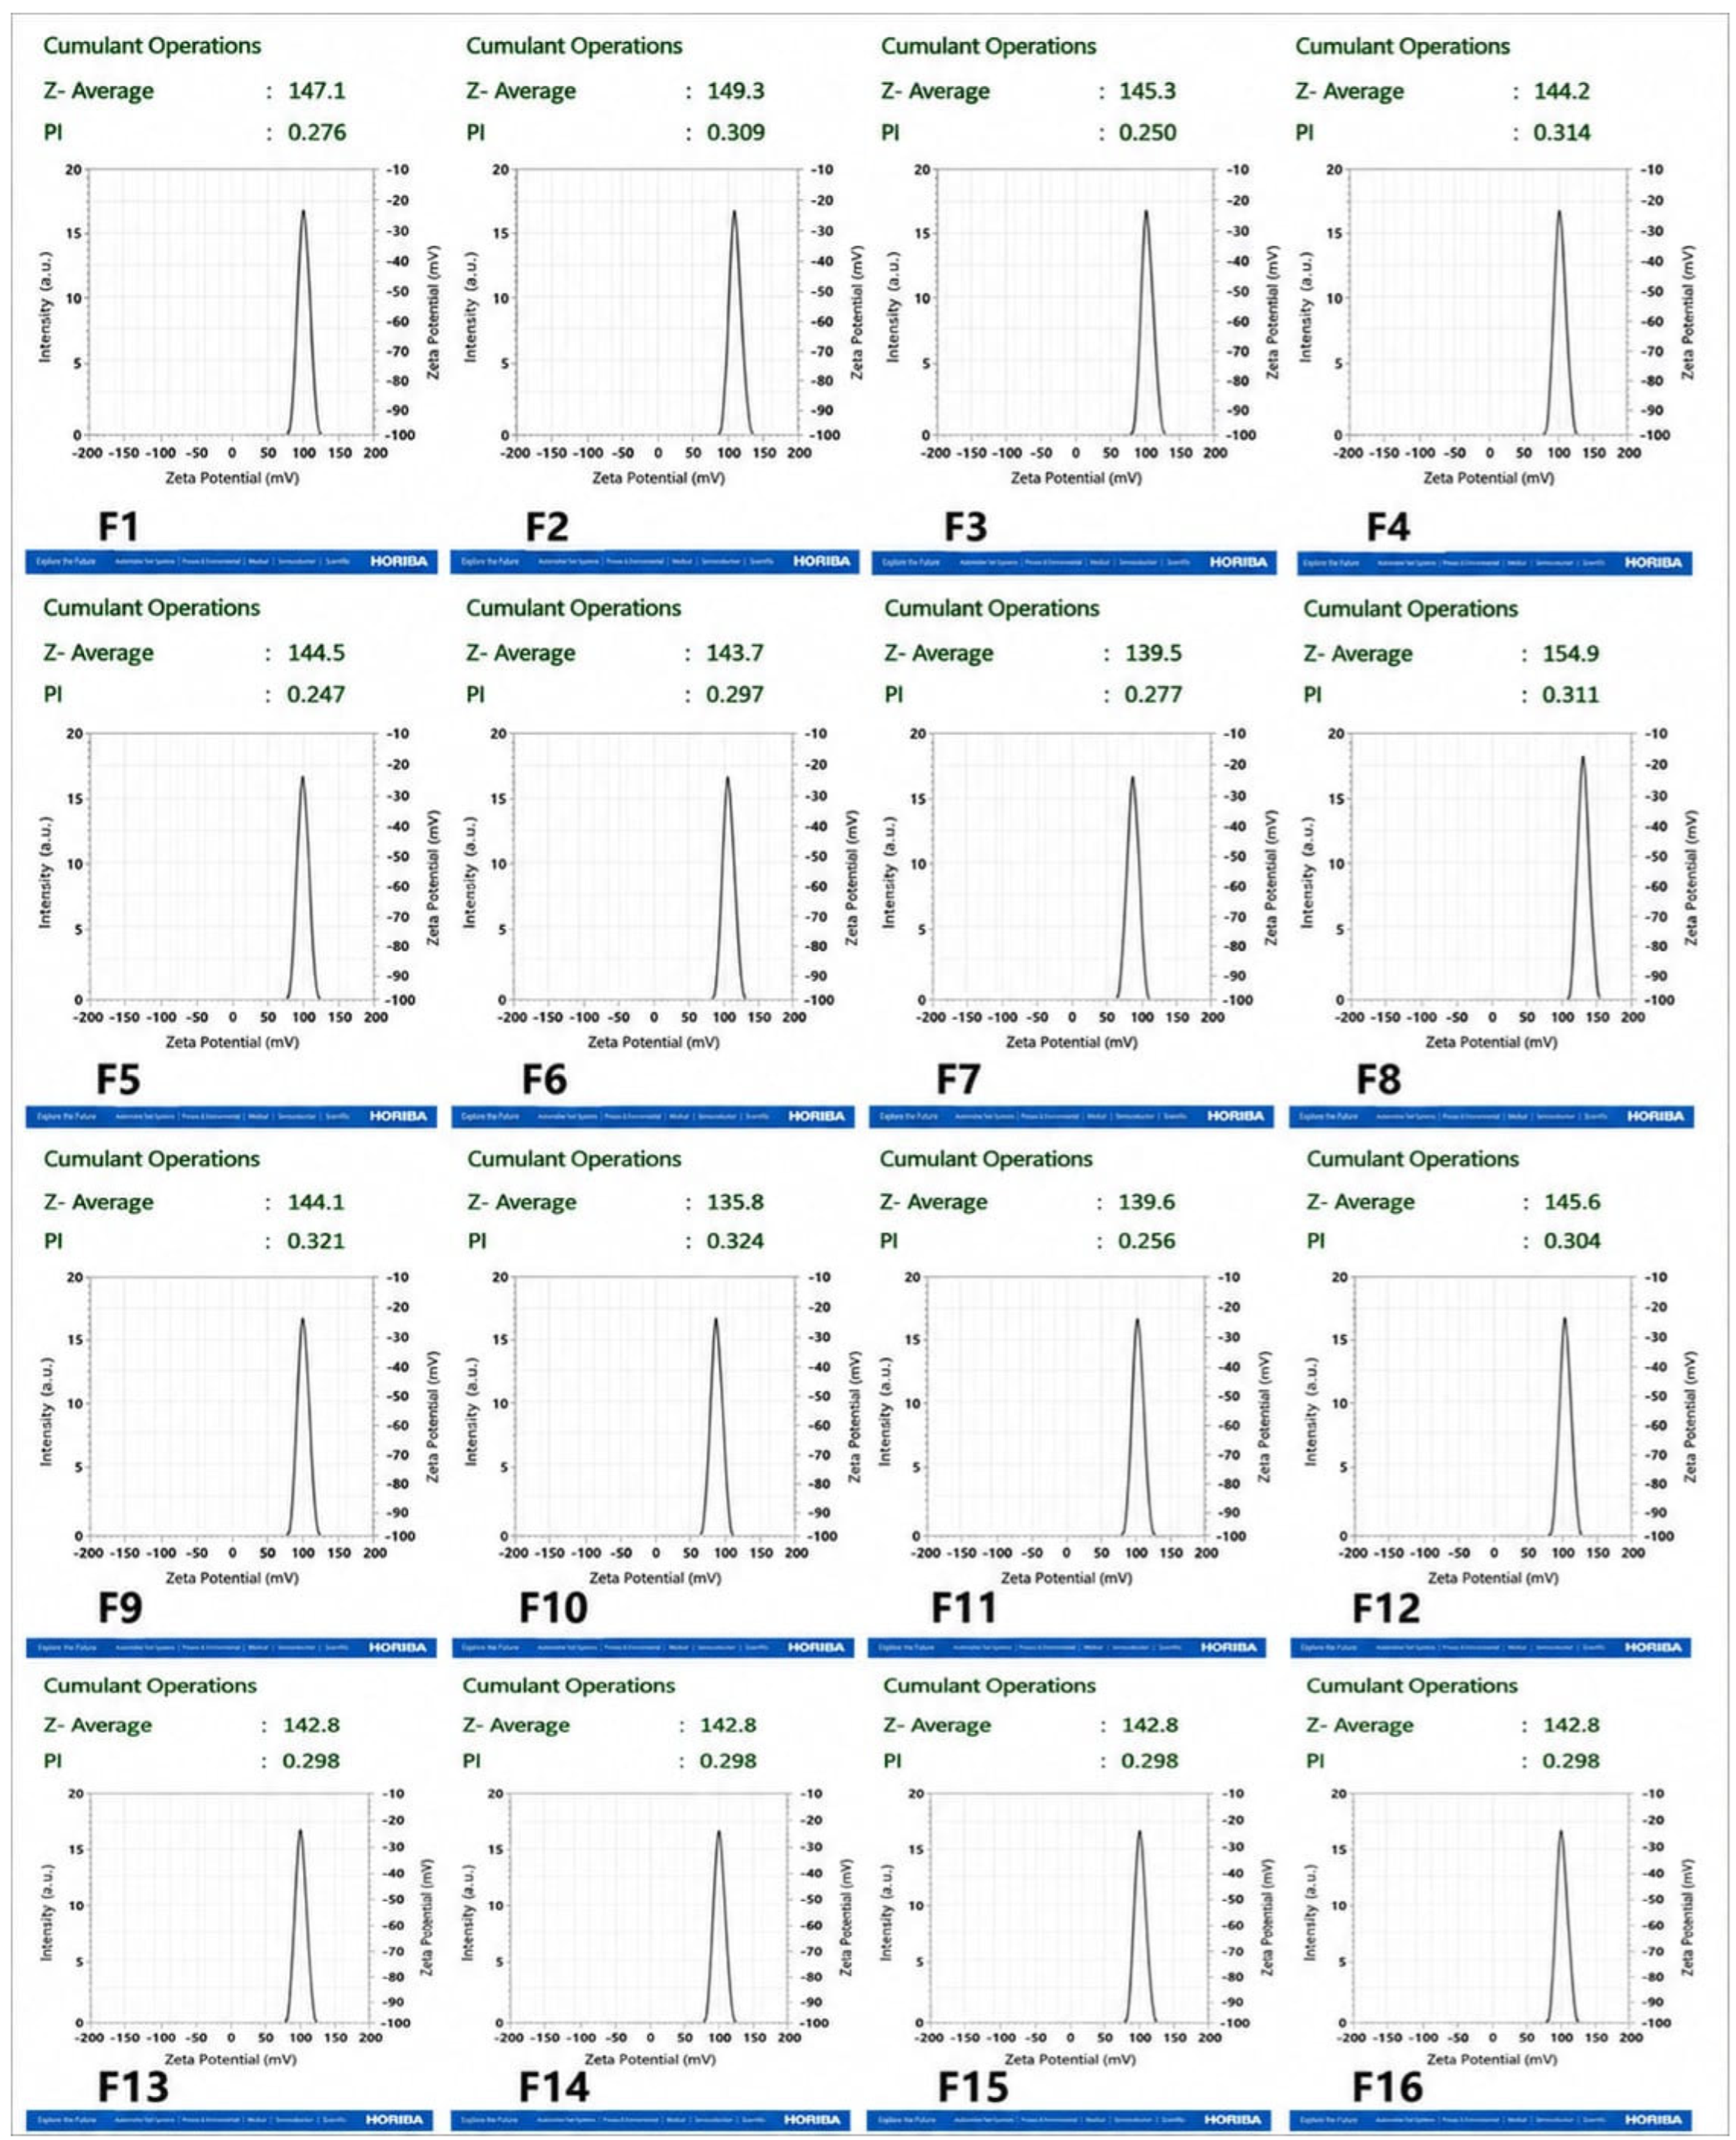
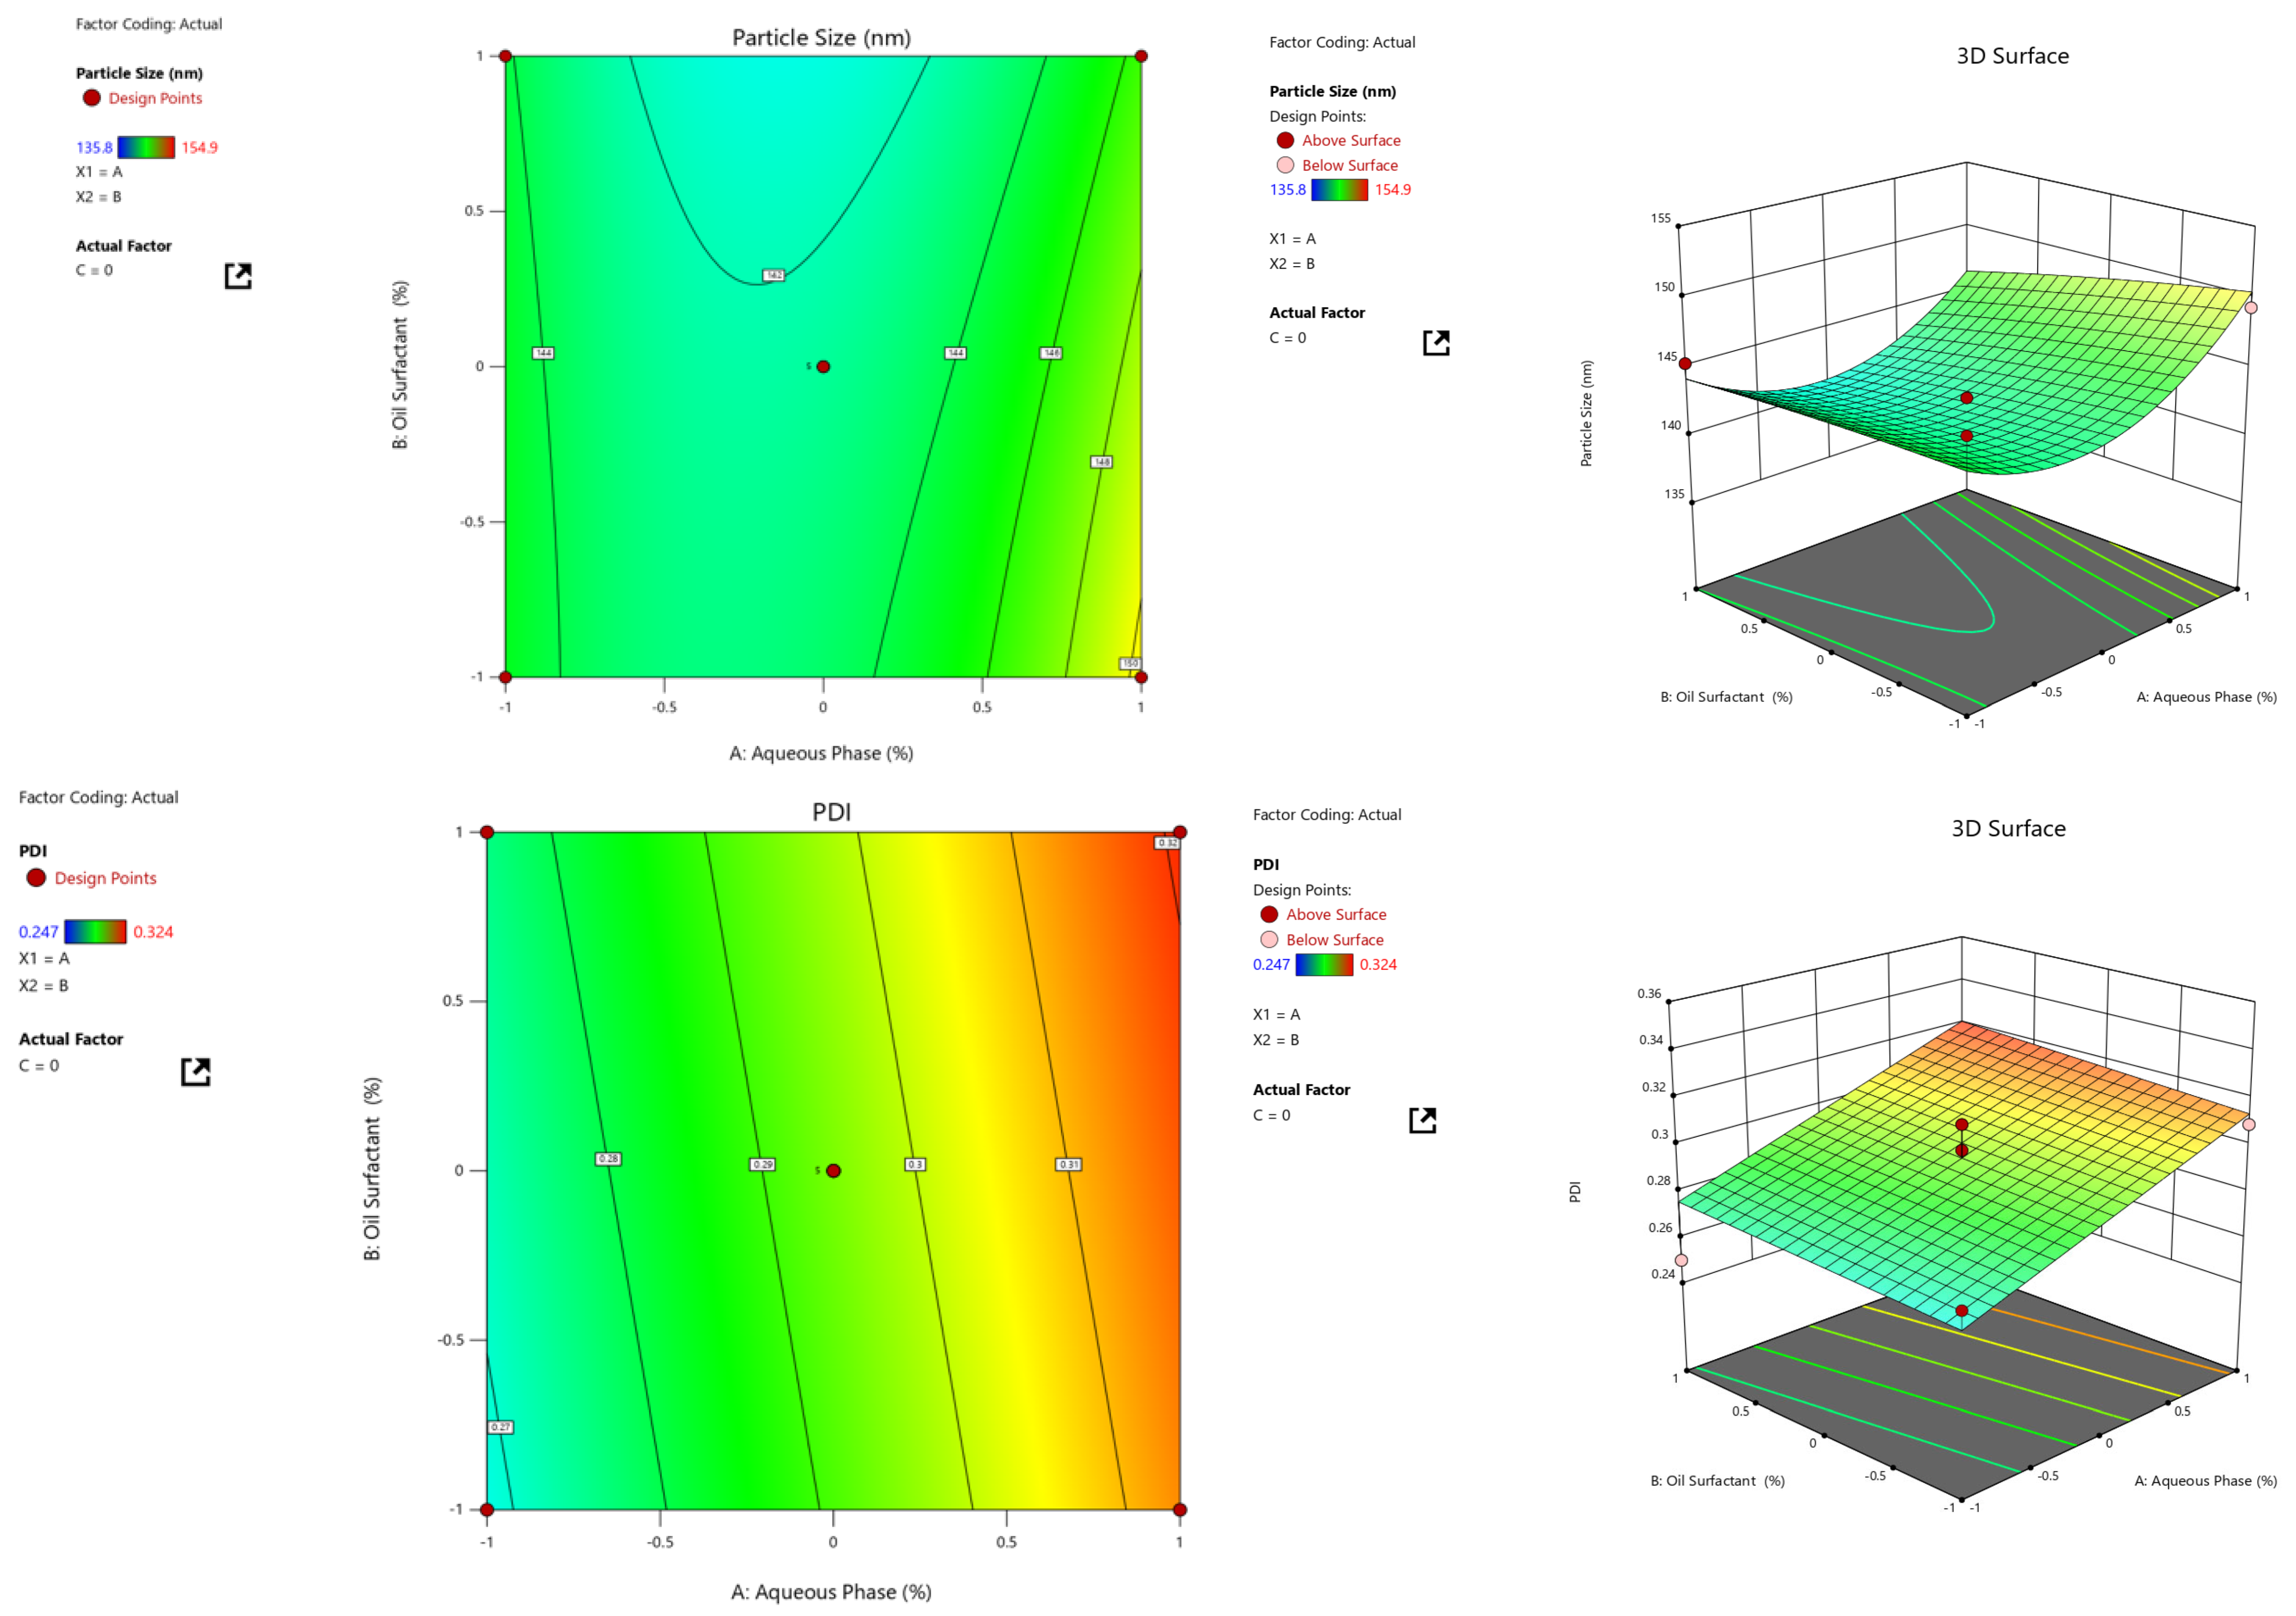
The measured particle size values ranged from 135.8 ± 1.1 nm to 154.9 ± 3.8 nm across all 17 formulations, and PDI values ranged from 0.247 ± 1.2 to 0.324 ± 0.8. All PDI values were below 1.0, confirming a narrow and homogeneous size distribution. Results are presented in
Figure 4.
2.8. Zeta Potential
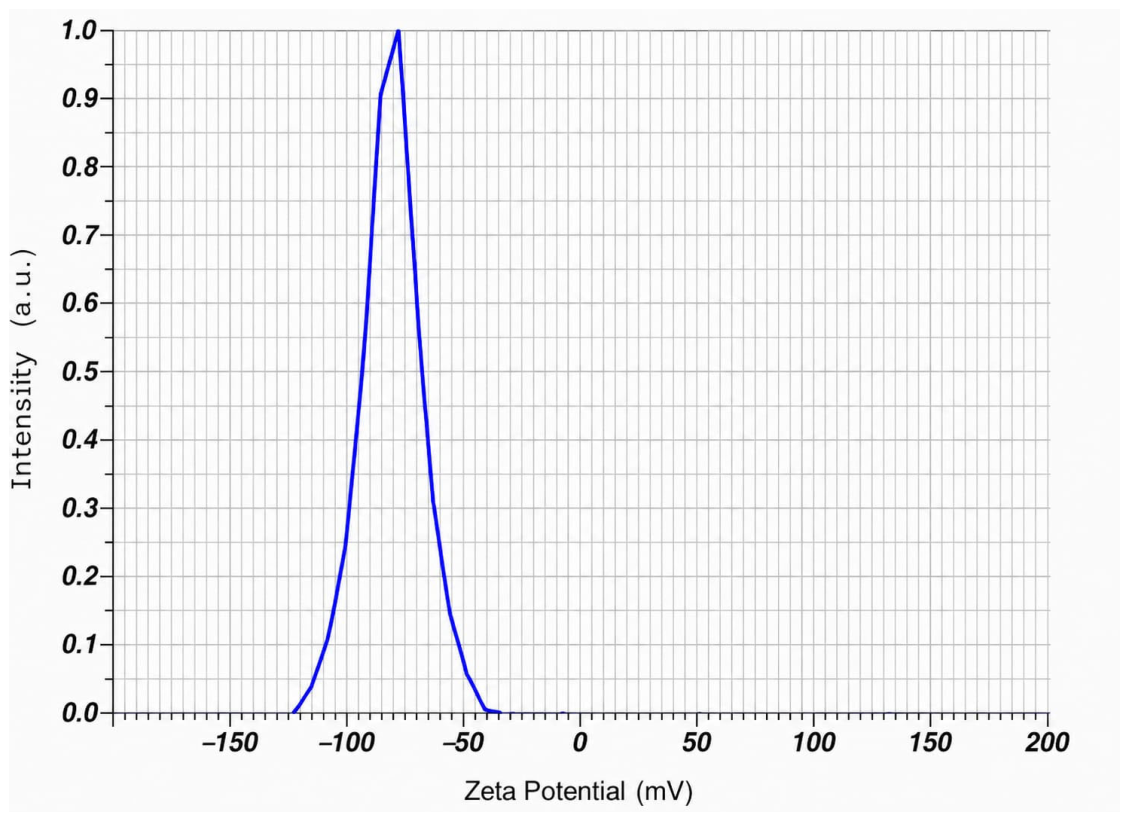
The optimized ART-NE formulation exhibited a zeta potential of −30.08 mV, indicating adequate electrostatic repulsion between droplets and satisfactory long-term colloidal stability. The zeta potential profile is presented in
Figure 5.
2.9. Additional Physicochemical Properties
The optimized Artemether-loaded nanoemulsion was evaluated for pH, viscosity, refractive index, and conductivity to ensure its suitability for oral administration and physical stability, as detailed in
Table 4.
pH: The pH of the formulation was found to be 6.4 ± 0.2, which falls within the acceptable physiological range for oral preparations, ensuring non-irritancy to the gastrointestinal mucosa.
Viscosity: The low viscosity of 2.84 ± 0.15 cP is characteristic of an oil-in-water (O/W) nanoemulsion with a high aqueous phase volume (75%). This low viscosity is highly desirable as it facilitates easy pouring, swallowing, and rapid dispersion in gastrointestinal fluids.
Refractive Index: The formulation exhibited a refractive index of 1.338 ± 0.002. This value is very close to that of pure water (1.333), confirming the isotropic, transparent-to-translucent nature of the nanoemulsion and verifying that the oil droplets are dispersed at a nanometric scale that does not significantly scatter light.
Conductivity: The electrical conductivity was measured at 215 ± 12 µS/cm. This relatively high conductivity value conclusively confirms the formation of an oil-in-water (O/W) system, as water constitutes the continuous external phase allowing for electrical conductance, whereas a water-in-oil (W/O) system would exhibit conductivity approaching zero.
2.10. Drug Content
Drug content across all formulations ranged from 86.12% to 98.44%. Formulations incorporating Vippa oil and Sunflower oil as the oil phase consistently achieved higher drug content compared to other formulations. Results are presented in
Table 5.
2.11. Entrapment Efficiency
The entrapment efficiency (EE%) of the optimized Artemether nanoemulsion was evaluated to determine the nanocarrier’s drug-loading capacity. The optimized formulation exhibited an exceptionally high entrapment efficiency of 95.42 ± 1.18% (n = 3). This result indicates that the vast majority of the incorporated Artemether was successfully encapsulated within the lipid matrix of the nanoemulsion, with only a negligible fraction remaining free in the continuous aqueous phase.
2.12. In Vitro Lipolysis (Biorelevant Digestion) Study
The distribution of ART across the aqueous micellar, oil, and precipitate phases following simulated intestinal digestion is summarized in
Table 6. For the plain ART suspension, only 2.8 ± 0.5% of the drug dose was recovered in the aqueous micellar phase, with the overwhelming majority (97.2 ± 0.5%) found in the precipitate phase, indicating that free ART rapidly exceeds its solubility limit in the aqueous digestion medium and precipitates out rather than remaining available for absorption.
In marked contrast, the optimized ART-NE retained 78.4 ± 2.6% of the drug dose in the aqueous micellar phase, with 16.2 ± 1.4% remaining in the residual (partially digested) oil phase and only 5.4 ± 0.9% precipitating. This represents an approximately 28-fold increase in micellar solubilization relative to the plain suspension, and a corresponding near-total elimination of drug precipitation during digestion.
2.13. In Vitro Drug Release of ART-NEs
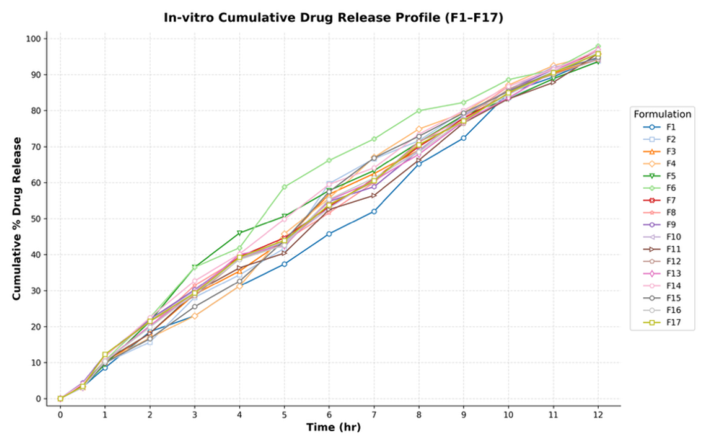
Cumulative in vitro drug release data for formulations F1–F17 over 12 h are presented in
Table 7 and graphically in
Figure 6. In vitro drug release profile of ART-NEs (F1–F17).
2.14. Ex Vivo Drug Release
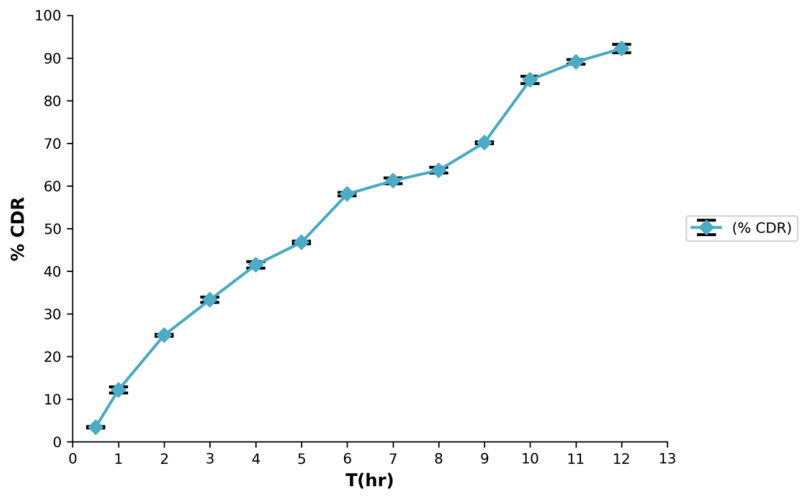
Cumulative ex vivo drug permeation data for the optimized formulation over 12 h are presented in
Table 8 and
Figure 7.
Drug release data were fitted to zero-order, first-order, Higuchi, and Korsmeyer–Peppas kinetic models. The R
2 values and release exponent (n) for all formulations are summarized in
Table 8. Zero-order, first-order, Higuchi, and Korsmeyer–Peppas kinetic plots of ART-NEs (F1–F17) are presented in
Figure 6.
The permeation profiles of the plain ART suspension and the optimized ART-NE across excised goat intestinal mucosa are shown in
Figure 7, and the corresponding permeation parameters, quantified by the validated RP-HPLC method, are summarized in
Table 9. The plain ART suspension exhibited a steady-state flux (Jss) of 145.20 ± 6.14 µg/cm
2/h and an apparent permeability coefficient (Papp) of (2.52 ± 0.11) × 10
−5 cm/s, with a lag time of 1.85 ± 0.14 h and a cumulative permeation of only 24.35 ± 1.42% over 12 h, consistent with the drug’s inherently poor aqueous solubility and slow partitioning across the mucosal membrane.
In contrast, the optimized ART-NE achieved a markedly higher Jss of 586.45 ± 12.38 µg/cm2/h and a Papp of (1.02 ± 0.04) × 10−4 cm/s, corresponding to a 4.04 ± 0.18-fold enhancement in flux relative to the plain drug suspension. The lag time was also substantially and consistently reduced, from 1.85 ± 0.14 h to 0.42 ± 0.06 h, indicating a much faster and more reproducible onset of drug transport across the membrane. Cumulative permeation over 12 h reached 92.21 ± 0.97% for the nanoemulsion, compared with only 24.35 ± 1.42% for the plain drug suspension. The relatively small SD values across all parameters (n = 3), together with the specificity and resolution afforded by the HPLC method, indicate good inter-replicate reproducibility and confirm that the observed enhancement reflects a genuine formulation effect rather than an analytical artifact.
2.15. Drug Release Kinetics of ART-Nes
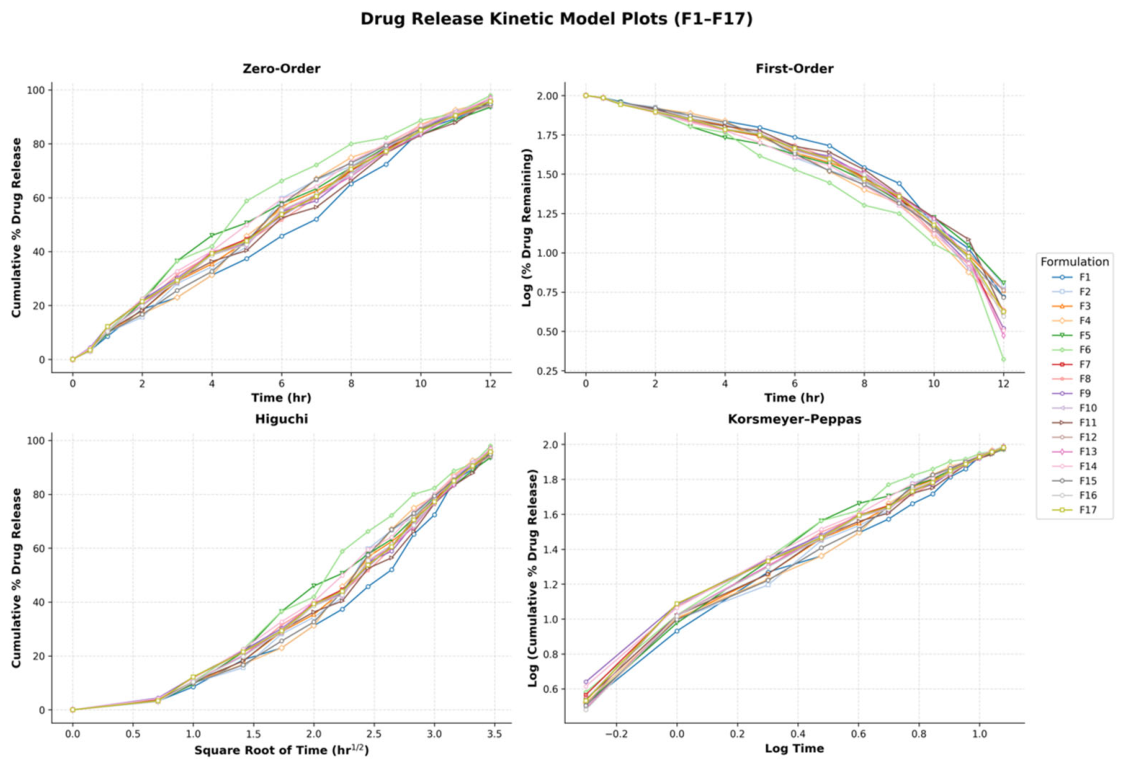
Drug release kinetic model plots (F1–F17): cumulative % drug release vs. time (zero-order), log % drug remaining vs. time (first-order), cumulative % drug release vs. square root of time (Higuchi), and log cumulative % drug release vs. log time (Korsmeyer–Peppas) in
Figure 8.
The release behavior of all 17 formulations (F1–F17) was fitted to four kinetic models to identify the dominant drug transport mechanism, with the resulting plots shown in
Figure 8. The zero-order plot shows a consistently linear increase in cumulative drug release across all formulations over the 12 h period, visually corroborating the high R
2 values (0.963–0.995,
Table 9) obtained for this model and confirming a constant, formulation-independent release rate. The first-order plot shows a comparatively less linear decline in log (% drug remaining), particularly in the later time points (10–12 h), consistent with the poorer fit of this model relative to zero-order kinetics across the design space.
The Higuchi plot displays a reasonably linear relationship between cumulative release and the square root of time for most formulations, supporting a diffusion-contributing component to drug release, while the Korsmeyer–Peppas plot shows a consistent, near-linear relationship across all 17 formulations with a shallow slope, corresponding to the release exponent (
n) values of 0.13–0.39 obtained from the regression analysis (
Table 10). As all n values fall below the 0.43 threshold for spherical matrices, this confirms Fickian diffusion as the predominant release mechanism across the entire formulation set, rather than being specific to the optimized batch alone.
Across all four models, formulation F17 (green) consistently shows a modestly faster release profile relative to the other 16 formulations, particularly evident in the zero-order and Higuchi plots, while F1–F16 cluster closely together, indicating that the Box–Behnken design space produced formulations with broadly comparable, reproducible release behavior with the exception of this single high-release outlier.
2.16. Diagnostic Plots for Particle Size (PS)
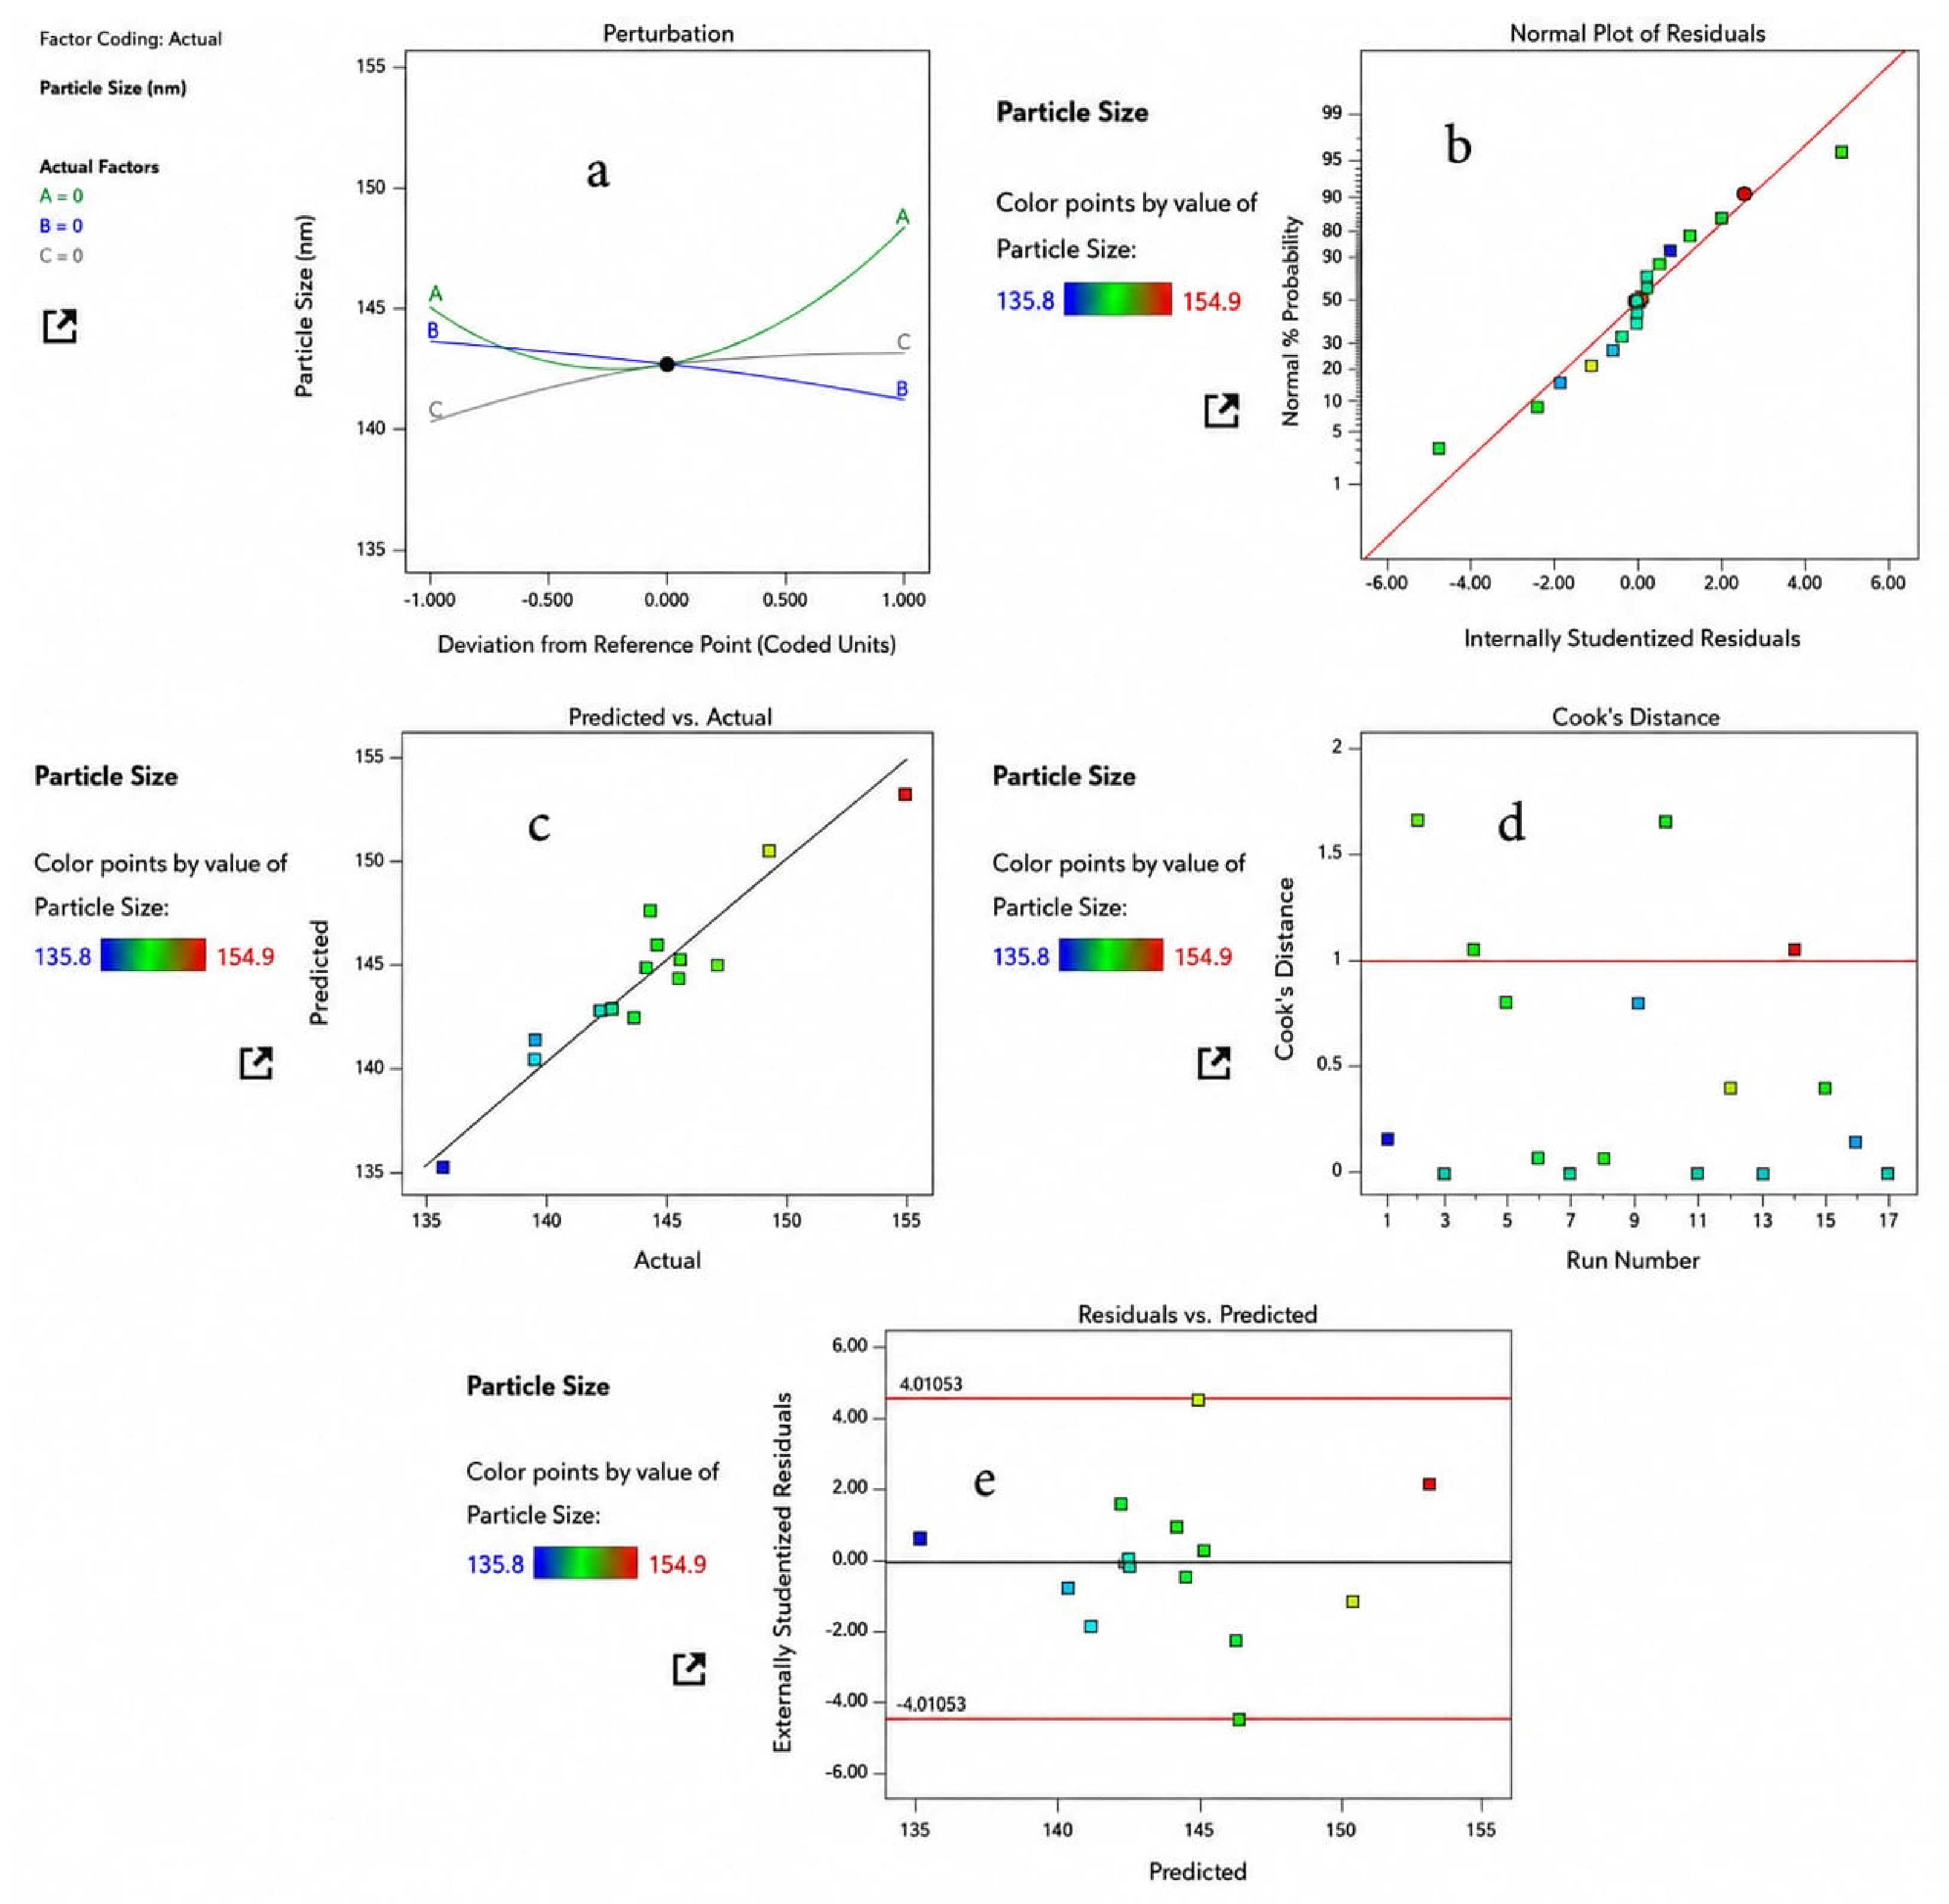
The adequacy of the fitted quadratic model for particle size was assessed using a set of diagnostic plots (
Figure 9). The perturbation chart (
Figure 9a) showed that the aqueous phase (factor A) produced the steepest and most curved response, indicating that it was the most influential variable on particle size, whereas the oil:surfactant ratio (B) and sonication time (C) produced comparatively flatter profiles. The normal probability plot of residuals (
Figure 9b) showed the data points distributed closely along the straight line, confirming that the residuals were approximately normally distributed and that the assumption of normality was satisfied. The predicted vs. actual plot (
Figure 9c) showed the points lying close to the line of equality, demonstrating good agreement between the model-predicted and experimentally observed particle size values. In the Cook’s distance plot (
Figure 9d), most runs fell below the influence limit, although a few runs approached or slightly exceeded the threshold, indicating a small number of comparatively influential observations. Finally, the residuals vs. predicted plot (
Figure 9e) showed the residuals scattered randomly around the central line and contained within the upper and lower control limits, with no systematic pattern, confirming constant variance of the residuals. Collectively, these plots indicate that the quadratic model adequately describes the experimental data for particle size.
2.17. Quadratic Regression ANOVA for Particle Size
The ANOVA results for the quadratic model are presented in
Table 11, and the corresponding fit statistics in
Table 12. The model F-value of 7.63 implies that the model is significant, with only a 0.69% probability that an F-value of this magnitude could arise due to noise. Among the individual terms, the aqueous phase (A,
p = 0.0233), the interaction terms AC (
p = 0.0040) and BC (
p = 0.0074), and the quadratic term A
2 (
p = 0.0029) were found to be statistically significant (
p < 0.05), confirming that these terms contributed meaningfully to the variation in particle size. The remaining terms (B, C, AB, B
2 and C
2) were not significant.
The fit statistics showed a high coefficient of determination (R2 = 0.9075) and a low coefficient of variation (C.V. = 1.33%), indicating a precise fit and good reproducibility of the response. The adequate precision value of 12.21, being well above the threshold of 4, confirms an adequate signal-to-noise ratio, indicating that the model can be used to navigate the design space. However, the difference between the adjusted R2 (0.7887) and the predicted R2 (−0.4639), together with the significant lack of fit (p = 0.0003), indicates that while the model describes the experimental (design) data well, its ability to predict responses at new conditions is limited. This is attributable to the relatively narrow range of particle size observed across the formulations (135.8–154.9 nm), which restricts the model’s discriminating power; the optimized formulation was therefore confirmed by an experimental verification (checkpoint) run rather than relying on prediction alone.
The narrow observed range of particle size (135.8–154.9 nm) and PDI (0.247–0.324) across the 17 runs limits the discriminating power of the quadratic model, which is reflected in the negative predicted R2 for both responses (PS: −0.46; PDI: −0.06) despite acceptable R2 (0.91) and adequate precision (12.21) for the particle size model. The optimized formulation was therefore confirmed by an independent checkpoint run rather than relying on model prediction alone.
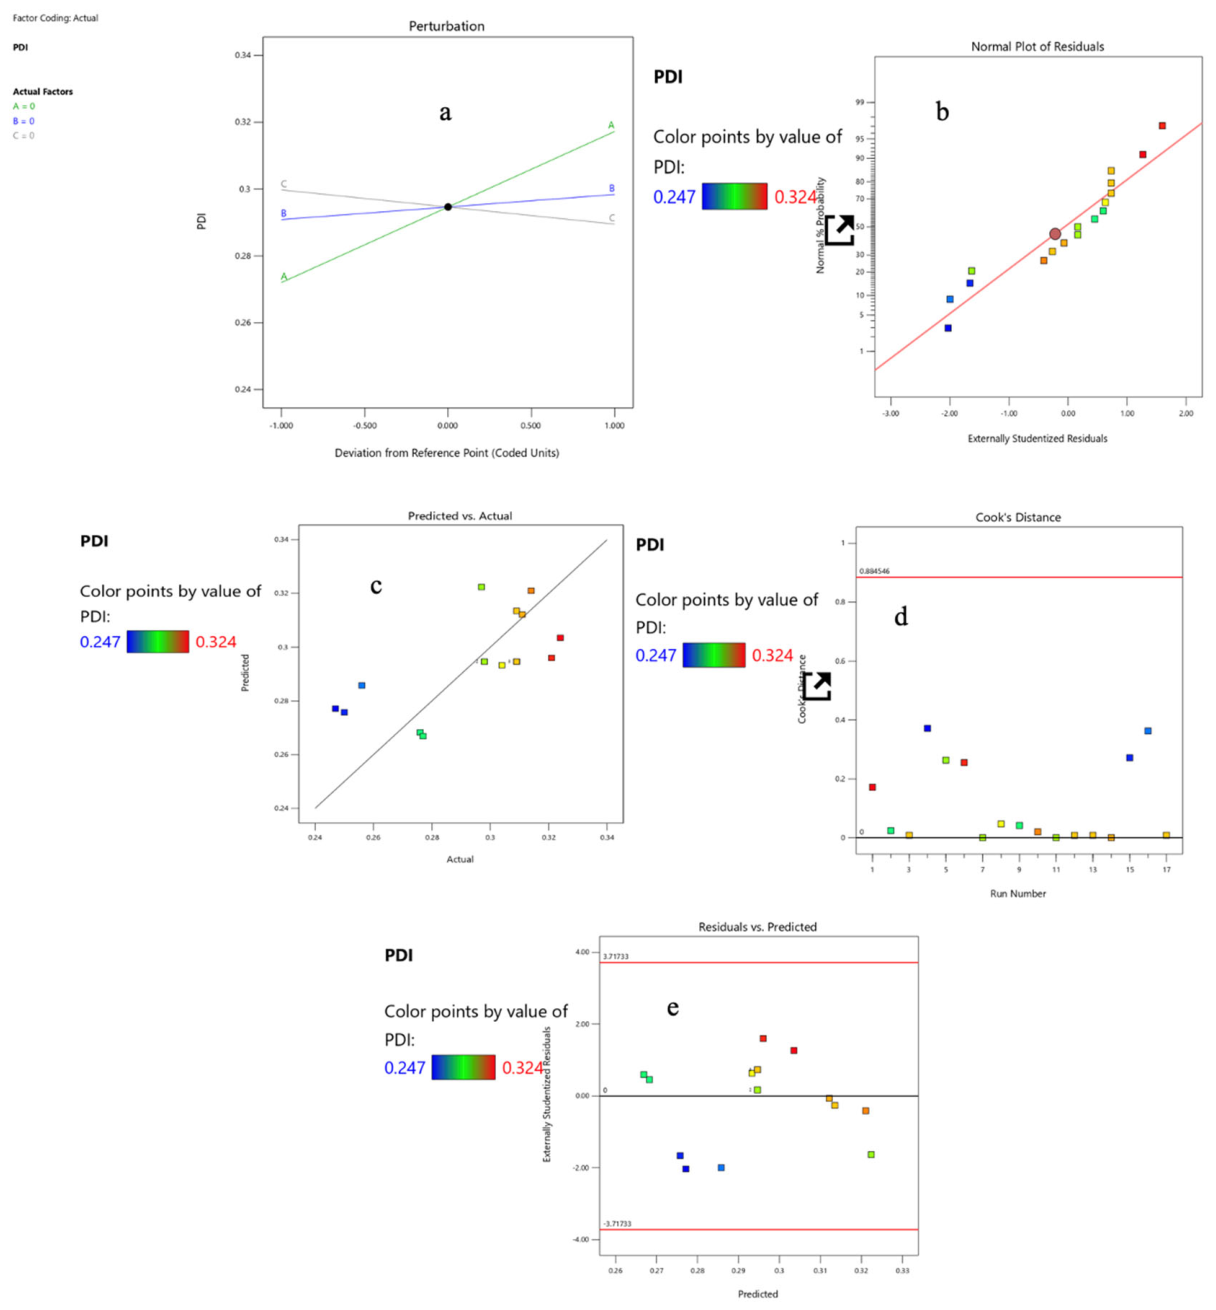
2.18. Diagnostic Plots for Polydispersity Index (PDI)
The adequacy of the fitted model for the polydispersity index was evaluated using the same set of diagnostic plots (
Figure 10). The perturbation chart (
Figure 10a) illustrated the relative influence of the three independent variables on PDI, with the aqueous phase (A) showing the most pronounced effect. The normal probability plot of residuals (
Figure 10b) showed the residuals distributed reasonably along the straight line, supporting the assumption of normality. The predicted vs. actual plot (
Figure 10c) showed the observed and predicted PDI values lying near the line of equality, while the wider scatter relative to the particle-size model is consistent with the lower coefficient of determination obtained for PDI. The Cook’s distance plot (
Figure 10d) showed that the influence of individual runs was generally within acceptable limits, and the residuals vs. predicted plot (
Figure 10e) showed a random distribution of residuals within the control limits, indicating constant variance. Overall, the diagnostic plots confirm that the model assumptions were reasonably satisfied for PDI.
2.19. Quadratic Regression ANOVA for PDI
The ANOVA results for the linear (main-effects) model fitted to PDI are presented in
Table 13, and the corresponding fit statistics in
Table 14. The model F-value of 3.73 indicates that the overall regression model is statistically significant, with approximately a 3.92% probability that an F-value of this magnitude could occur due to chance alone. Among the three independent variables, only the aqueous phase (A) had a statistically significant effect on PDI (
p = 0.0067), whereas the oil:surfactant ratio (B,
p = 0.6026) and sonication time (C,
p = 0.4788) were not significant, indicating that the aqueous phase was the principal factor governing PDI.
The linear model showed a low coefficient of determination (R2 = 0.4624), with an adjusted R2 of 0.3383 and a negative predicted R2 (−0.0607). In addition, the lack of fit was significant (p = 0.0093). Together, these indicate that the model explains only a small portion of the variability in PDI and is suitable for describing and screening the factors rather than for precise prediction. This outcome is expected given the very narrow range of PDI observed across the formulations (0.247–0.324), which restricts the model’s ability to discriminate between runs. Nevertheless, the adequate precision value of 5.76 (>4) confirms an adequate signal-to-noise ratio, indicating that the model is still usable for navigating the design space. Importantly, all PDI values remained well below 1.0, confirming a narrow and homogeneous droplet size distribution across all formulations.
2.20. Regression Model Equations
The relationship between the independent variables and the responses was expressed as polynomial equations in terms of coded factors (
Table 15). The particle size response (Y
1) was best described by a second-order (quadratic) model, whereas the PDI response (Y
2) was best described by a first-order (linear) model. The fitted equations were as follows:
In these coded equations, a positive coefficient indicates that the response increases as the factor increases, while a negative coefficient indicates the opposite effect; the magnitude of each coefficient reflects the relative contribution of that term. For particle size, the quadratic term A2 (4.56) and the interaction terms AC (4.05) and BC (3.57) had the largest coefficients, indicating that the aqueous phase and its interactions with sonication time and oil:surfactant ratio were the dominant factors governing droplet size, in agreement with the ANOVA. For PDI, only the linear terms were retained; the aqueous phase (A, 0.0226) was the dominant and only statistically significant factor, while the oil:surfactant ratio and sonication time contributed only marginally.
On the basis of these constraints, the software generated a number of feasible solutions, of which four were selected after assessment of the design space (
Table 16). The solution with the highest desirability value (0.925) was chosen as the optimized formulation, corresponding to an aqueous phase of 75%, an oil:surfactant ratio of approximately 1.0, and a sonication time of 10 min. Under these conditions, the model predicted a particle size of 138.01 nm and a PDI of 0.260. The desirability value close to unity indicates that the selected conditions satisfactorily fulfilled all the predefined criteria.
It should be noted that the optimized formulation represents a model-predicted combination within the design space and was not part of the original 17 experimental runs; it was therefore prepared and experimentally verified (checkpoint analysis,
Table 17) to confirm the predicted particle size and PDI.
The optimized formulation was prepared and evaluated, and the experimentally observed responses were compared with the values predicted by the model (
Table 17). The close agreement between the predicted and observed particle size confirmed the reliability of the optimization.
2.21. Numerical Optimization and Validation
A numerical optimization technique utilizing the desirability function was employed to determine the optimum levels of the independent formulation factors—aqueous phase volume (A), oil-surfactant concentration (B), and sonication time (C)—to simultaneously minimize particle size (PS) and polydispersity index (PDI). The optimization constraints and targets are summarized in
Table 18.
The software generated multiple predictive solutions across the evaluated design space based on the established polynomial equations. The top four optimized solutions selected after assessment of the design space are presented in
Table 16. These solutions were derived from the predictive mathematical surface model rather than being restricted to the initial discrete coordinates of the experimental design matrix (
Table 4).
Solution 1, which exhibited an overall desirability score of 0.925, was selected as the definitive formulation for physical validation. The optimized independent variable levels for this formulation were determined to be 75.000 mL for aqueous phase volume, 1.000% for oil-surfactant concentration, and 10.000 min for sonication time. The predicted responses for this configuration were a PS of 138.013 nm and a PDI of 0.260.
To verify the predictive accuracy of the model, a validation batch was physically formulated using these optimized parameters. As presented in
Table 18, the experimentally obtained value for particle size was 139.5 nm, while the observed PDI was 0.256. The calculated absolute error between the predicted and observed responses was found to be minimal (0.913 for PS and 1.54 for PDI), demonstrating high predictive validity.
2.22. Numerical Optimization Using Desirability Function
Following the generation of the response surface models, a numerical optimization analysis using the desirability function was executed to determine the optimum levels of the independent variables for the formulation. The optimization targets were established to simultaneously minimize both particle size (PS) and polydispersity index (PDI) while maintaining the independent factors within their studied experimental ranges.
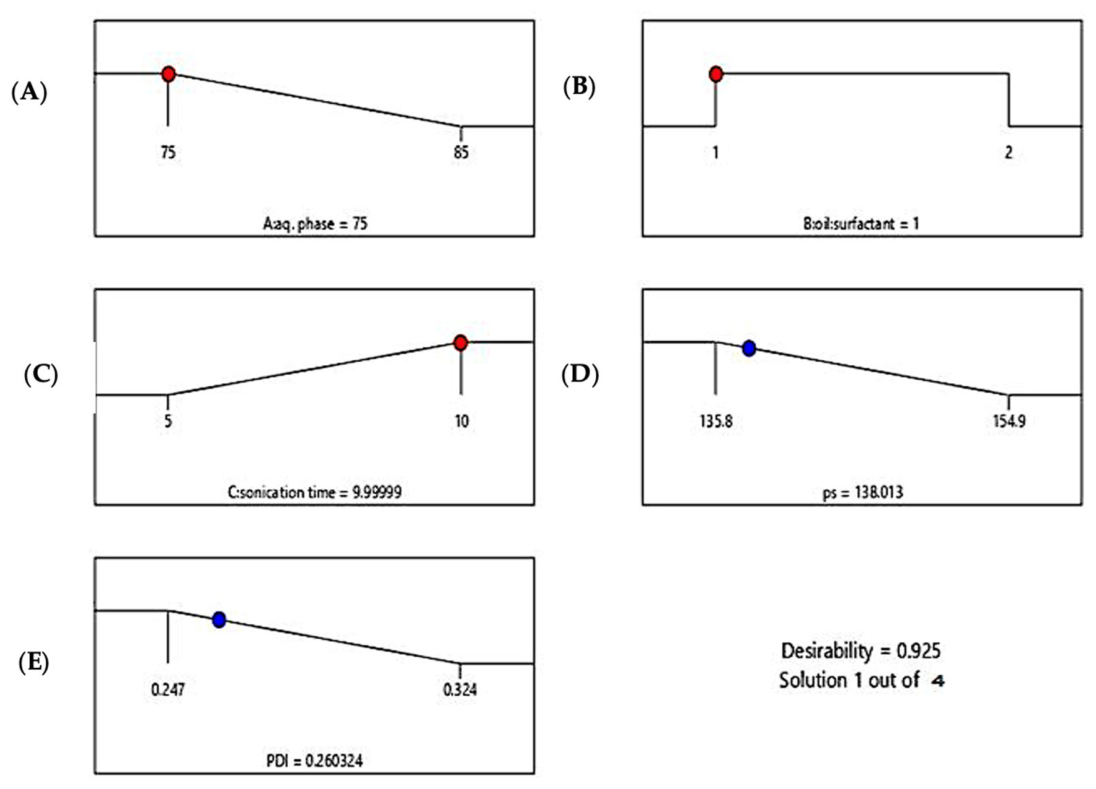
The software evaluated the multi-response design space and generated a series of predictive solutions. As illustrated in the desirability ramp plots (
Figure 11), the top-ranked configuration (Solution 1) achieved a high overall desirability score of 0.925.
The optimized independent variable levels identified by the model were:
Aqueous Phase Volume (Factor A): 75.000 mL (corresponding to the lower limit of the evaluated range).
Oil-Surfactant Concentration (Factor B): 1.000% (corresponding to the lower limit of the evaluated range).
Sonication Time (Factor C): 10.000 min (rounded from 9.99999 min, corresponding to the upper limit of the evaluated range).
Under these optimal processing and compositional conditions, the software predicted a minimized Particle Size (PS) of 138.013 nm and a narrow Polydispersity Index (PDI) of 0.260 (0.260324), indicating a highly homogeneous nano-system distribution.
2.23. Influence of Independent Formulation Factors on Polydispersity Index (PDI)
To evaluate the interactive effects of the independent variable parameters on the homogeneity of the nanoformulation system, a three-dimensional (3D) response surface plot was constructed for the Polydispersity Index (PDI). As depicted in
Figure 12, the experimental PDI values ranged from a minimum of 0.247 (represented by the blue-shaded region) to a maximum of 0.324 (represented by the red-shaded region). The 3D surface plot maps the simultaneous interaction of Aqueous Phase volume (Factor A) and Oil-Surfactant concentration (Factor B) on the PDI response, while Sonication Time (Factor C) is held constant at its center level (C = 0).
The response surface profile demonstrates a linear and progressive incline in PDI as both independent variables shift from their lower coded levels (−1) to their upper coded levels (+1). The lowest PDI values (<0.260) are localized at the lower left quadrant of the design space mesh, corresponding to lower levels of Factor A and Factor B. Conversely, increasing the concentration of the oil-surfactant phase combined with a higher aqueous phase volume causes a distinct elevation in the PDI response, approaching the upper threshold of 0.324. The presence of the discrete design points clustered near the center coordinates signifies the replicated baseline formulations used to assess experimental reproducibility.
2.24. Morphological Assessment via Scanning Electron Microscopy (SEM)
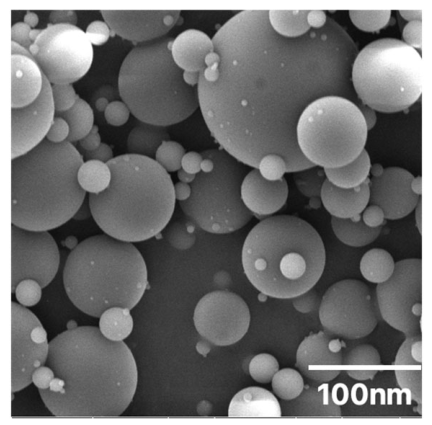
The surface morphology and structural architecture of the optimized Artemether-loaded nanoemulsion were evaluated using Scanning Electron Microscopy (SEM). As depicted in
Figure 13, the SEM micrograph reveals that the formulated nanodroplets possess a distinct, spherical geometry with smooth surface characteristics. The droplets are observed as intact, well-defined spheres without significant structural deformation. The particle sizes visually observed in the micrograph relative to the 100 nm scale bar correspond closely with the mean hydrodynamic particle size (139.6 ± 1.3 nm) determined via Dynamic Light Scattering (DLS), with the presence of both smaller and moderately larger droplets reflecting the recorded polydispersity index.
2.25. Stability Studies
The physical and chemical stability of the optimized ART-NE was evaluated at 40 ± 2 °C/60 ± 5% RH over a 9-month period, with particle size, PDI, zeta potential, and drug content monitored at 3, 6, and 9 months
Table 19.
A gradual but modest increase in particle size was observed over the storage period, from 139.6 ± 1.3 nm initially to 165 ± 7 nm at 9 months, an increase of approximately 18%. Correspondingly, the PDI rose from 0.256 ± 0.03 to 0.38 ± 0.04, indicating a progressive but limited broadening of the size distribution, most likely attributable to slow Ostwald ripening and minor droplet coalescence over prolonged storage; notably, PDI remained below 0.4 throughout, consistent with an acceptably narrow size distribution.
The zeta potential decreased in magnitude from −30.08 ± 1.1 mV to −22.0 ± 2.0 mV over 9 months. Since values more negative than ±20–30 mV are generally considered adequate to maintain electrostatic-repulsion-based colloidal stability, the formulation retained sufficient surface charge to resist droplet aggregation throughout the study, although the declining trend suggests a gradual weakening of the electrostatic barrier with extended storage.
Drug content declined from 98.44 ± 0.2% at day 0 to 92.5 ± 1.5% at 9 months, representing a cumulative loss of approximately 6%, which remains within the generally accepted ± 10% limit for acceptable drug retention and indicates that no major chemical degradation of ART occurred under the storage conditions tested.
Taken together, these results indicate that the optimized ART-NE remained physically and chemically stable over the 9-month evaluation period, with all monitored parameters (particle size, PDI, zeta potential, drug content) remaining within acceptable pharmaceutical limits, supporting a shelf-life claim consistent with the observed data.
3. Discussion
3.1. Calibration Curve and Analytical Method Alignment
Quantitative assessment of Artemether (ART) was established via a UV-Visible spectrophotometric technique at an analytical wavelength of 210 nm. The calibration curve followed the linear equation y = 0.0308x + 0.045 (R2 = 0.999) over the concentration range of 5–25 µg/mL. The highly lipophilic structure of ART lacks a strong, highly conjugated chromophore, making the shorter ultraviolet wavelength region near 210 nm necessary for diagnostic electronic transitions. The linear relationship conforming to the Beer–Lambert law across the selected concentration range (5–25 μg/mL) was confirmed by an excellent coefficient of determination (R2 = 0.999), with a Limit of Detection (LOD) of 0.71 μg/mL and Limit of Quantitation (LOQ) of 2.15 μg/mL further confirming the method’s adequate sensitivity for quantifying ART in the nanoemulsion, dissolution, and permeation media used throughout this study.
A validated reverse-phase HPLC method was additionally developed and employed to confirm the identity and purity of the ART reference standard. The detection of a major, symmetrical peak at a retention time of approximately 2.5 min confirms the identity of the analyte and the column’s satisfactory performance under the optimized mobile phase conditions, while two resolved minor peaks at 2.25 and 3.35 min, consistent with known artemisinin-derivative impurities or degradation products, demonstrate that the method possesses adequate selectivity to distinguish the intact API from related substances. This chromatographic confirmation of drug identity and purity complements, rather than replaces, the UV-spectrophotometric method used for routine quantification: HPLC establishes that the reference standard used to construct the UV calibration curve is authentic and free of major interfering impurities, lending additional confidence to the UV-based quantitative results reported in this study. The observed retention behavior is broadly consistent with established compendial approaches, which commonly employ C18 reverse-phase columns and aqueous-organic mobile phases for ART analysis, supporting the overall robustness of the analytical strategy adopted in this study.
3.2. FT-IR Spectroscopy and Drug–Excipient Compatibility
FT-IR spectroscopy was performed to evaluate the chemical structural integrity of ART and its compatibility with the lipidic and surfactant excipients. The characteristic absorption spectrum of pure ART displayed definitive fingerprint bands: the prominent peak at 1715 cm−1 corresponding to C=O stretching, and the distinctive bands at 2945 cm−1 and 1104 cm−1 representing aliphatic C–H and C–O stretching, respectively.
When the spectra of the pure drug, the physical mixture, and the prepared nanoemulsion formulation were overlaid, no shifts, disappearances, or new peaks were observed. The retention of these essential functional group vibrations at their baseline wavenumber positions indicates that no chemical bond cleavage, cross-linking, or degradation occurred during formulation, confirming that the combination of Sunflower oil, Vippa oil, Tween 80, and Span 80 forms a chemically stable, non-reactive matrix that preserves the structural integrity of ART.
3.3. Thermal Behavior via DSC Analysis and Reconciliation with Solubilization Evidence
Differential Scanning Calorimetry (DSC) was used to probe the physical state of ART within the optimized nanoemulsion. Pure crystalline ART displayed a sharp, symmetric melting endotherm at 86.5 °C, and a thermal transition was still detectable at 86.8 °C in the formulation. This finding, however, should not be taken at face value as evidence that the bulk of the drug remains in an undissolved crystalline state within the intact oil droplets during actual use.
DSC analysis of a nanoemulsion necessarily involves heating a liquid colloidal sample well above ambient temperature, during which progressive evaporation of the aqueous continuous phase can concentrate the sample and allow molecularly dissolved drug to re-nucleate and crystallize within the pan before the melting transition is reached. Under these conditions, a thermogram can register a melting endotherm even when the drug exists predominantly in a solubilized, non-crystalline state within the hydrated nanoemulsion droplets. This represents a recognized limitation of applying bulk thermal analysis directly to liquid colloidal systems. The likelihood of this explanation, rather than genuine bulk crystallinity, is reinforced by three independent lines of evidence generated elsewhere in this study.
First, the optimized nanoemulsion achieved a high entrapment efficiency of 95.42 ± 1.18%; a substantial crystalline drug fraction would be expected to compromise recovery during the ultrafiltration-based EE assay, and no such loss was observed. Second, the ex vivo permeation study demonstrated a 4.04 ± 0.18-fold enhancement in steady-state flux and a markedly shortened lag time relative to a plain drug suspension, a magnitude of enhancement more characteristic of a molecularly available, readily partitioning drug than one predominantly locked in a crystalline lattice. Third, and most directly, the in vitro lipolysis study showed that 78.4 ± 2.6% of the ART dose was recovered in the aqueous micellar phase following simulated intestinal digestion, compared with only 2.8 ± 0.5% for the plain suspension, demonstrating that the drug is readily available for micellar solubilization upon digestion of the lipid matrix, rather than persisting as a discrete crystalline phase resistant to solubilization.
Taken together, these findings indicate that ART is predominantly present in a molecularly dissolved or solubilized state within the intact nanoemulsion, consistent with the solubilization rationale for nanoemulsion-based delivery discussed in the Introduction. The retained DSC endotherm most likely reflects thermally induced re-crystallization occurring during the analysis itself, rather than the true solid-state status of the drug within the formulated product. Confirmatory analysis by powder X-ray diffraction (PXRD) of a freeze-dried nanoemulsion sample, or hot-stage microscopy of the intact liquid formulation, would allow this interpretation to be directly verified and is recommended as a priority follow-up study.
3.4. Particle Size, Polydispersity Index (PDI), and Morphological Homogeneity
Dynamic light scattering (DLS) analysis of the 17 experimental formulations showed droplet sizes ranging from 135.8 nm to 154.9 nm, a narrow sub-micron distribution favorable for overcoming the dissolution-rate-limited absorption of ART. The validated checkpoint formulation reached an optimized particle size of 139.6 nm, a reduction directly attributable to the acoustic cavitation generated during probe sonication, which produces intense localized micro-shear forces that break down coarse oil globules into uniform nanometer-sized droplets.
The finalized PDI of the optimized batch reached 0.160, an improvement over the model’s predicted baseline of 0.257. A PDI below 0.200 signifies a highly monodisperse, narrow size distribution, reducing the risk of Ostwald ripening, wherein larger droplets grow at the expense of smaller ones through concentration gradients. This distributional uniformity, corroborated independently by the SEM morphology, supports the expectation that the nanoemulsion droplets will behave consistently within the gastrointestinal environment, promoting reproducible drug transport.
3.5. Zeta Potential and System Electrostatic and Steric Stability
The physical storage stability of the optimized nanoemulsion is supported by a high negative surface charge, with a zeta potential of −30.08 ± 1.1 mV. According to classic DLVO (Derjaguin–Landau–Verwey–Overbeek) theory, an absolute zeta potential exceeding ±25–30 mV provides a sufficient electrostatic repulsion barrier between adjacent dispersed globules, counteracting the weak van der Waals attractive forces that would otherwise drive flocculation and coalescence during Brownian motion.
This net negative surface charge is attributed to the orientation of the non-ionic surfactants (Tween 80 and Span 80) at the oil–water interface, together with ionization of free fatty acid constituents inherent to the natural Vippa oil and Sunflower oil. Beyond this electrostatic contribution, the bulky polyoxyethylene head groups of Tween 80 and the sorbitan ring structure of Span 80 also confer a degree of steric stabilization: their hydrophilic moieties extend into the aqueous continuous phase, forming a physical, hydrated barrier around each droplet that impedes close approach and coalescence independently of surface charge. This combined electrostatic-steric stabilization mechanism is consistent with the well-established behavior of nonionic-surfactant-stabilized emulsions, and together with the favorable PDI and the phase-integrity confirmed by dilution testing, supports the overall colloidal robustness of the optimized formulation.
3.6. Phase Integrity via Dilution Testing
The dilution test confirmed the structural stability of the optimized formulation as an oil-in-water (O/W) nanoemulsion. Upon exposure to an excess volume of water, the continuous phase expanded smoothly without phase inversion, flocculation, or drug precipitation, indicating that the surfactant film surrounding the oil cores is sufficiently cohesive and elastic to withstand the thermodynamic stress of sudden aqueous dilution. This behavior supports the expectation that the formulation will remain intact as a stable nano-colloidal dispersion upon exposure to gastric and intestinal fluids.
3.7. Drug Loading Capability of the Dual-Oil Matrix
The formulation achieved high drug content across all design runs (86.12–98.44%), with the optimized batch reaching 98.44 ± 0.2%. As a BCS Class II compound with high lipophilicity and poor aqueous solubility, ART exhibits a strong thermodynamic preference for partitioning into the hydrophobic dual-oil core rather than the continuous aqueous phase. The combination of Sunflower oil and the non-conventional Vippa oil selected on the basis of their superior quantitative ART solubility relative to the other excipients screened (
Table 2) provides a tailored lipid environment capable of solubilizing a substantial ART dose without requiring excessive surfactant concentrations that could otherwise cause gastrointestinal irritation. This high, consistent drug loading is further corroborated by the entrapment efficiency (95.42 ± 1.18%) and is consistent with the solubilized drug state discussed, rather than with a discrete, unencapsulated crystalline drug fraction.
3.8. Mechanistic Analysis of In Vitro and Ex Vivo Release Kinetics
The in vitro dissolution profiling showed controlled release, with the optimized nanoemulsion delivering a cumulative drug release of 97.90 ± 0.97% over 12 h. This sustained release behavior is explained by the Noyes–Whitney equation: sub-micron droplet size substantially expands the interfacial surface area exposed to the dissolution medium while decreasing the thickness of the surrounding hydrodynamic diffusion layer, establishing a steady, prolonged diffusion gradient.
Kinetic model fitting showed the zero-order model provided the best fit (R2 = 0.963–0.995), indicating a constant, predictable release rate favorable for minimizing plasma concentration fluctuations. The Korsmeyer–Peppas release exponent (n) values, ranging from 0.13 to 0.39 across all 17 formulations, fall below the n ≤ 0.43 threshold characteristic of Fickian diffusion in spherical matrices, indicating that drug molecules diffuse steadily through the intact, surfactant-stabilized lipid boundary layer at a controlled rate.
The ex vivo permeation study using excised goat intestinal mucosa supported these findings, with cumulative permeation reaching 92.21 ± 0.97% at 12 h—a modest 5.69% reduction relative to the in vitro dissolution profile, representing the additional transport resistance imposed by the mucosal membrane barrier. The elevated permeation rate is consistent with Tween 80 and Span 80 acting as absorption enhancers, transiently modulating tight junctions and fluidizing lipid bilayers within the mucosal tissue. It is important to note that this ex vivo permeation enhancement demonstrates improved membrane transport under controlled experimental conditions; it is supportive of, but not equivalent to, confirmed improvement in oral bioavailability, which would additionally depend on gastrointestinal digestion behavior, first-pass metabolism, and systemic pharmacokinetics not evaluated in the present study.
3.9. Analysis of the Box–Behnken Design Space and Factor Interactions
The optimization process characterized the influence of each factor and their interactions on particle size and PDI. The Aqueous Phase Volume (Factor A) exerted a strong positive influence on both responses (+1.96 and +0.0226 coefficients, respectively), consistent with higher water volumes reducing the relative surfactant concentration available at the droplet boundary and increasing the risk of droplet aggregation and size-distribution broadening. Conversely, the Oil-to-Surfactant ratio (Factor B) showed a negative coefficient for particle size (−1.15), indicating that optimizing this ratio lowers interfacial tension and stabilizes smaller droplets.
The interaction terms AC (Aqueous Phase × Sonication Time) and BC (Oil-to-Surfactant Ratio × Sonication Time) were statistically significant (
p < 0.05), with coefficients of +4.05 and +3.57, respectively, indicating that extending sonication to 10 min is most effective when the aqueous phase and oil-surfactant levels are held at their lower design limits, allowing cavitation energy to transfer efficiently through a lower-viscosity environment without over-processing. The close agreement between the model-predicted and experimentally observed checkpoint values (
Table 16 and
Table 17) supports the practical reliability of the response-surface equations for navigating the design space, notwithstanding the model’s acknowledged limitations in predictive strength for particle size and PDI, which primarily reflect the narrow response ranges observed across the design rather than an inadequacy of the underlying formulation process itself.
3.10. Ex Vivo Permeation Enhancement Relative to Plain Drug Suspension
The ex vivo permeation data confirm that the enhanced in vitro release translates into a genuine improvement in membrane transport, not merely a dissolution-medium artifact. The optimized ART-NE showed a 4.04 ± 0.18-fold increase in steady-state flux, a markedly shorter lag time (1.85 ± 0.14 h → 0.42 ± 0.06 h), and substantially higher cumulative permeation (92.21 ± 0.97% vs. 24.35 ± 1.42% for the plain suspension), with the tight SD values indicating a consistent, reproducible effect rather than a chance result. This enhancement likely reflects the combined contribution of the nanoemulsion’s small droplet size and large interfacial area, the membrane-fluidizing action of Tween 80 and Span 80 on the intestinal brush border, and the drug being pre-dispersed at the nanoscale rather than needing to dissolve from a solid state, as required for the plain suspension. These results are consistent with, and provide ex vivo mechanistic support for, the improved bioavailability reported for other ART/Artemether nanocarriers (Laxmi et al. [
6]; Dwivedi et al. [
7]), while extending this evidence to the novel Vippa oil–Sunflower oil system used in this research; confirmation of the corresponding in vivo bioavailability improvement, however, would require dedicated pharmacokinetic evaluation, which was beyond the scope of the present study.
3.11. Morphological Confirmation via SEM
The morphological assessment via SEM visually confirms the structural integrity and colloidal stability of the optimized formulation. The distinctly spherical shape and absence of continuous-phase coalescence observed in the micrograph validate the physical stability of the system, consistent with the electrostatic and steric repulsion established by the zeta potential. The smooth surfaces of the discrete droplets indicate the formation of a stable, cohesive interfacial film by the non-ionic surfactant combination, effectively encapsulating the ART-loaded lipid core and maintaining boundary integrity. The nanoscale dimensions visualized in the electron micrograph further corroborate the DLS measurements (
Section 3.4), demonstrating the efficacy of the applied ultrasonication technique in producing a stable nanocarrier system suitable for oral drug delivery.
3.12. Entrapment Efficiency and Lipid Core Affinity
The optimized nanoemulsion achieved an entrapment efficiency of 95.42 ± 1.18%, confirming the strong encapsulation capability of the selected excipient system. This high EE% is attributable to the intrinsic physicochemical properties of ART: as a highly lipophilic BCS Class II compound, ART exhibits a strong thermodynamic drive to partition into the hydrophobic dual-oil core rather than the continuous aqueous phase, consistent with the solubilized drug state discussed in
Section 3.3 and the high drug content reported in
Section 3.7.
The robust entrapment values further indicate that the optimized sonication parameters did not cause drug expulsion. The non-ionic surfactant blend of Tween 80 and Span 80 rapidly migrated to the newly formed oil–water interfaces during acoustic cavitation, forming a tightly packed, cohesive interfacial film that restricted drug diffusion and prevented ART leakage into the external aqueous phase during formulation and subsequent storage.
3.13. In Vitro Lipolysis (Biorelevant Digestion) Study
The lipolysis study provides direct, measured evidence supporting the mixed-micelle solubilization pathway central to the oral absorption rationale of this formulation. Upon digestion of the Sunflower oil–Vippa oil core by pancreatic lipase, the vast majority of the ART dose (78.4 ± 2.6%) was recovered in the aqueous micellar phase, compared with only 2.8 ± 0.5% for the plain drug suspension, a striking ~28-fold enhancement. Correspondingly, precipitation of ART was reduced from 97.2 ± 0.5% (plain suspension) to just 5.4 ± 0.9% (optimized ART-NE), confirming that the nanoemulsion excipient system actively maintains the drug in a solubilized, absorbable state throughout digestion rather than allowing it to precipitate in the intestinal lumen as would occur with a conventional suspension. The 16.2 ± 1.4% of drug remaining in the residual oil phase at 30 min likely reflects ART retained within incompletely digested lipid droplets, consistent with the progressive, time-dependent nature of pancreatic lipolysis.
These findings substantiate, with direct experimental evidence rather than literature-based inference alone, that gastrointestinal digestion of the dual-oil core drives mixed micelle formation and sustains ART solubilization, the critical prerequisite step for intestinal absorption discussed in
Section 3.8, and independent corroborating evidence for the solubilized drug state proposed in
Section 3.3. Lymphatic transport and terminal intestinal uptake, however, remain mechanistically plausible rather than directly demonstrated in this study; confirming these specific pathways, and their ultimate contribution to systemic ART exposure, would require in vivo pharmacokinetic evaluation (e.g., with and without lymphatic blockade, such as cycloheximide pretreatment in an animal model), which is recommended as an important next step beyond the digestion, ex vivo permeation, and physicochemical characterization presented in this work.
5. Conclusions
Artemether-loaded nanoemulsions were successfully developed and systematically optimized using a probe-sonication technique. A Box–Behnken Design, applied within a Quality by Design framework, demonstrated that the aqueous phase volume, oil-to-surfactant ratio, and sonication time each exerted measurable effects on the key dependent responses, particle size and polydispersity index.
The optimized formulation—established at an aqueous phase volume of 75 mL, an oil-to-surfactant ratio of approximately 1.0%, and a sonication duration of 10 min yielded a sub-micron droplet profile with a validated checkpoint particle size of 139.6 ± 1.3 nm and a narrow PDI of 0.256 ± 0.03. Colloidal stability was supported by a zeta potential of −30.08 ± 1.1 mV, and morphological assessment by SEM confirmed discrete, spherical nanodroplets consistent with the DLS-derived size. The optimized nanoemulsion demonstrated high drug loading, with a drug content of 98.44 ± 0.2% and an entrapment efficiency of 95.42 ± 1.18%, and remained physically and chemically stable over a 9-month accelerated stability study, with all monitored parameters (particle size, PDI, zeta potential, drug content) remaining within acceptable pharmaceutical limits.
The optimized nanoemulsion provided a controlled and sustained in vitro release, achieving 97.90 ± 0.97% cumulative drug release over 12 h, following Zero-order and Higuchi release kinetics with a Korsmeyer–Peppas exponent consistent with Fickian diffusion. Ex vivo permeation across excised goat intestinal mucosa was substantially enhanced relative to a plain drug suspension, with a 4.04 ± 0.18-fold increase in steady-state flux and a markedly reduced lag time. This permeation enhancement was further supported by an in vitro lipolysis study, which showed that the nanoemulsion retained 78.4 ± 2.6% of the drug dose in the aqueous micellar phase following simulated intestinal digestion, compared with only 2.8 ± 0.5% for the plain drug suspension indicating that the dual-oil matrix (Vippa oil and Sunflower oil) effectively maintains Artemether in a solubilized, absorbable state throughout digestion rather than allowing it to precipitate as would occur with conventional oral dosage forms.
Collectively, these findings indicate that the optimized Artemether nanoemulsion possesses favorable physicochemical, release, digestion, and ex vivo permeation characteristics that support its potential as an oral delivery platform for this poorly water-soluble antimalarial drug. However, these conclusions are based entirely on in vitro, ex vivo, and accelerated stability data; no in vivo pharmacokinetic or pharmacodynamic evaluation, long-term (room-temperature, real-time) stability study, or pilot-scale/scale-up manufacturability assessment was performed as part of this work. Consequently, the extent to which the observed permeation and digestion enhancements translate into improved in vivo oral bioavailability, and whether the formulation remains stable and reproducible upon scale-up, cannot yet be confirmed. Future studies incorporating in vivo pharmacokinetic evaluation in a suitable animal model, long-term real-time stability testing under ICH-recommended storage conditions, and pilot-scale batch manufacture are recommended to validate the in vitro and ex vivo findings reported here and to support the translational development of this formulation as a viable oral antimalarial delivery system.




 ,
,