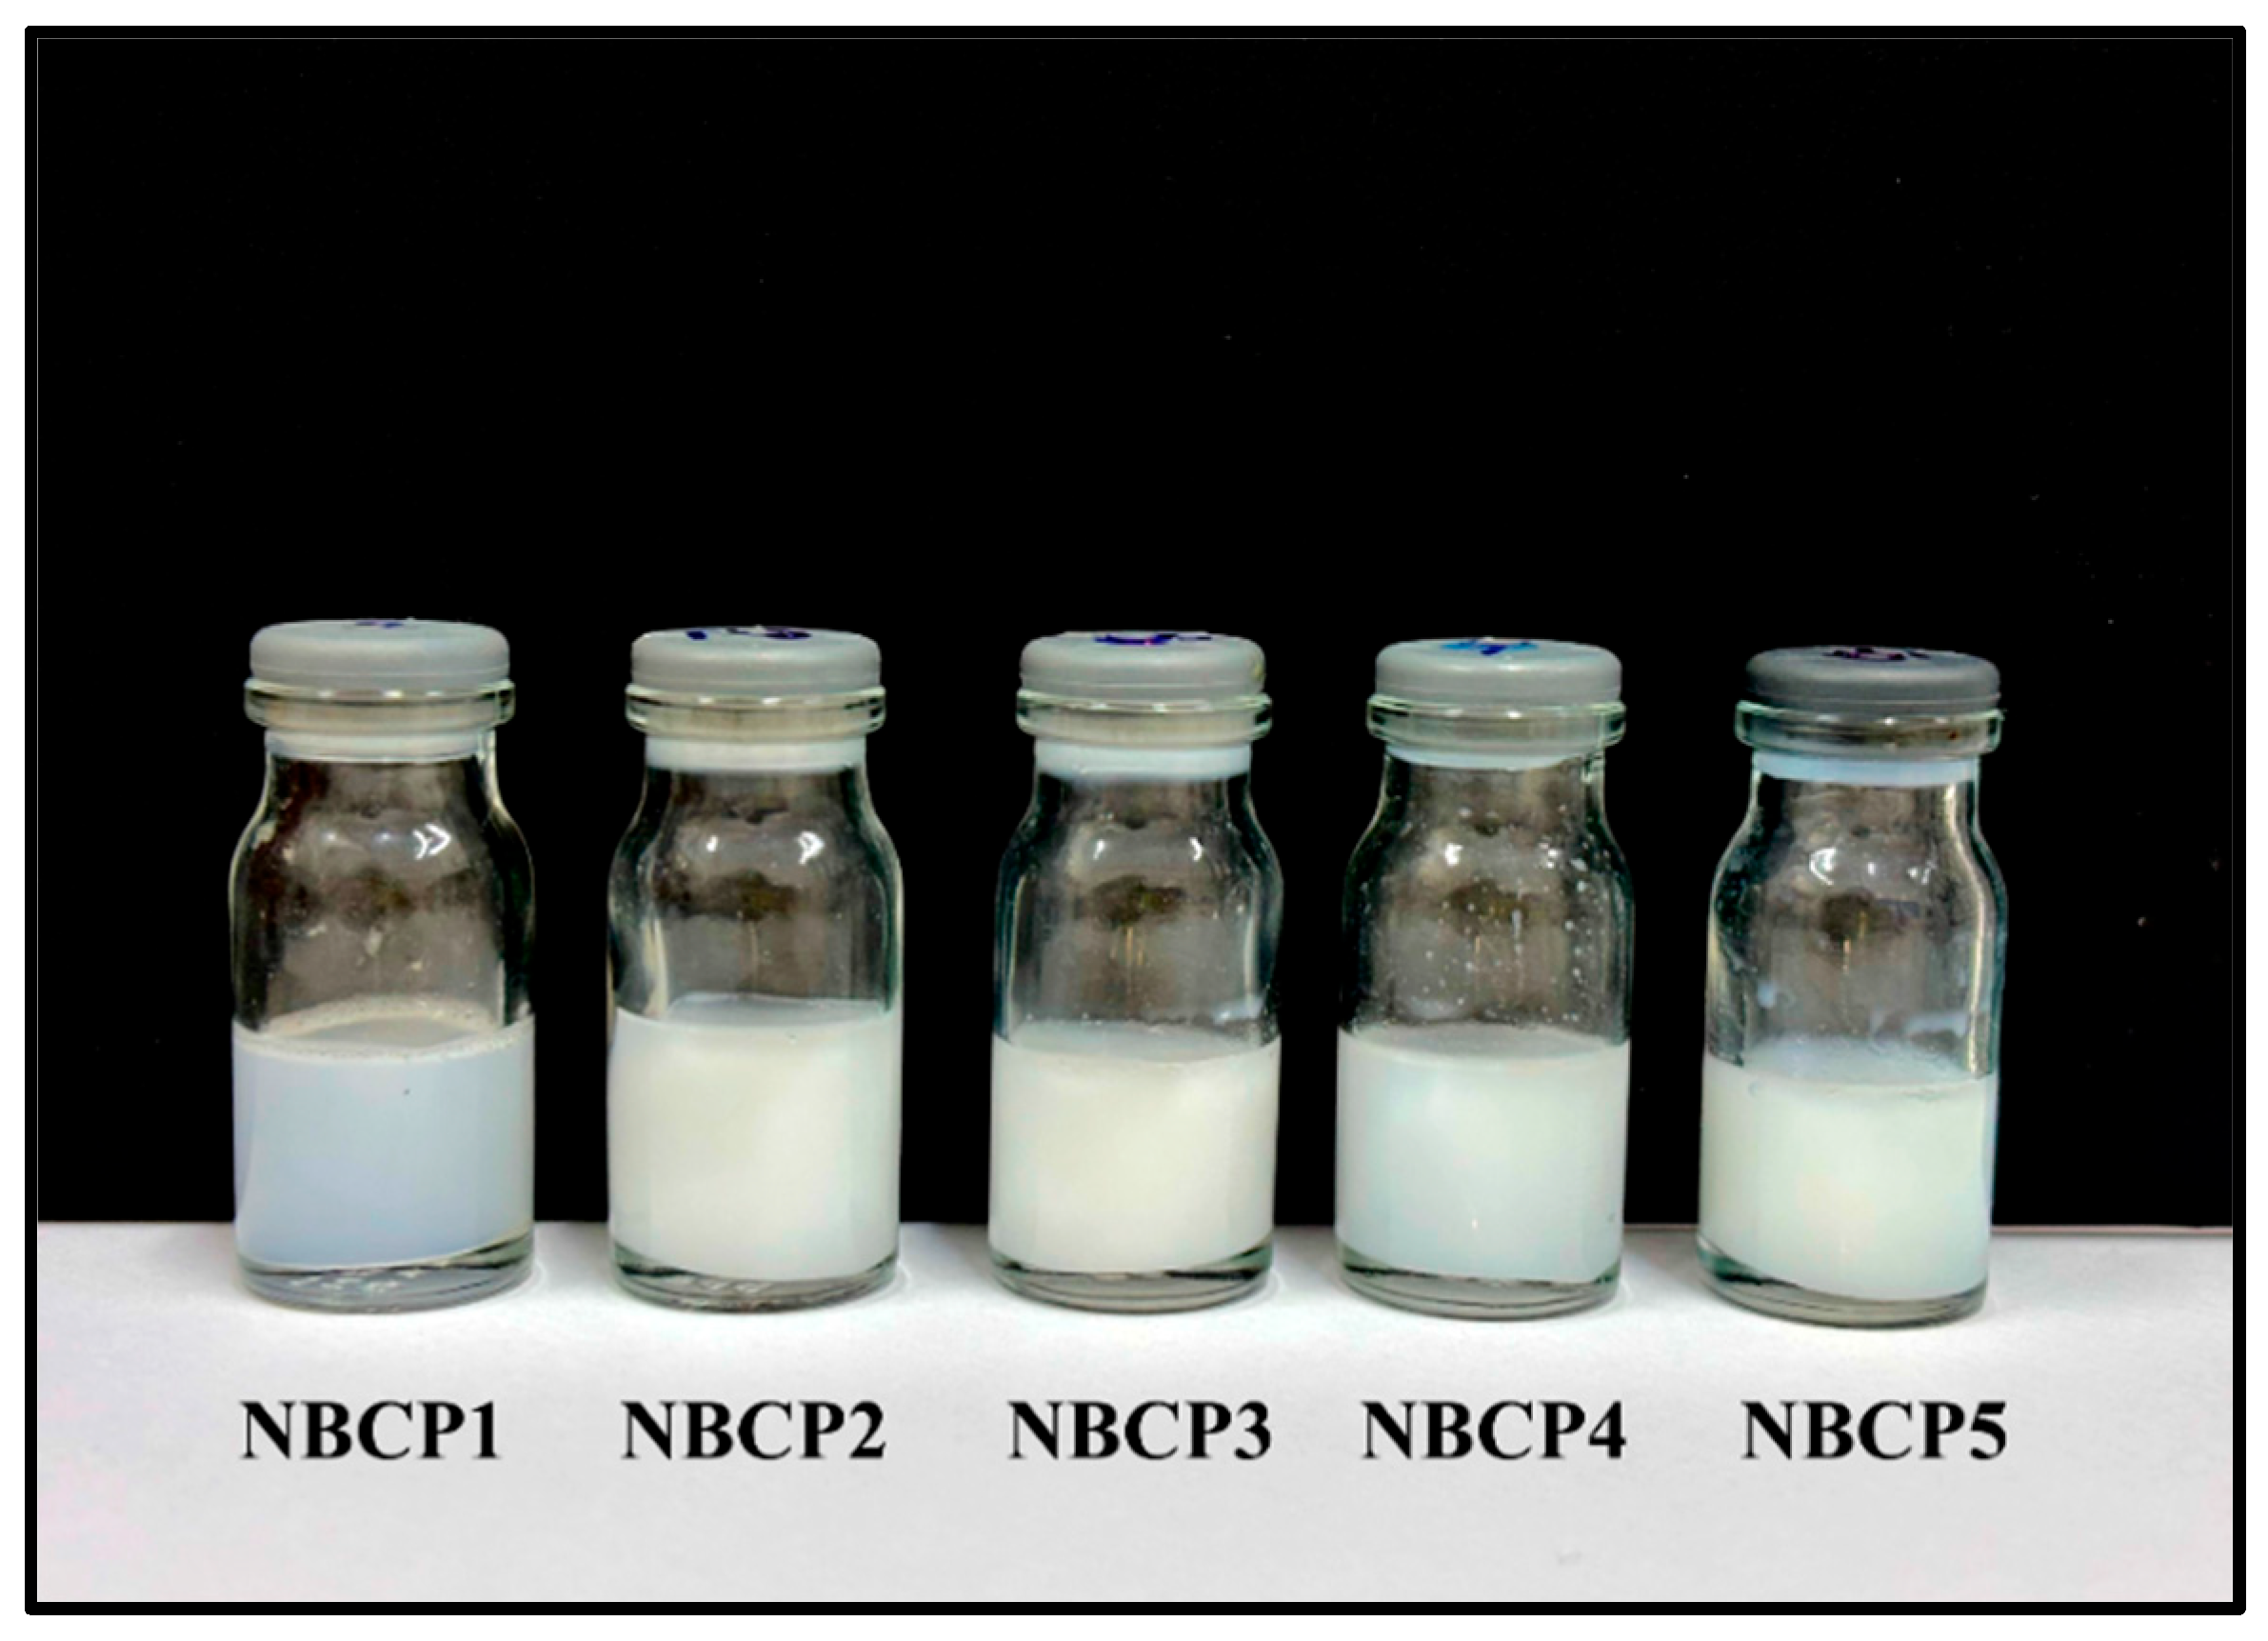
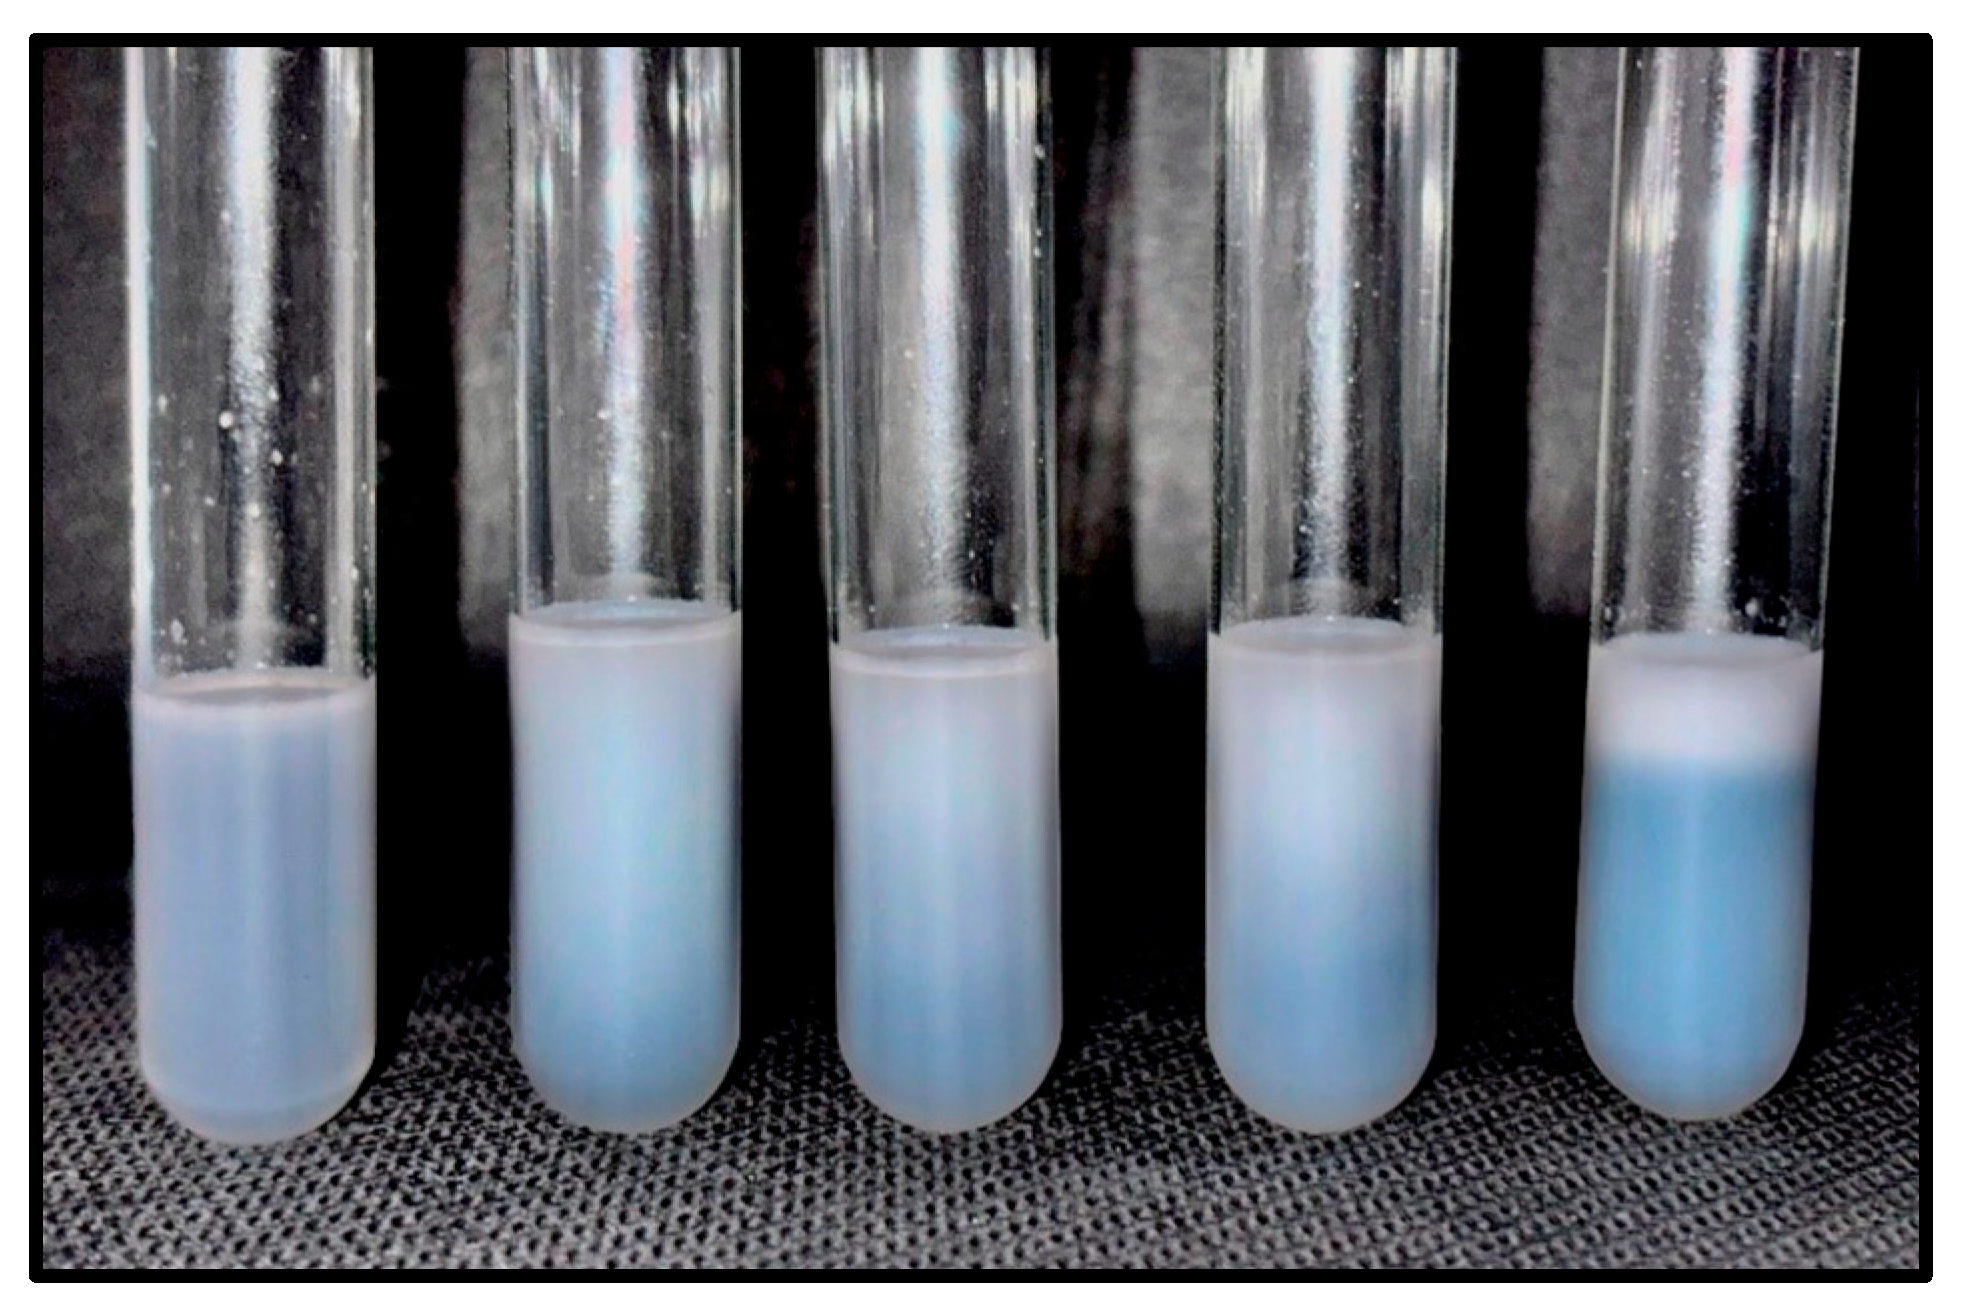
Figure 1.
Macroscopic appearance of β-caryophyllene nanoemulsions on the first day of stability evaluation.
Figure 1.
Macroscopic appearance of β-caryophyllene nanoemulsions on the first day of stability evaluation.
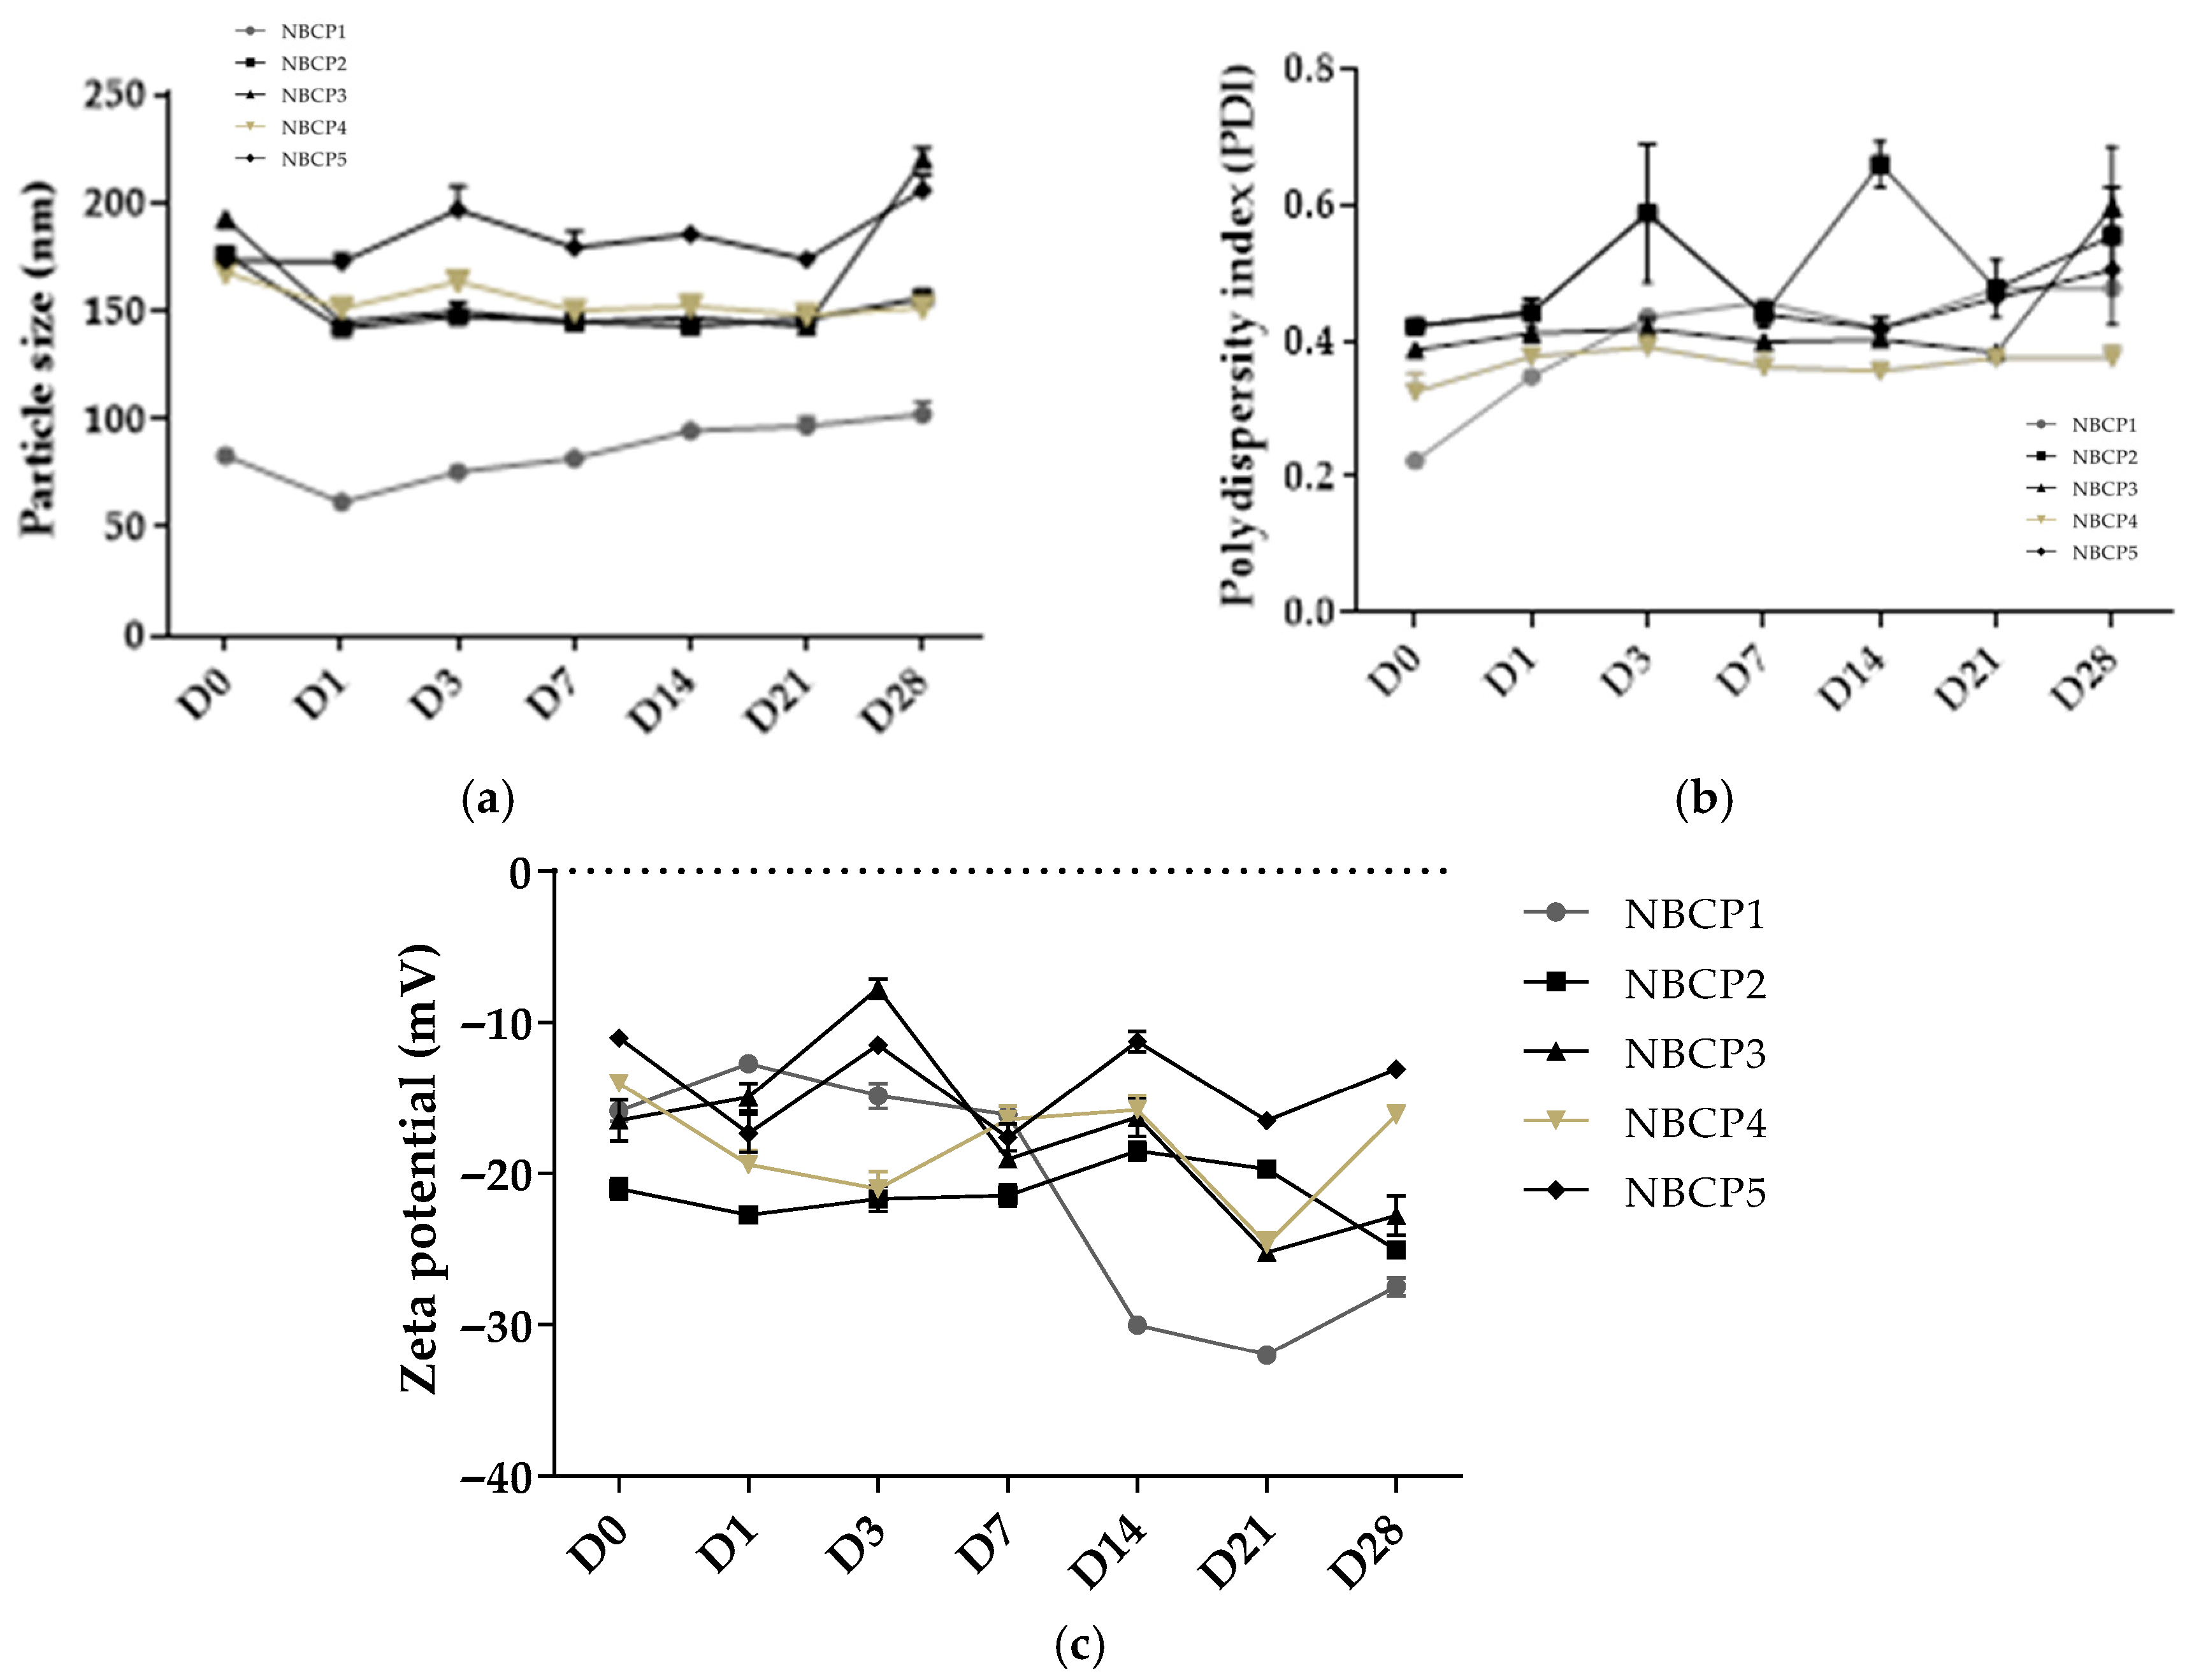
Figure 2.
Physicochemical characterization of β-caryophyllene nanoemulsions over 28 days: (a) particle size distribution, (b) polydispersity index (PDI), and (c) zeta potential (Z-average), determined by dynamic light scattering (Zetasizer ZS, Malvern, UK).
Figure 2.
Physicochemical characterization of β-caryophyllene nanoemulsions over 28 days: (a) particle size distribution, (b) polydispersity index (PDI), and (c) zeta potential (Z-average), determined by dynamic light scattering (Zetasizer ZS, Malvern, UK).
Figure 3.
Macroscopic appearance of β-caryophyllene nanoemulsions after centrifugation stress, showing phase separation in NBCP2, NBCP3, NBCP4, and NBCP5.
Figure 3.
Macroscopic appearance of β-caryophyllene nanoemulsions after centrifugation stress, showing phase separation in NBCP2, NBCP3, NBCP4, and NBCP5.
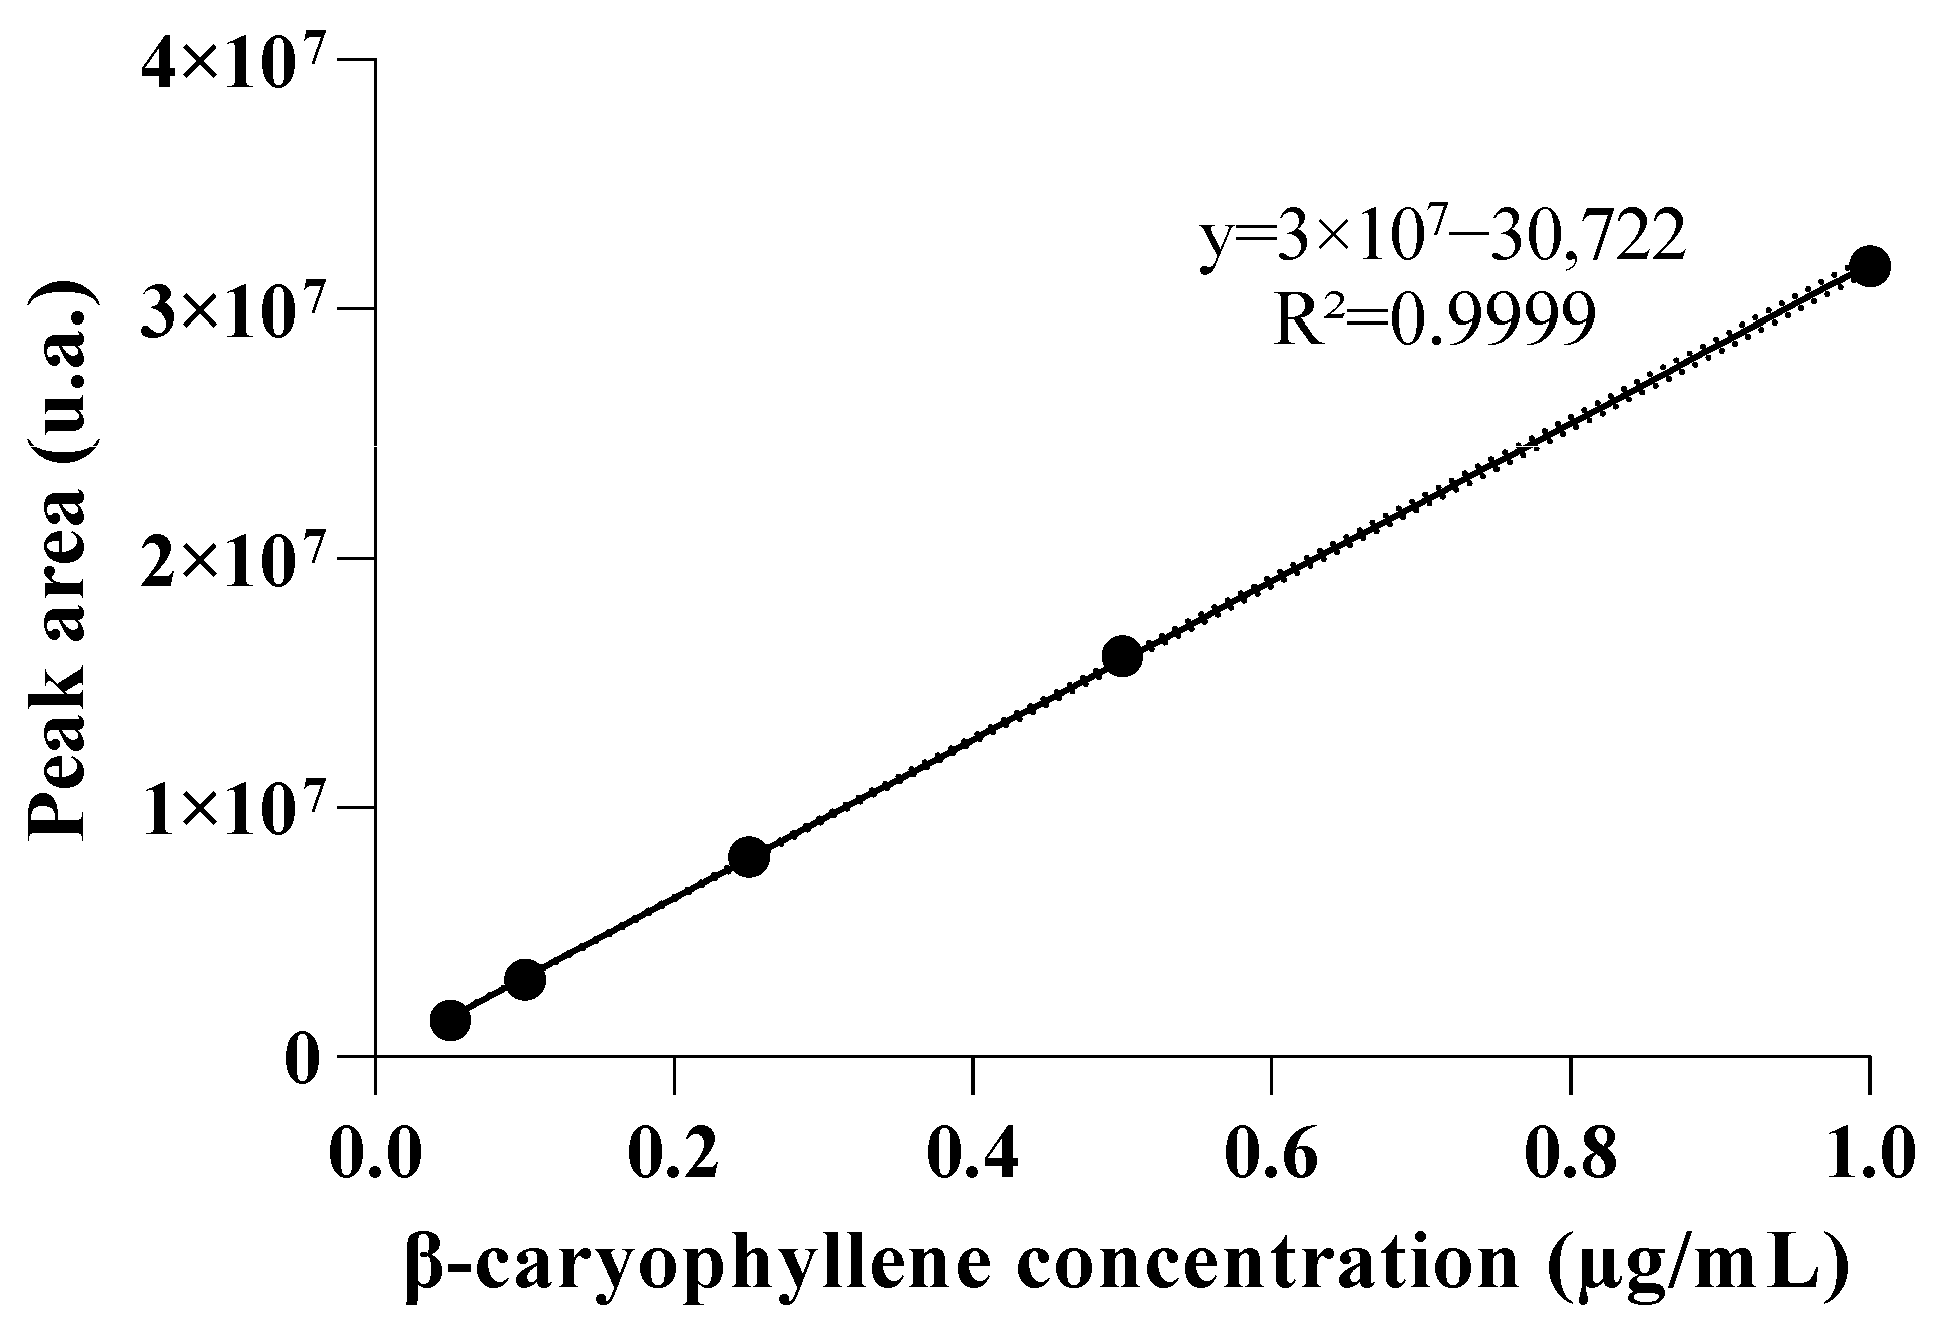
Figure 4.
Calibration curve of β-caryophyllene obtained by gas chromatography (GC–MS), showing the relationship between concentration and chromatographic peak area (y = 3 × 10⁷x − 30,722; R2 = 0.9999).
Figure 4.
Calibration curve of β-caryophyllene obtained by gas chromatography (GC–MS), showing the relationship between concentration and chromatographic peak area (y = 3 × 10⁷x − 30,722; R2 = 0.9999).
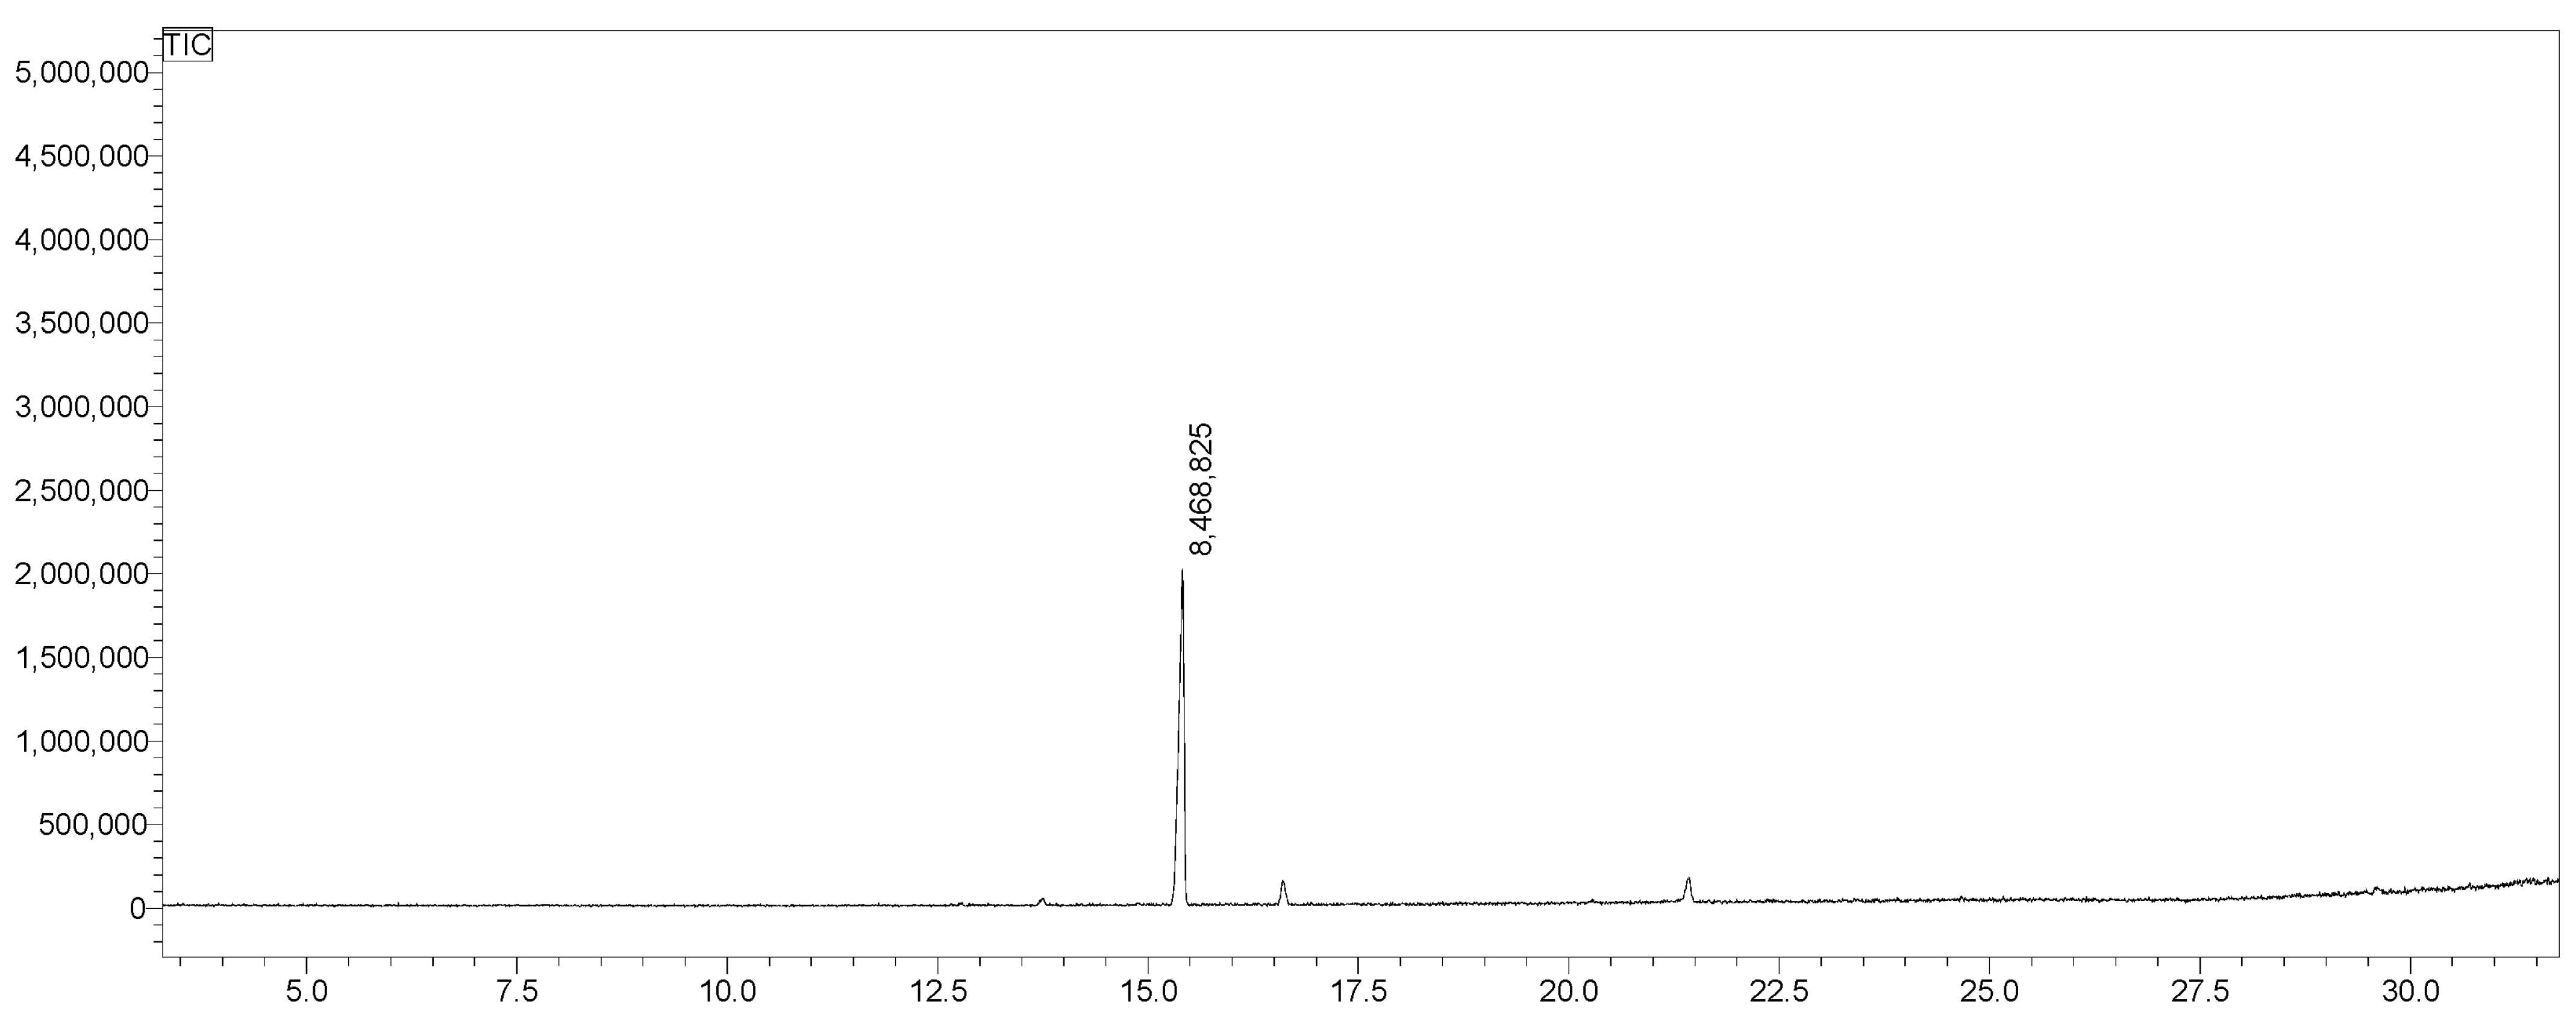
Figure 5.
GC–MS chromatogram of β-caryophyllene detected in the free fraction of the NBCP1 nanoemulsion.
Figure 5.
GC–MS chromatogram of β-caryophyllene detected in the free fraction of the NBCP1 nanoemulsion.
Figure 6.
GC–MS chromatogram of β-caryophyllene detected in the free fraction of the NBCP1 nanoemulsion. Mass spectrum of the peak corresponding to β-caryophyllene identified in the free fraction of the NBCP1 nanoemulsion.
Figure 6.
GC–MS chromatogram of β-caryophyllene detected in the free fraction of the NBCP1 nanoemulsion. Mass spectrum of the peak corresponding to β-caryophyllene identified in the free fraction of the NBCP1 nanoemulsion.
Figure 7.
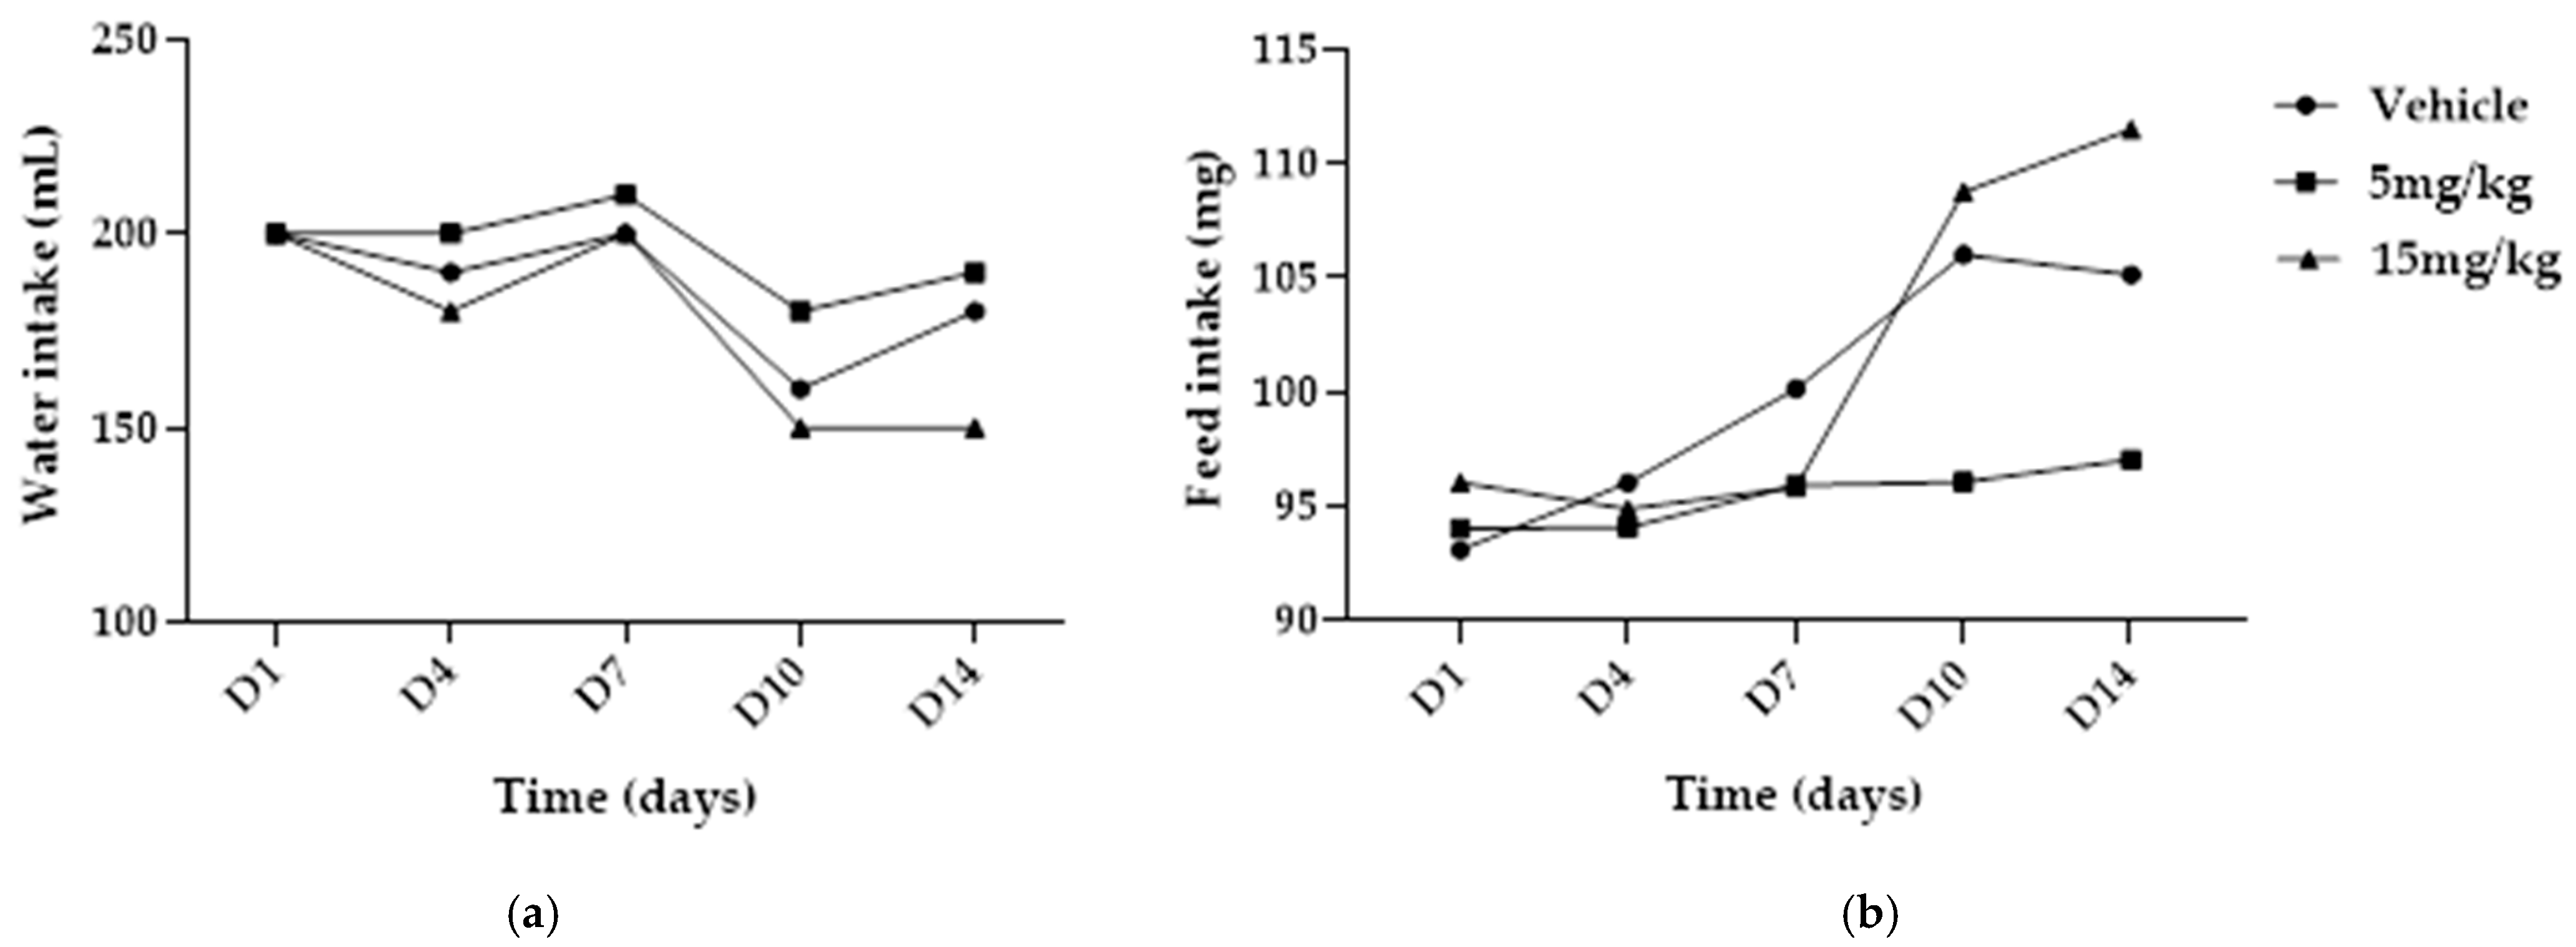
Effect of subacute intramuscular treatment with NBCP (5 and 15 mg/kg) on water and feed intake in male Wistar rats (n = 5). (a) Time course of water intake. (b) Time course of feed intake. Data are presented as descriptive group consumption over the 14-day treatment period.
Figure 7.
Effect of subacute intramuscular treatment with NBCP (5 and 15 mg/kg) on water and feed intake in male Wistar rats (n = 5). (a) Time course of water intake. (b) Time course of feed intake. Data are presented as descriptive group consumption over the 14-day treatment period.
Figure 8.
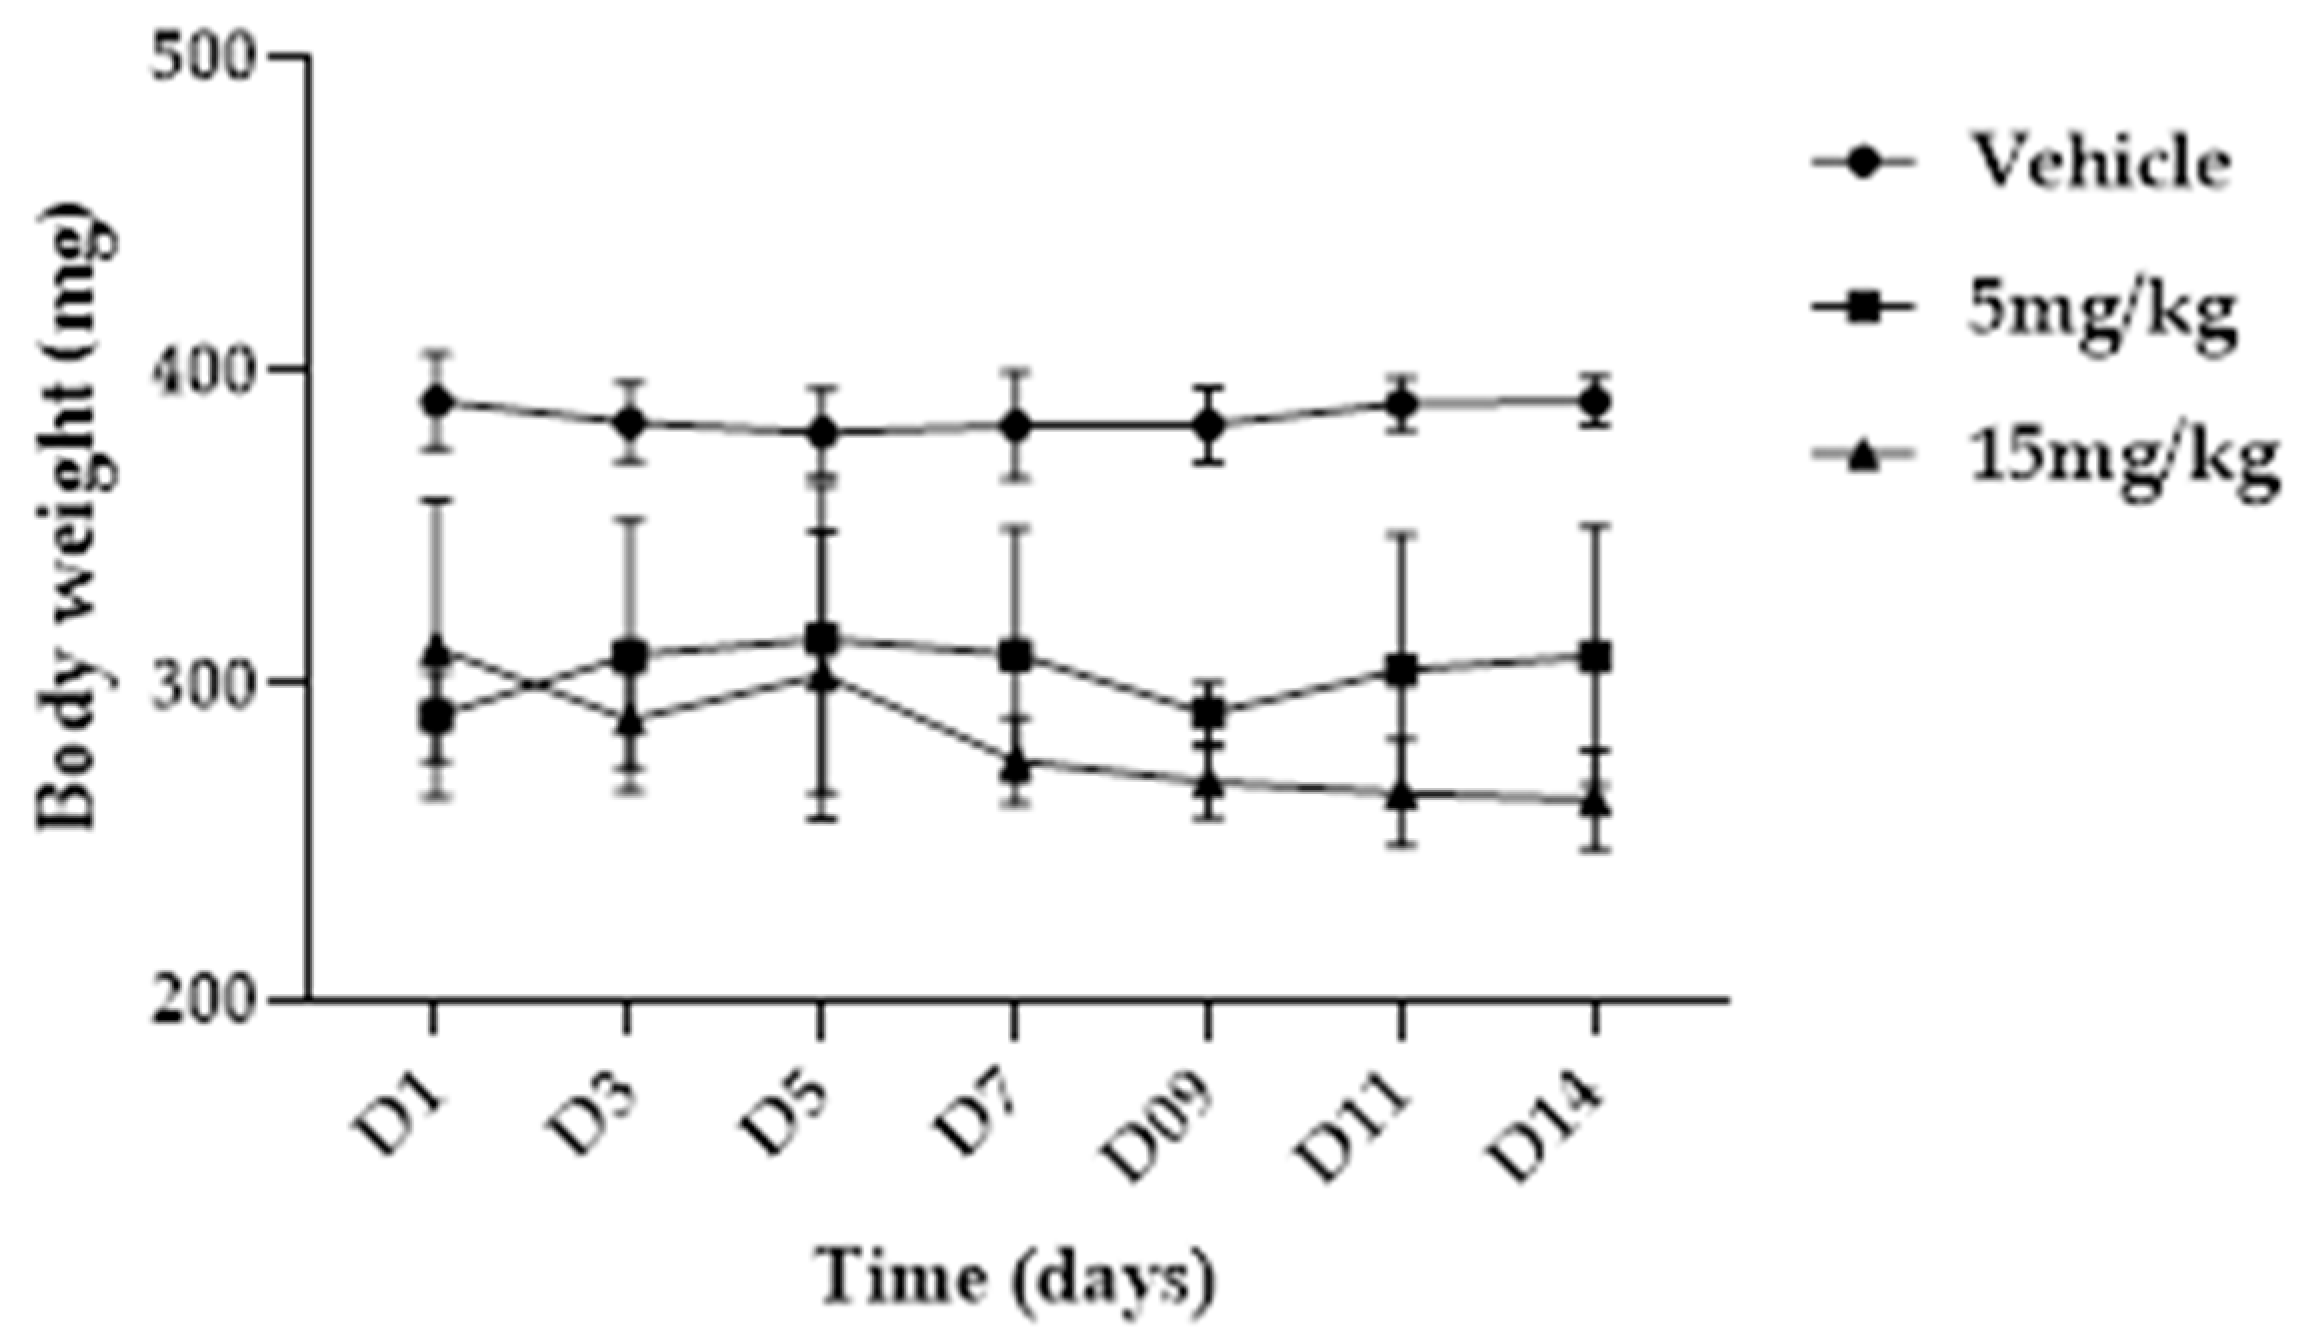
Effect of subacute intramuscular treatment with NBCP (5 and 15 mg/kg) on body weight of male Wistar rats over 14 days (n = 5). Data are presented as mean ± SD. Differences between groups were analyzed by one-way analysis of variance (ANOVA) followed by Tukey’s post hoc test. p < 0.05 versus control group.
Figure 8.
Effect of subacute intramuscular treatment with NBCP (5 and 15 mg/kg) on body weight of male Wistar rats over 14 days (n = 5). Data are presented as mean ± SD. Differences between groups were analyzed by one-way analysis of variance (ANOVA) followed by Tukey’s post hoc test. p < 0.05 versus control group.
Figure 9.
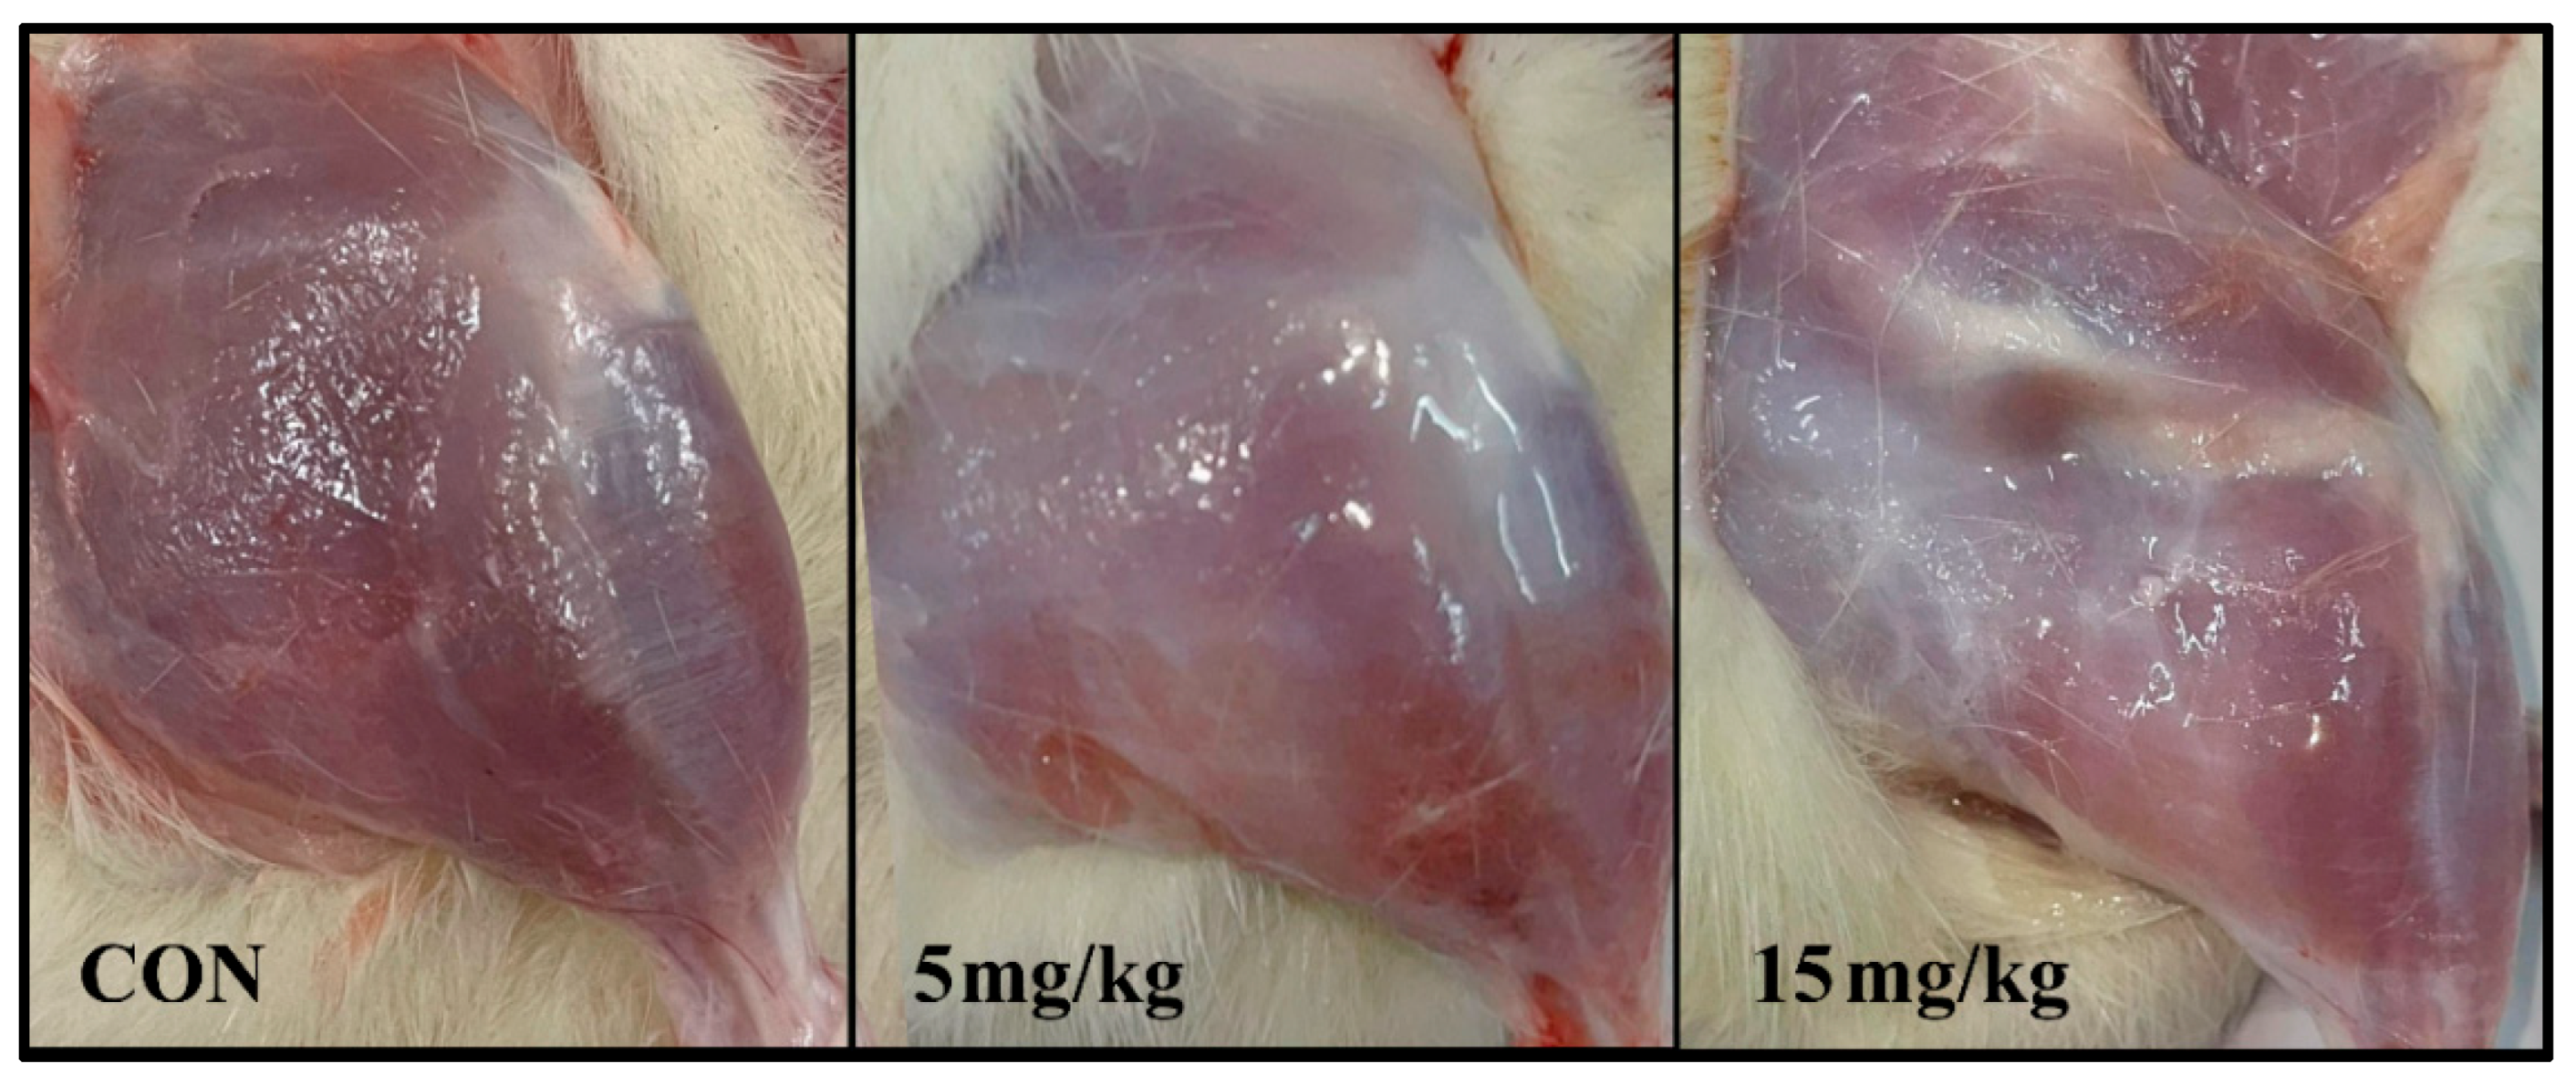
Macroscopic appearance of the injected muscle after intramuscular administration of vehicle (CON—control group) and NBCP at doses of 5 and 15 mg/kg.
Figure 9.
Macroscopic appearance of the injected muscle after intramuscular administration of vehicle (CON—control group) and NBCP at doses of 5 and 15 mg/kg.
Figure 10.
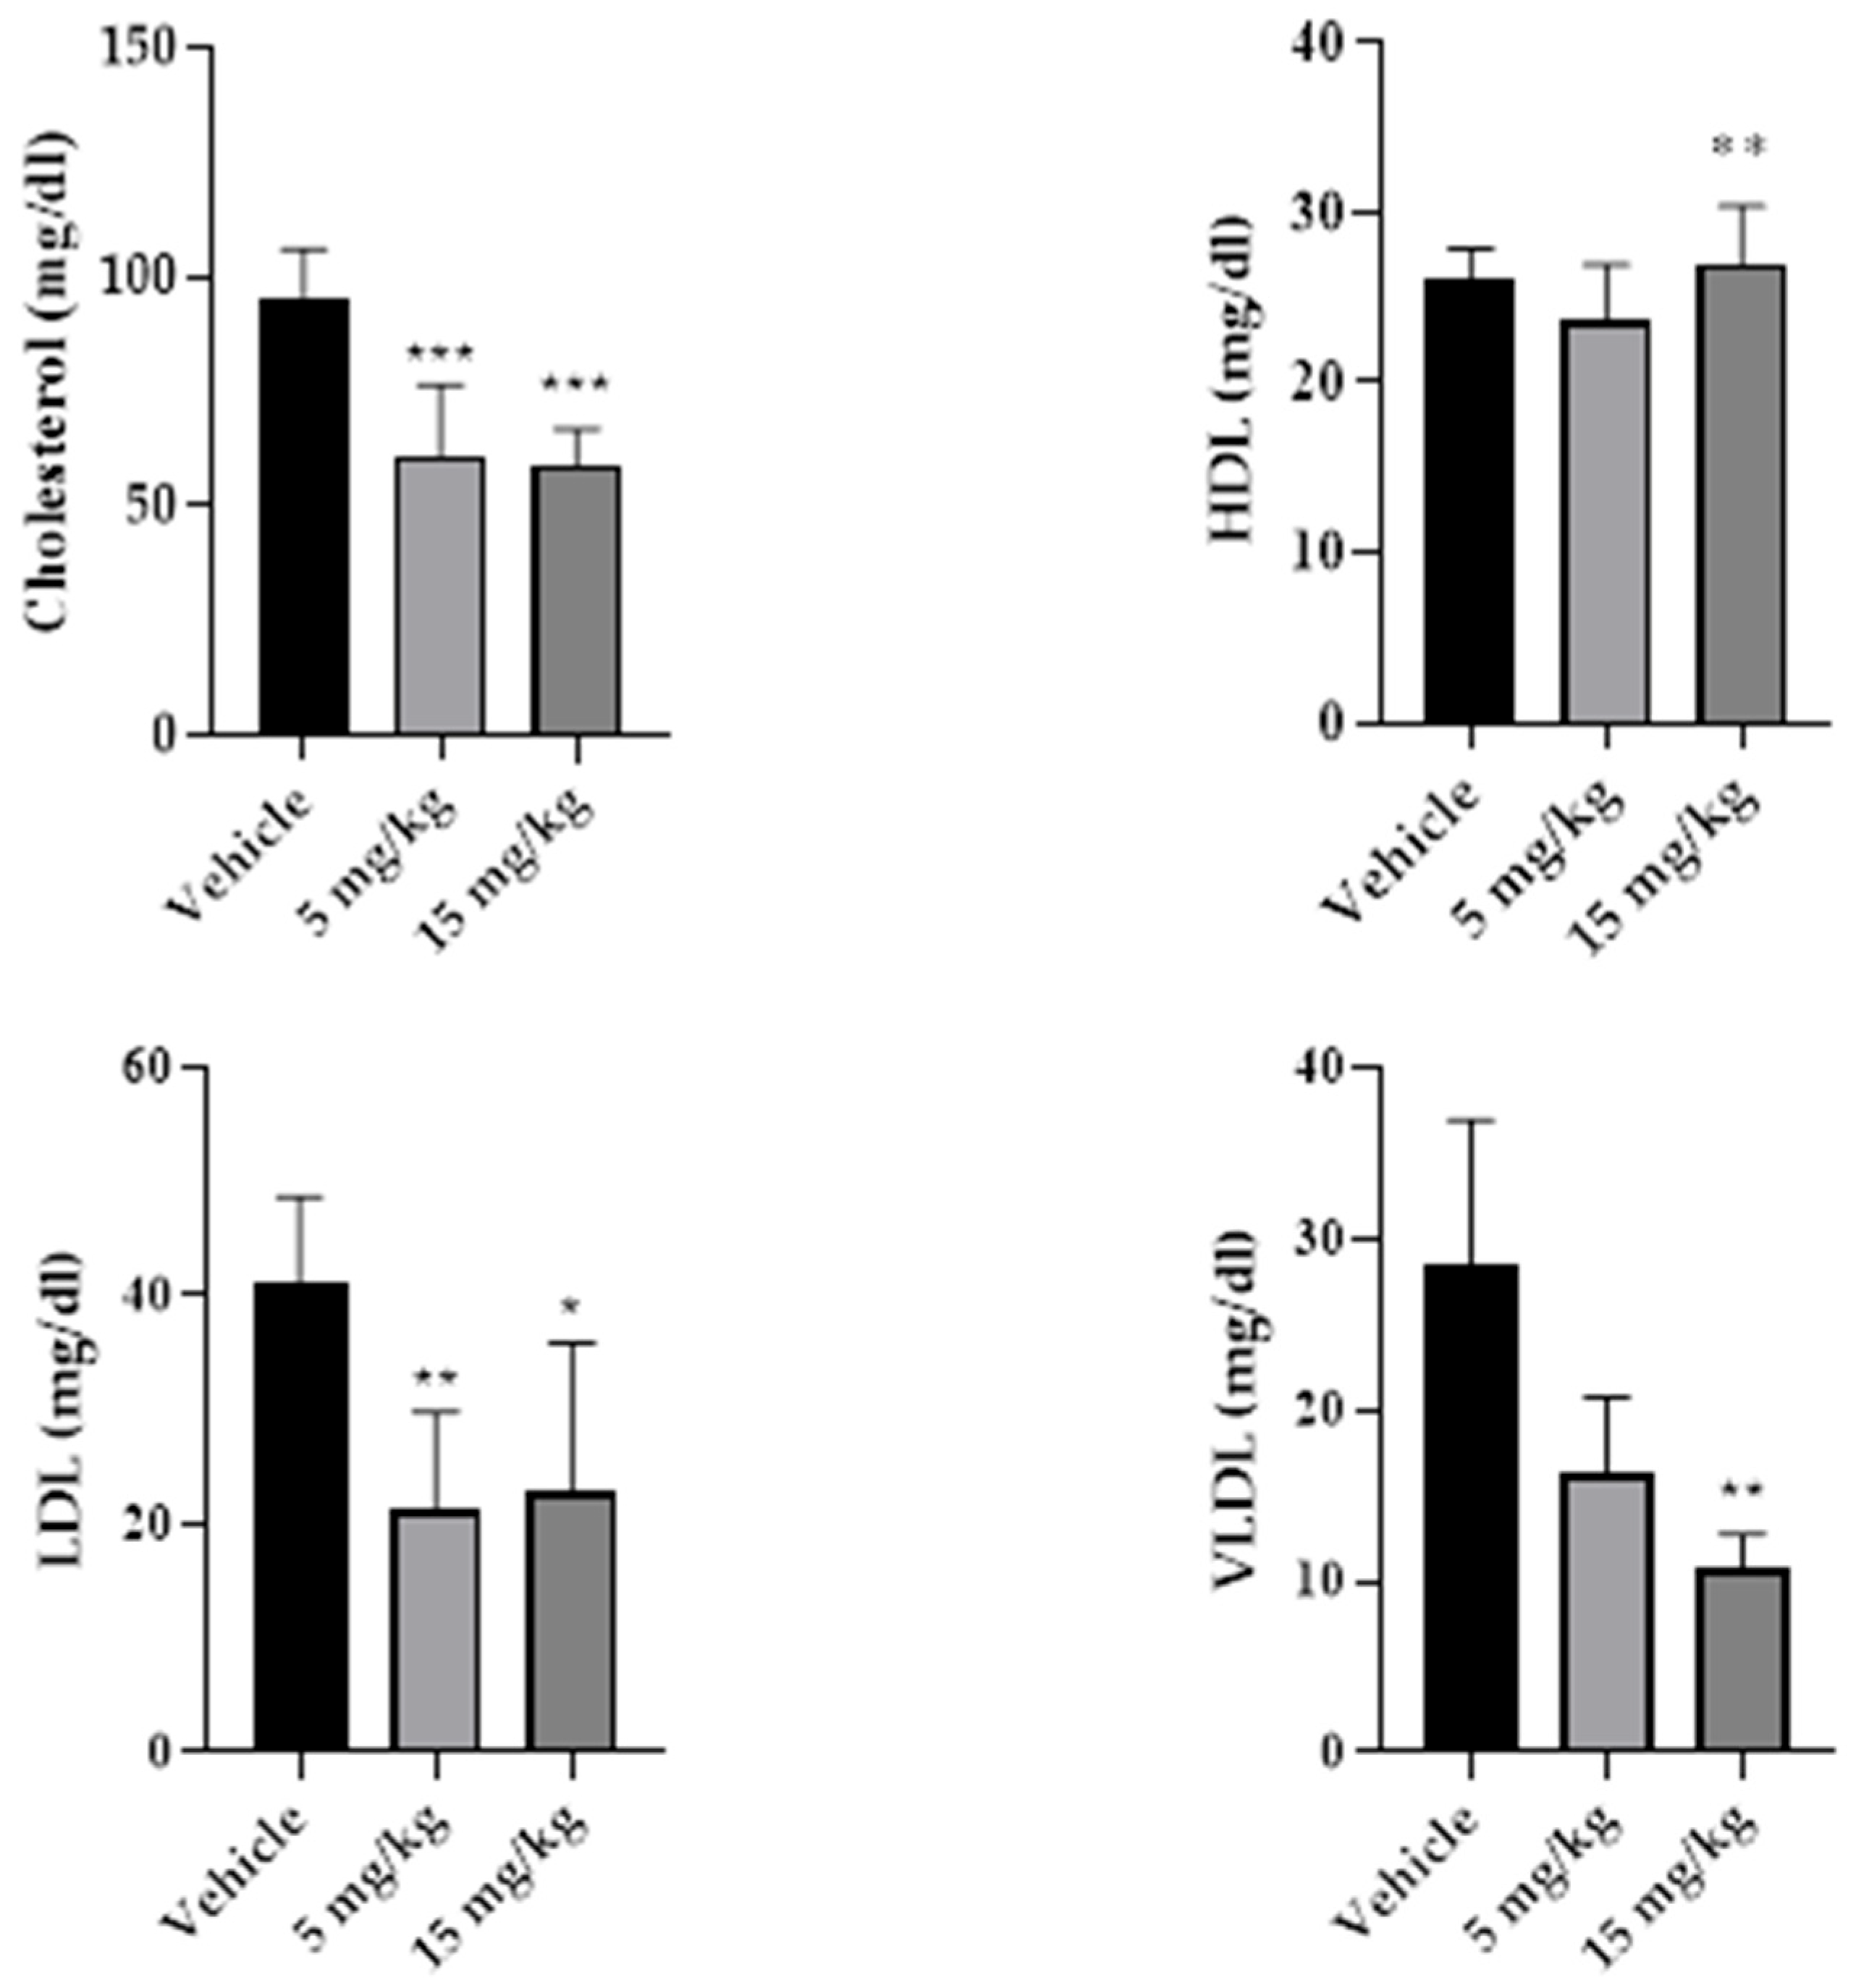
Serum lipid profile parameters were measured after subacute intramuscular treatment with β-caryophyllene nanoemulsion (NBCP) at doses of 5 and 15 mg/kg over a 14-day treatment period. Total cholesterol, HDL cholesterol, LDL cholesterol, and VLDL cholesterol levels in male Wistar rats treated with vehicle, NBCP 5 mg/kg, or NBCP 15 mg/kg for 14 days. Data are presented as mean ± SD (n = 5). Statistical differences were assessed by one-way analysis of variance (ANOVA) followed by Tukey’s post hoc test. * p < 0.05, ** p < 0.01, *** p < 0.001 versus vehicle group.
Figure 10.
Serum lipid profile parameters were measured after subacute intramuscular treatment with β-caryophyllene nanoemulsion (NBCP) at doses of 5 and 15 mg/kg over a 14-day treatment period. Total cholesterol, HDL cholesterol, LDL cholesterol, and VLDL cholesterol levels in male Wistar rats treated with vehicle, NBCP 5 mg/kg, or NBCP 15 mg/kg for 14 days. Data are presented as mean ± SD (n = 5). Statistical differences were assessed by one-way analysis of variance (ANOVA) followed by Tukey’s post hoc test. * p < 0.05, ** p < 0.01, *** p < 0.001 versus vehicle group.
Figure 11.
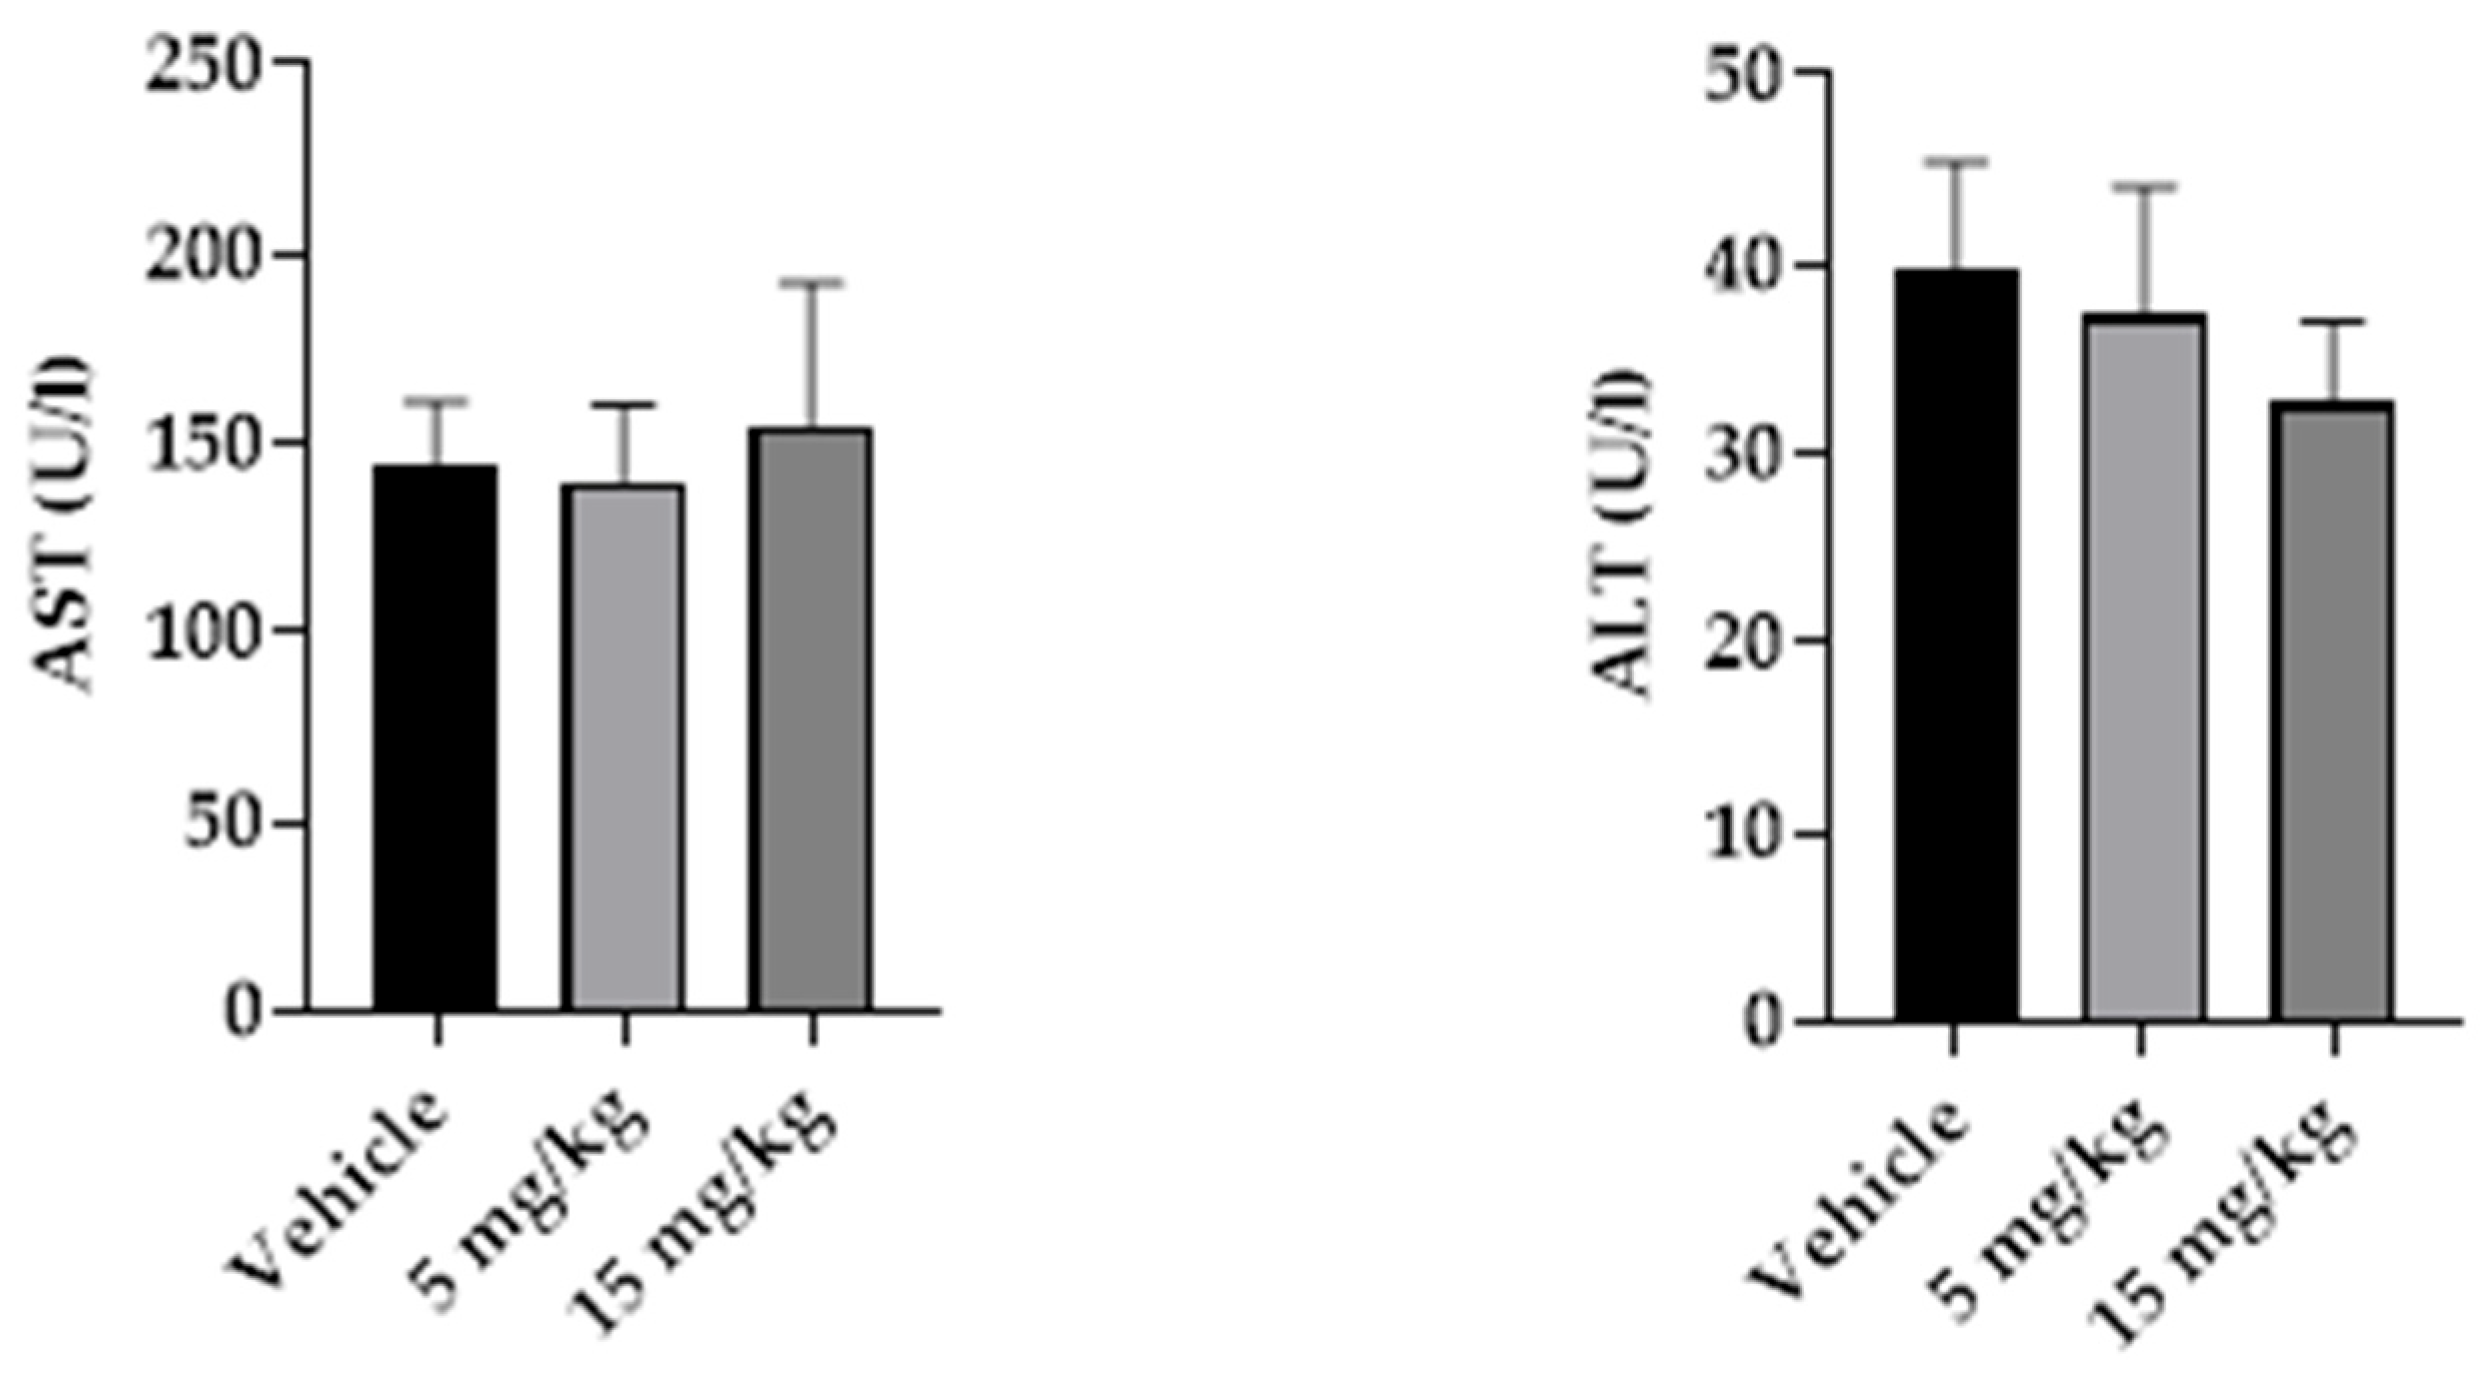
Serum aminotransferase levels after subchronic intramuscular treatment with β-caryophyllene nanoemulsion (NBCP). Alanine aminotransferase (ALT) and aspartate aminotransferase (AST) levels in male Wistar rats treated with vehicle, NBCP 5 mg/kg, or NBCP 15 mg/kg for 14 days. Data are presented as mean ± SD (n = 5). Statistical analysis was performed by one-way analysis of variance (ANOVA).
Figure 11.
Serum aminotransferase levels after subchronic intramuscular treatment with β-caryophyllene nanoemulsion (NBCP). Alanine aminotransferase (ALT) and aspartate aminotransferase (AST) levels in male Wistar rats treated with vehicle, NBCP 5 mg/kg, or NBCP 15 mg/kg for 14 days. Data are presented as mean ± SD (n = 5). Statistical analysis was performed by one-way analysis of variance (ANOVA).
Figure 12.
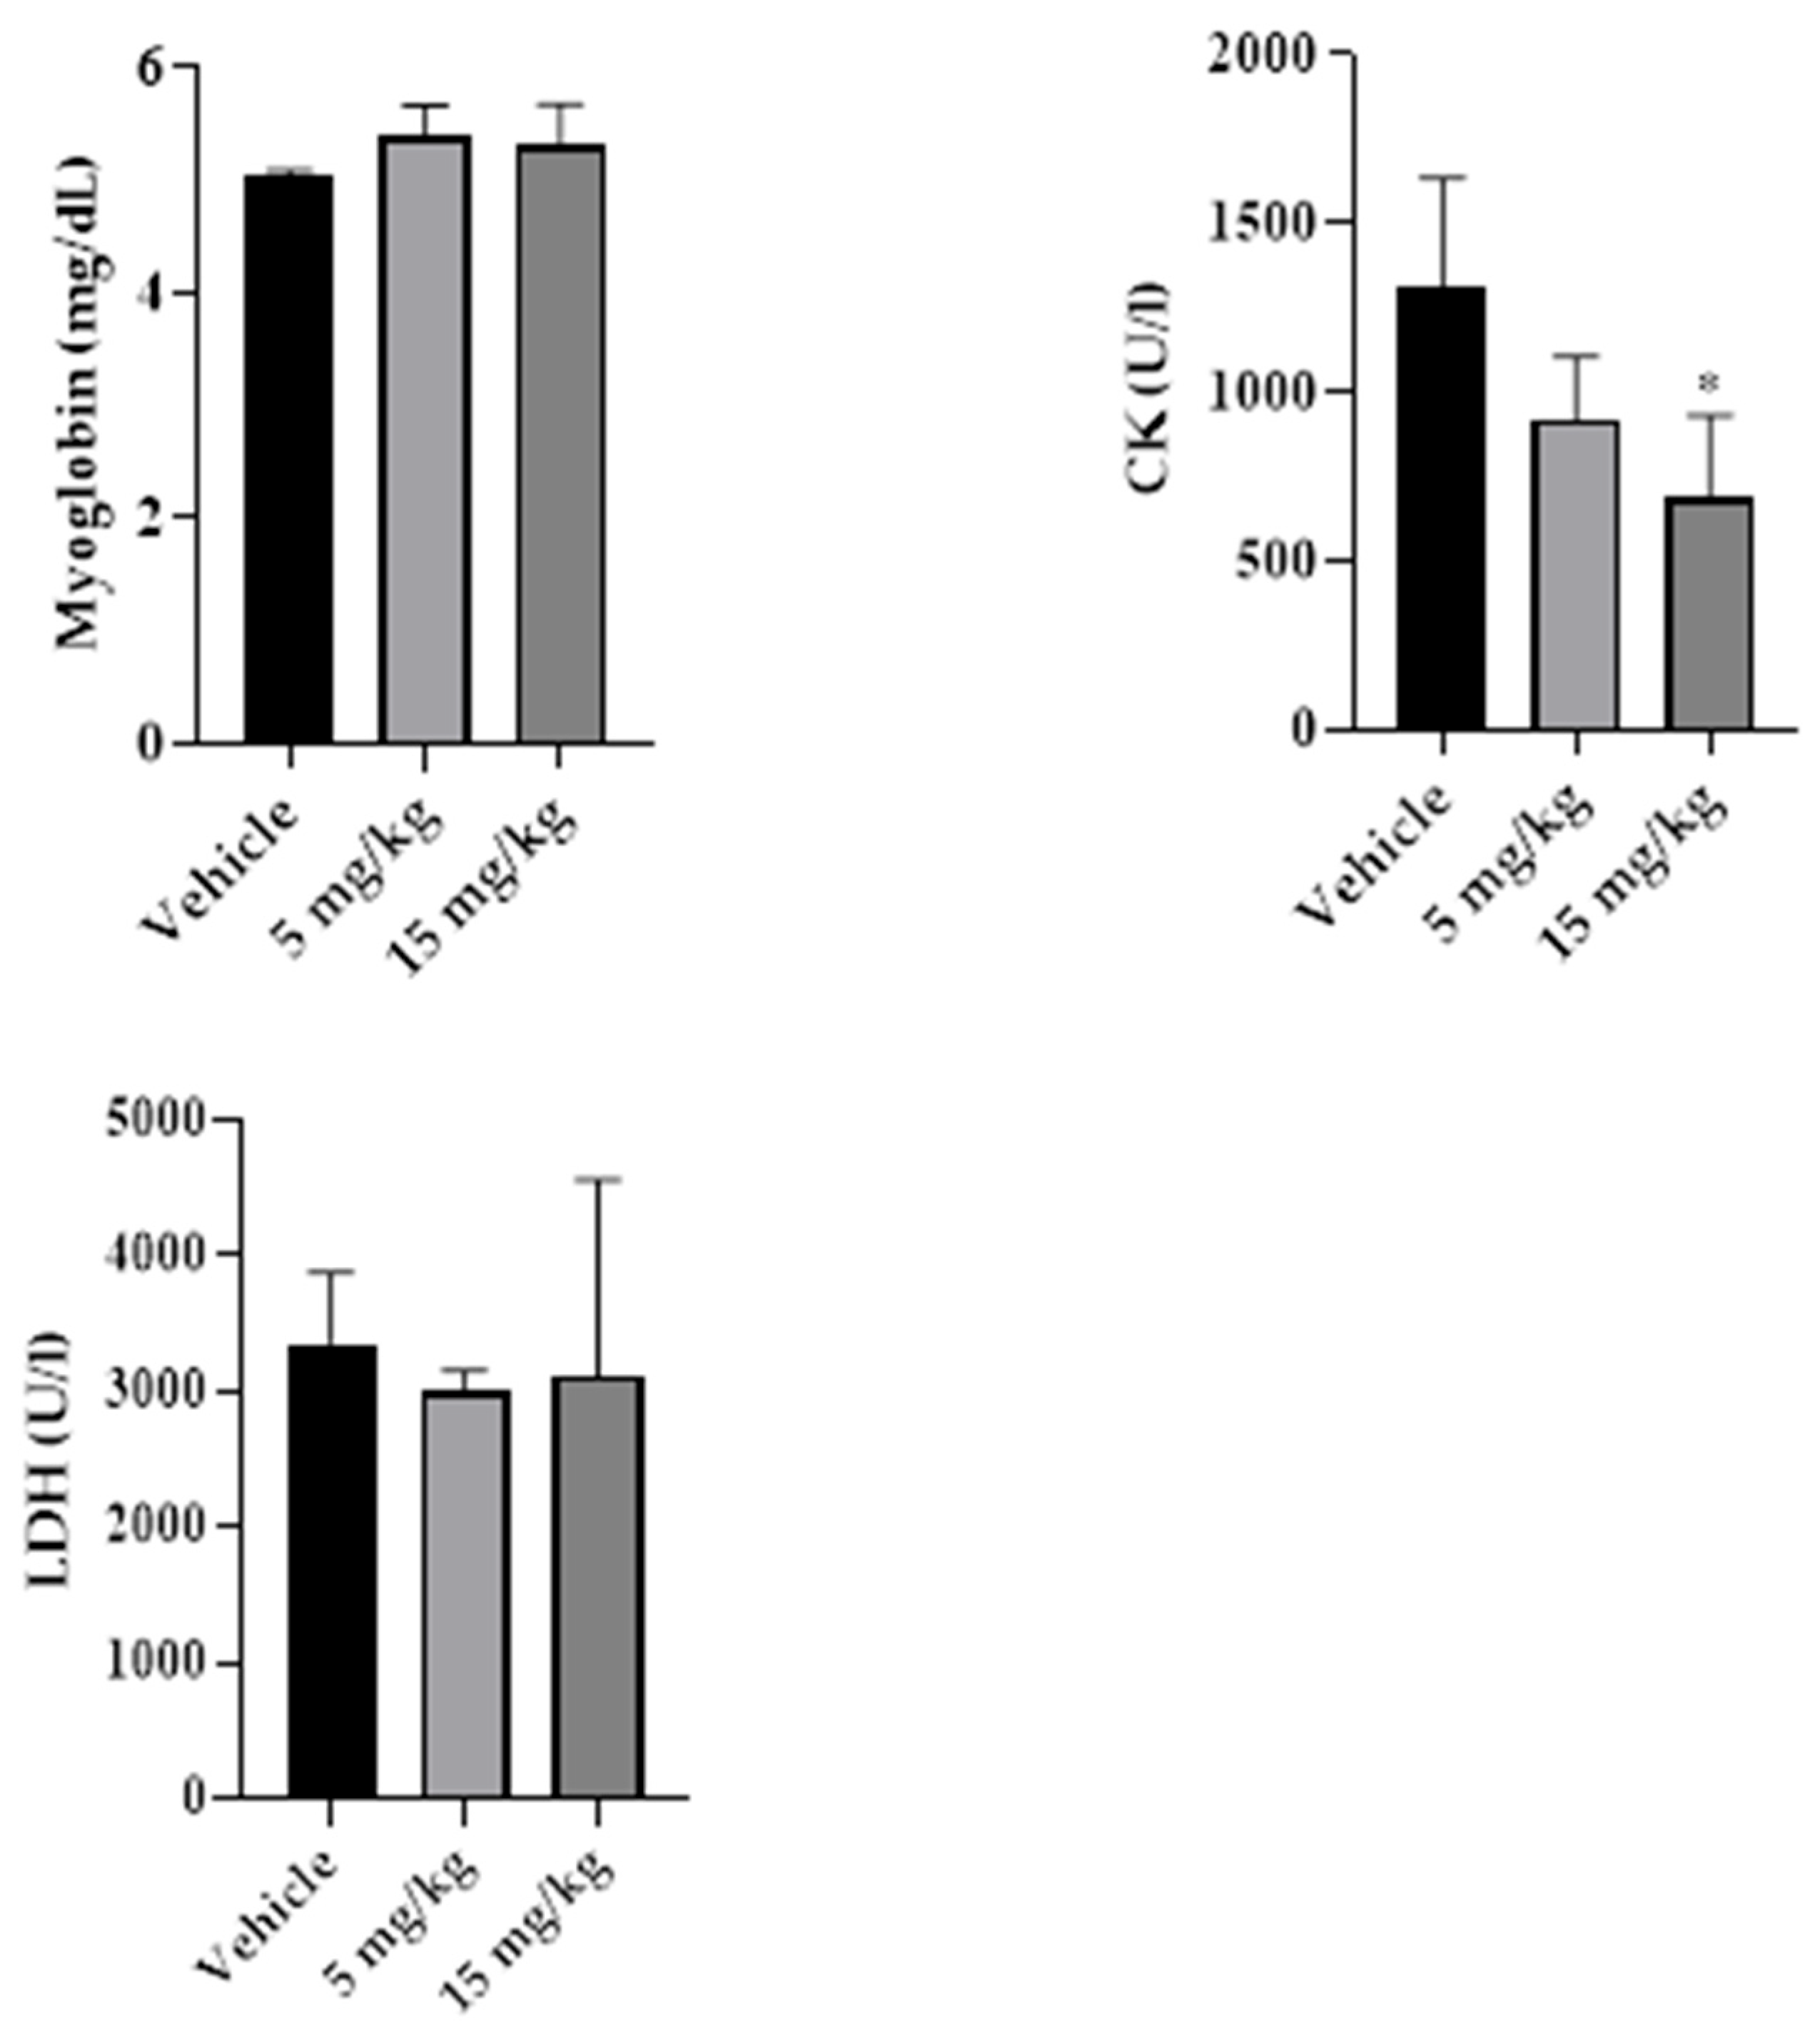
Serum muscle injury markers after subchronic intramuscular treatment with β-caryophyllene nanoemulsion (NBCP). Myoglobin, creatine kinase (CK), and lactate dehydrogenase (LDH) levels in male Wistar rats treated with vehicle, NBCP 5 mg/kg, or NBCP 15 mg/kg for 14 days. Data are presented as mean ± SD (n = 5). Statistical differences were assessed by one-way analysis of variance (ANOVA) followed by Tukey’s post hoc test. * p < 0.05 versus vehicle group.
Figure 12.
Serum muscle injury markers after subchronic intramuscular treatment with β-caryophyllene nanoemulsion (NBCP). Myoglobin, creatine kinase (CK), and lactate dehydrogenase (LDH) levels in male Wistar rats treated with vehicle, NBCP 5 mg/kg, or NBCP 15 mg/kg for 14 days. Data are presented as mean ± SD (n = 5). Statistical differences were assessed by one-way analysis of variance (ANOVA) followed by Tukey’s post hoc test. * p < 0.05 versus vehicle group.
Figure 13.
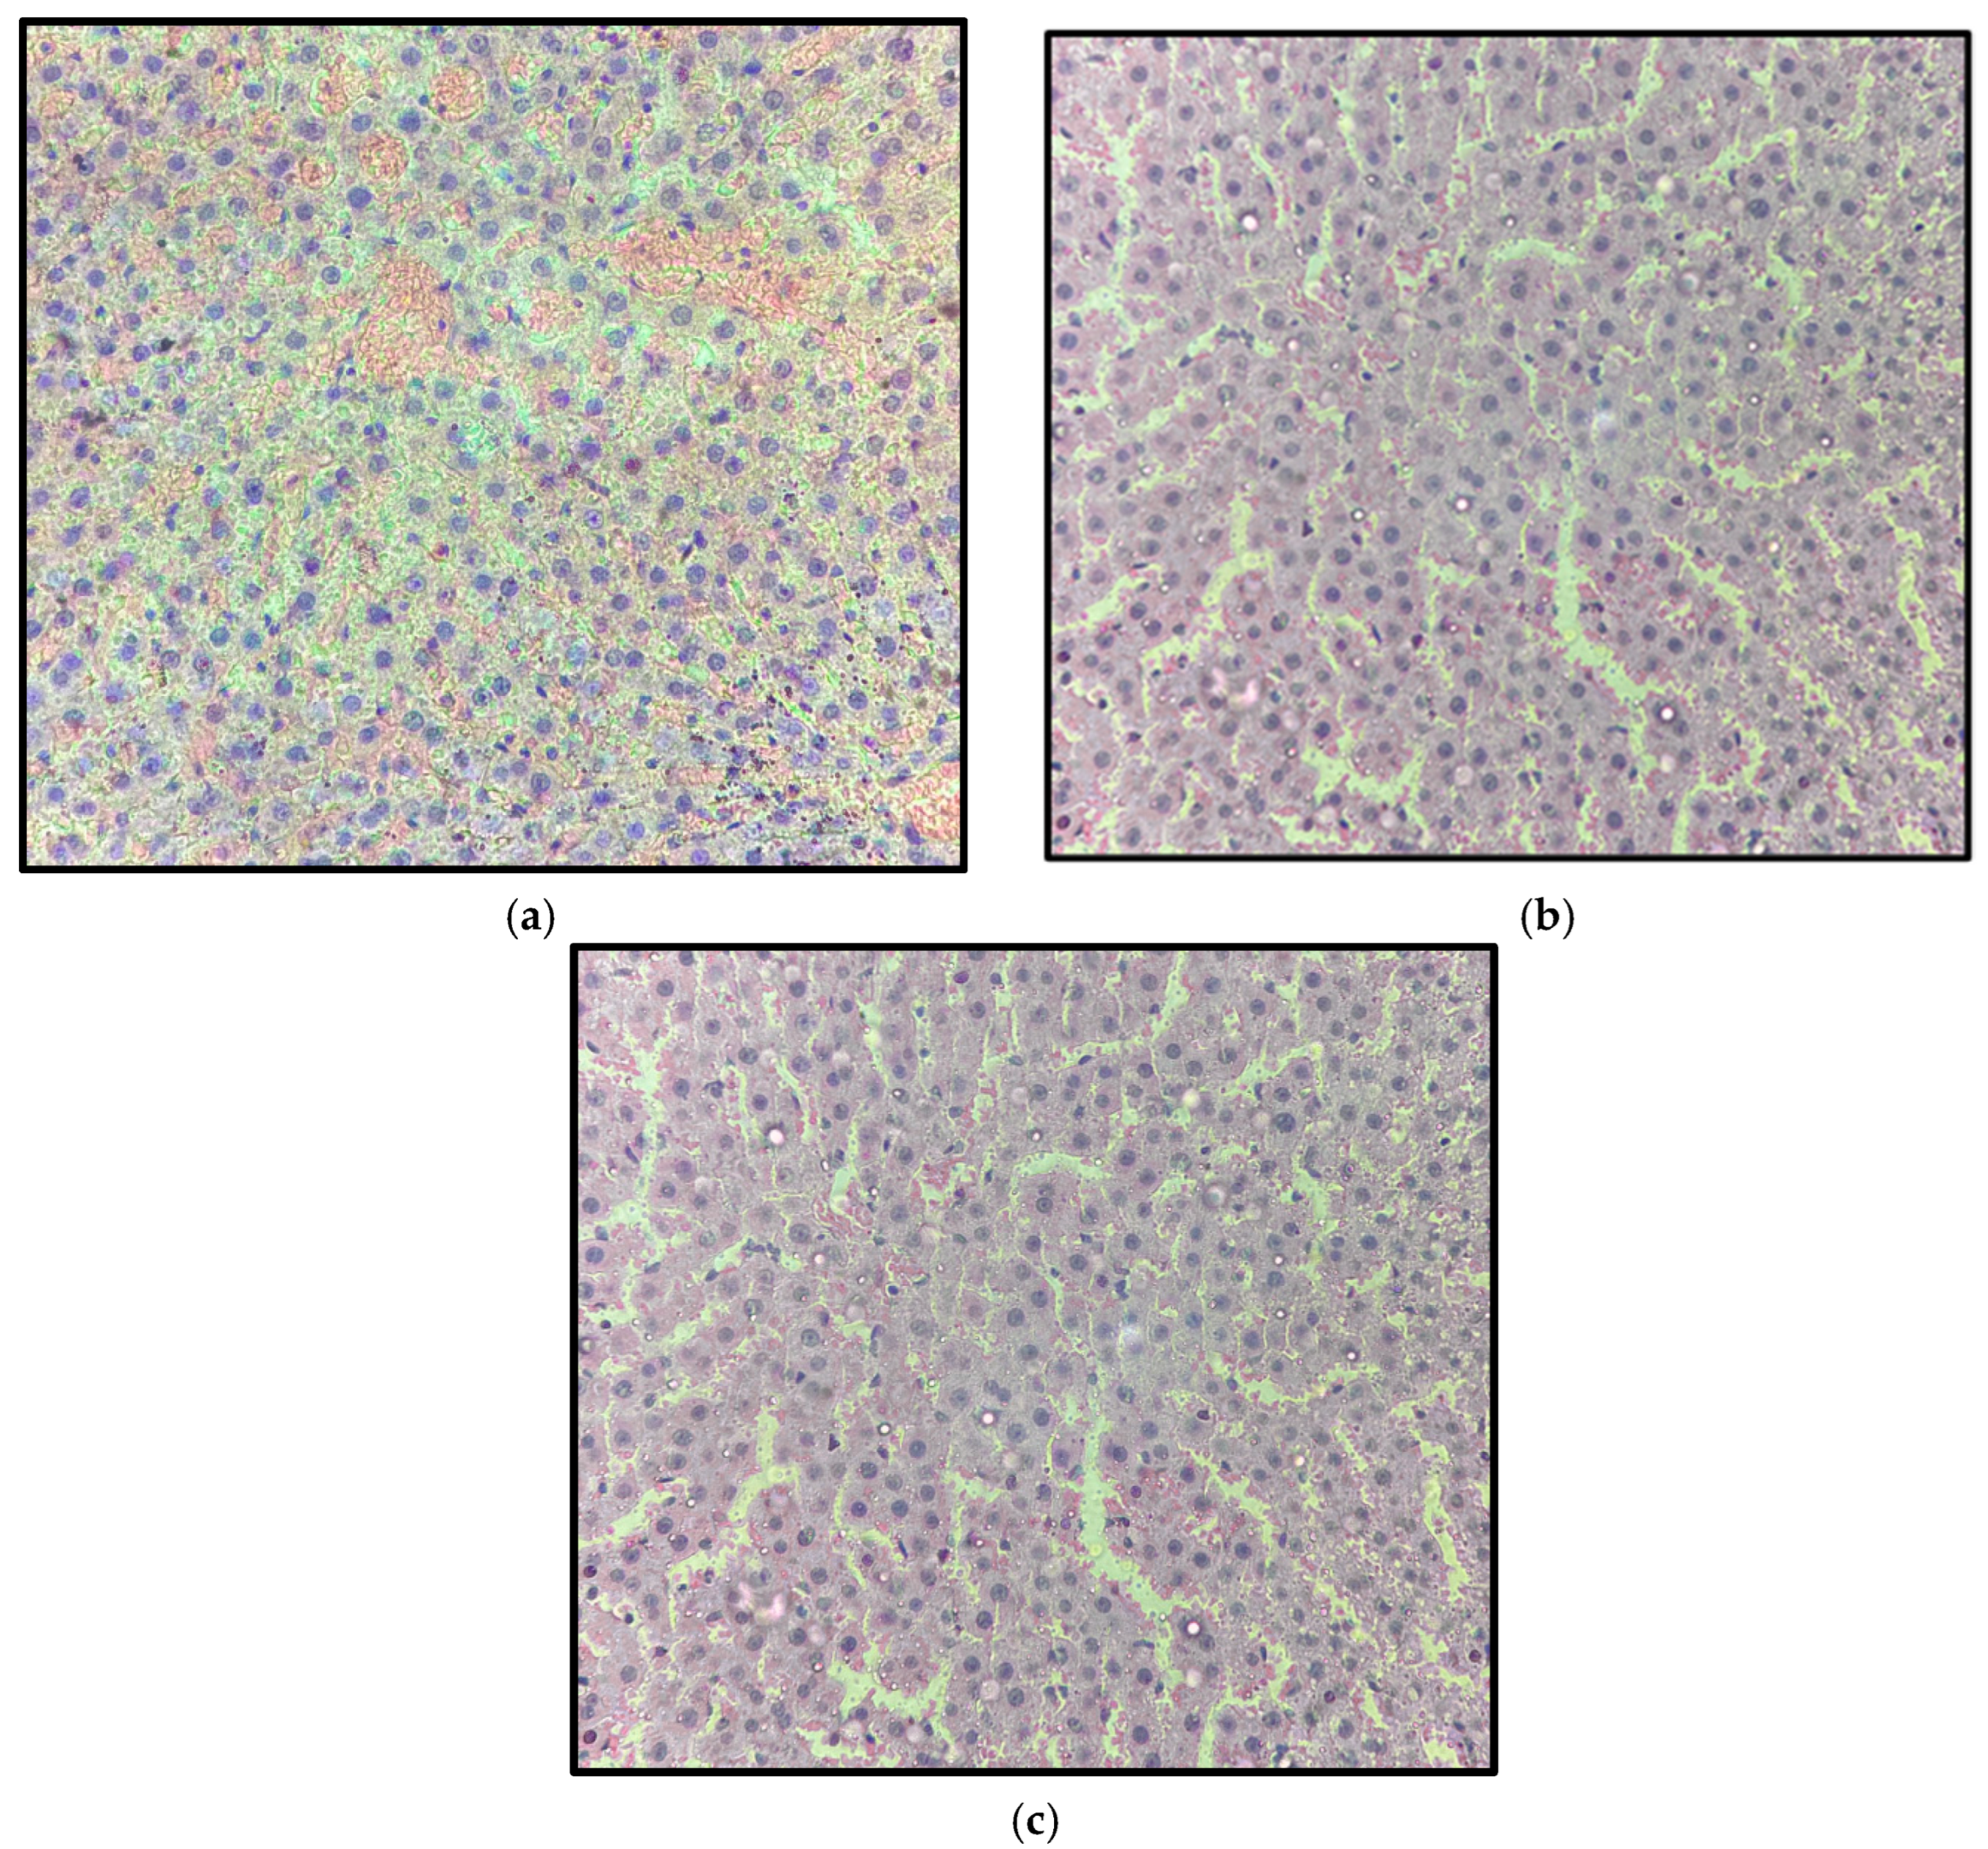
Representative liver sections from control (a), 5 mg/kg (b), and 15 mg/kg (c) groups after 14 days of treatment with β-caryophyllene nanoemulsion (NBCP). Preserved hepatic architecture is observed in all groups, with organized hepatocyte cords, centrally located nuclei, and well-defined sinusoids, without evidence of necrosis, inflammatory infiltrates, or marked degenerative changes (hematoxylin and eosin, H&E; objective 40×; total magnification 400×).
Figure 13.
Representative liver sections from control (a), 5 mg/kg (b), and 15 mg/kg (c) groups after 14 days of treatment with β-caryophyllene nanoemulsion (NBCP). Preserved hepatic architecture is observed in all groups, with organized hepatocyte cords, centrally located nuclei, and well-defined sinusoids, without evidence of necrosis, inflammatory infiltrates, or marked degenerative changes (hematoxylin and eosin, H&E; objective 40×; total magnification 400×).
Figure 14.
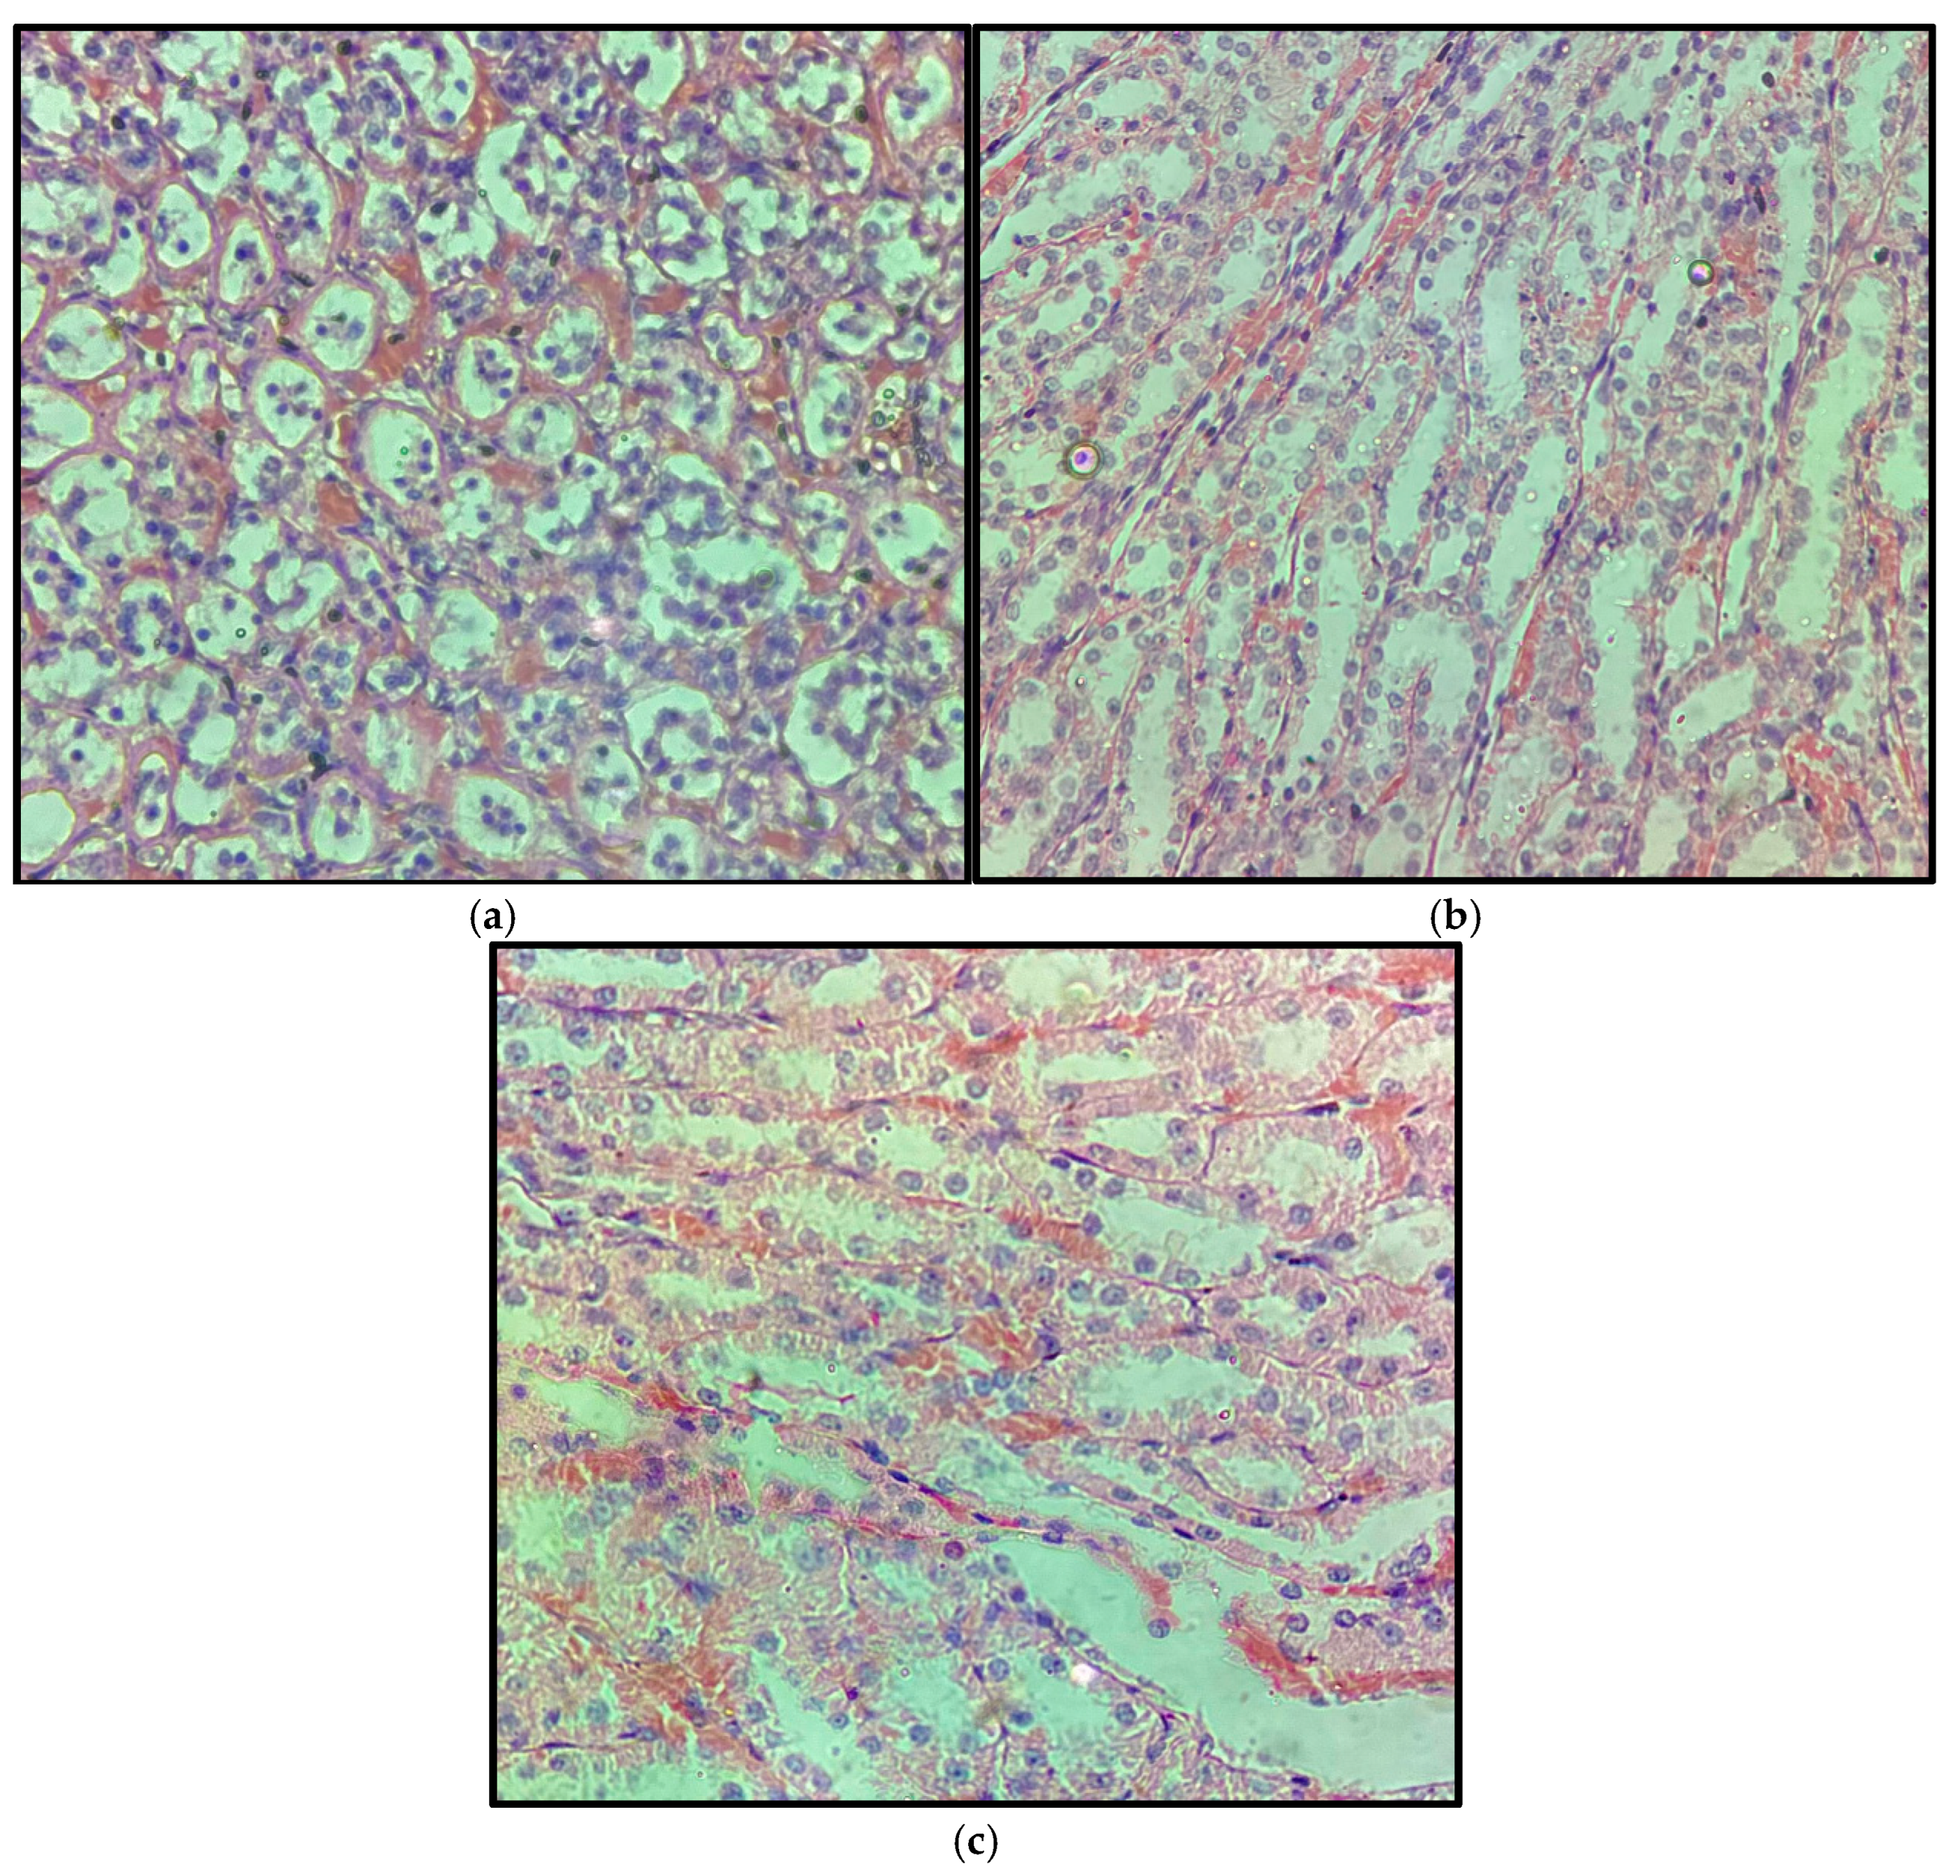
Representative kidney sections from control (a), 5 mg/kg (b), and 15 mg/kg (c) Wistar rats after 14 days of treatment with β-caryophyllene nanoemulsion (NBCP). Preserved renal architecture is observed in all groups, with intact renal tubules and glomeruli, without evidence of tubular necrosis, epithelial degeneration, inflammatory infiltrates, or significant glomerular alterations (hematoxylin and eosin, H&E; objective 40×; total magnification 400×).
Figure 14.
Representative kidney sections from control (a), 5 mg/kg (b), and 15 mg/kg (c) Wistar rats after 14 days of treatment with β-caryophyllene nanoemulsion (NBCP). Preserved renal architecture is observed in all groups, with intact renal tubules and glomeruli, without evidence of tubular necrosis, epithelial degeneration, inflammatory infiltrates, or significant glomerular alterations (hematoxylin and eosin, H&E; objective 40×; total magnification 400×).
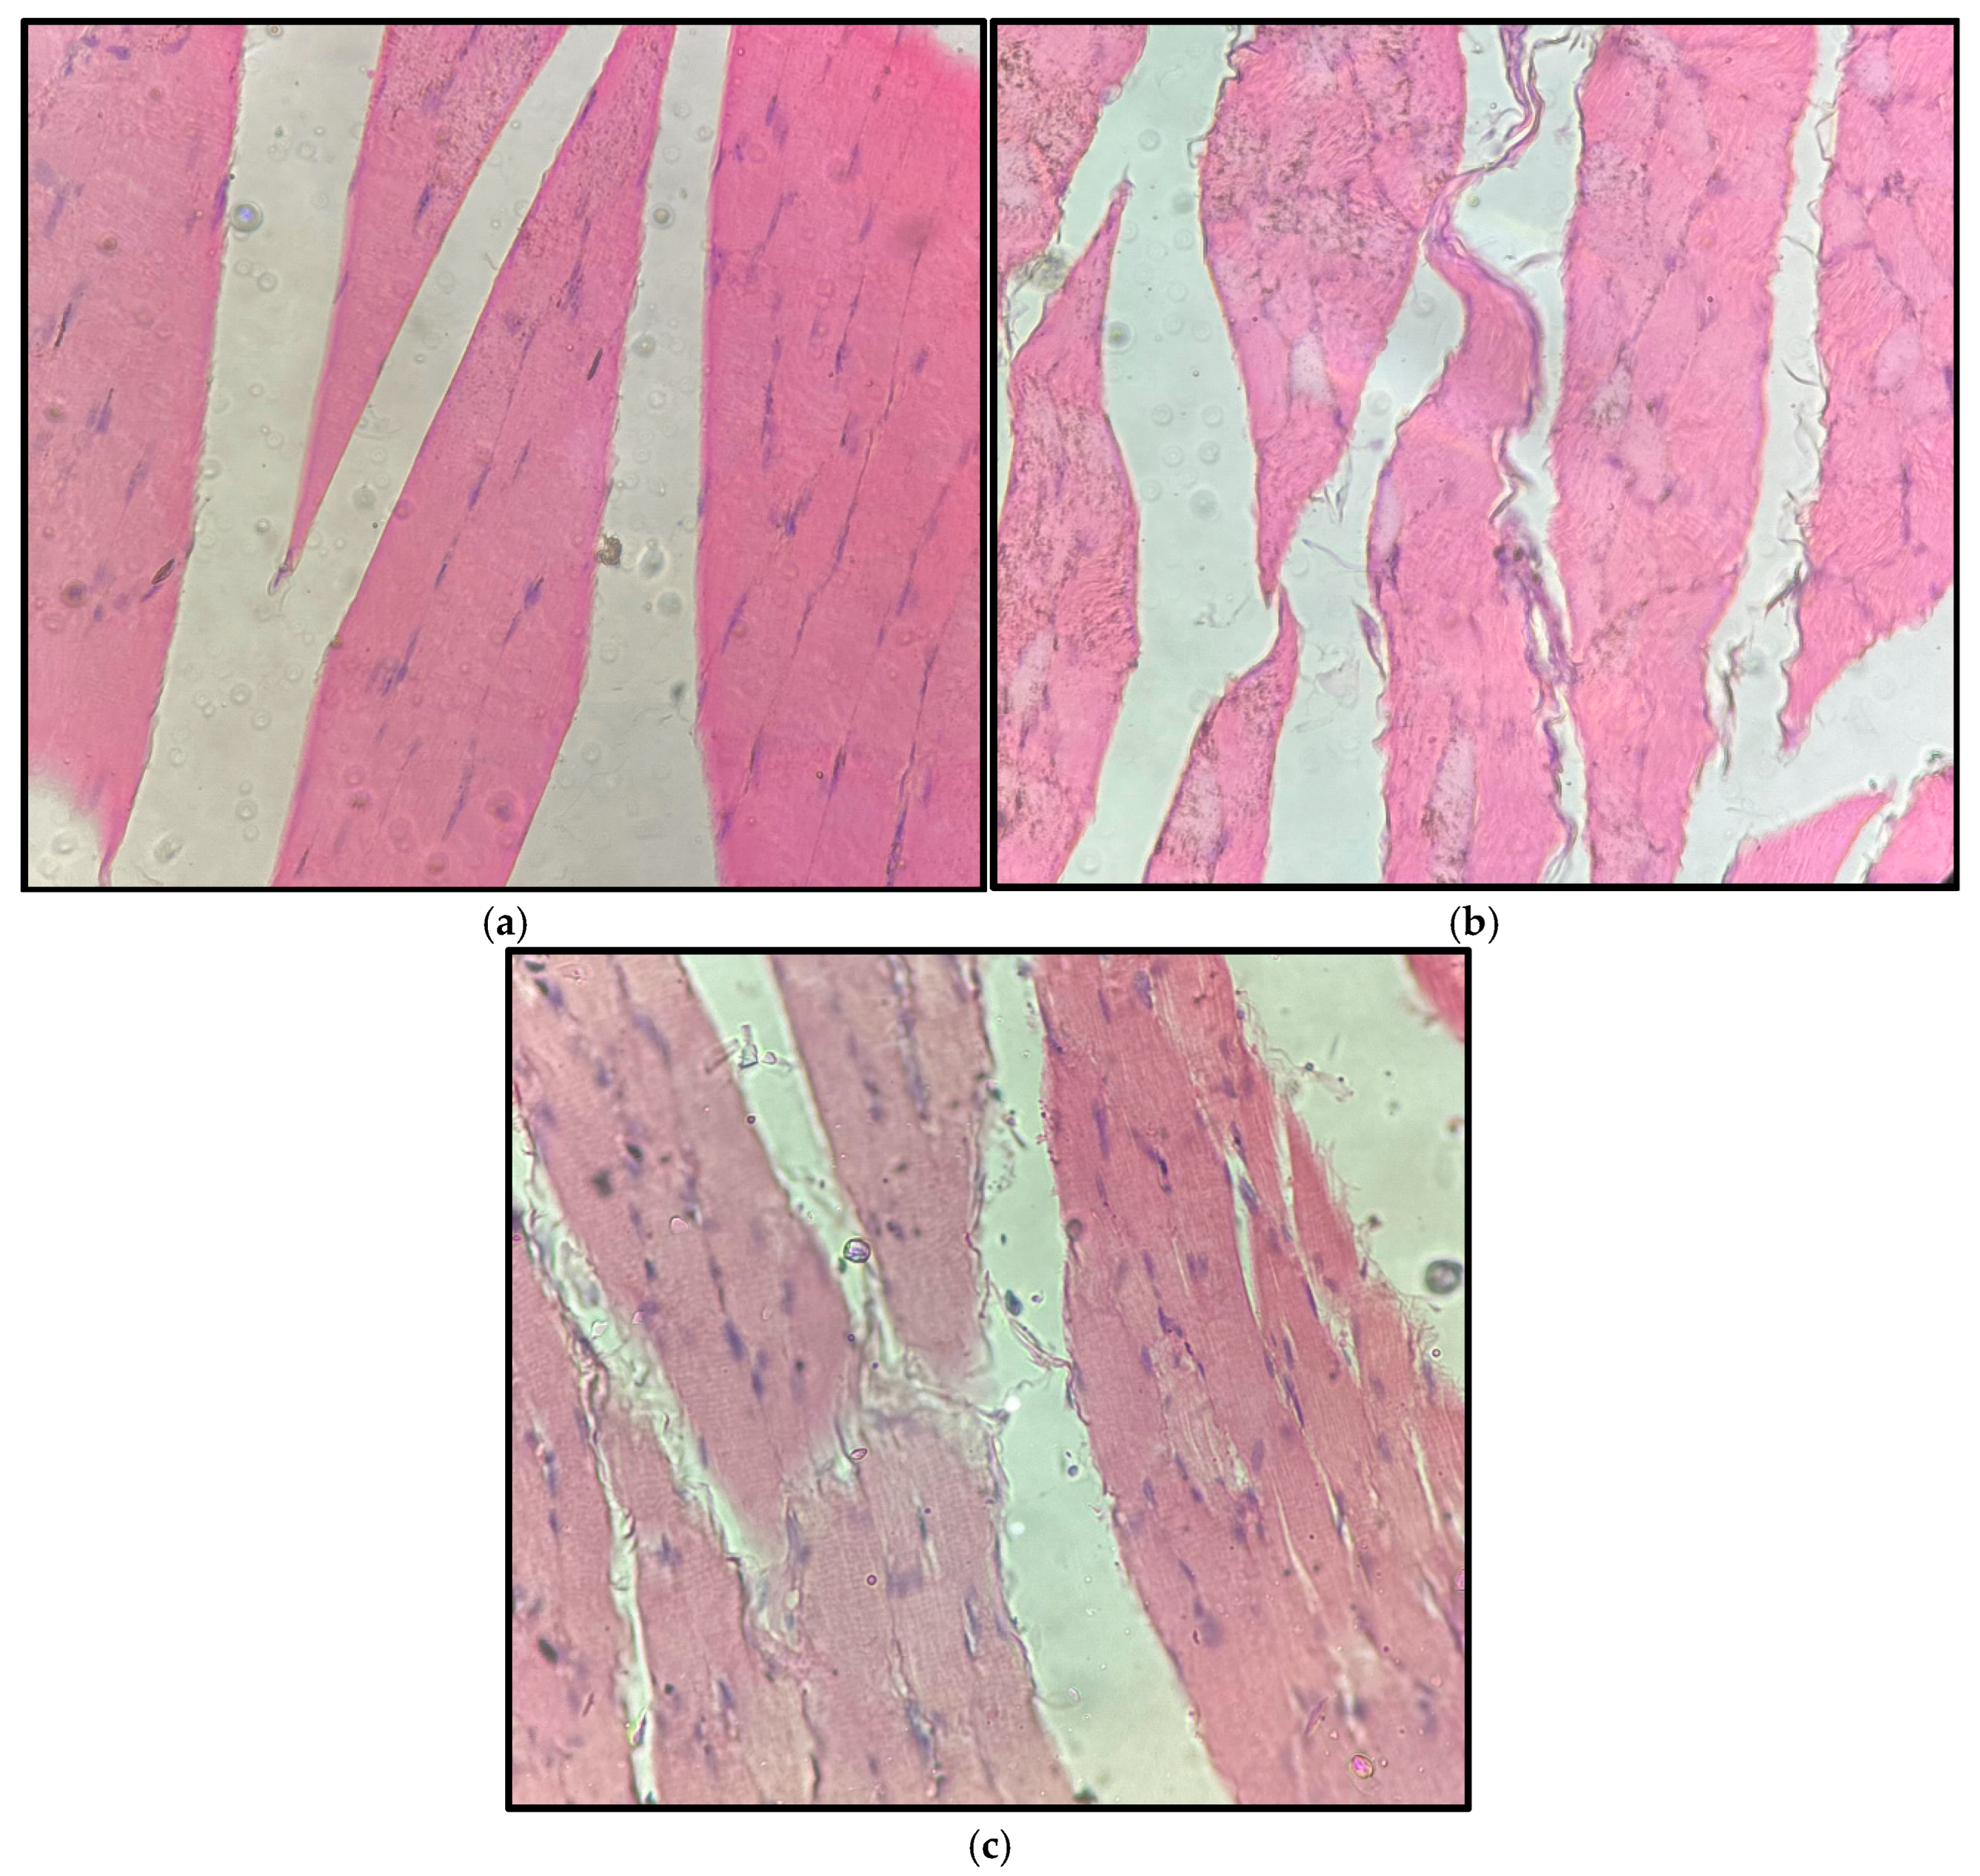
Figure 15.
Representative skeletal muscle sections from control (a), (b), 5 mg/kg, and (c) 15 mg/kg groups after 14 days of treatment with β-caryophyllene nanoemulsion (NBCP). Striated muscle fibers with intact sarcolemma, preserved peripheral nuclei, and uniform fascicular arrangement are observed in all groups. No evidence of myofiber degeneration, necrosis, inflammatory infiltrates, or significant interstitial edema was identified (hematoxylin and eosin, H&E; objective 40×; total magnification 400×).
Figure 15.
Representative skeletal muscle sections from control (a), (b), 5 mg/kg, and (c) 15 mg/kg groups after 14 days of treatment with β-caryophyllene nanoemulsion (NBCP). Striated muscle fibers with intact sarcolemma, preserved peripheral nuclei, and uniform fascicular arrangement are observed in all groups. No evidence of myofiber degeneration, necrosis, inflammatory infiltrates, or significant interstitial edema was identified (hematoxylin and eosin, H&E; objective 40×; total magnification 400×).
Table 1.
Composition of β-caryophyllene nanoemulsion formulations.
Table 1.
Composition of β-caryophyllene nanoemulsion formulations.
| Nanoemulsion | HLB | Sorbitan
Monooleate (g) | Polysorbate 80 (g) | β-Caryophyllene (g) | Water
(g) |
|---|
| NBCP1 | 5 | 0.013 | 0.186 | 0.2 | 19.6 |
| NBCP2 | 6 | 0.031 | 0.168 | 0.2 | 19.6 |
| NBCP3 | 7 | 0.050 | 0.149 | 0.2 | 19.6 |
| NBCP4 | 8 | 0.069 | 0.130 | 0.2 | 19.6 |
| NBCP5 | 9 | 0.182 | 0.170 | 0.2 | 19.6 |
Table 2.
Effect of nanoemulsion composition (NBCPs) on particle diameter (nm), polydispersity index (PDI), and zeta potential.
Table 2.
Effect of nanoemulsion composition (NBCPs) on particle diameter (nm), polydispersity index (PDI), and zeta potential.
| | | Day 1 | Day 28 |
|---|
| Nanoemulsion | HLB | Diameter (nm) | PDI | Zeta Potential | Diameter (nm) | PDI | Zeta Potential |
|---|
| NBCP1 | 5 | 83.26 ± 0.12 | 0.22 ± 0.00 | −15.9 ± 0.7 | 102.39 ± 5.71 * | 0.55 ± 0.13 * | −27.5 ± 0.6 * |
| NBCP2 | 6 | 176.23 ± 2.68 | 0.42 ± 0.08 | −11.0 ± 0.4 | 156.16 ± 2.12 | 0.41 ± 0.01 | −25.1 ± 0.5 * |
| NBCP3 | 7 | 192.30 ± 1.73 | 0.38 ± 0.00 | −16.50 ± 1.37 | 219.6 ± 5.66 * | 0.59 ± 0.02 * | −22.80 ± 1.3 * |
| NBCP4 | 8 | 167.9 ± 2.50 | 0.37 ± 0.01 | −14.03 ± 0.38 | 151.6 ± 1.31 | 0.37 ± 0.01 | −16.17 ± 0.65 * |
| NBCP5 | 9 | 173.5 ± 1.92 | 0.44 ± 0.01 | −11.03 ± 0.42 | 205.73 ± 6.84 * | 0.46 ± 0.01 | −13.10 ± 0.36 * |
Table 3.
Effect of nanoemulsion composition (NBCPs) on particle diameter (nm) and formulation stability.
Table 3.
Effect of nanoemulsion composition (NBCPs) on particle diameter (nm) and formulation stability.
| Nanoemulsion | Day 0 | Day 1 | Day 3 | Day 7 | Day 14 | Day 21 | Day 28 |
|---|
| NBCP1 | 83.26 ± 0.12 | 61.70 ± 0.65 * | 75.76 ± 0.37 * | 81.96 ± 0.37 * | 94.67 ± 0.80 | 96.93 ± 4.21 | 102.39 ± 5.71 |
| NBCP2 | 176.23 ± 2.67 | 141.93 ± 1.59 * | 147.67 ± 6.29 | 145.13 ± 1.81 | 143.07 ± 2.25 | 146.30 ± 5.73 | 156.17 ± 2.12 * |
| NBCP3 | 192.30 ± 1.73 | 144.93 ± 2.36 * | 149.93 ± 1.71 * | 144.83 ± 2.68 * | 146.97 ± 3.06 | 143.03 ± 3.57 | 219.60 ± 5.66 * |
| NBCP4 | 167.90 ± 2.51 | 151.23 ± 3.02 * | 163.57 ± 0.68 * | 151.60 ± 1.31 * | 152.10 ± 0.98 | 148.17 ± 2.06 | 151.60 ± 1.31 |
| NBCP5 | 173.50 ± 1.92 | 172.60 ± 3.92 * | 196.80 ± 10.77 | 179.33 ± 7.51 | 185.43 ± 2.25 | 173.87 ± 3.35 * | 205.73 ± 0.02 * |
Table 4.
Physicochemical properties of nanoformulations after centrifugation and thermal stress tests.
Table 4.
Physicochemical properties of nanoformulations after centrifugation and thermal stress tests.
| | NBCP1 | NBCP2 | NBCP3 | NBCP4 | NBCP5 |
|---|
| Color | White/translucent | White/opaque | White/opaque | White/opaque | White/opaque |
| pH | 5.13 ± 0.02 | 5.77 ± 0.01 | 5.86 ± 0.03 | 5.82 ± 0.01 | 5.80 ± 0.01 |
| Density (g/cm3) | 0.996 ± 0.01 | 0.962 ± 0.02 | 0.938 ± 0.02 | 0.97 ± 0.001 | 0.967 ± 0.02 |
| Centrifugation | Stable | Unstable | Unstable | Unstable | Unstable |
| Thermal stress | Stable | Stable | Stable | Stable | Stable |
Table 5.
Hippocratic screening parameters were assessed in rats following subacute intramuscular administration of the β-caryophyllene nanoemulsion (NBCP) at doses of 5 and 15 mg/kg over a 14-day observation period.
Table 5.
Hippocratic screening parameters were assessed in rats following subacute intramuscular administration of the β-caryophyllene nanoemulsion (NBCP) at doses of 5 and 15 mg/kg over a 14-day observation period.
| Parameters | Vehicle | NBCP 5 mg/kg | NBCP 15 mg/kg |
|---|
| Vocal fremitus | Normal | Normal | Normal |
| Irritability | Normal | Normal | Normal |
| Touch response | Normal | Normal | Normal |
| Tail touch response | Normal | Normal | Normal |
| Contortions | Normal | Normal | Normal |
| Body tonus | Normal | Normal | Normal |
| Grip strength | Normal | Normal | Normal |
| Ataxia | Absent | Absent | Absent |
| Auricular reflex | Normal | Normal | Normal |
| Tremors | Absent | Absent | Absent |
| Hypnosis/anesthesi | Absent | Absent | Absent |
| Lacrimation | Absent | Absent | Absent |
| Urination/defecation | Normal | Normal | Normal |
| Piloerection | Absent | Absent | Absent |
| Cyanosis/hyperemia | Absent | Absent | Absent |
| Death | Absent | Absent | Absent |
Table 6.
Effect of subacute intramuscular treatment with NBCP (5, 10, and 15 mg/kg) on organ weights (g) of male rats after 14 days.
Table 6.
Effect of subacute intramuscular treatment with NBCP (5, 10, and 15 mg/kg) on organ weights (g) of male rats after 14 days.
| Parameter | Control | 5 mg/kg | 15 mg/kg |
|---|
| Spleen | 1.274 ± 0.658 | 0.542 ± 0.05 | 0.766 ± 1.161 |
| Pancreas | 2.050 ± 1.308 | 1.696 ± 1.320 | 1.016 ± 0.532 |
| Heart | 1.792 ± 0.249 | 0.980 ± 0.492 | 1.39 ± 0.357 |
| Liver | 12.384 ± 0.557 | 8.840 ± 1.080 | 9.51 ± 0.828 * |
| Kidneys | 1.698 ± 1.515 | 0.996 ± 0.073 | 1.144 ± 0.073 |
| Lung | 2.390 ± 1.718 | 1.552 ± 1.391 | 1.946 ± 0.339 |
Table 7.
Effect of subacute intramuscular treatment with NBCP (5 and 15 mg/kg) on hematological parameters of male Wistar rats (n = 5) after 14 days.
Table 7.
Effect of subacute intramuscular treatment with NBCP (5 and 15 mg/kg) on hematological parameters of male Wistar rats (n = 5) after 14 days.
| Parameter | Control | 5 mg/kg | 15 mg/kg |
|---|
| Erythrogram | | | |
| Red blood cells (×106/mm3) | 9.56 ± 0.21 | 9.41 ± 0.23 | 9.26 ± 0.15 |
| Hemoglobin (g/dL) | 16.68 ± 0.21 | 16.04 ± 0.25 | 16.06 ± 0.35 |
| Hematocrit (%) | 50.68 ± 0.84 | 48.42 ± 1.09 | 48.40 ± 1.08 |
| MCV (fL) | 53.08 ± 0.58 | 51.48 ± 1.15 | 52.25 ± 1.12 |
| MCH (pg) | 17.44 ± 0.18 | 17.06 ± 0.40 | 17.34 ± 0.42 |
| MCHC (g/dL) | 32.9 ± 0.16 | 33.14 ± 0.27 | 33.18 ± 0.13 |
| RDW (%) | 21.140 ± 1.18 | 20.88 ± 0.82 | 19.64 ± 1.04 |
| Leukogram | | | |
| Leukocytes (×103/mm3) | 7.85 ± 0.92 | 8.23 ± 1.65 | 7.03 ± 0.85 |
| Segmented neutrophils (%) | 15.30 ± 1.45 | 19.74 ± 2.07 * | 25.52 ± 10.56 * |
| Eosinophils (%) | 1.38 ± 0.37 | 1.98 ± 0.50 | 1.37 ± 0.47 |
| Basophils (%) | 11.62 ± 1.77 | 11.70 ± 1.23 | 8.44 ± 2.46 |
| Lymphocytes (%) | 67.16 ± 2.57 | 60.36 ± 2.15 | 59.32 ± 8.67 |
| Monocytes (%) | 4.56 ± 0.76 | 6.22 ± 0.95 | 5.36 ± 0.50 |
| Platelets | | | |
| Platelets (×103/mm3) | 1063 ± 172 | 1211 ± 124 | 1374 ± 121 |
| MVP (fL) | 10.88 ± 0.36 | 10.94 ± 0.56 | 10.840 ± 0.39 |
Table 8.
Effect of subacute intramuscular treatment with NBCP (5 and 15 mg/kg) on biochemical parameters of male Wistar rats (n = 5) after 14 days.
Table 8.
Effect of subacute intramuscular treatment with NBCP (5 and 15 mg/kg) on biochemical parameters of male Wistar rats (n = 5) after 14 days.
| Parameter | Control | 5 mg/kg | 15 mg/kg |
|---|
| Glucose (mg/dL) | 97.6 ± 23.17 | 79.3 ± 21.41 | 71.6 ± 6.81 |
| Total cholesterol (mg/dL) | 95.8 ± 8.6 | 61.2 ± 34.6 * | 59.0 ± 36.0 * |
| HDL cholesterol (mg/dL) | 17.8 ± 8.78 | 23.6 ± 5.8 | 27.8 ± 9.2 * |
| LDL cholesterol (mg/dL) | 41.22 ± 8.545 | 21.84 ± 9.57 * | 22.84 ± 14.54 * |
| VLDL cholesterol (mg/dL) | 28.52 ± 10.12 | 16.36 ± 12.16 | 10.7 ± 7.82 * |
| Triglycerides (mg/dL) | 140.2 ± 31.0 | 93.8 ± 11.59 | 53.5 ± 8.98 * |
| AST (U/L) | 144.8 ± 16.27 | 140.0 ± 20.17 | 155.20 ± 37.17 |
| ALT (U/L) | 39.8 ± 5.63 | 37.4 ± 6.7 | 32.8 ± 4.20 |
| Urea (mg/dL) | 55 ± 9.46 | 63.6 ± 9.263 | 61.0 ± 6.28 |
Table 9.
Effect of subacute intramuscular treatment with NBCP (5, 10, and 15 mg/kg) on muscle injury markers in Wistar rats after 14 days.
Table 9.
Effect of subacute intramuscular treatment with NBCP (5, 10, and 15 mg/kg) on muscle injury markers in Wistar rats after 14 days.
| Parameter | Control | 5 mg/kg | 15 mg/kg |
|---|
| Myoglobin (mg/dL) | 5.040 ± 0.055 | 5.400 ± 0.055 | 5.320 ± 0.356 |
| CK (U/L) | 1.312 ± 323.833 | 919.600 ± 184.028 | 689.0 ± 241.404 * |
| LDH (U/L) | 3357.0 ± 520.448 | 2998.0 ± 159.830 | 3116.60 ± 1448.412 |





 ,
,