Article

UPLC-MS/MS Metabolomics Reveals Babao Dan’s Mechanisms in MASH Treatment with Integrating Network Pharmacology and Molecular Docking

1
College of Basic Medicine and Forensic Medicine, Henan University of Science and Technology, Luoyang 471023, China
2
School of Nursing, Henan University of Science and Technology, Luoyang 471003, China
*
Author to whom correspondence should be addressed.
Pharmaceuticals 2025, 18(8), 1111; https://doi.org/10.3390/ph18081111
Submission received: 27 June 2025 / Revised: 17 July 2025 / Accepted: 22 July 2025 / Published: 25 July 2025
(This article belongs to the Section Pharmacology)

Abstract

Background: Metabolic dysfunction-associated steatohepatitis (MASH) is a progressive disease that easily develops into cirrhosis and hepatocellular carcinoma, but its pathogenesis is not clear, and most therapeutic drugs have obvious limitations. However, Babao Dan (BBD) has a good therapeutic effect on liver disease, but its treatment mechanism is still to be studied. Therefore, we further investigated the mechanism of BBD in treating MASH. Methods: We predicted BBD-related targets through network pharmacology and further verified the binding ability of BBD-related targets through molecular docking. We also detected relevant indicators before and after model treatment, as well as metabolomics analysis and identification of the mechanism of action of BBD on MASH. Results: Through network pharmacology methods, 158 key cross targets and the top 10 core targets were identified, and it was determined that the PI3K-AKT signaling pathway plays an important regulatory role in the treatment of MASH with BBD. The molecular docking results indicate that the representative compounds quercetin and 17 Beta Estradiol have good binding activity with five core targets. Metabolomics has identified four metabolic biomarkers, such as Piceid, and it is determined that the key pathway for BBD treatment of MASH is the bile secretion pathway. Conclusions: BBD effectively treats MASH by modulating Piceid and other biomarkers, targeting ESR1 and other core proteins via quercetin and 17-beta-estradiol, and regulating the PI3K-AKT and bile secretion pathways to alleviate liver injury.

Graphical Abstract

1. Introduction

Nonalcoholic steatohepatitis (NASH) is the second stage in the spectrum of nonalcoholic fatty liver disease (NAFLD). As a progressive disease, MASH should be taken seriously in order to prevent further progression to cirrhosis or even hepatocellular carcinoma [1,2]. The pathogenesis of NASH is currently unclear, and basic treatments such as weight loss, dietary control, and exercise are the preferred therapeutic tools for treatment. However, patient compliance is poor, and these methods are not effective in the treatment of NASH and liver fibrosis [3]. While drugs for treating and improving NASH have been developed, they have significant limitations and their effectiveness and safety are still being investigated in clinical studies. Therefore, continuous clinical and preclinical research is needed on existing and potential drugs to improve the treatment of NASH. Recently, experts have suggested using the terms ‘metabolic-associated fatty liver disease’ (MAFLD) and ‘metabolic dysfunction-associated steatohepatitis’ (MASH) to replace NAFLD and NASH in the context of metabolic syndrome [4].
BaBao Dan (BBD) is an imperial medicine with a history of more than 400 years and is often used in modern medicine as an adjunct in the treatment of chronic liver disease. Its uniqueness lies in the presence of a variety of precious natural ingredients such as Calculus Bovis (Niu Huang), Snake Bile (She Dan), Antelope Horn (Ling Yang Jiao), Pearl (Zhen Zhu), Moschus (She Xiang), and Notoginseng Radix et Rhizoma (San Qi) (all plant names were verified through MNPS; http://mpns.kew.org, accessed on 20 January 2025). From the perspective of Chinese medicine, BBD has multiple effects such as reducing temperature, detoxification, calming the liver, reducing wind, relieving pain, and improving eyesight. It can also dilate capillaries, relax the biliary sphincter, dissolve stones, and improve microcirculation, and has anti-inflammatory, choleretic, and antioxidant effects. BBD is widely used clinically in the treatment of many hepatobiliary diseases, with some studies confirming [5] the effectiveness and safety of BBD in improving liver function in patients with jaundiced viral hepatitis. Some studies have also shown [6] that since BBD has no toxic side effects and can significantly improve clinical symptoms and liver function in patients and reduce enzymes and jaundice, it can be used in the treatment of viral hepatitis. These studies provide strong support for the use of BBD in the treatment of viral hepatitis with significant results. Clinical studies have also shown [7] that BBD can promote the recovery of liver detoxification and metabolism in patients after hepatectomy and reduce postoperative damage to hepatocytes; other studies have shown that [8] BBD can reduce the acute inflammatory response caused by various reasons through signaling pathways such as AMFK and cellular autophagy and thus play a role in protecting the liver. BBD was recorded in the Compendium of Materia Medica by Li Shizhen as early as 1596. It has the effects of nourishing the qi and blood, regulating and warming meridians, reducing cold, alleviating wind, and relaxing muscles. BBD was also recorded in the Dictionary of Traditional Chinese Medicine by the China Academy of Chinese Medical Sciences in 1998. Therefore, in this study, we explored BBD’s action in a MASH rat model.
The clinical research results of BBD are consistent with the preclinical research results, and all the experiments mentioned above showed a decreasing trend in AST and ALT after treatment. In addition, the side effects of BBD are very small, and the side effects are mainly gastrointestinal reactions, which are transient and do not cause long-term effects. In terms of drug interactions, if BBD is used in combination with anticoagulants for a long time, it may increase bleeding volume and requires close monitoring of relevant indicators, but it does not have severe interactions with most drugs used to treat liver disease.
MASH is prone to develop and deteriorate into more serious cirrhosis or even hepatocellular carcinoma, and the mechanism of its pathogenesis has not yet been clarified, and BBD has a good therapeutic effect on it, so the present experiments used network pharmacology, metabolomics, and animal-related experimental validation methods to further explore the therapeutic potential of BBD on MASH.

2. Results

2.1. Network Pharmacology

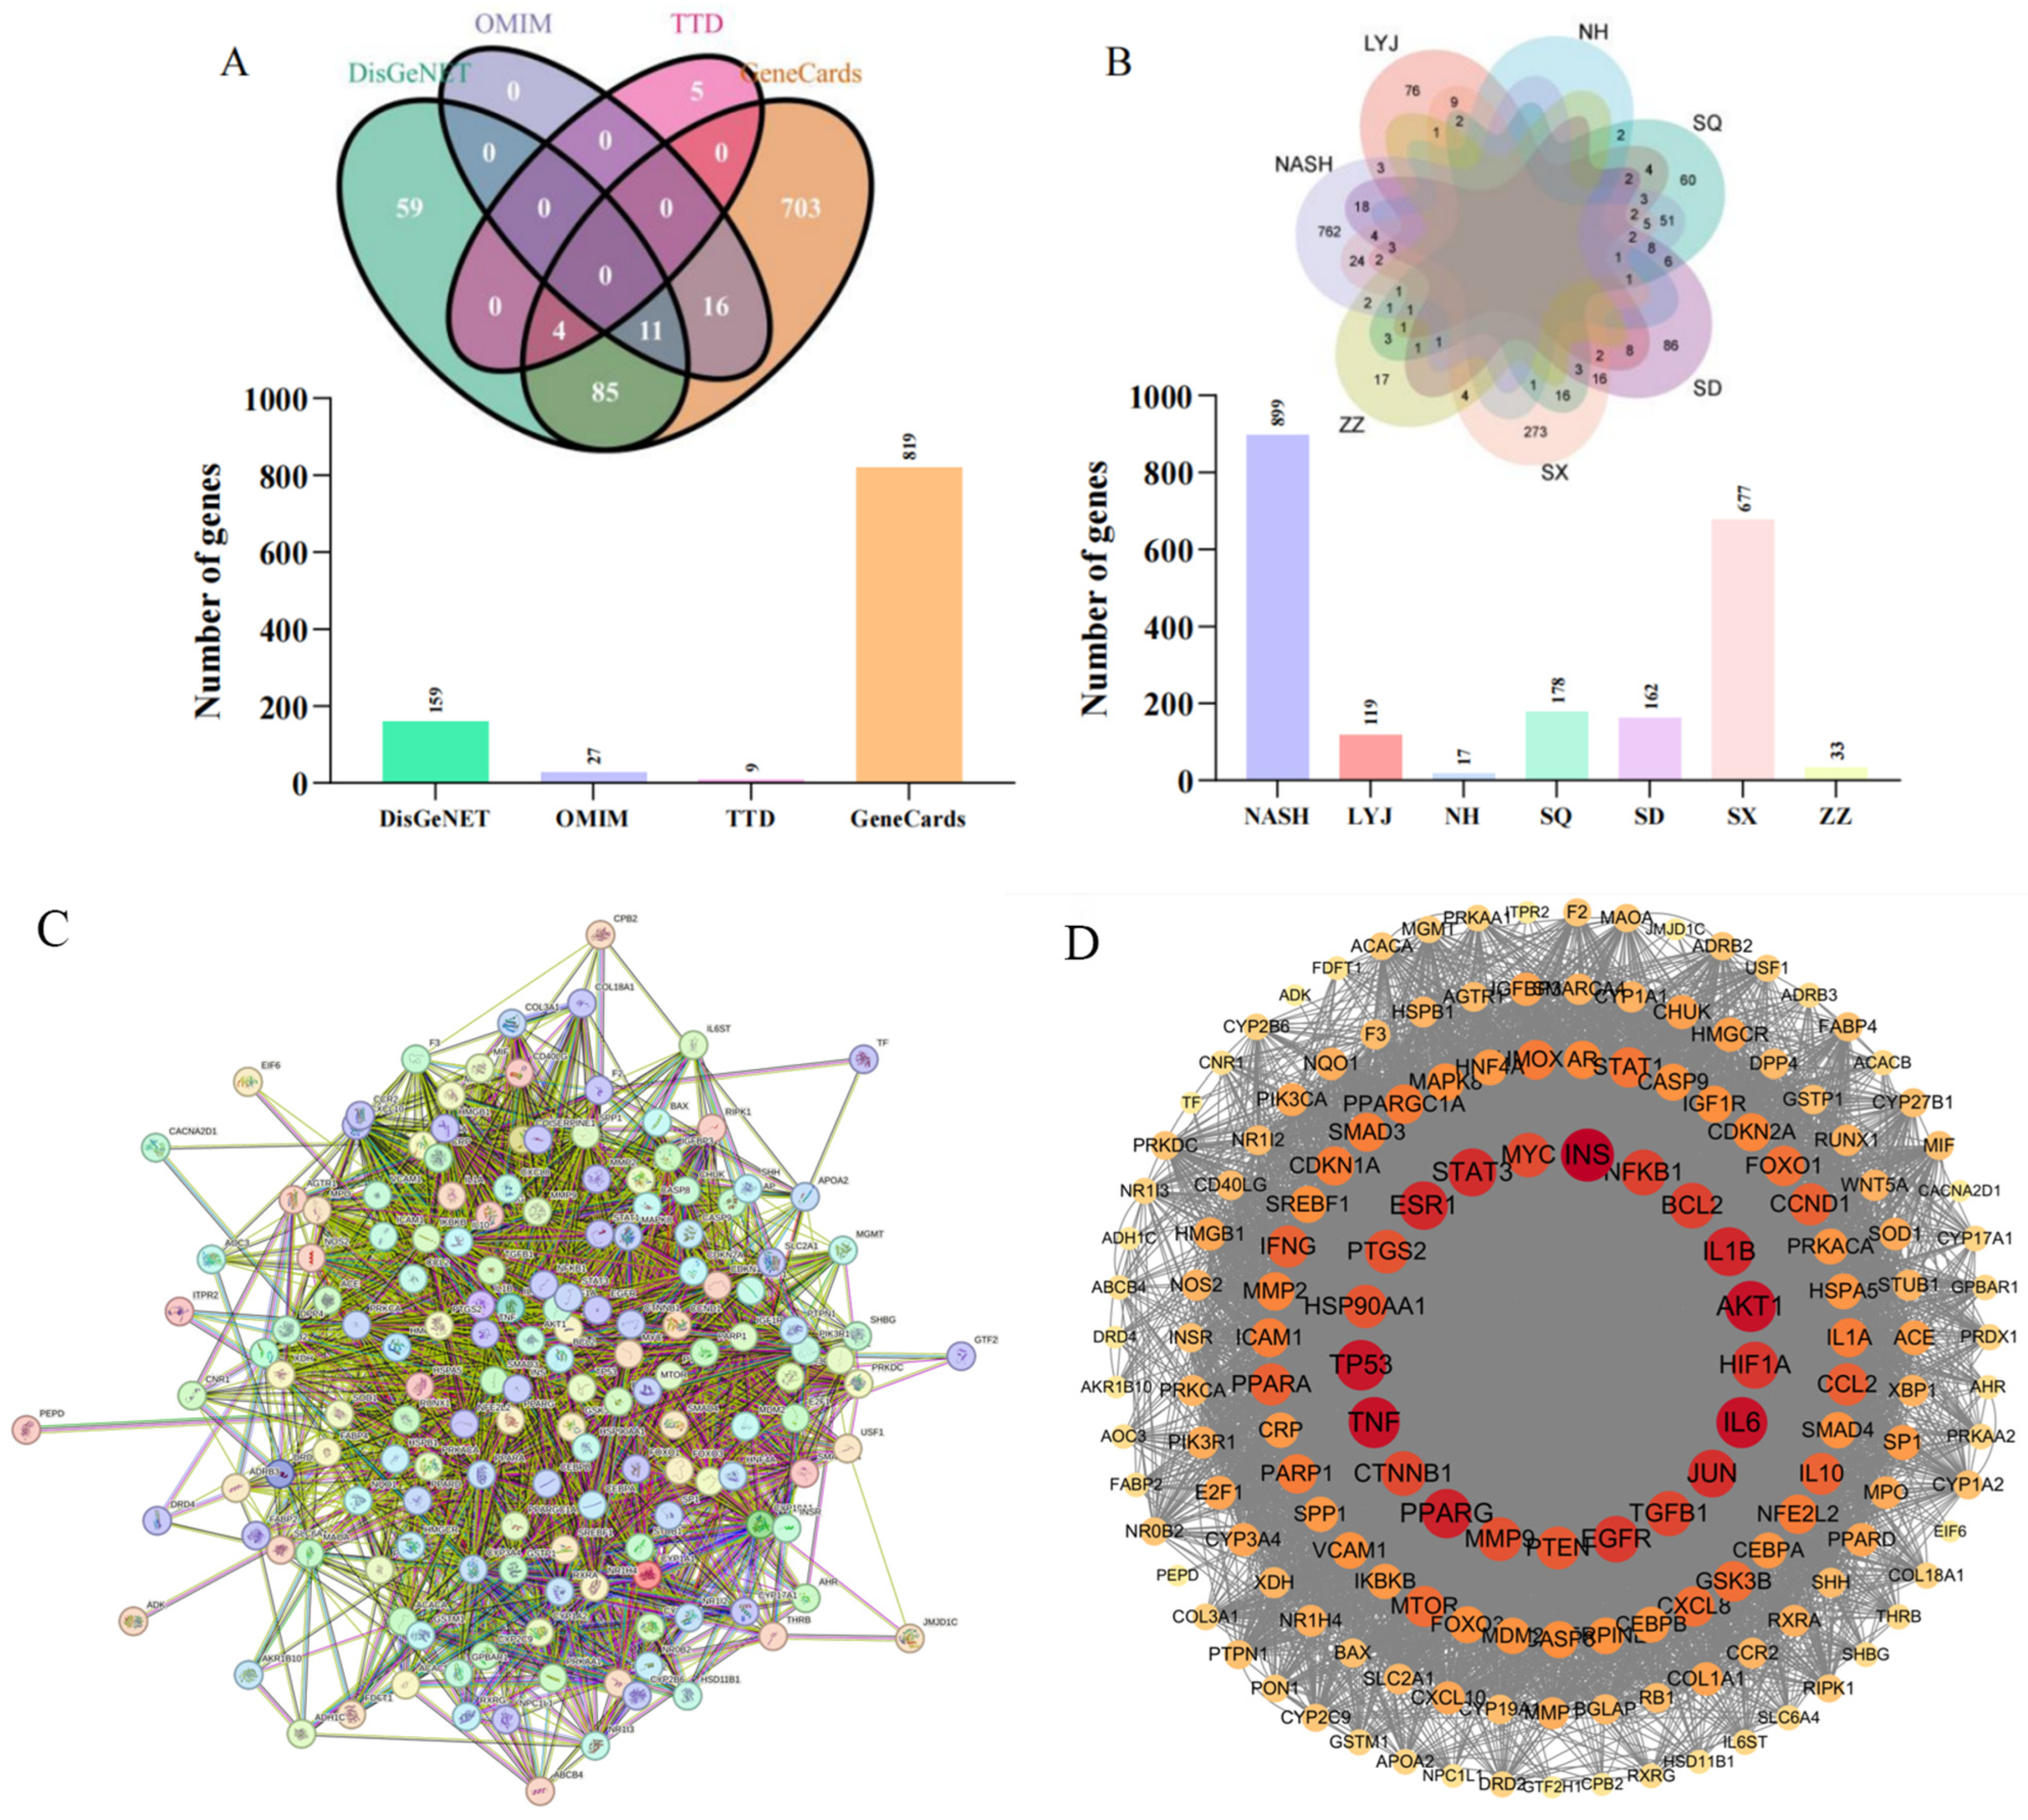
2.1.1. BBD and MASH Common Target Identification

There are six major active components known to be present in BBD that play key roles in the drug’s mechanism of action. In order to gain a more comprehensive understanding of the pharmacological effects of BBD, 137 different bioactive compounds (Table 1) were identified after a series of rigorous screenings (mainly screened in TCMSP database with OB ≥ 30%, DL ≥ 0.18). In addition, we also systematically integrated and analyzed target information from various databases and obtained 963 unique BBD targets (Figure 1A) and 899 targets related to MASH (e.g., Figure 1B), with a total of 158 intersecting targets.

2.1.2. PPI Network and Core Targets

After using STRING to obtain the protein interaction network graph, the downloaded TSV format file was imported into Cytoscape 3.9.1 to obtain 158 nodes and 7354 edges. After selecting Analyze Network, the gene target size, font size, transparency, and color shades were set as the standards to draw the PPI plot (Figure 1C,D). In Centiscape2.2, Betweenness > 122.341772, Closeness > 0.003668, and Degree > 46.544303 were selected as the parameter thresholds after topology with the above three metrics, and then the top 10 core targets were obtained after screening (Table 2).

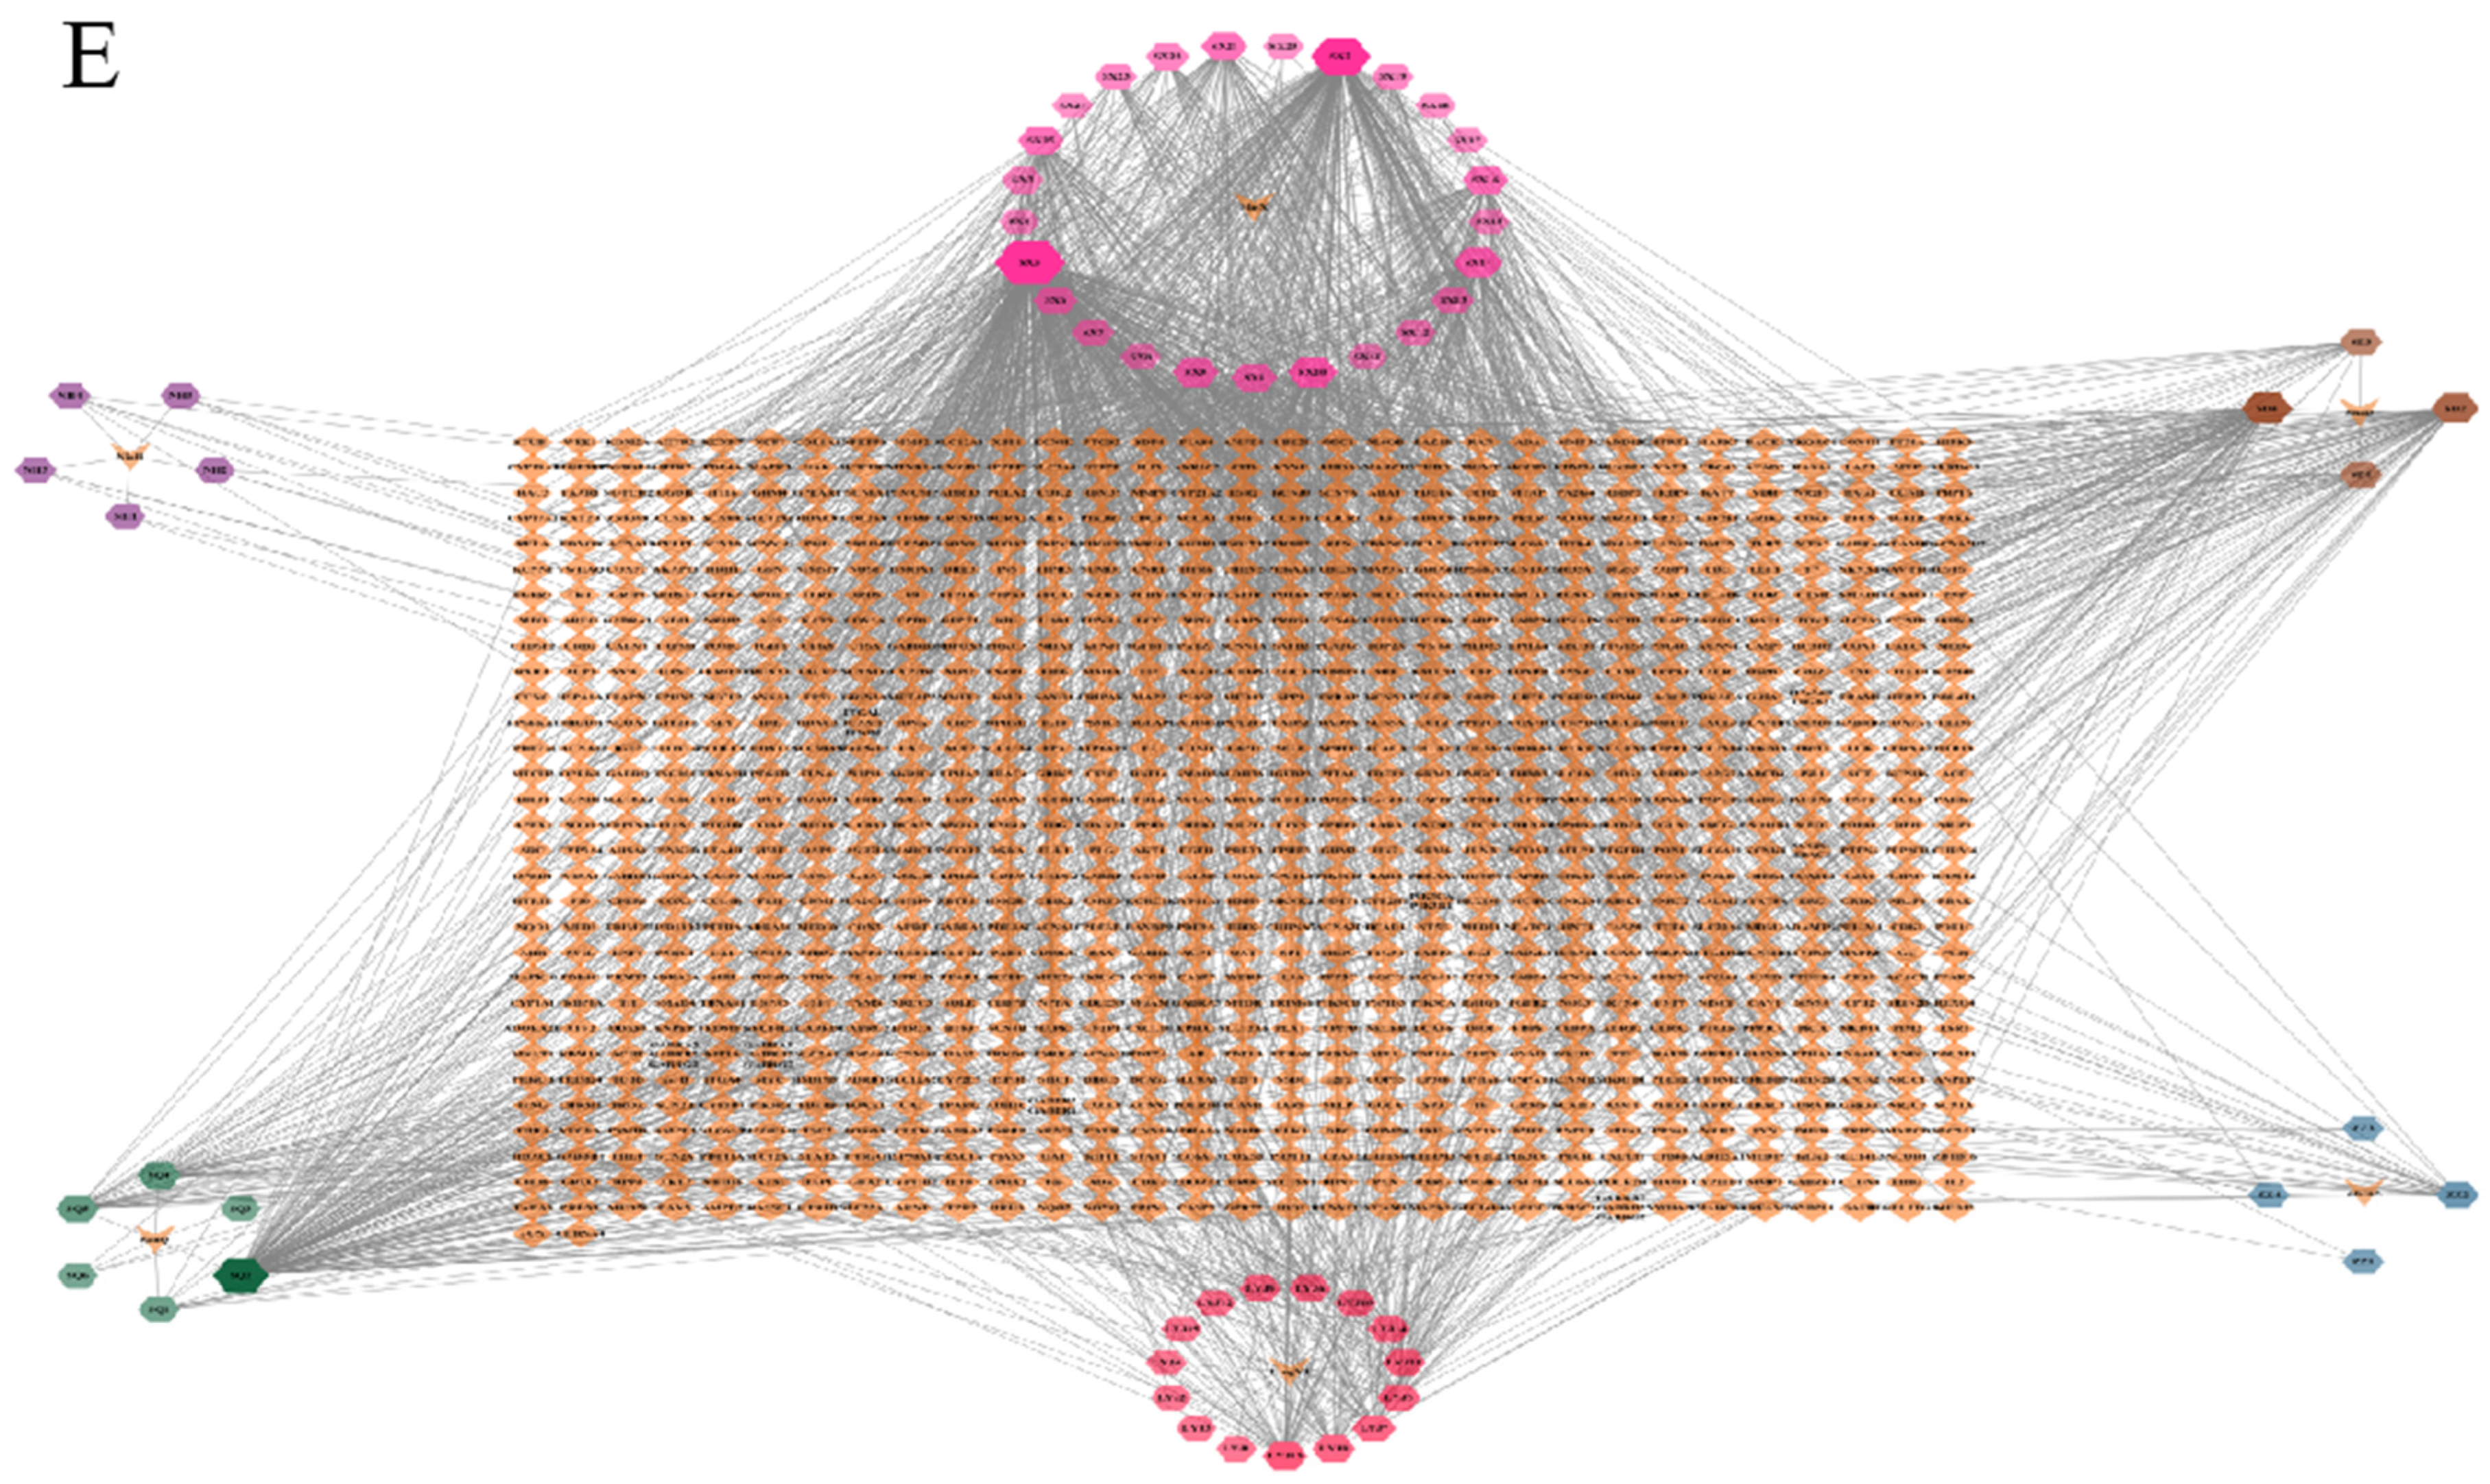
2.1.3. Drug Active Ingredient Target Map

After importing Cytoscape 3.9.1, 1028 nodes and 2059 edges were obtained. The orange “V” shapes represent the six active pharmaceutical ingredients, and the active pharmaceutical ingredients are surrounded by their corresponding active compounds, with the larger ones indicating the highest correlation, i.e., degree value. Examples include SX5 (17-beta-estradiol), SX2 testosterone, SD4 taurocholic acid, ZZ2 copper, LYJ13 tryptophan, and SQ2 quercetin. The relationship between the three is visualized in Figure 1E.

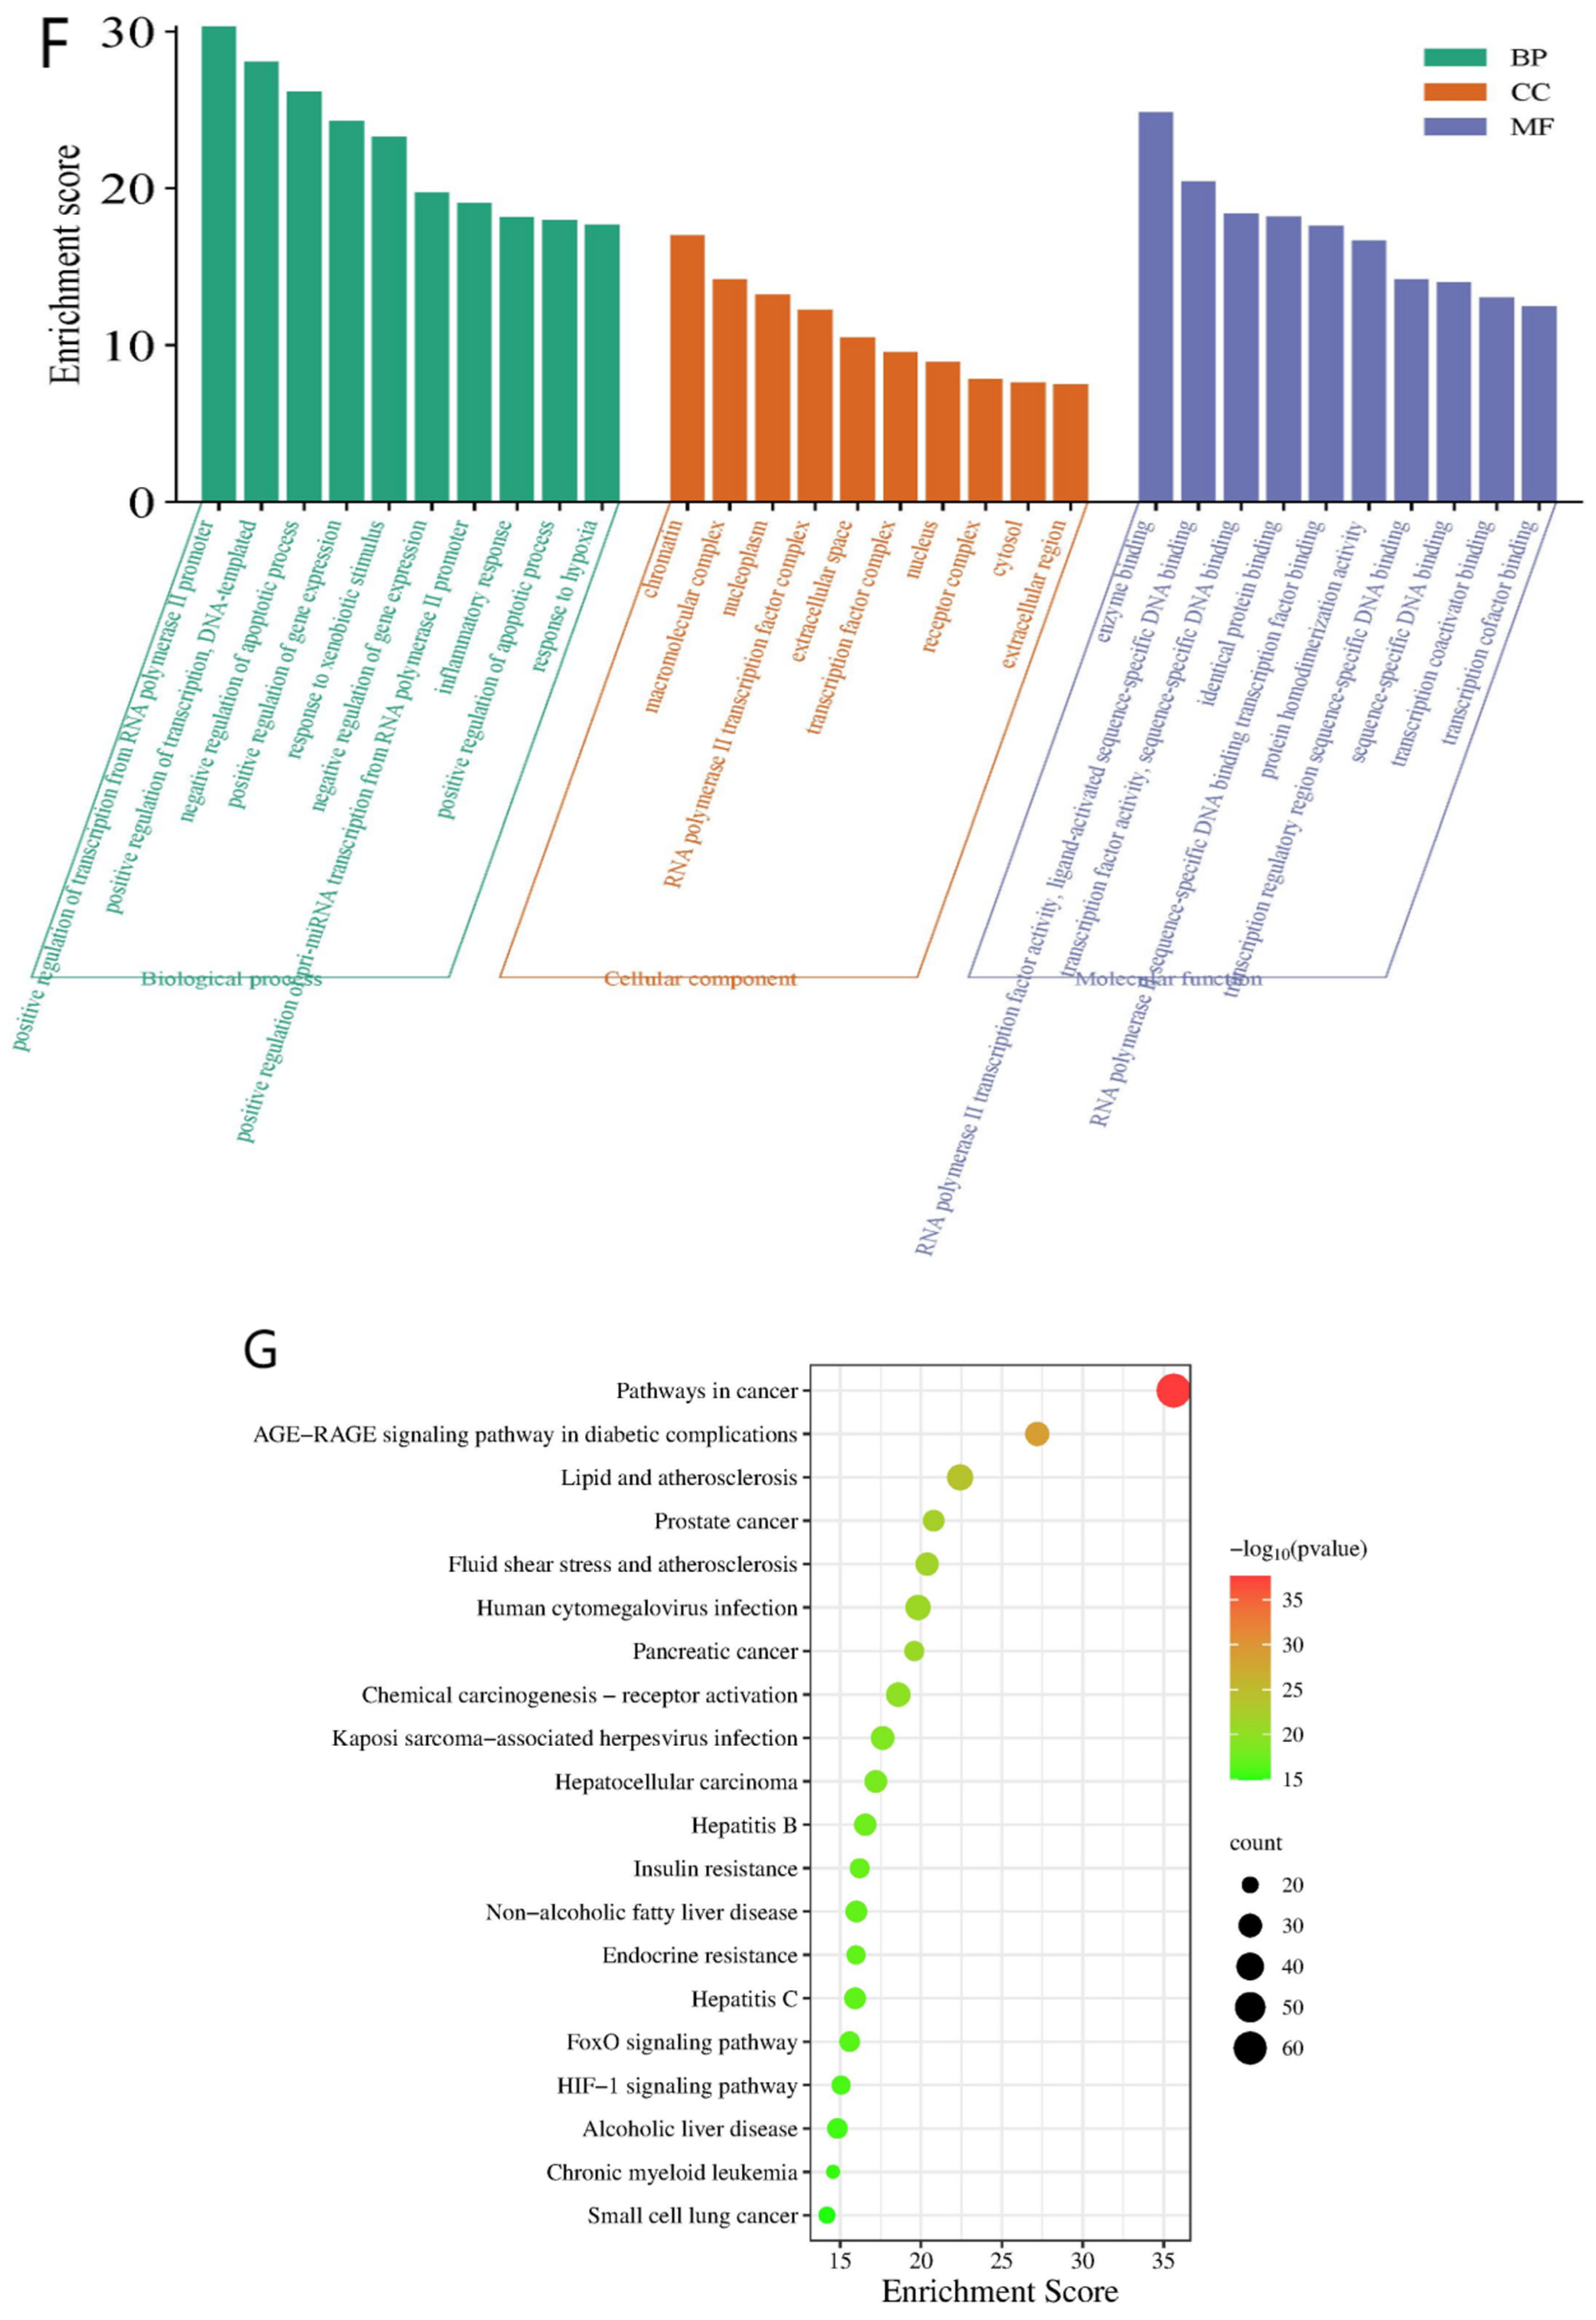
2.1.4. Enrichment Analysis

After visualization, as can be seen in Figure 1F, the targets of BBD for the treatment of MASH are mainly enriched for the positive regulation of transcription from RNA polymerase II promoter (GO:0045944), the positive regulation of transcription, biological processes such as DNA templates (GO:0045893), cellular components such as chromatin (GO:0000785), macromolecular complexes (GO:0032991), enzyme binding (GO:0019899), RNA polymerase II transcription factor activity, ligand-activated sequence-specific DNA binding (GO:0004879), and other molecular functions.
Using KEGG pathway analysis, we further explored the functions and signaling pathways of BBD anti-MASH targets. The results showed that a total of 178 statistically significant BBD-MASH-related pathways were identified. Among them, the top 20 pathways with the highest enrichment significance are presented as significantly enriched bubble plots in Figure 1G. Notably, the pathways with the smallest p-values were pathways in cancer. In addition, the nonalcoholic fatty liver disease pathway may be an important BBD-MASH therapeutic pathway in this study. Both pathways involve a common signaling mechanism, the PI3K-AKT signaling pathway (RNO04151).

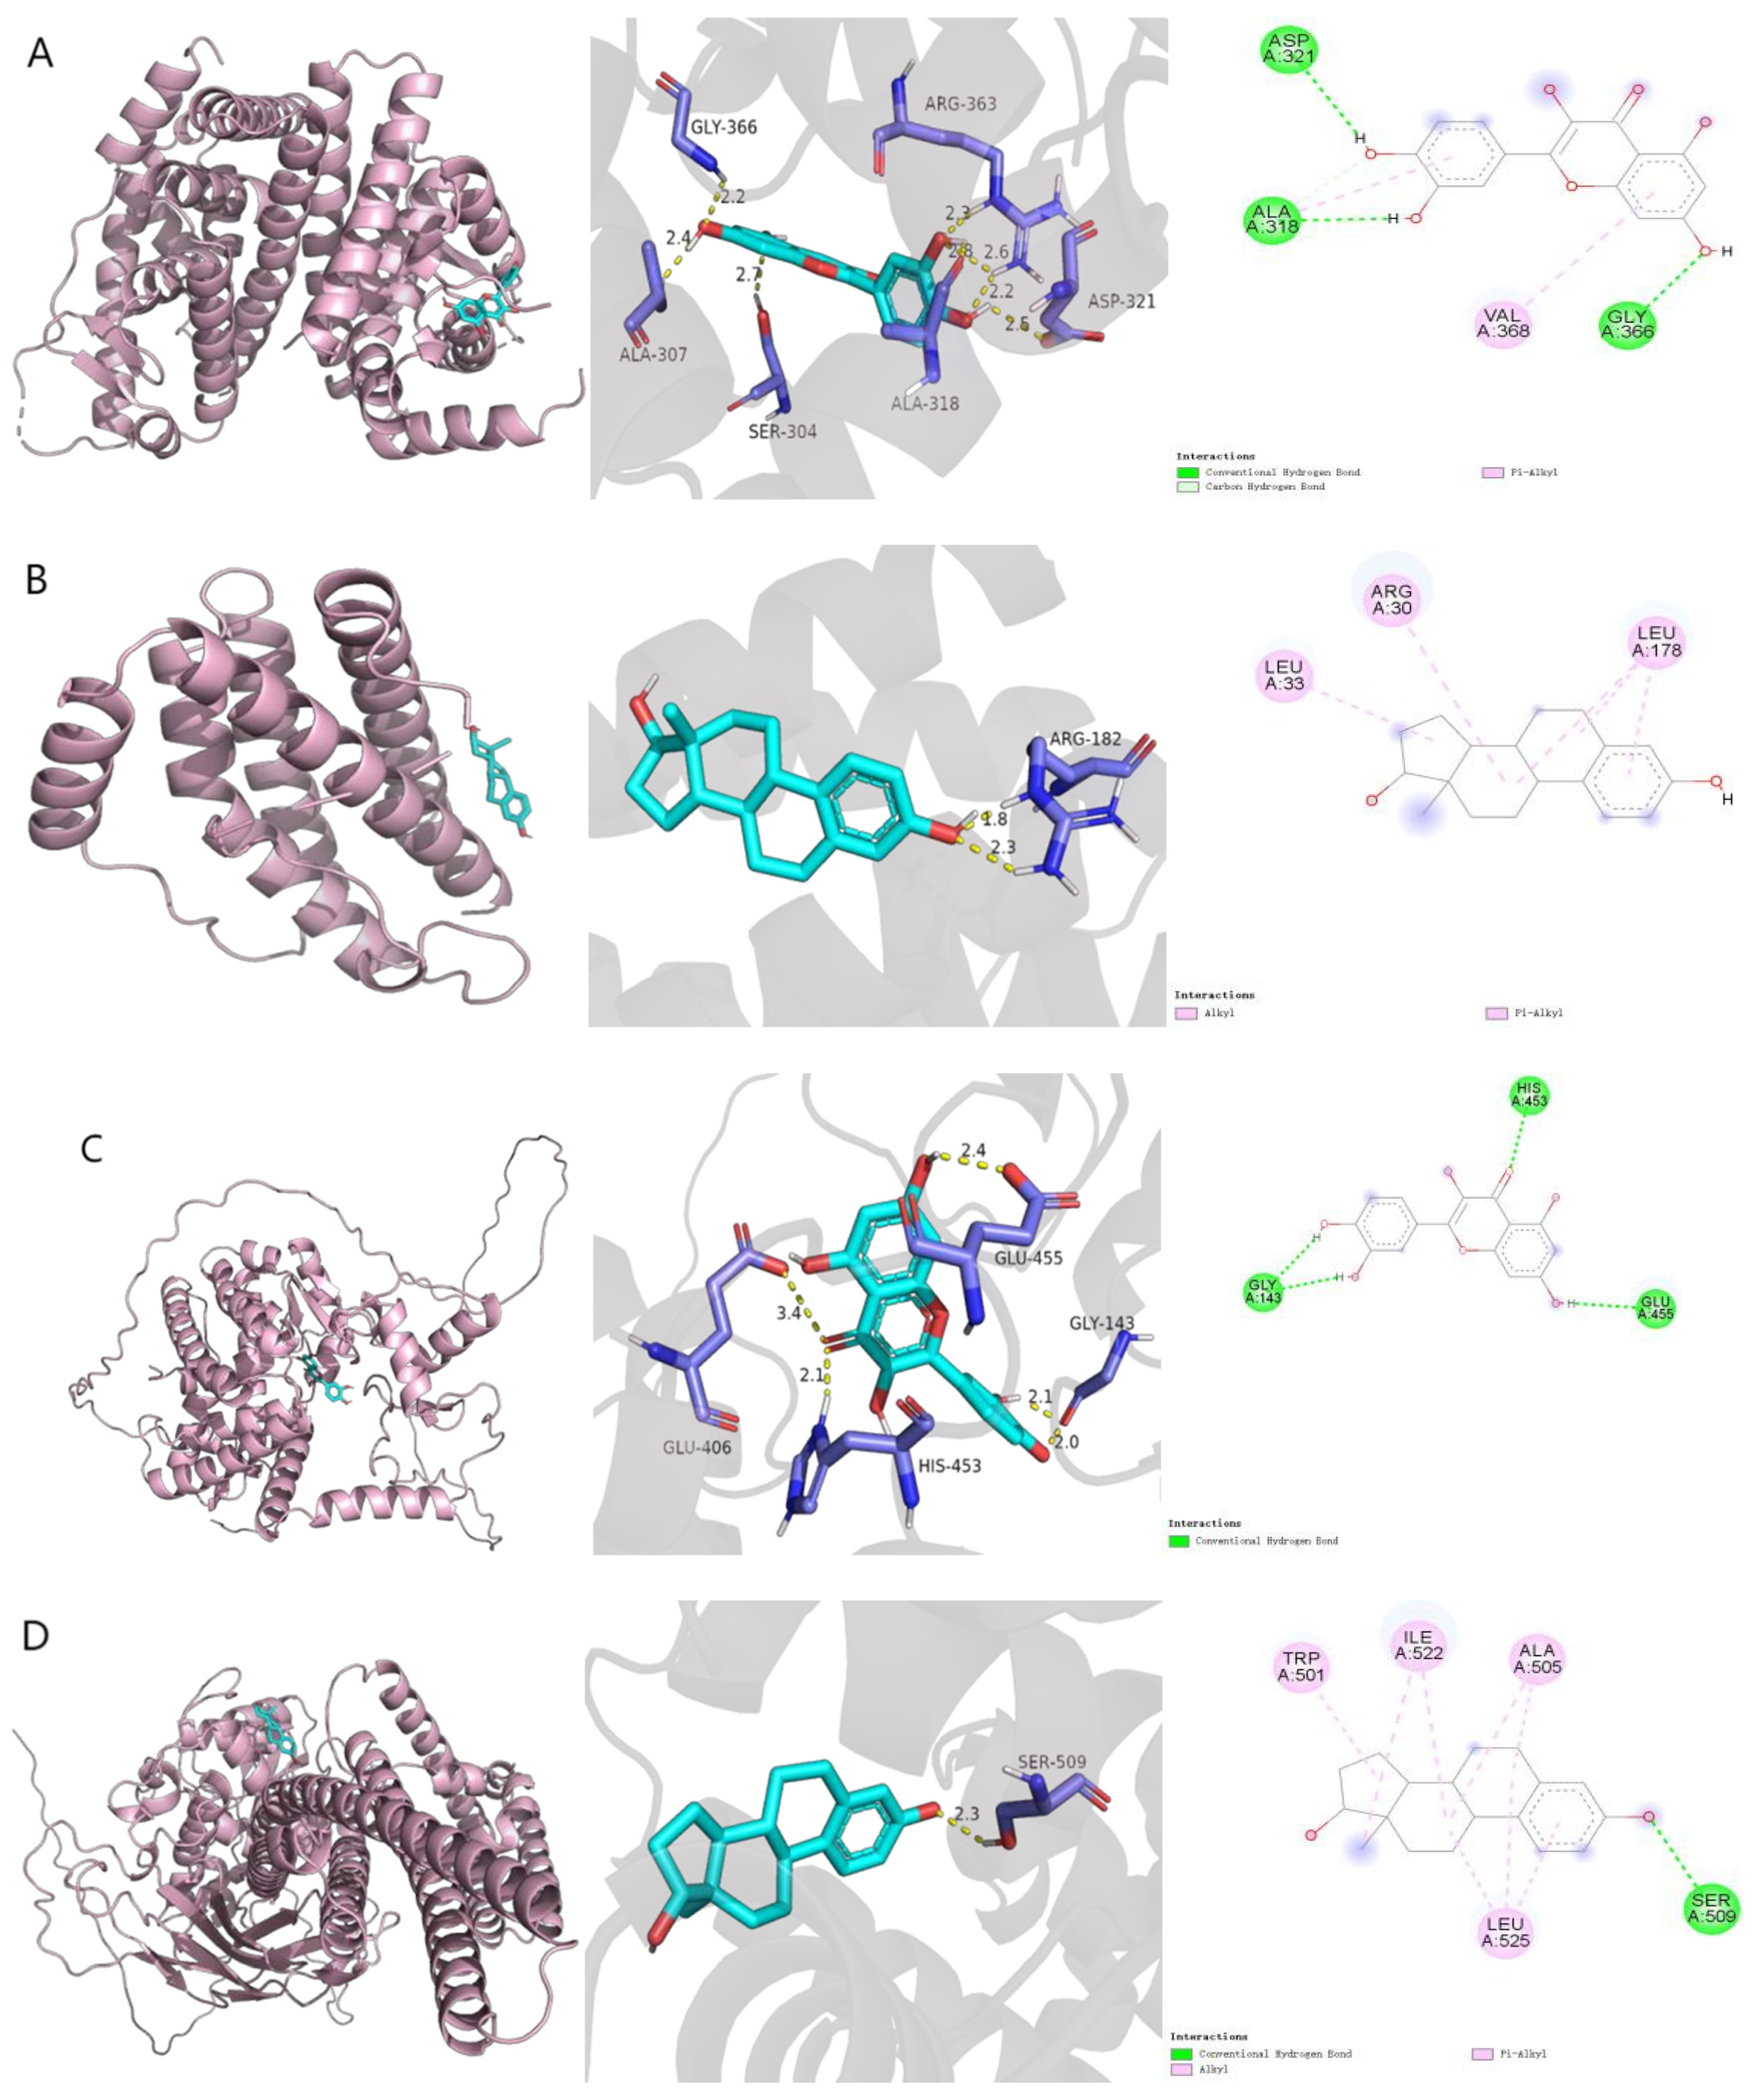
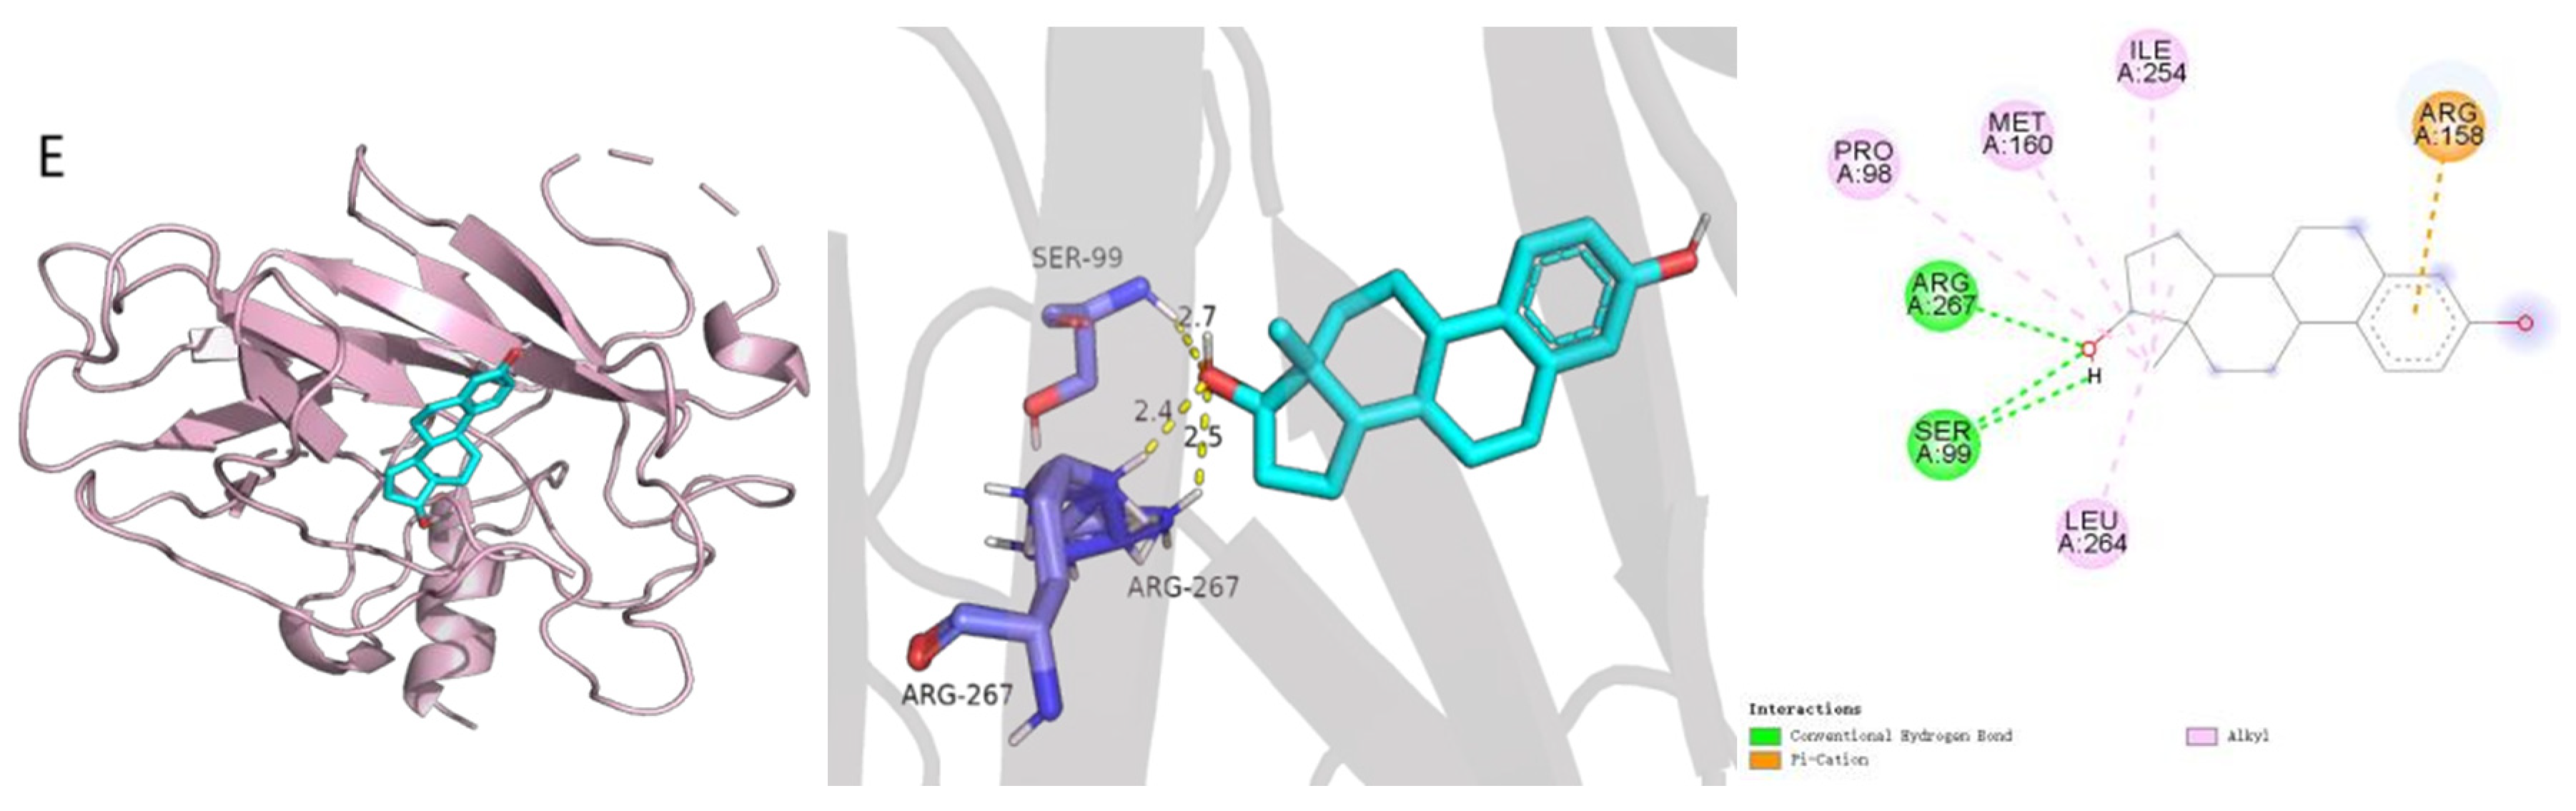
2.2. Molecular Docking

After docking the top 10 core target proteins with their corresponding components (Table 3), it was found that those with a binding energy < −7.0 kcal/mol were ESR1 with quercetin, IL6 with 17-beta-estradiol, PPARG with quercetin, STAT3 with 17-beta-estradiol, and TP53 with 17-beta-estradiol. The results of their molecular docking are shown in Figure 2, with TP53 binding most stably to 17-beta-estradiol, mainly through the formation of hydrogen bonds with ARG-267 and SER-99 amino acid residues of 17-beta-estradiol target proteins; hydrophobic interactions with PRO-98, MET-160, ILE-254, and LEU-264; and strong Pi–Cation interactions with ARG-158, which together enhance the stability of the complex. These components can bind well to the active site of the core target and exhibit strong binding activity. We can hypothesize that the two representative compounds in BBD, quercetin and 17-beta-estradiol, may exert their therapeutic effects by binding to the five core target proteins of MASH, including ESR1.
In conclusion, quercetin and 17-beta-estradiol, key compounds found in BBD, significantly impact the pathogenesis and treatment of MASH. Additionally, the signaling pathways and biological processes associated with BBD-MASH are crucial for understanding this condition. Network pharmacology and molecular docking studies offer valuable insights and potential mechanisms for the efficacy of BBD in treating MASH.

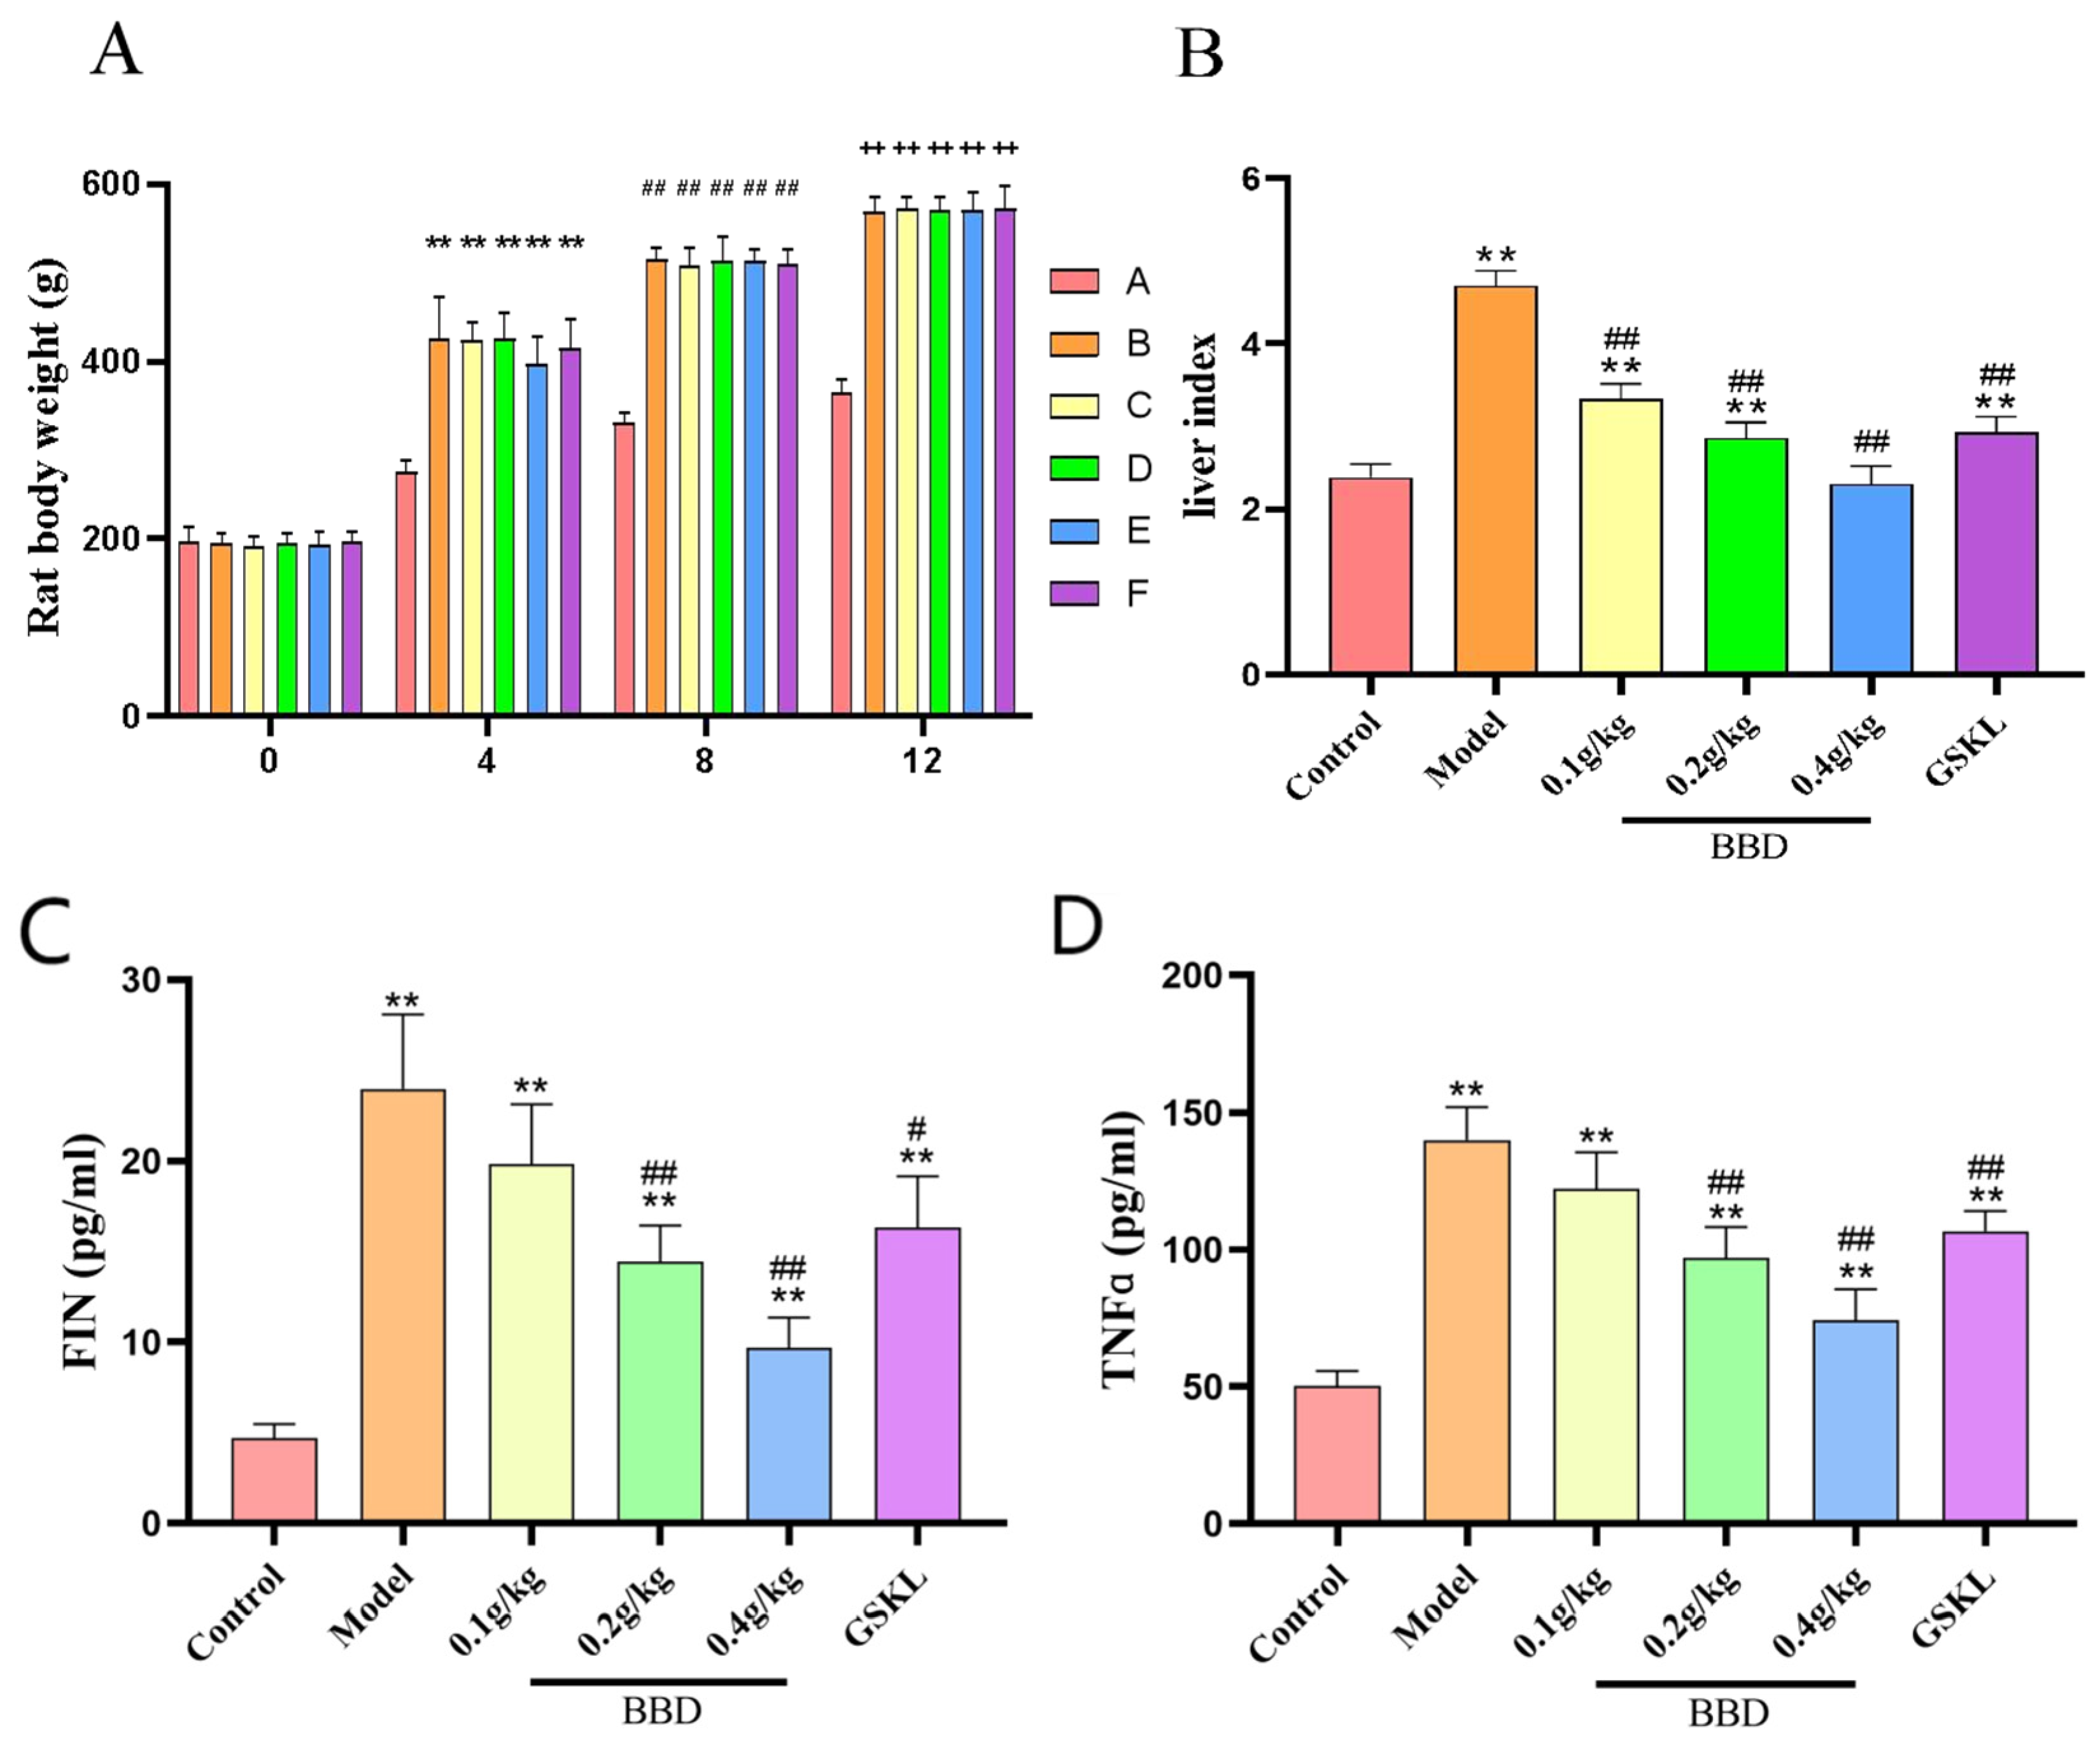
2.3. Changes in Body Weight and Liver Index in Rats
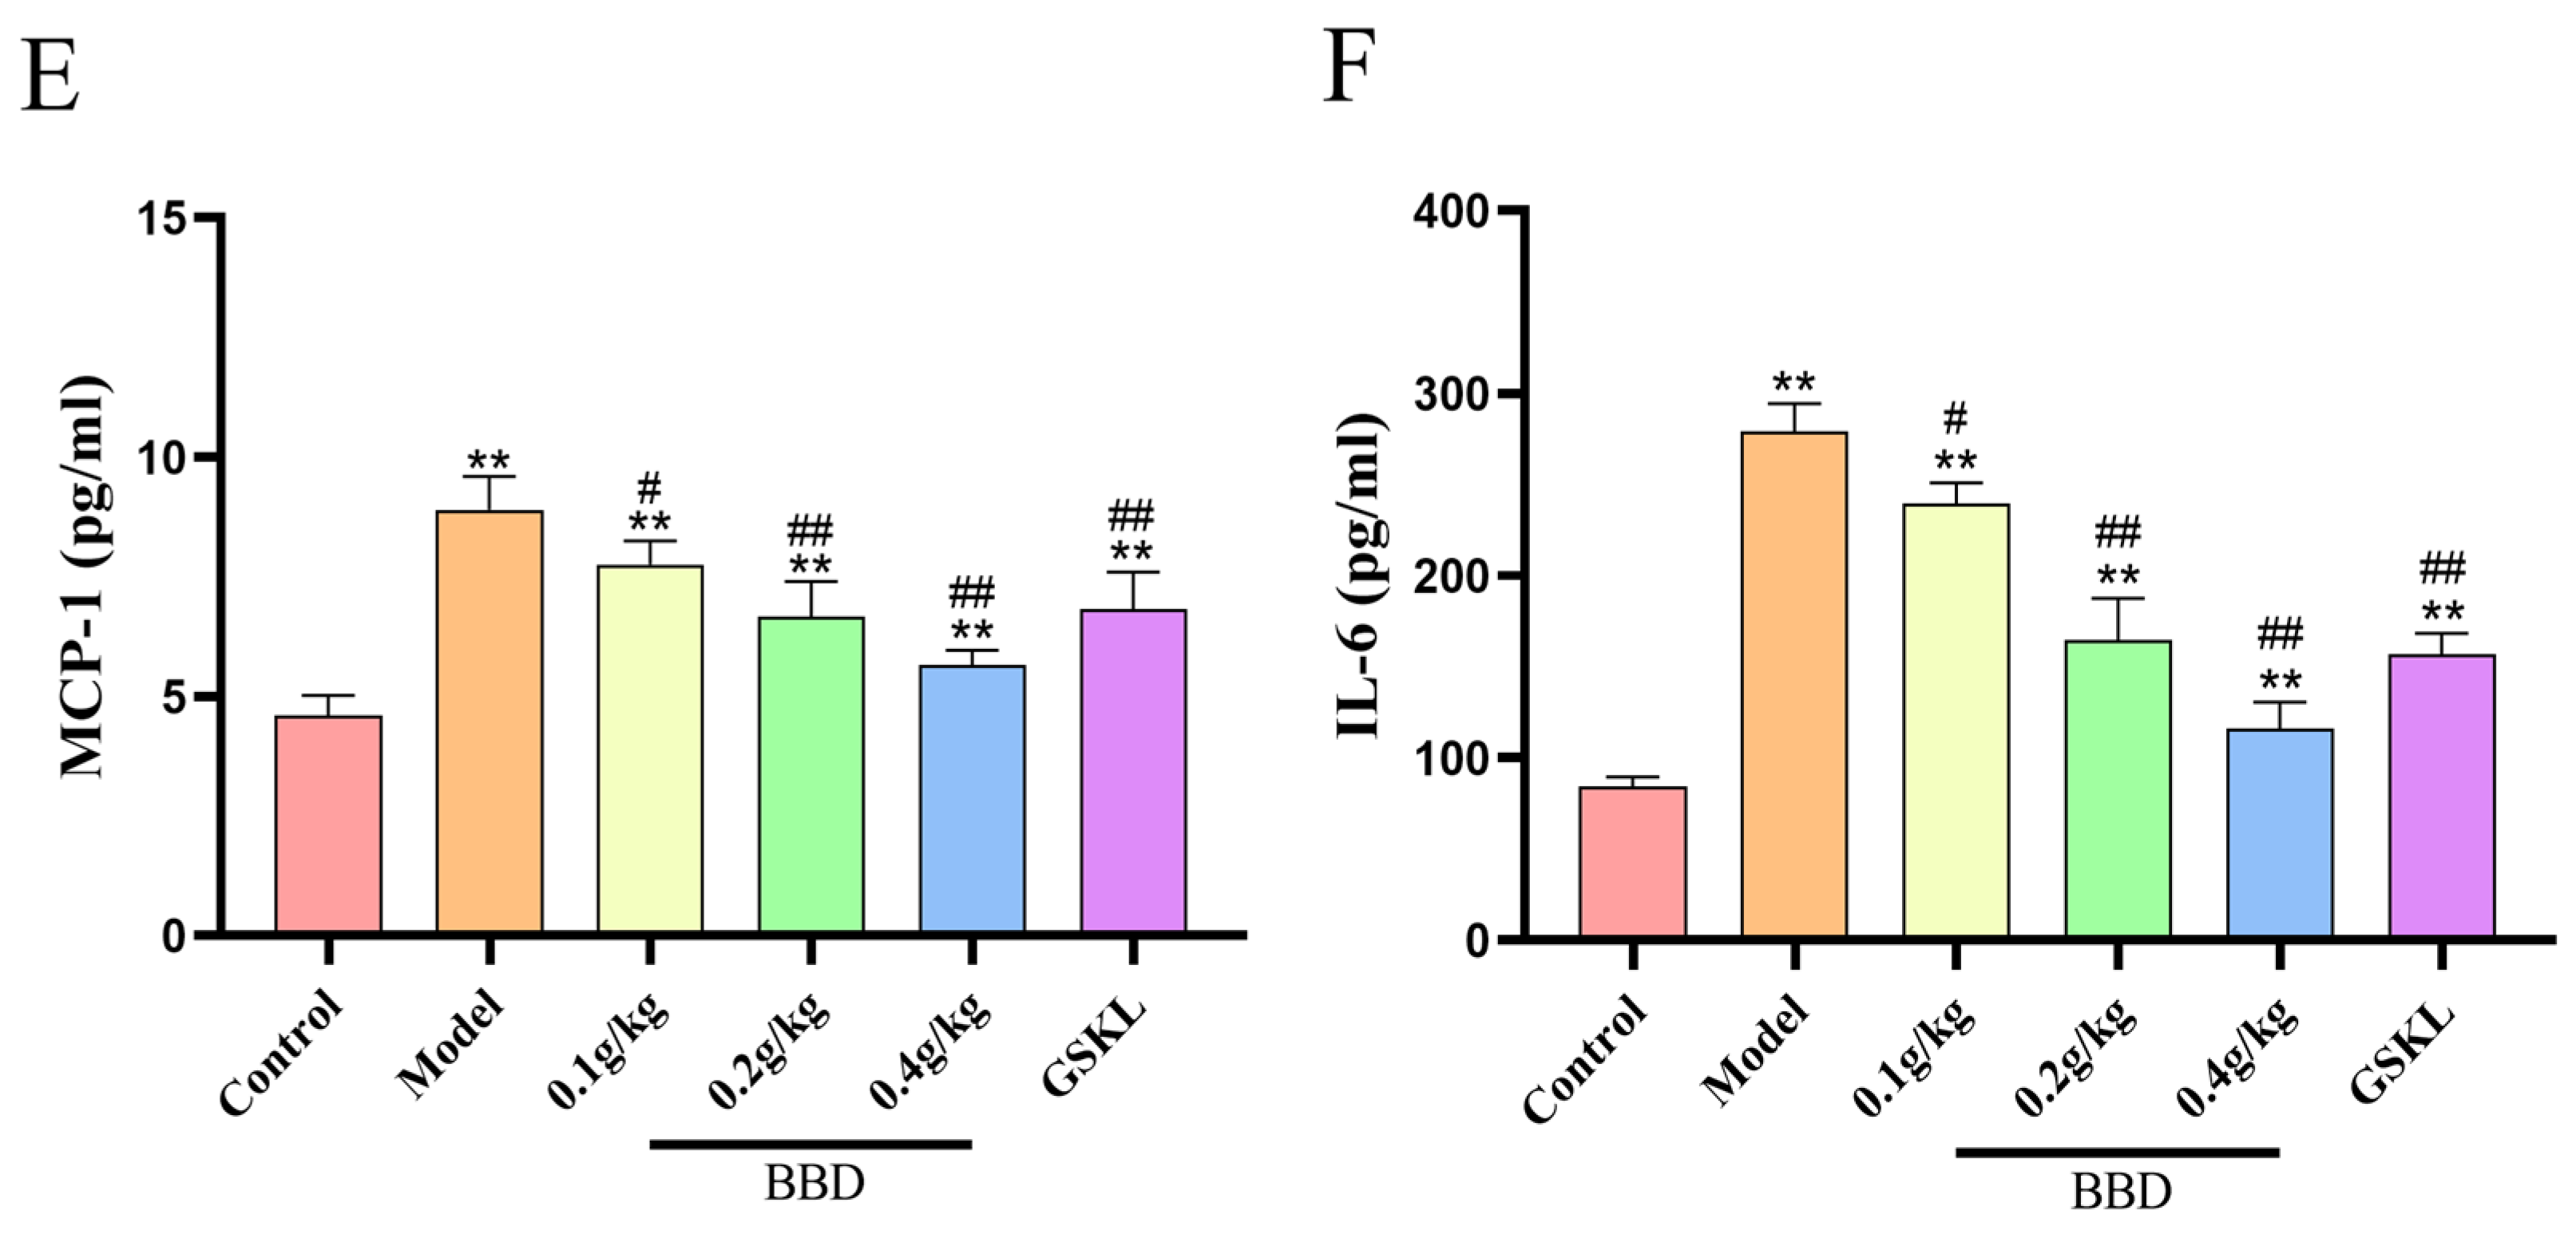
The results showed (Figure 3A,B) that the body weight of the rats in the blank control group remained relatively stable throughout the modeling process, while the body weights of rats in the remaining groups gradually increased, and the increase in body weight was obvious.
The liver index (liver weight/rat body weight × 100%) of the rats in the blank control group was relatively low, indicating that the liver was in good condition and not significantly damaged. The hepatic index of the rats in the model group was significantly elevated, indicating that the liver may be damaged or diseased. After treatment, the liver indices in all treatment groups were significantly reduced compared to the model group, indicating effective improvement in liver health. The high-dose BBD group demonstrated the most notable results.

2.4. ELISA Results

The results showed (Figure 3C–F) that the serum levels of inflammatory factors as well as the FIN levels changed significantly in all groups of rats after different treatments.
Inflammatory factors (TNFα, MCP-1, IL-6): The levels of each factor were significantly elevated in the model group, indicating that an inflammatory response occurred in the rats. The inflammatory factor levels decreased in all BBD dose groups compared to the model group in a dose-dependent manner, with the most significant reduction observed in the high-dose BBD group. There was also a significant decrease in the GSKL group, but it was slightly less effective than in the high-dose BBD group.
FIN levels: These levels were significantly higher in the model group, indicating that the liver becomes less sensitive to insulin as MASH progresses. The FIN levels decreased in all BBD dose groups compared to the model group, and the higher the dose, the greater the decrease. The FIN levels also decreased in the GSKL group, but the effect was not as pronounced as in the high-dose BBD group.

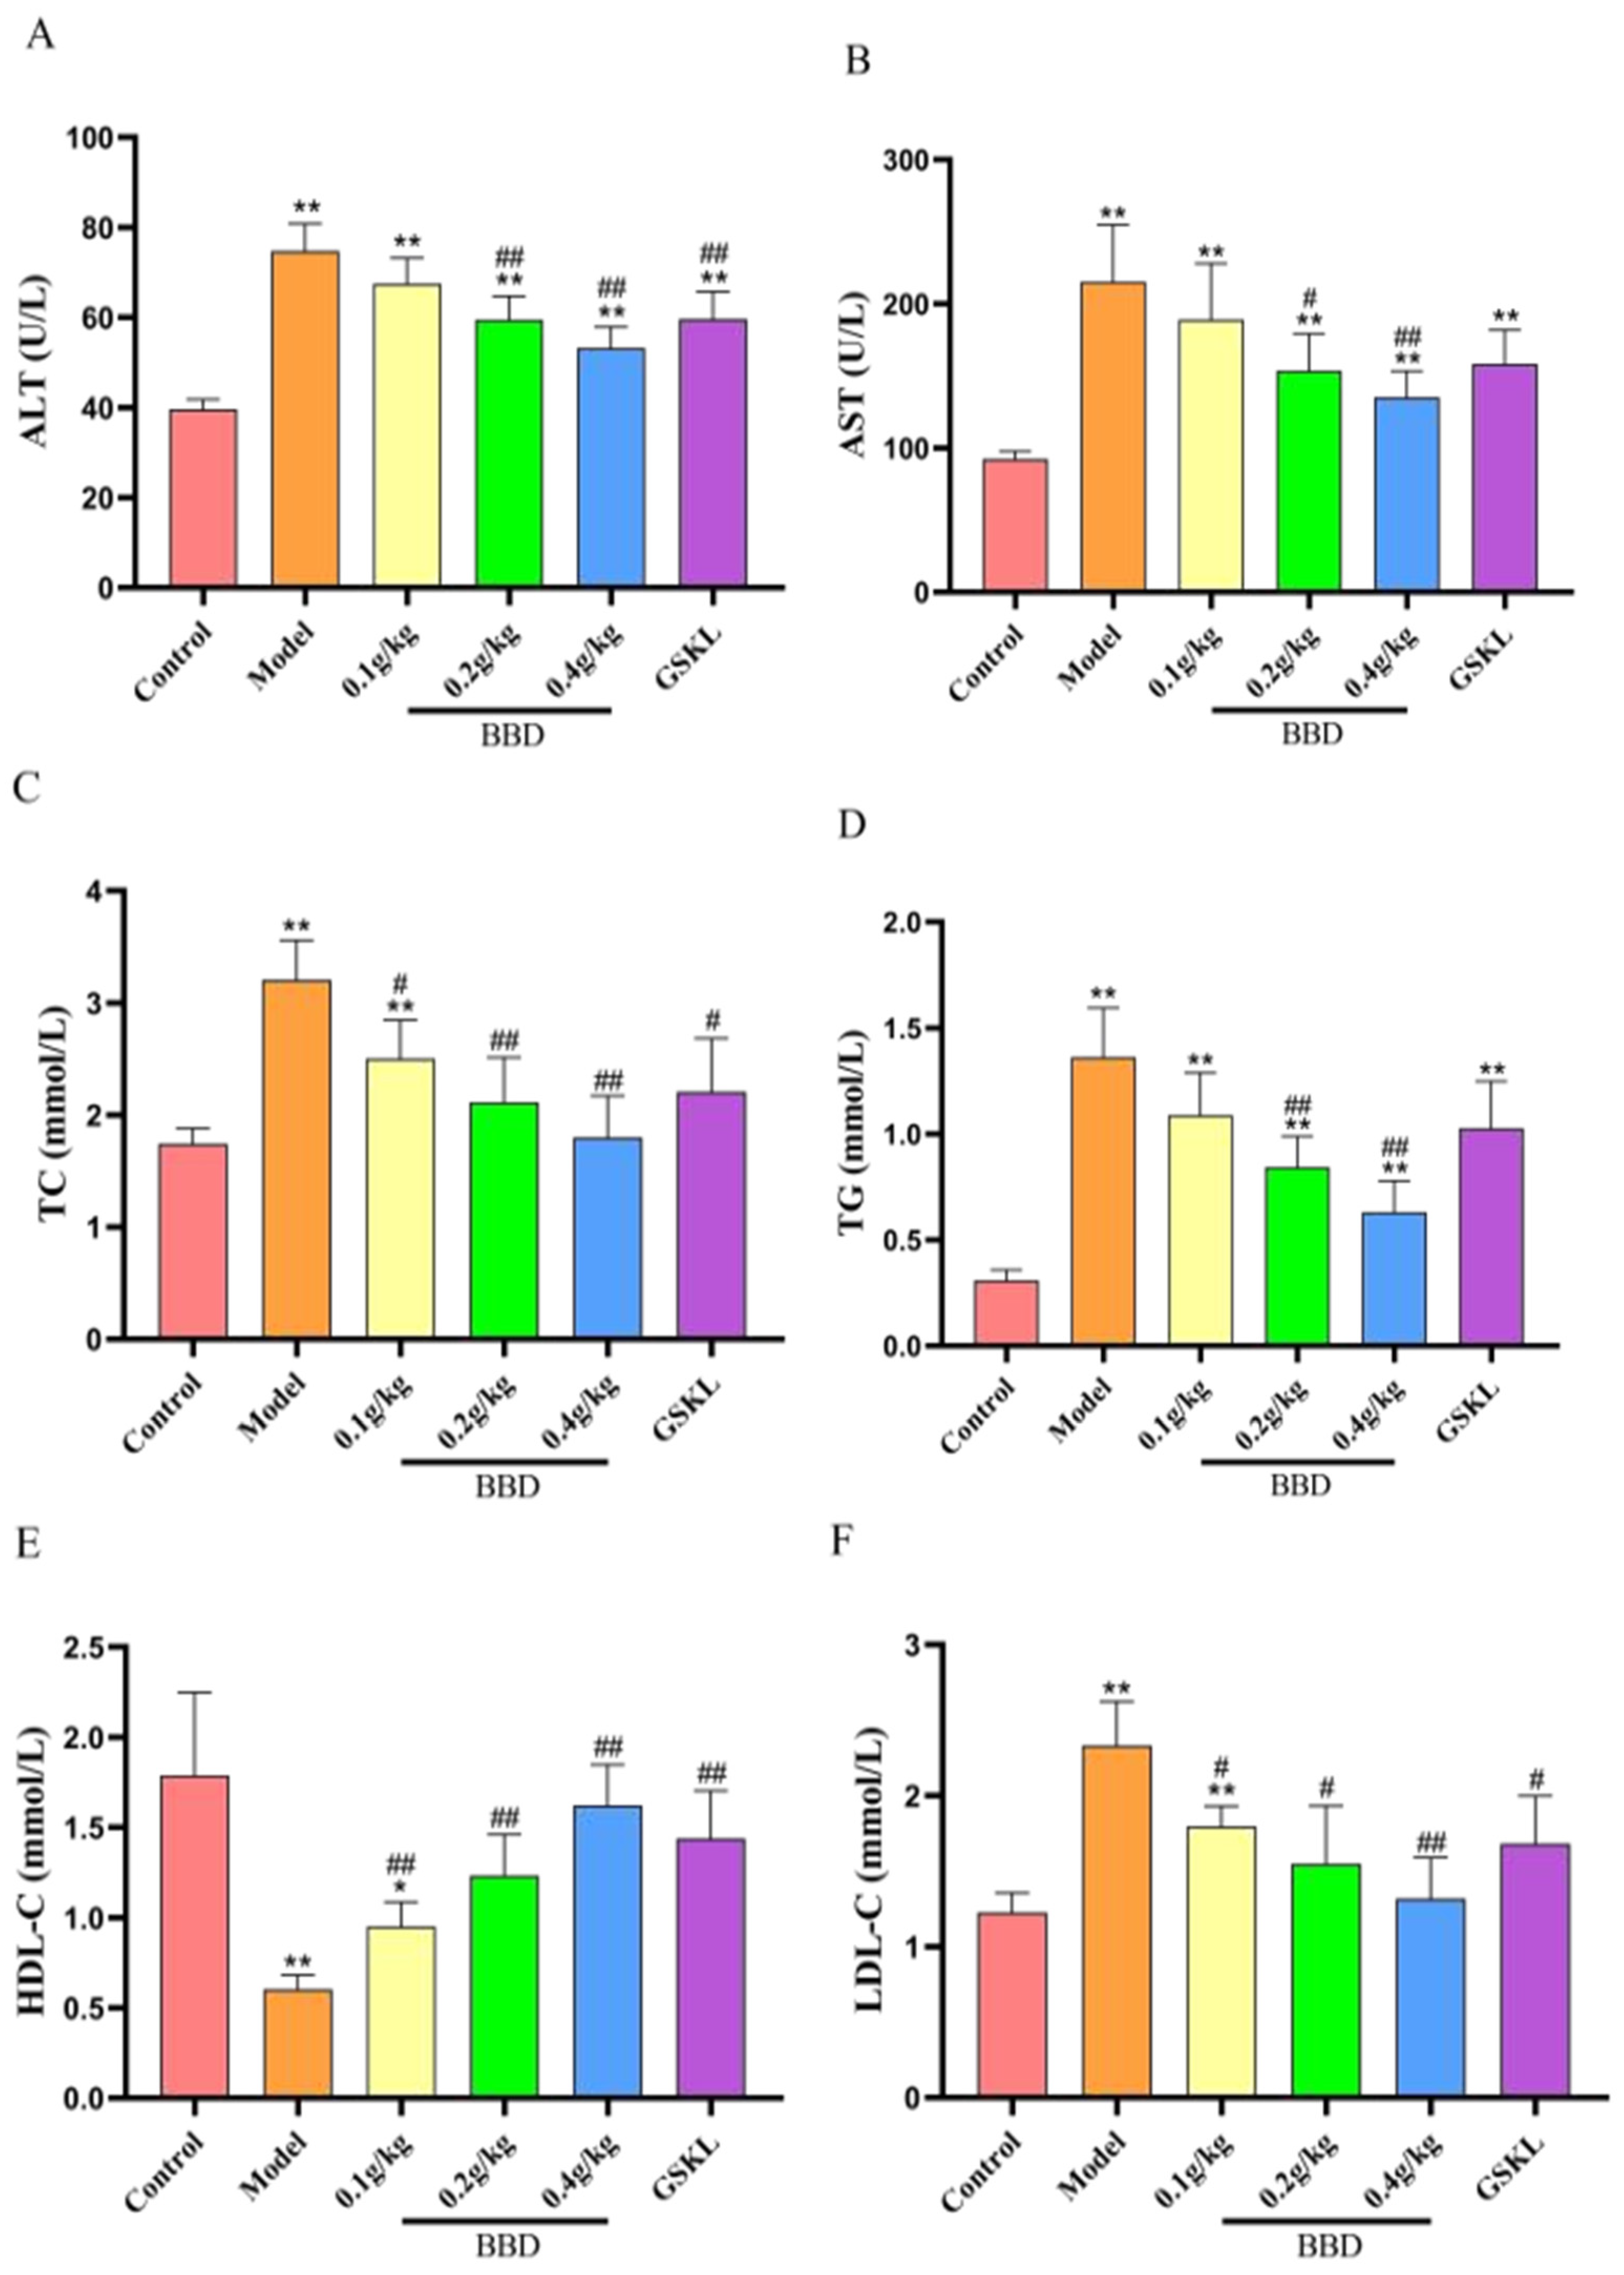
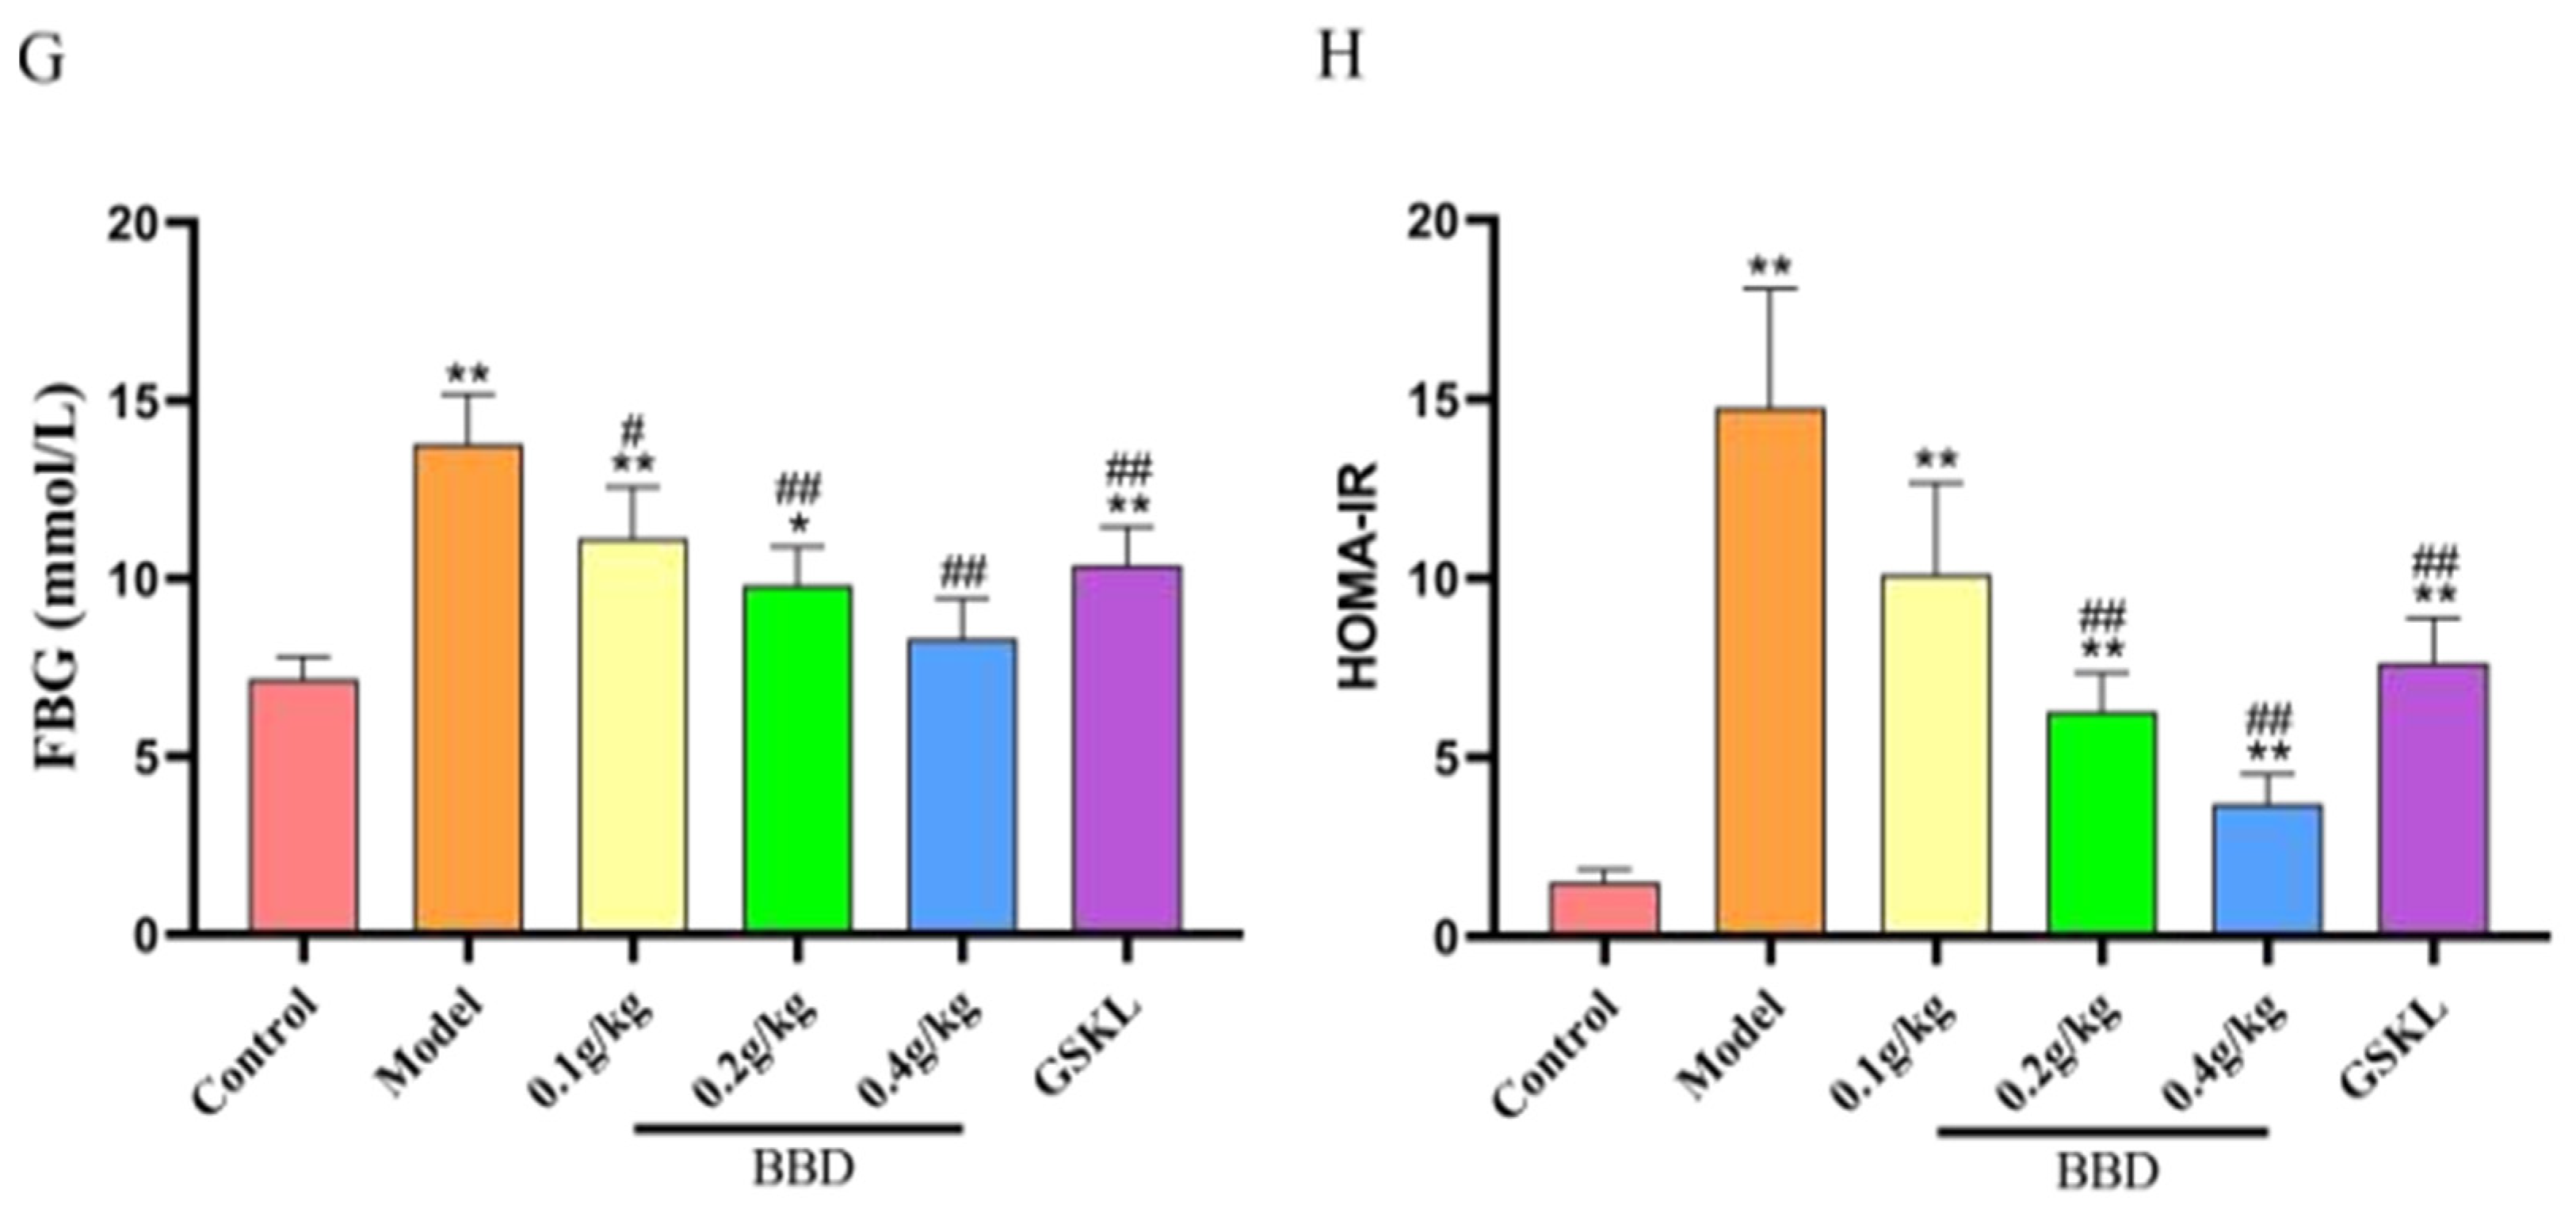
2.5. Biochemical Index Testing Results

The results showed (Figure 4) that significant changes in various biochemical indices in serum as well as insulin resistance index (HOMA-IR) were observable in all groups of rats after the different treatments.
FBG: The FBG levels were significantly higher in the model group, indicating that insulin resistance was induced by modeling in this experiment. The FBG levels decreased in all BBD dose groups compared with the model group in a dose-dependent manner, with the most significant decrease in the high-dose BBD group. There was also a significant decrease in FBG levels in the GSKL group, but it was slightly less effective compared to the high-dose BBD group.
ALT and AST: The ALT and AST levels were significantly elevated in the model group, indicating impaired liver function. These levels decreased in all BBD dose groups compared to the model group, with greater reductions observed at higher doses. The ALT and AST levels also decreased in the GSKL group, but the effect was not as pronounced as in the high-dose BBD group.
Lipid indexes (TC, TG, HDL-C, LDL-C): In the model group, the TC and TG levels were significantly elevated, HDL-C levels were reduced, and LDL-C levels were increased, indicating potential disturbances in lipid metabolism. All BBD dose groups showed varying degrees of improvement in lipid levels, with the high-dose BBD group demonstrating the most notable effects, with significant reductions in TC and TG levels, increased HDL-C levels, and decreased LDL-C levels. The GSKL group also showed some improvement in lipid levels, but the overall effect was less than that of the high-dose BBD group.
HOMA-IR: HOMA-IR was significantly elevated in the model group, indicating severe insulin resistance. All BBD treatment groups exhibited significantly reduced HOMA-IR in a dose-dependent manner, with the greatest decrease observed in the high-dose BBD group. The GSKL group also exhibited reduced HOMA-IR, but the effect was less pronounced than in the high-dose BBD group.

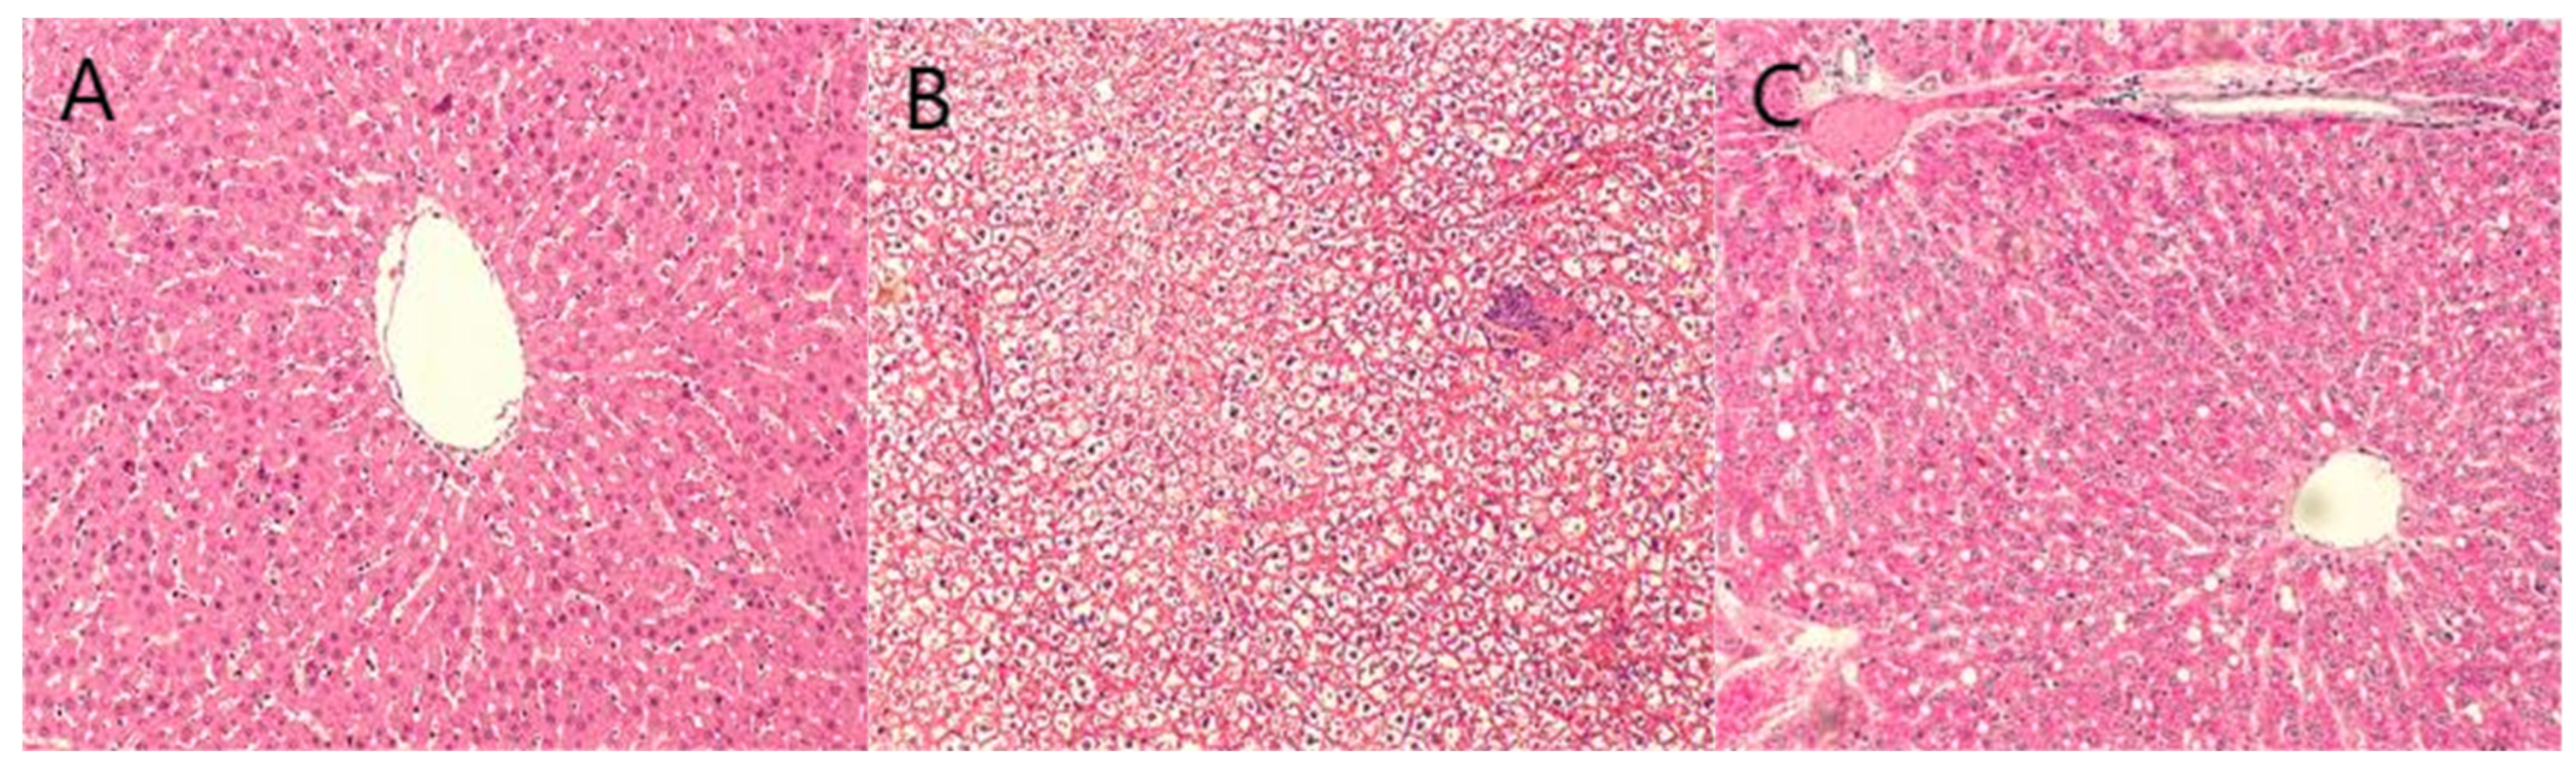
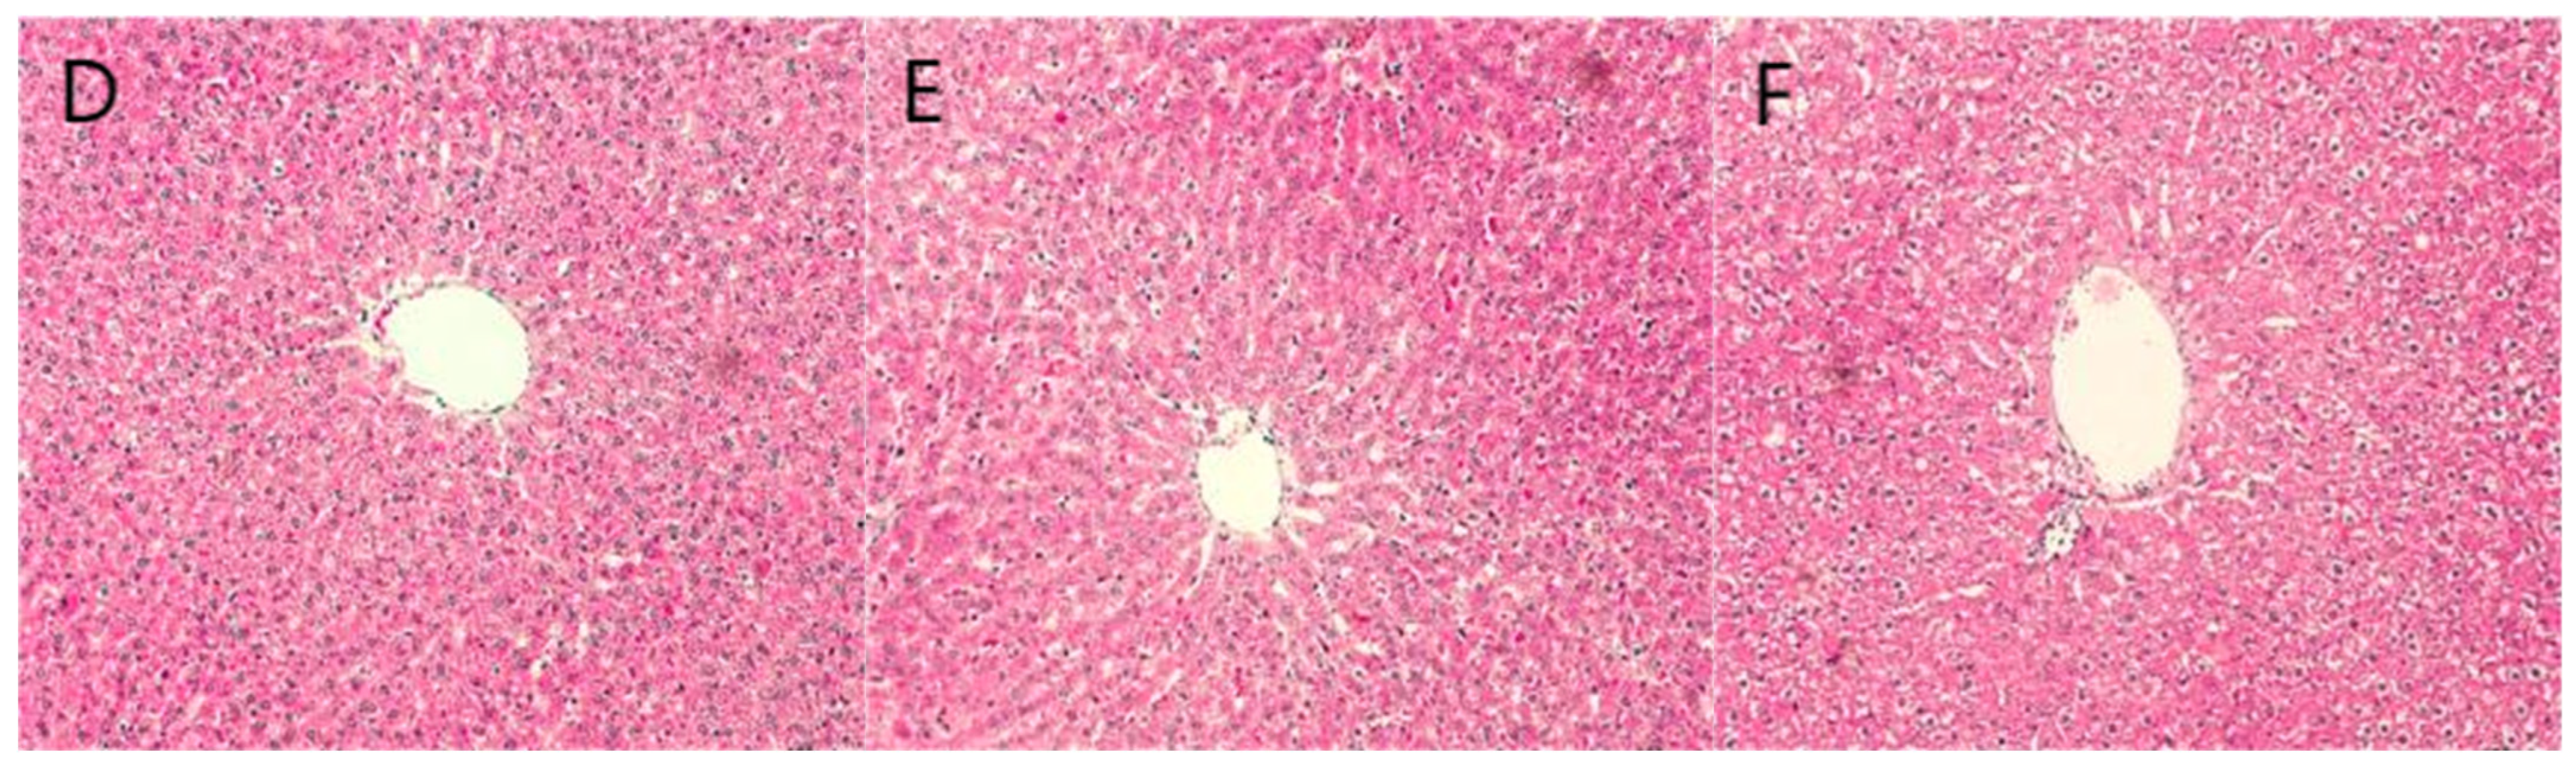
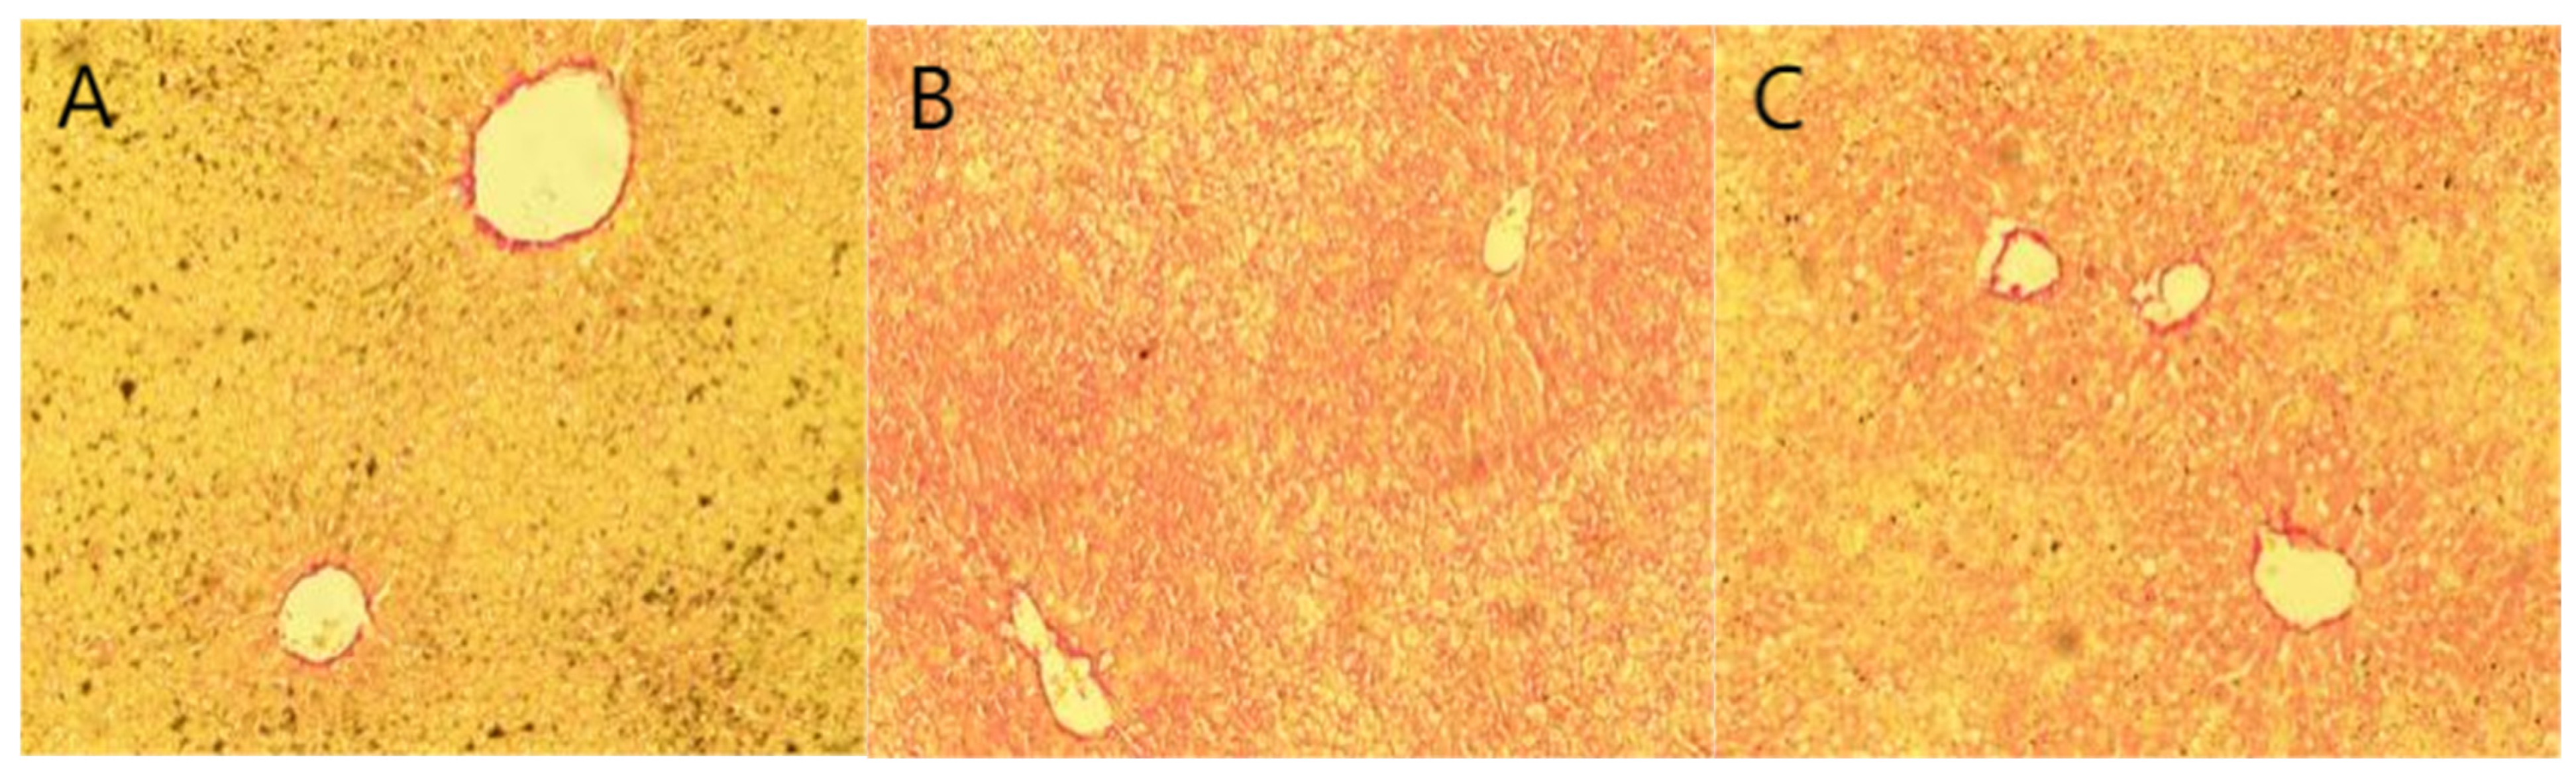
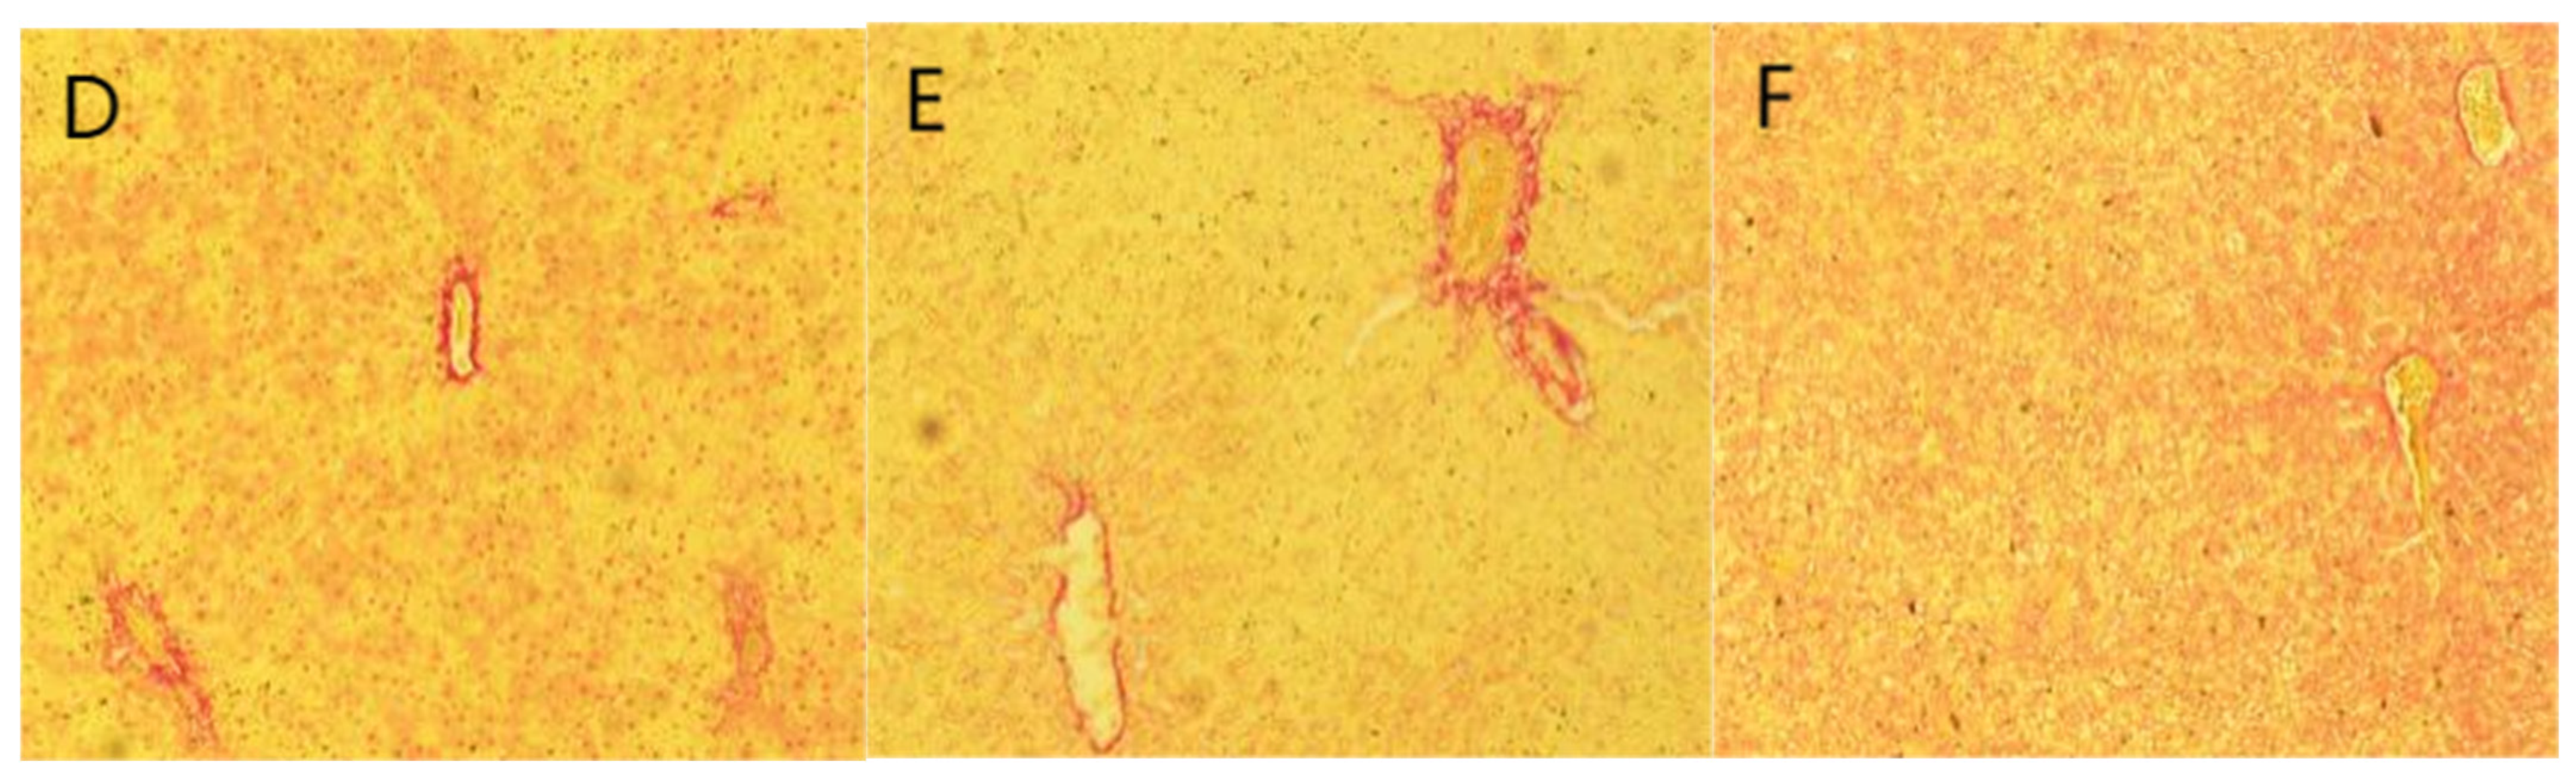
2.6. Staining Results

The HE staining (Figure 5) results showed that the liver lobule structure of the blank control group remained intact, and liver cells were arranged radially around the central vein. In contrast, the model group exhibited significant lipid droplet aggregation and neutrophil inflammation clusters, and the nuclear morphology was deformed, with some even showing nuclear condensation. In the BBD dose groups and GSKL group, the liver structure gradually tended to be normal, and the degree of steatosis was significantly reduced. The results of Oil Red O staining (Figure 6) showed that the blank control group had fewer lipid droplets in liver cells, and the degree of hepatic steatosis in the rats was lower. The liver tissue of the model group rats was highly steatotic, with lipid droplet vacuoles filling the cytoplasm and a high relative area of lipid droplets. However, in the BBD dose groups and GSKL group, the lipid droplet vacuoles and relative area were significantly reduced. The Sirius Red staining (Figure 7) results showed that the collagen fiber content in the liver of the blank control group was lower and the staining was lighter, mainly distributed in the portal area and around blood vessels, forming a fine mesh structure. In the model group, collagen deposition in the liver tissue increased significantly, the liver lobule structure was disordered, and the relative area of collagen fibers was higher. However, in the BBD dose groups and GSKL group, the degree of collagen deposition was reduced. The above three results all indicate that BBD has a good effect on the treatment of MASH.

2.7. Metabolomics

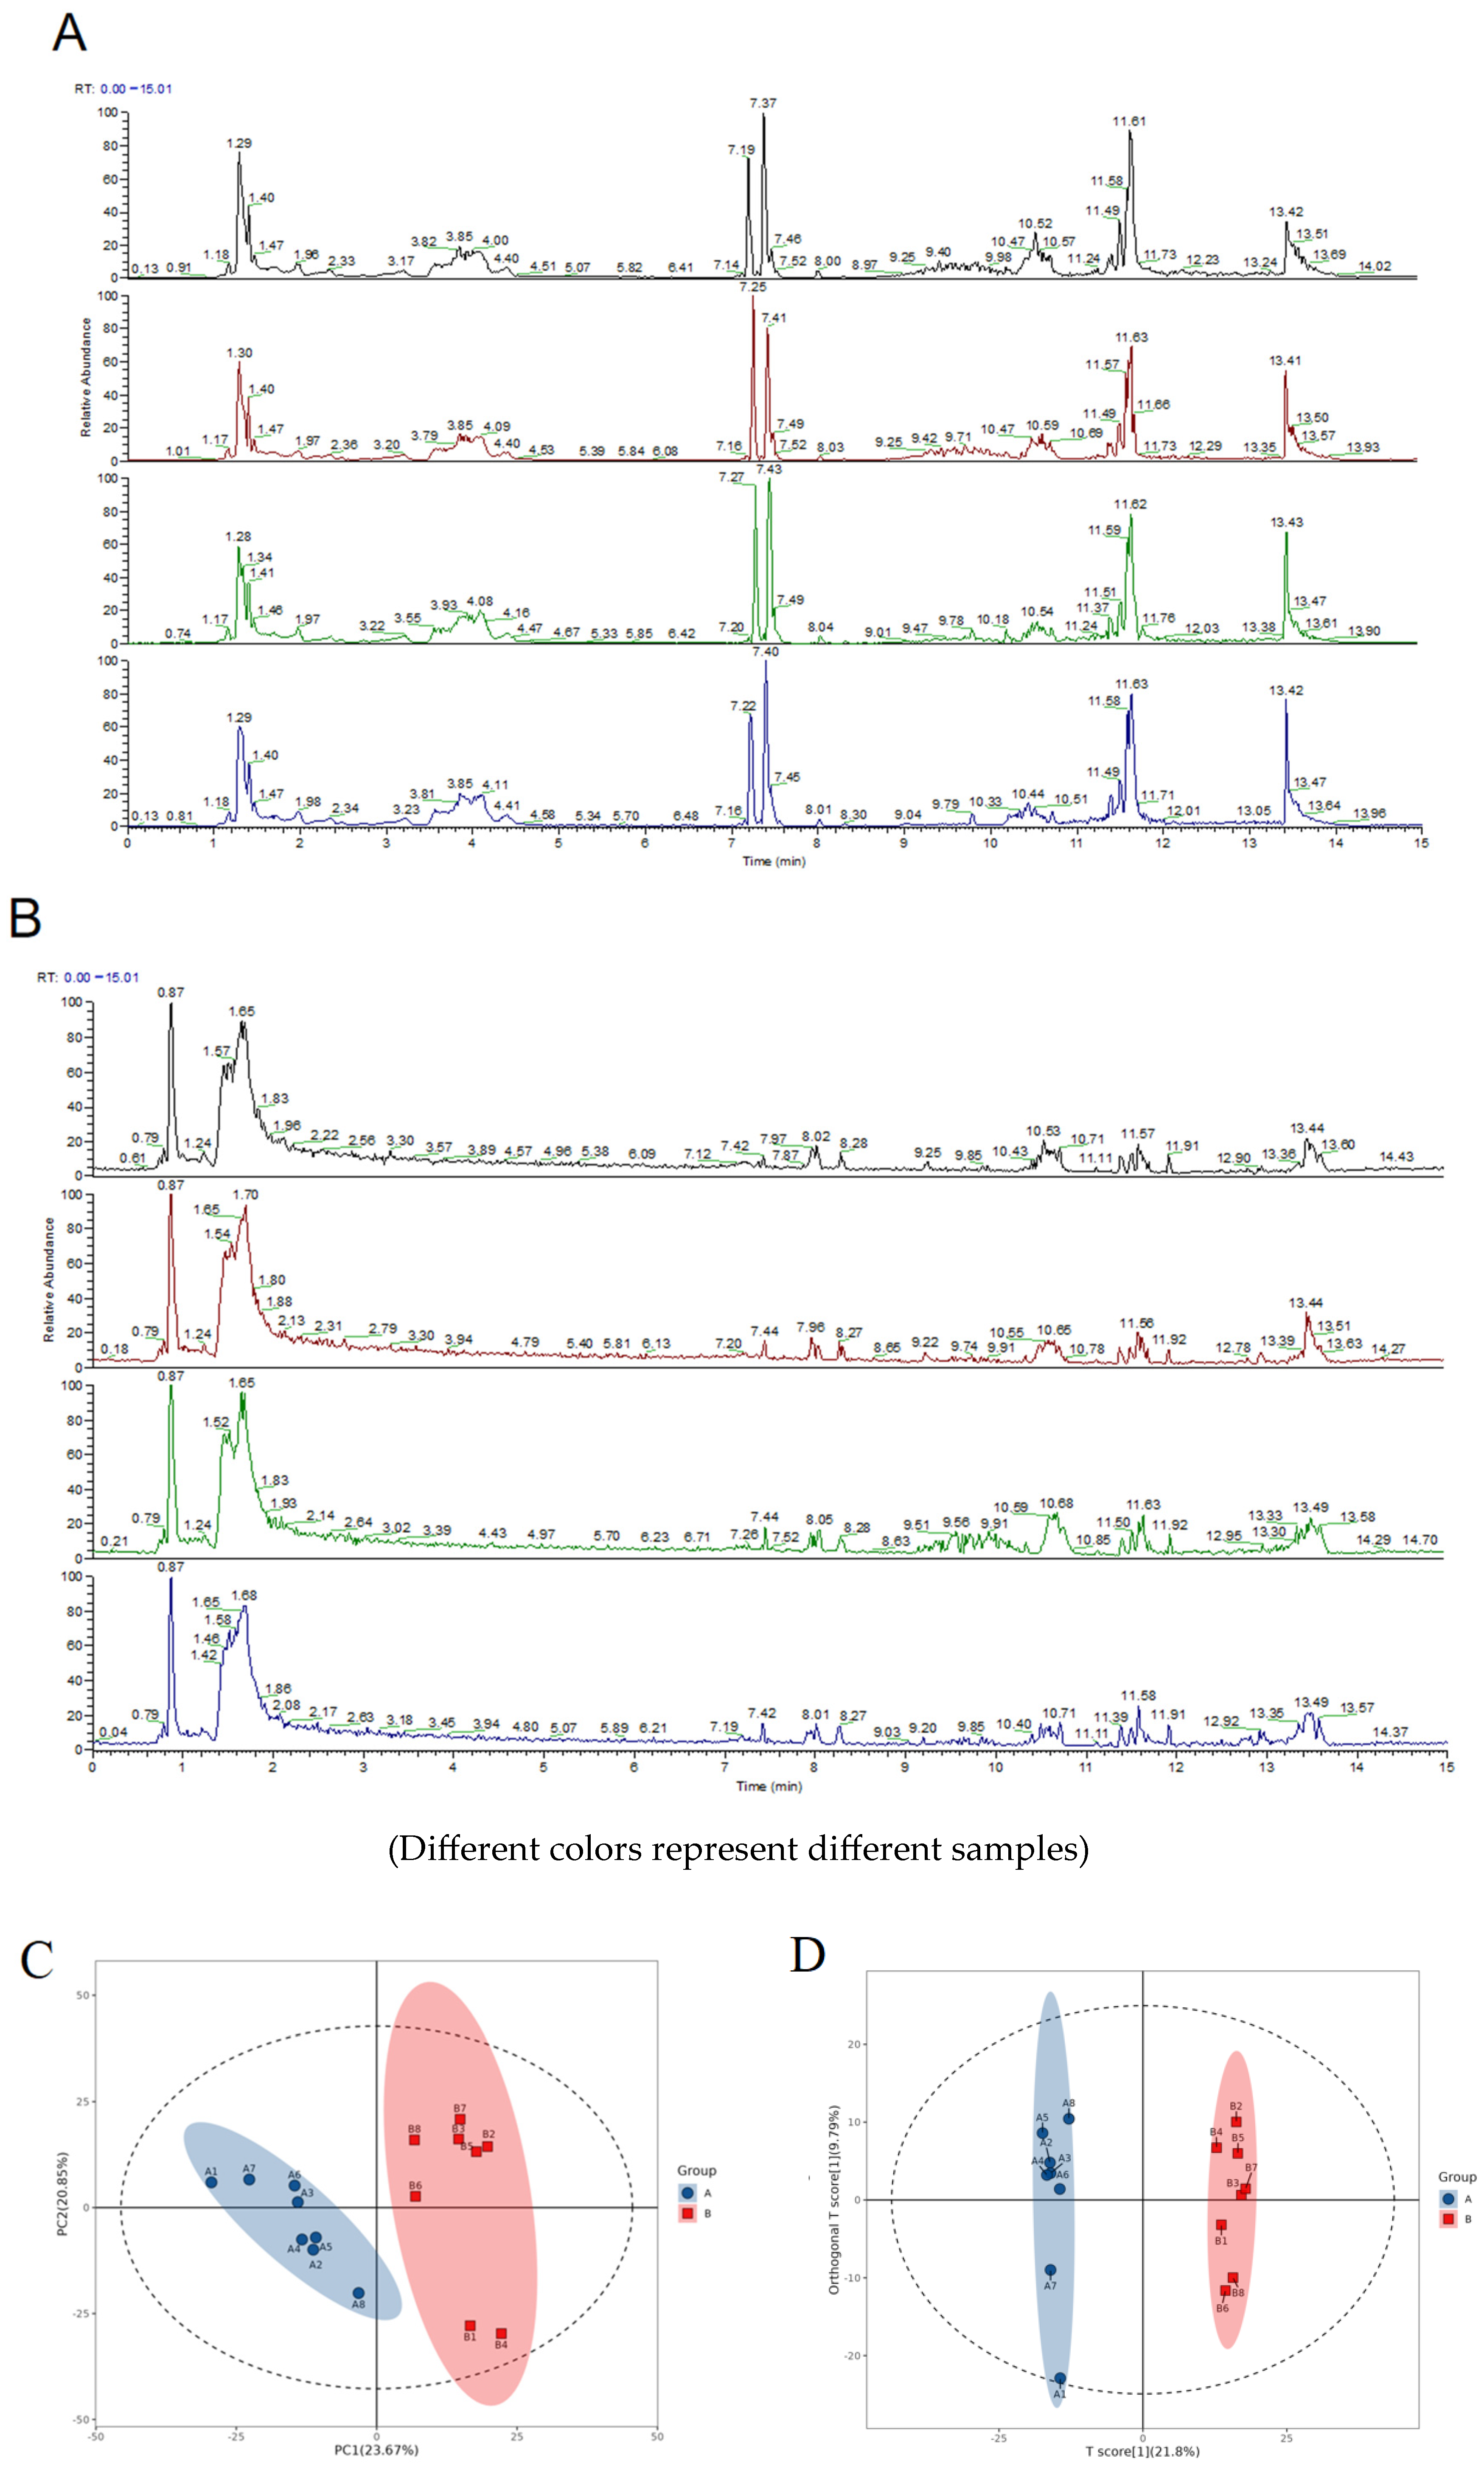
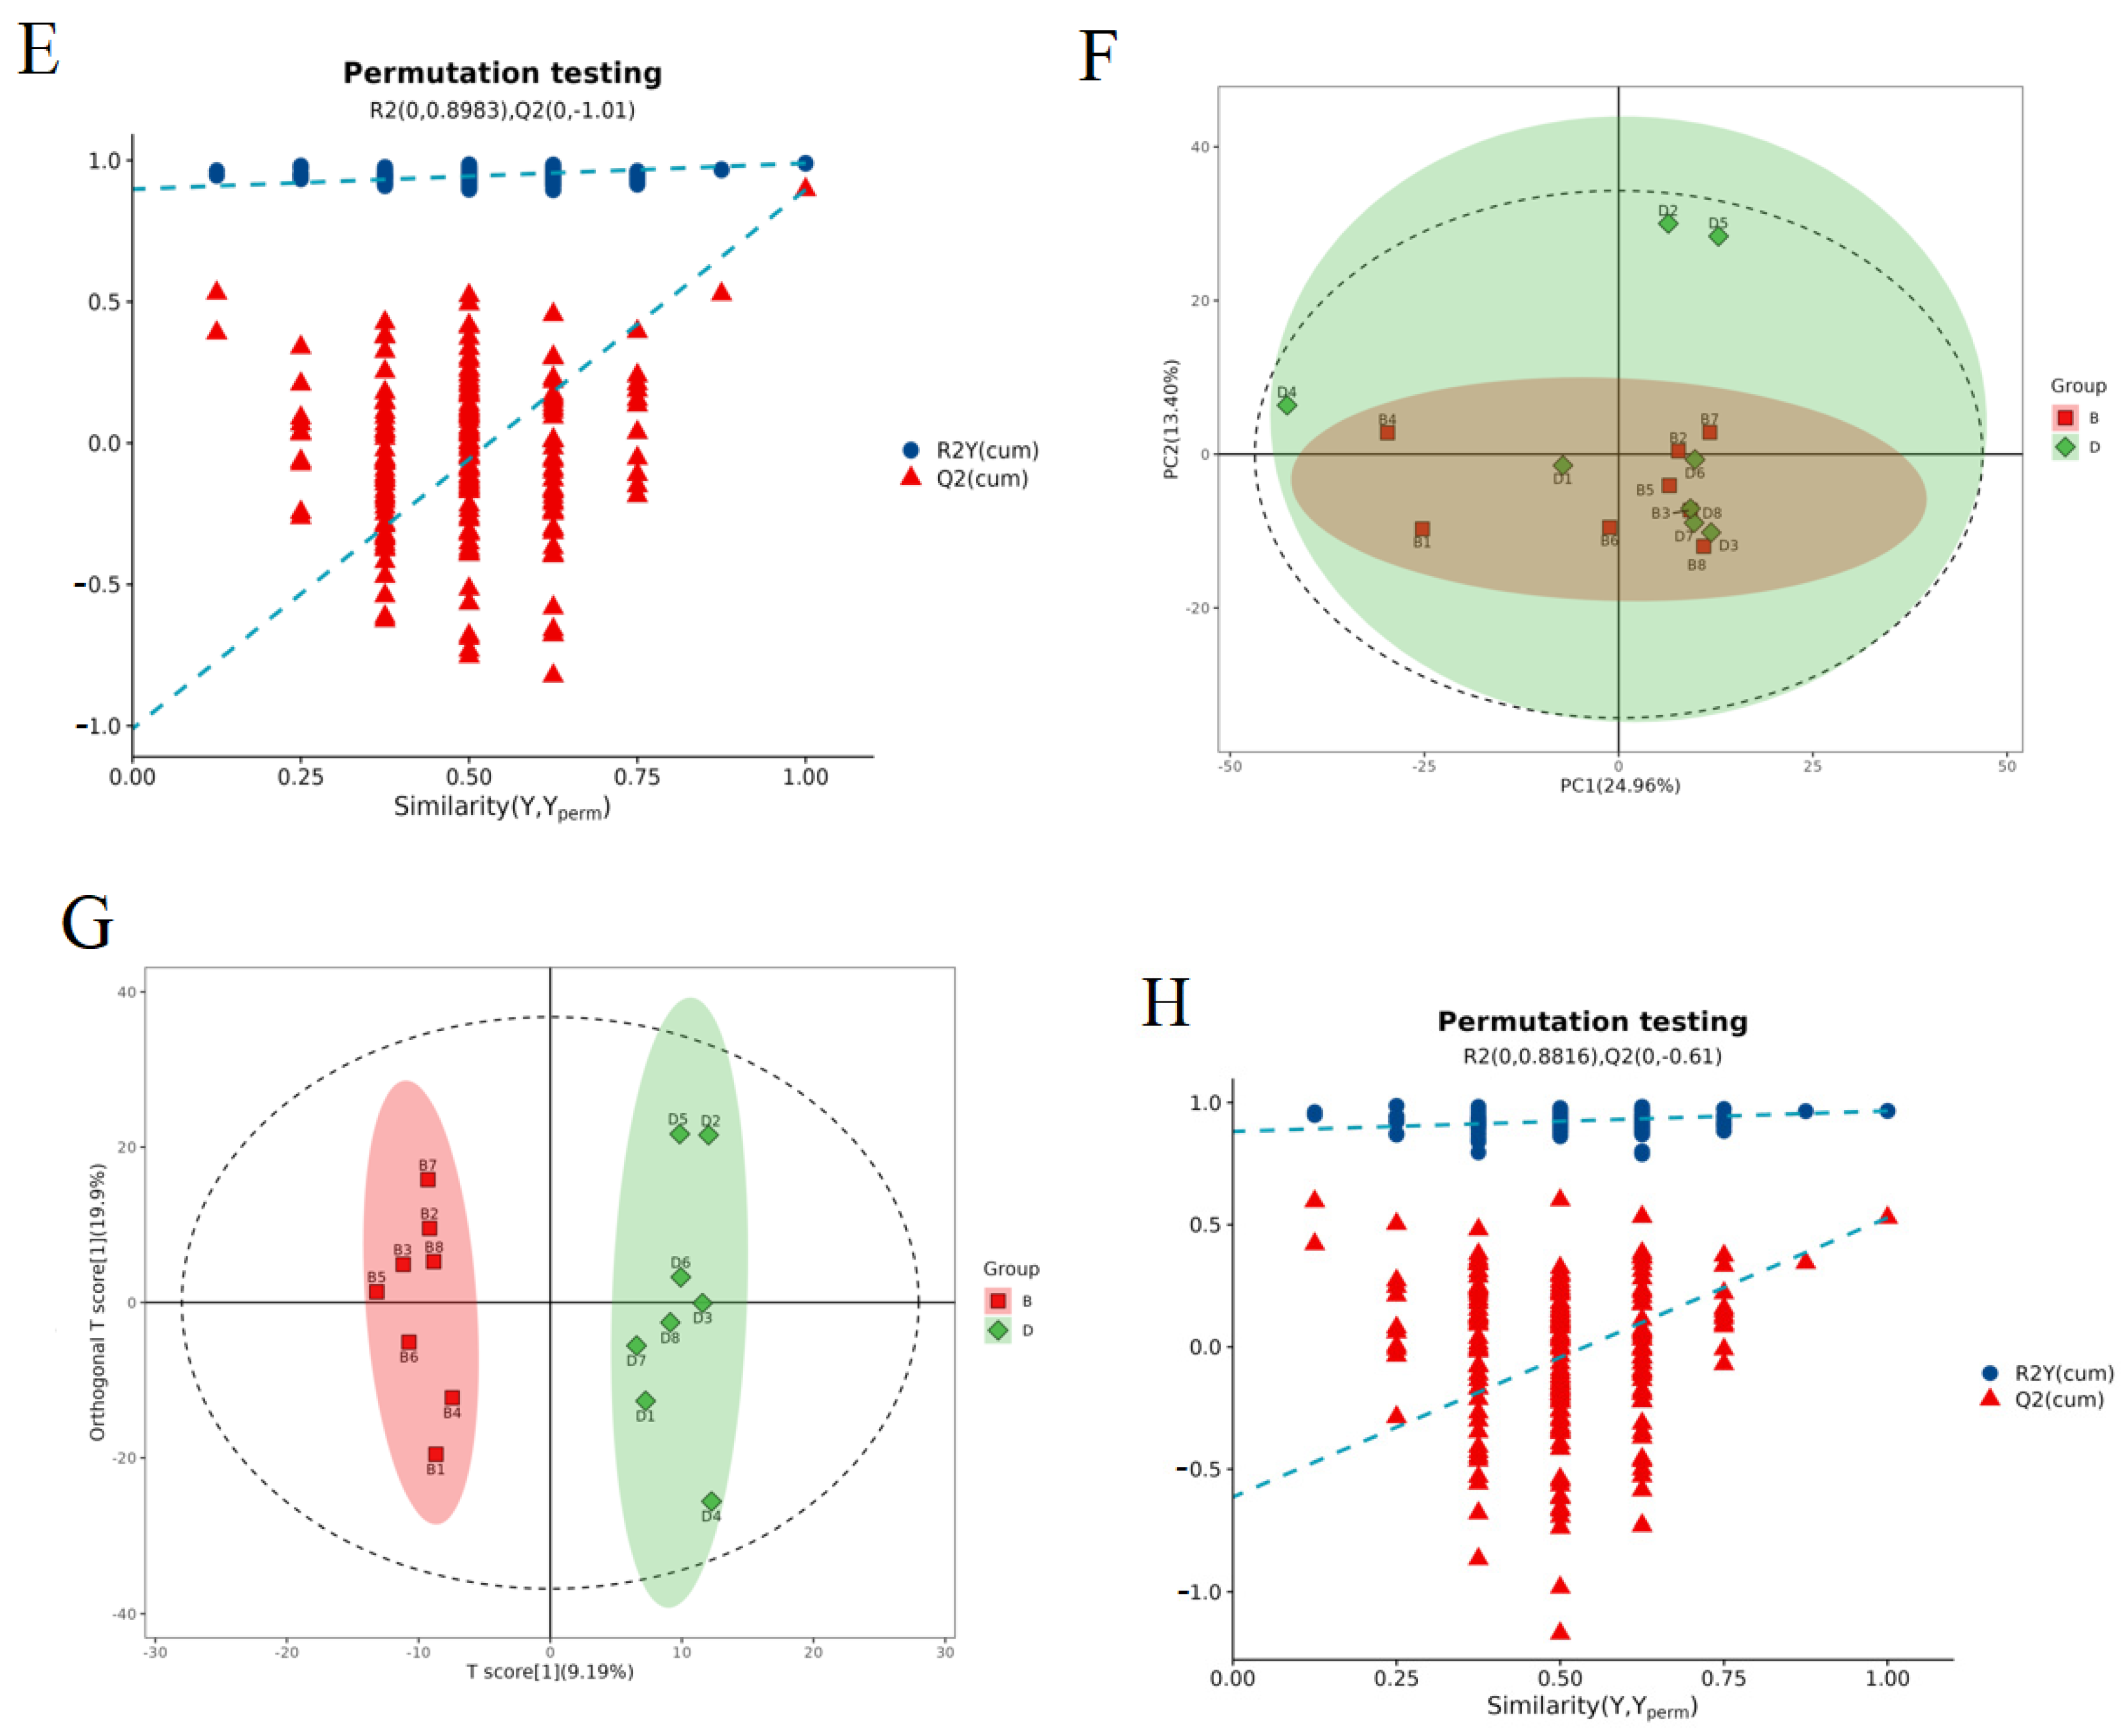
2.7.1. Evaluation of the Quality of the Experiments

Two strategies were used to assess and analyze the systematic stability of the experiments in this project: comparing the mass spectral total ion flow plots of the QC samples, and performing multivariate statistical analyses of the overall samples.
The peak mass spectra of the QC samples in positive and negative ion detection modes are shown in Figure 8A,B. A comparative analysis showed that the response intensities and retention times of the chromatographic peaks exhibited a high degree of consistency, which fully demonstrated that the variation brought about by the instrumental error was relatively small throughout the whole experimental process, thus ensuring the high reliability of the acquired data.
Multivariate statistical analysis chart: As shown in Figure 8C–H, SIMCA-P 14.1 (Umetrics, Umea, Sweden) was used for the PCA, Partial Least Squares Discriminant Analysis (OPLS-DA), and OPLS-DA permutation tests to evaluate the accuracy of the model. It can be seen that, in each comparison group, the intercept of the Q2 regression line in the OPLS-DA permutation test is less than 0. At the same time, as shown in Table 4, R2Y and Q2 are greater than 0.5 and close to 1. This indicates that the OPLS-DA model established based on the experimental data did not experience overfitting and is very reliable.

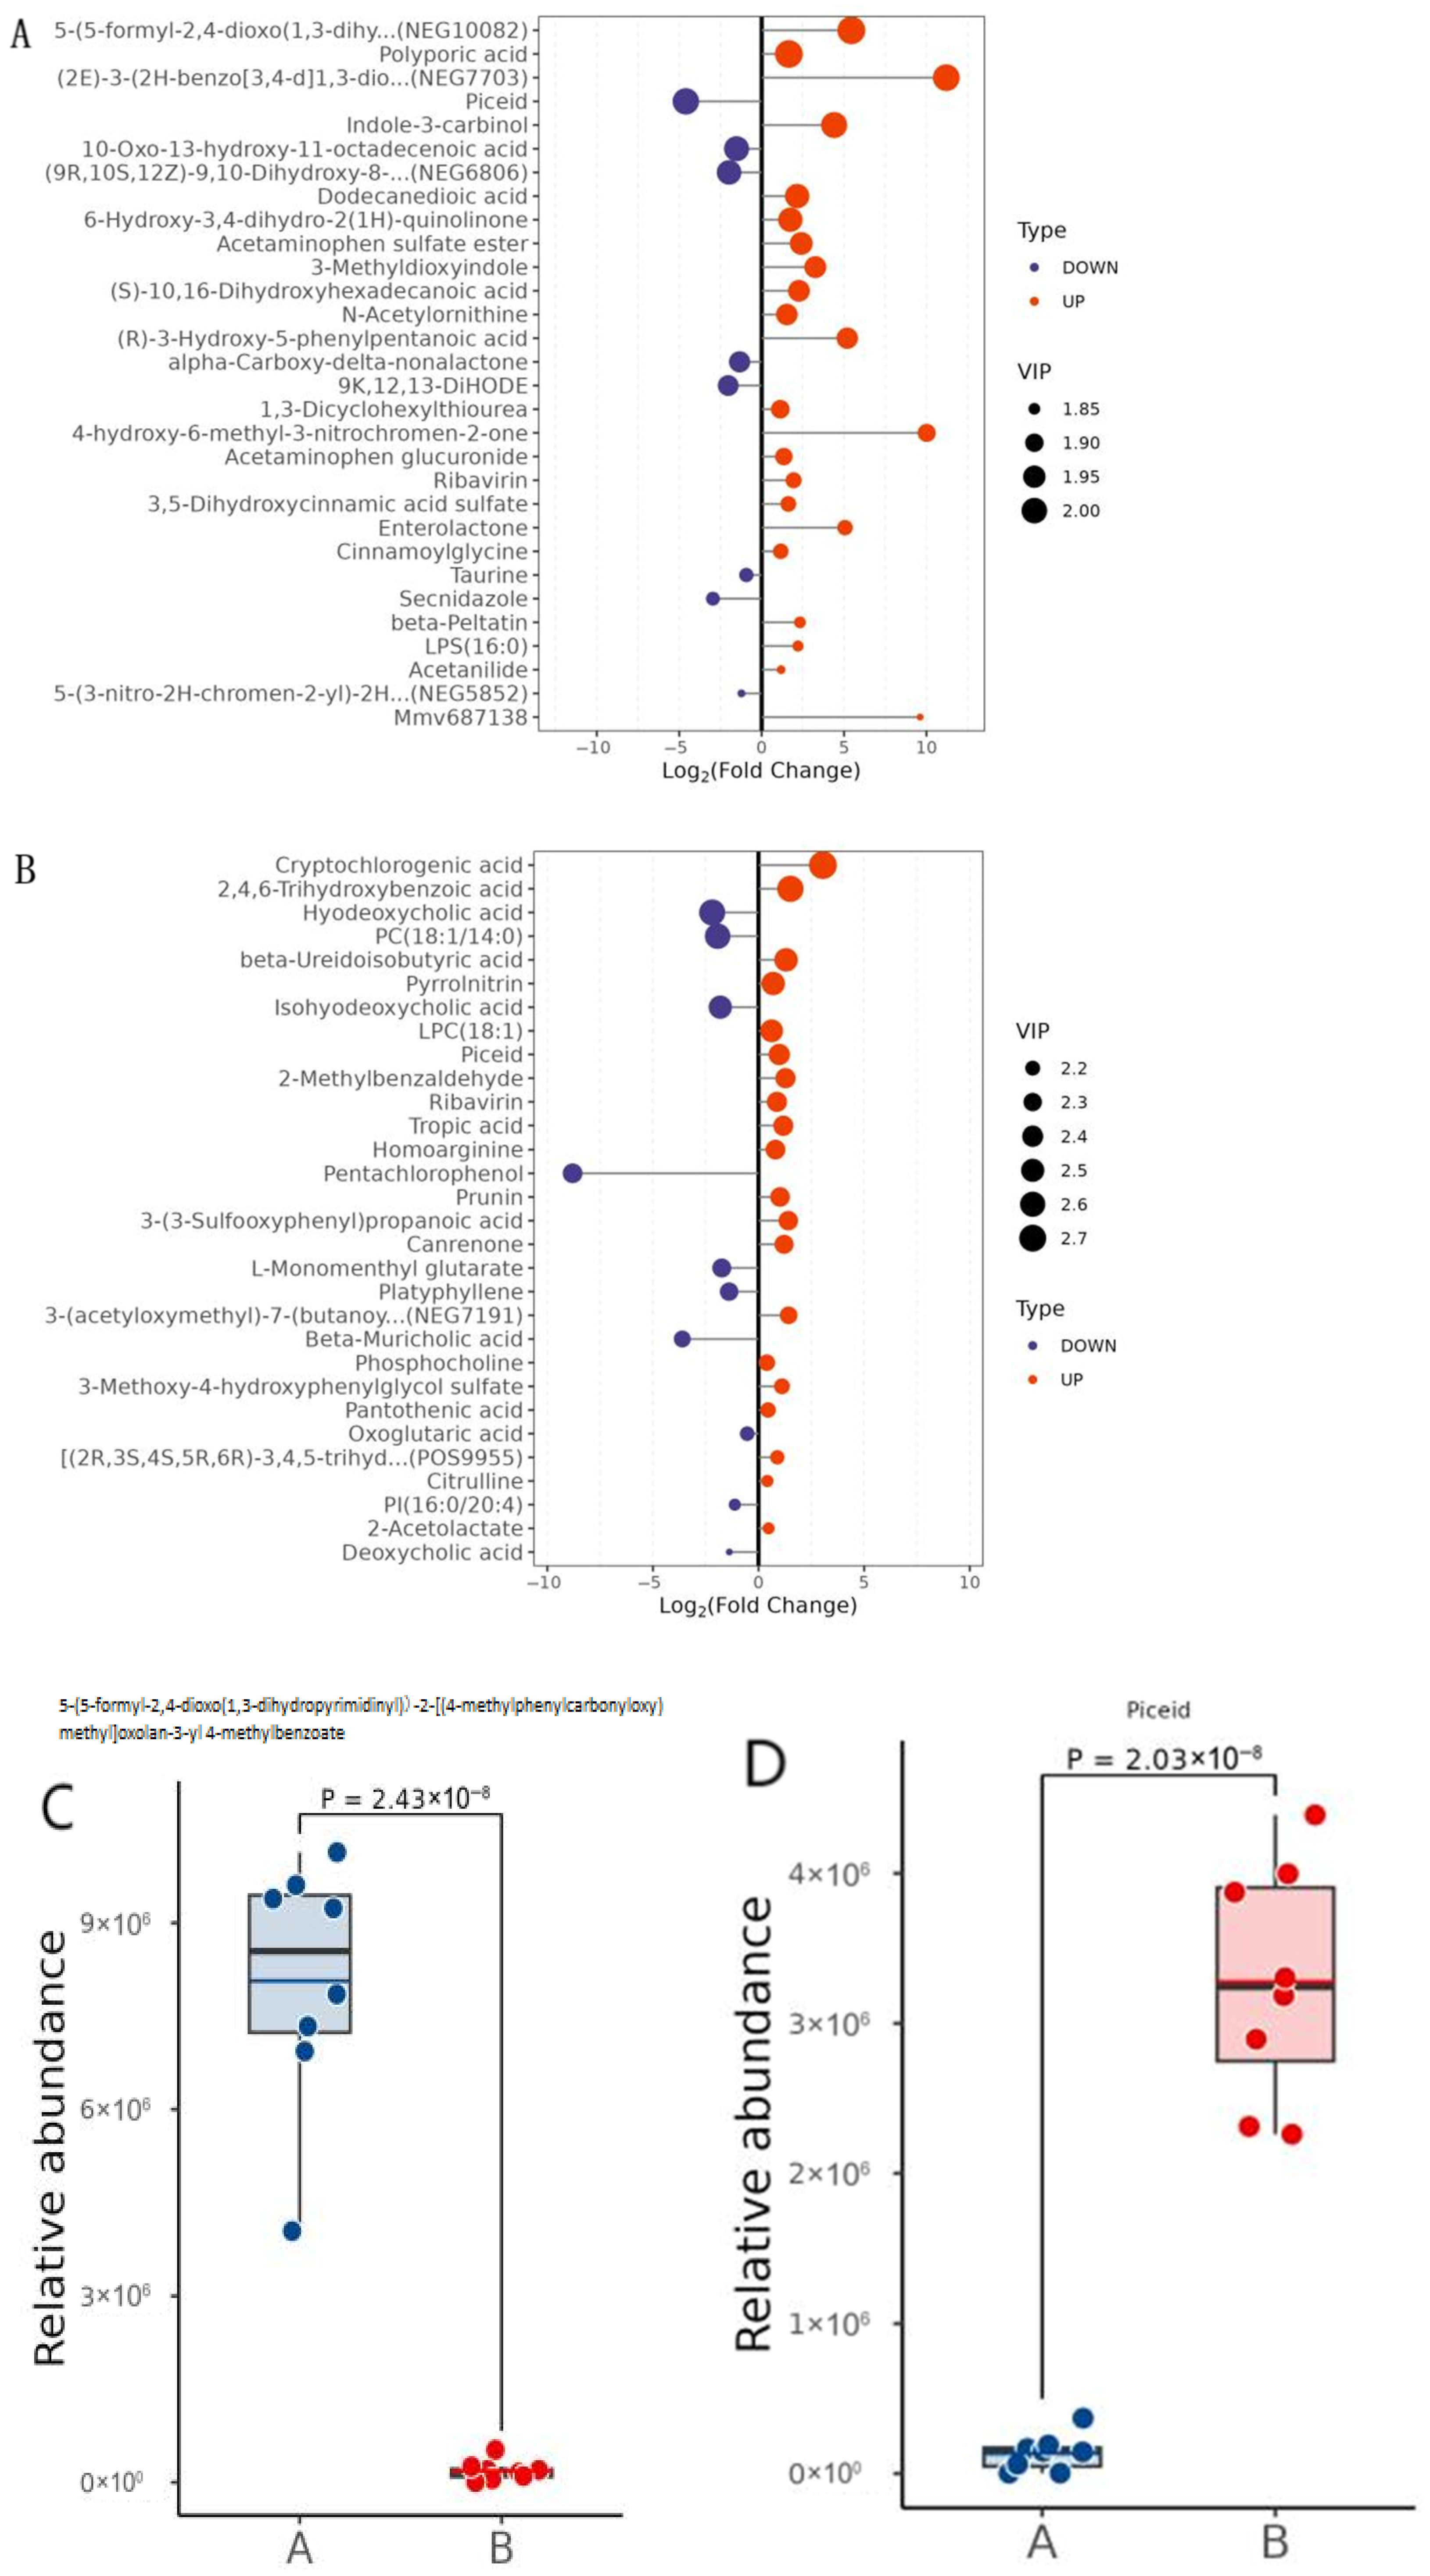
2.7.2. Significantly Different Metabolite Statistics

Based on the OPLS-DA model, we used Variable Importance in Projection (VIP) to evaluate the influence and explanatory power of the expression patterns of each metabolite on sample classification and discrimination, in order to discover differential metabolites with practical biological significance. By setting VIP > 1 as the preliminary screening criterion, differential metabolites between groups were identified. Univariate statistical analysis was then used to further confirm whether these metabolites exhibited significant differences between groups. Metabolites selected based on a VIP value > 1 and p-value < 0.05 are considered to have significant differences. In addition, FC ≥ 1 indicates the upregulation of metabolites, while an FC value < 1 indicates the downregulation of metabolites.
By integrating data between groups, 417 significantly different metabolites were screened out by us in the positive and negative ion mode when comparing groups A and B, of which 200 metabolite concentrations were upregulated and 217 were downregulated. A total of 118 significantly different metabolites were identified in both positive and negative ion modes in the B vs. D comparisons, with 34 metabolite concentrations upregulated and 84 downregulated. In this experiment, metabolites with VIP > 1.0 and 0.05 < p < 0.1, i.e., metabolites with differences, were not examined and therefore were not screened, and we only analyzed and discussed significantly different metabolites.

2.7.3. Differential Metabolite Significance Analysis

Figure 9A,B illustrate some of the comparison group’s differential metabolites of higher importance, with the logarithmic transformation of FC as horizontal coordinates and the metabolites as vertical coordinates. The blue and red dots on the left and right sides represent the downregulated and upregulated differential metabolites, respectively. The size of each dot corresponds to the VIP value: larger dots indicate higher VIP values, signifying greater importance of the variable. As can be seen from the figure, in group A vs. B, 5-(5-formyl-2,4-dioxo(1,3-dihydropyrimidinyl))-2-[(4-methylphenylcarbonyloxy)methyl]oxolan-3-yl 4-methylbenzoate (NEG10082) and Piceid are the most important up- and downregulated significantly different metabolites, respectively; cryptochlorogenic acid and hyodeoxycholic acid (HDCA) are the most important up- and downregulated significantly different metabolites, respectively, in group B vs. D.

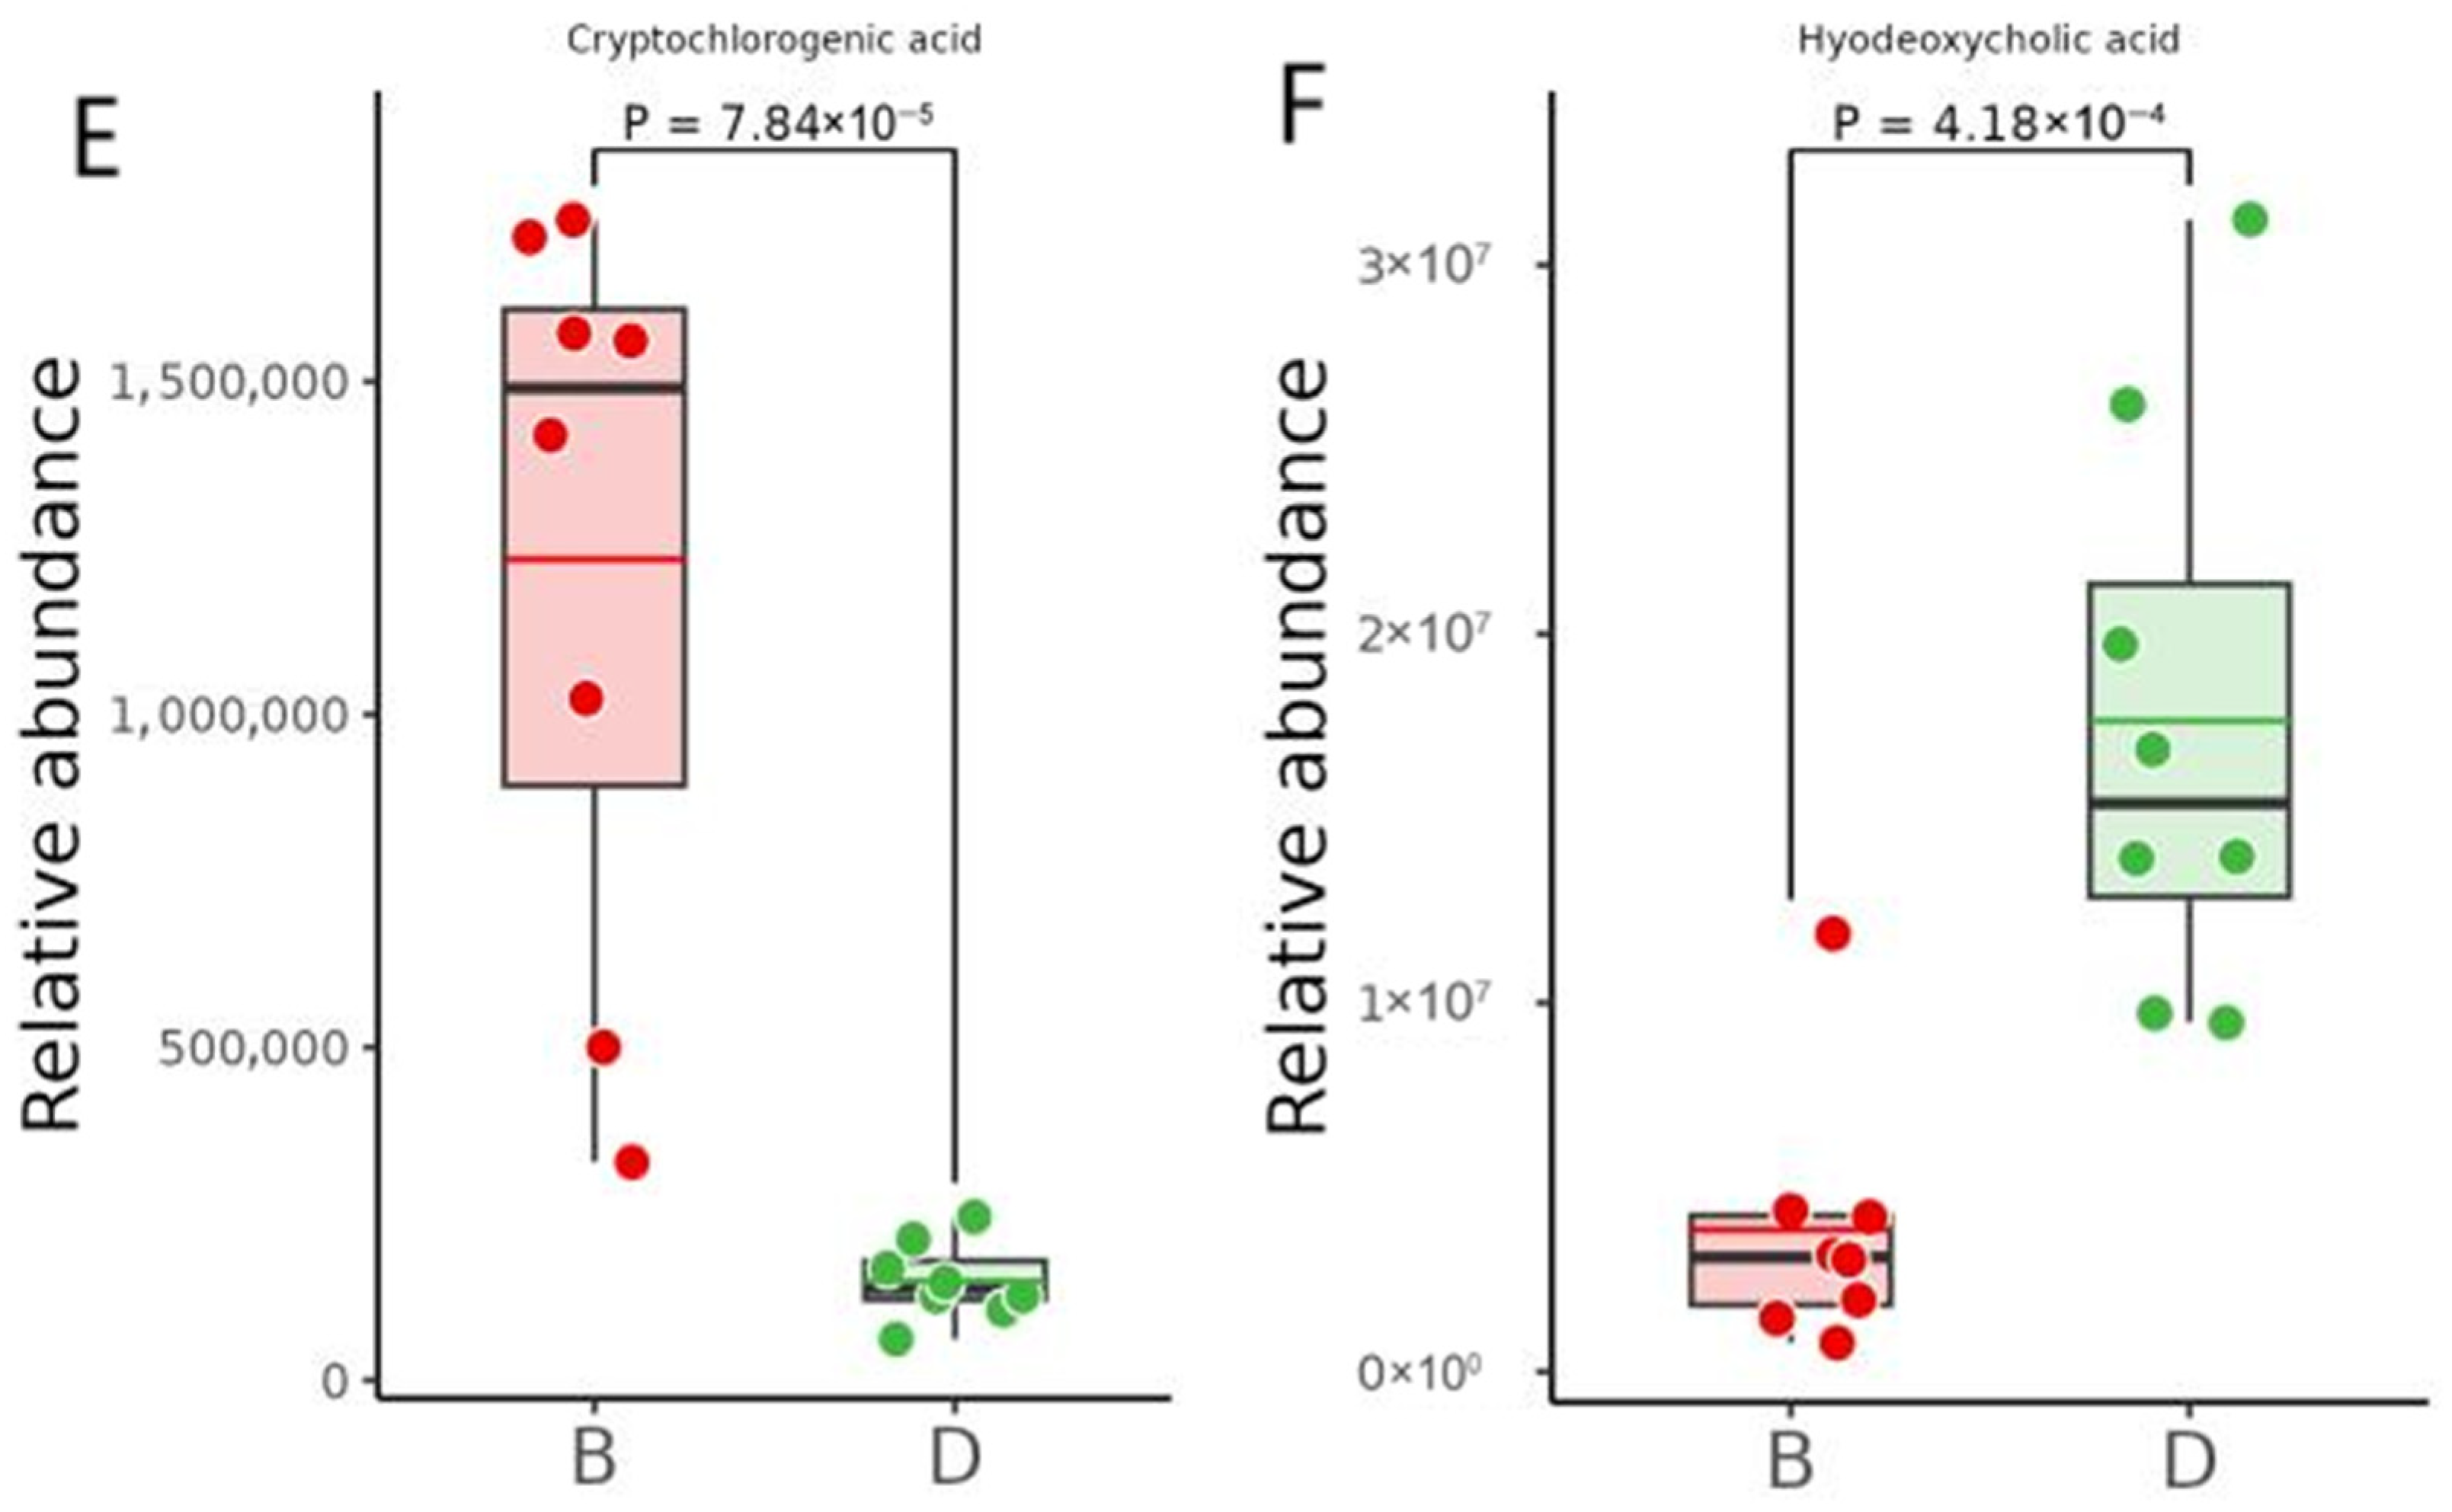
2.7.4. Differential Metabolite Abundance Analysis

Figure 9C–F show the average expression of the dithered dot plots of the four significantly different metabolites in the two groups, with the horizontal coordinates being the two groups and the vertical coordinates being the relative expression. The significance in the graph was ascertained using the Student t-test. The results showed that the expression of the four metabolites differed significantly between the two groups. By looking at the average expression of each metabolite in the two groups, it was found that NEG10082 was downregulated and Piceid was upregulated in the model group after successful modeling. Cryptochlorogenic acid was downregulated and hyodeoxycholic acid was upregulated after medium-dose BBD treatment.

2.8. Metabolomic Bioinformatics Analysis
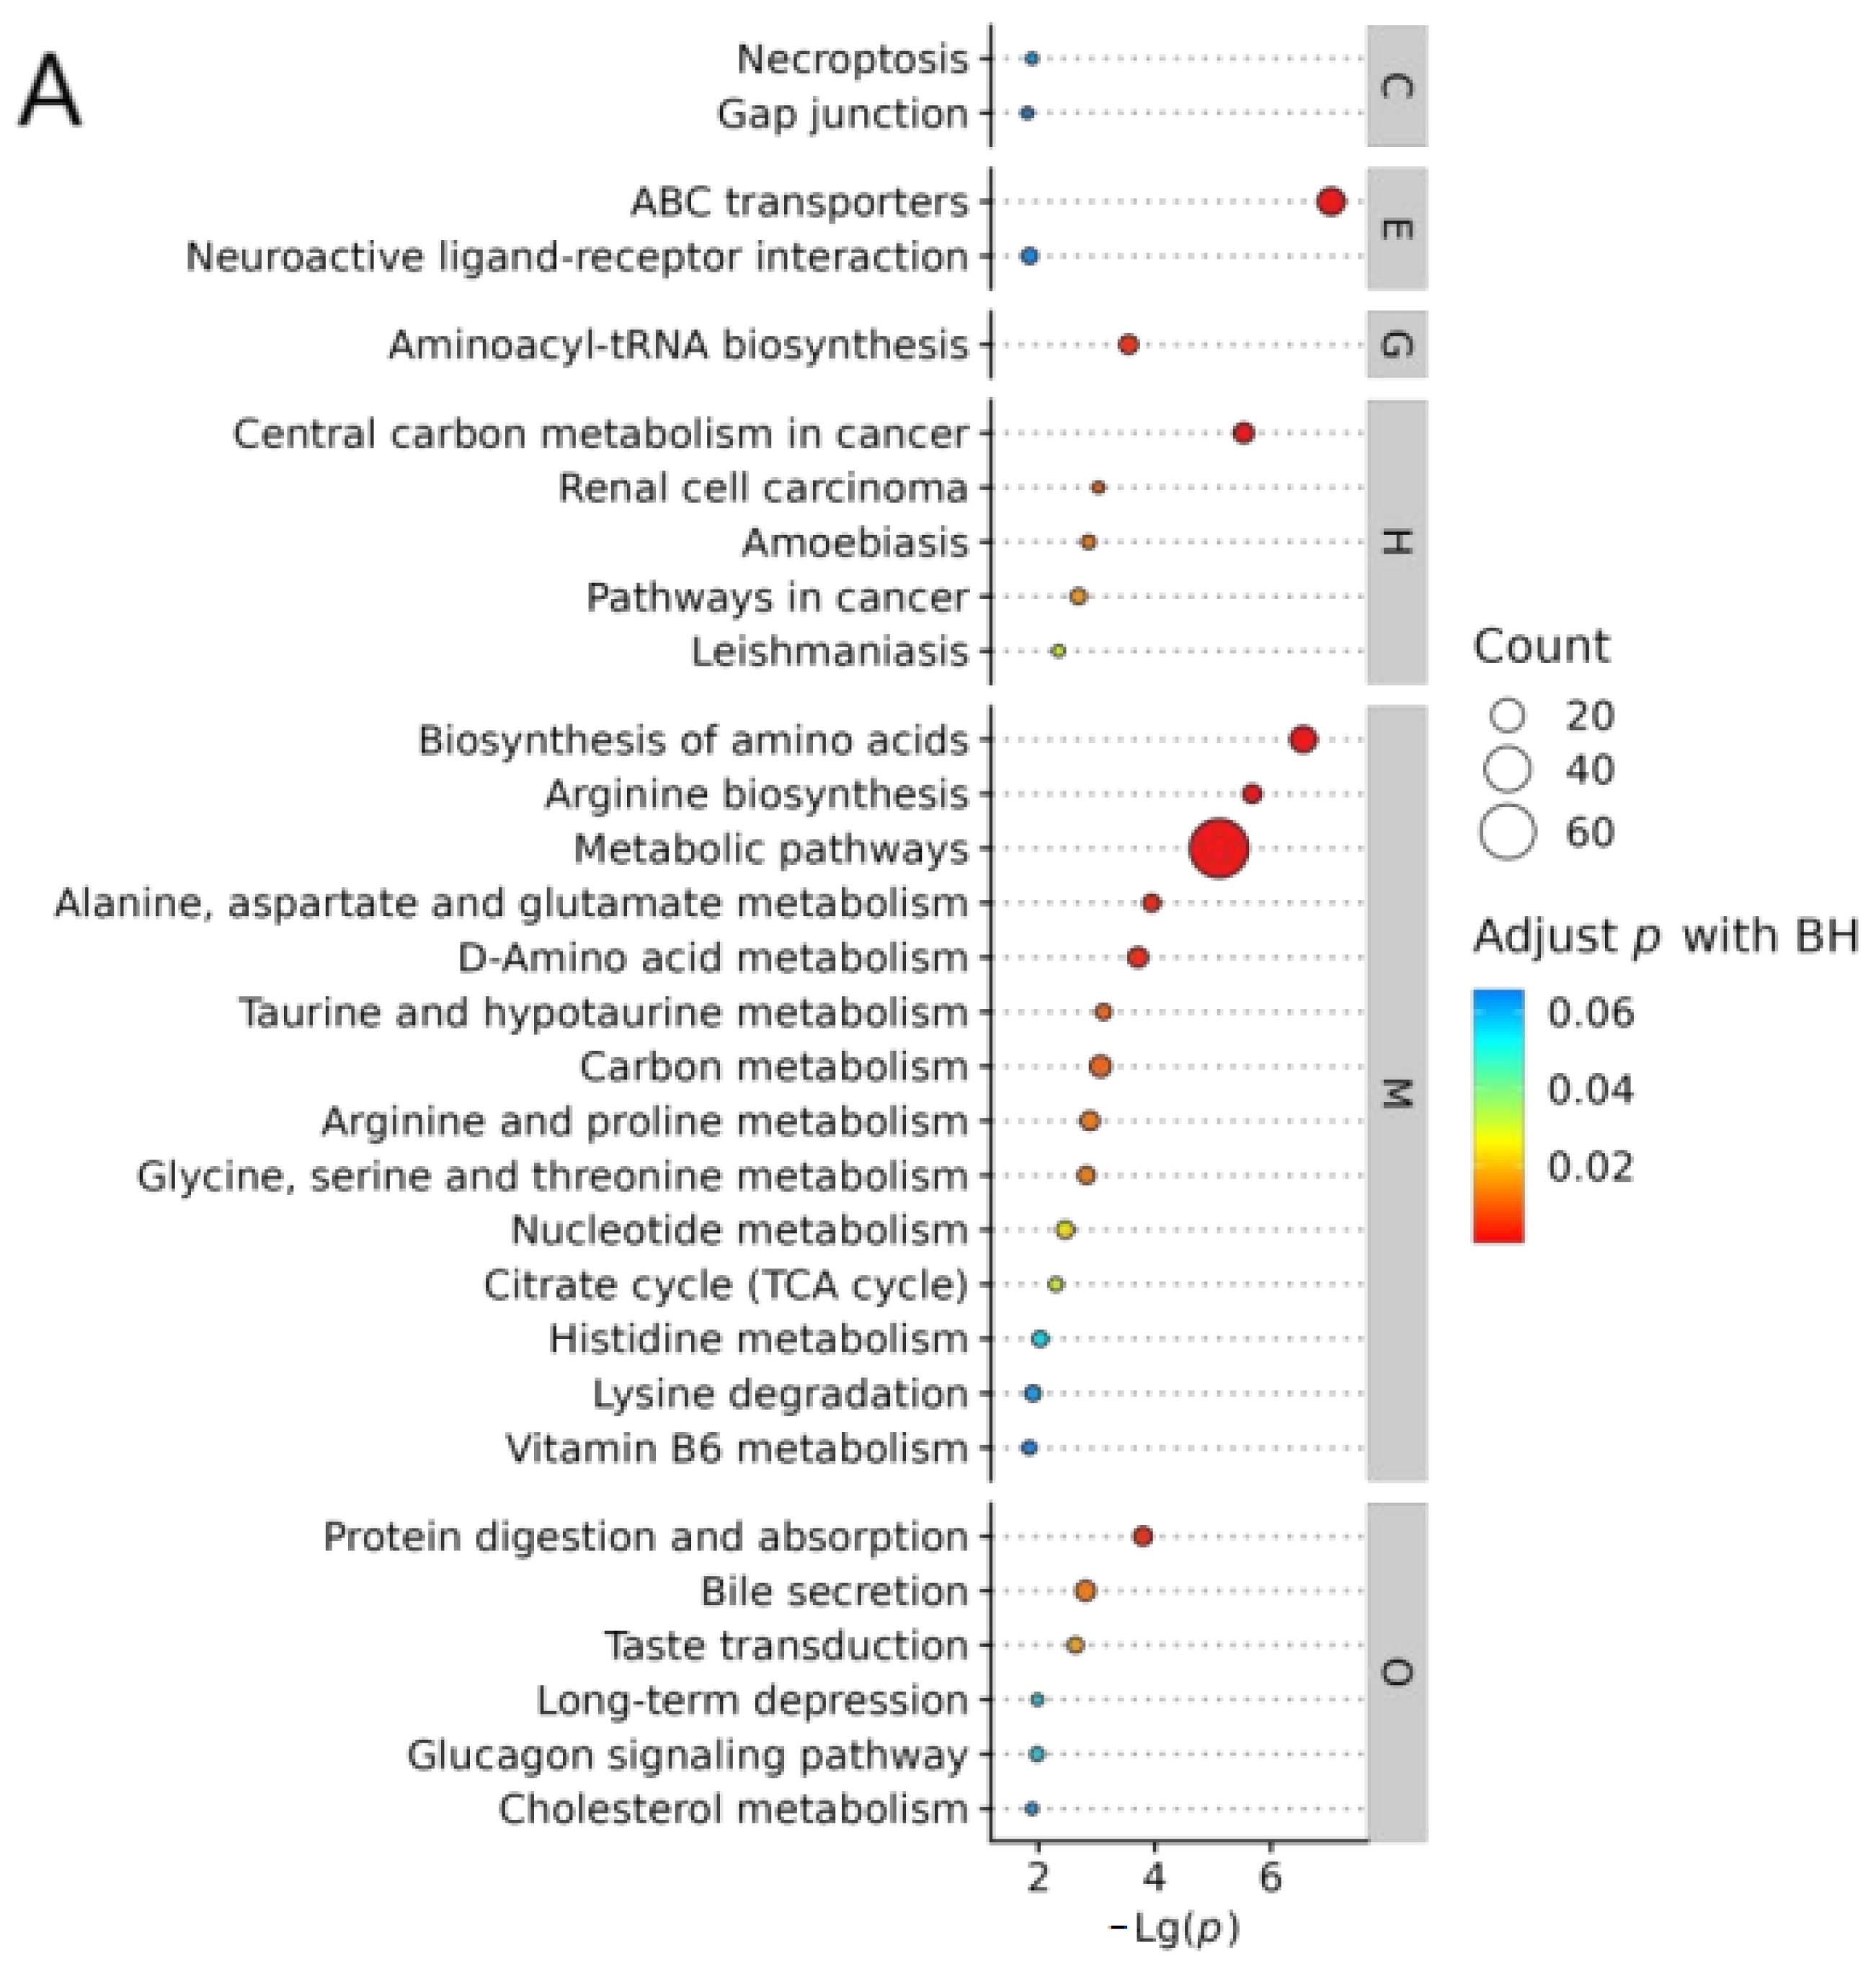
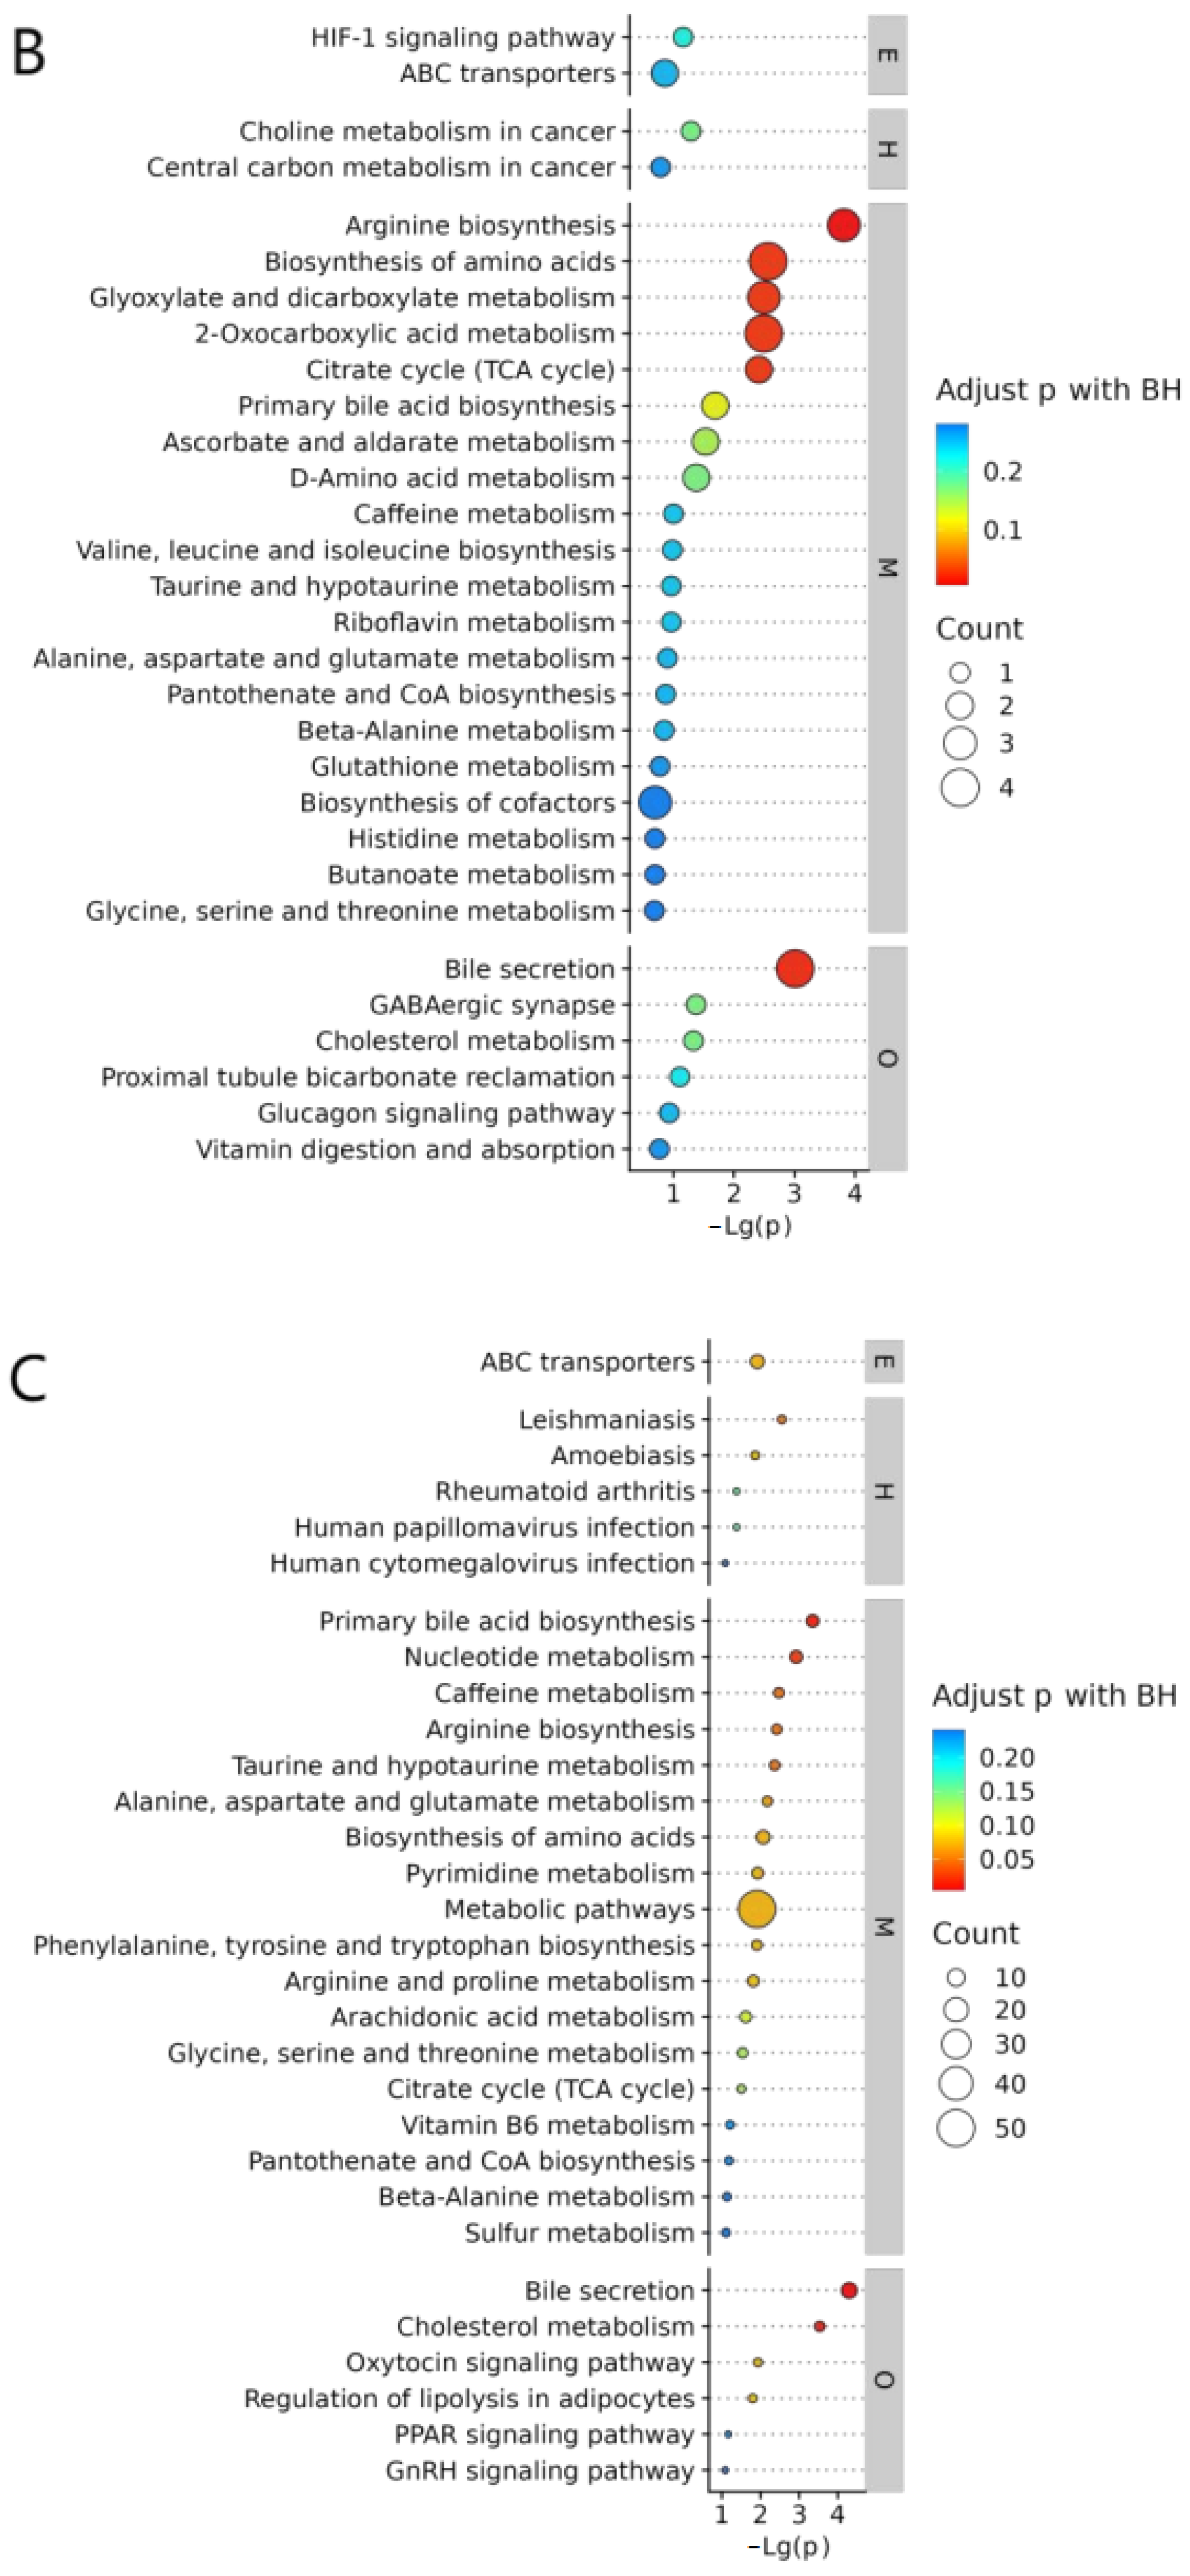
2.8.1. KEGG

To gain a deeper understanding of the metabolite differences between comparison groups AB, BD, and ABD, we performed KEGG ID mapping and plotted the top 30 most significant KEGG-pathway-enriched bubbles, respectively, thus revealing the function of the metabolites and their interactions more intuitively.
In the AB group studies (Figure 10A), we learned about the direct effects of MASH on metabolites, providing new ideas for treating MASH. Meanwhile, the analysis of the BD group (Figure 10B) demonstrated how BBD specifically affects metabolites in MASH rats. Finally, the ABD group (Figure 10C) study revealed the overall metabolic pathway changes from disease onset to treatment with BBD.
If there is a partial overlap of KEGG pathways in the three comparison groups, it is possible that BBD is a targeted therapeutic pathway for MASH. It can be seen that bile secretion; ABC transporters; biosynthesis of amino acids; arginine biosynthesis; citrate cycle (TCA cycle); cholesterol metabolism; taurine and hypotaurine metabolism; alanine, aspartate, and glutamate metabolism; and central carbon metabolism in cancer are the nine metabolic pathways considered the most important for the treatment of MASH by BBD.

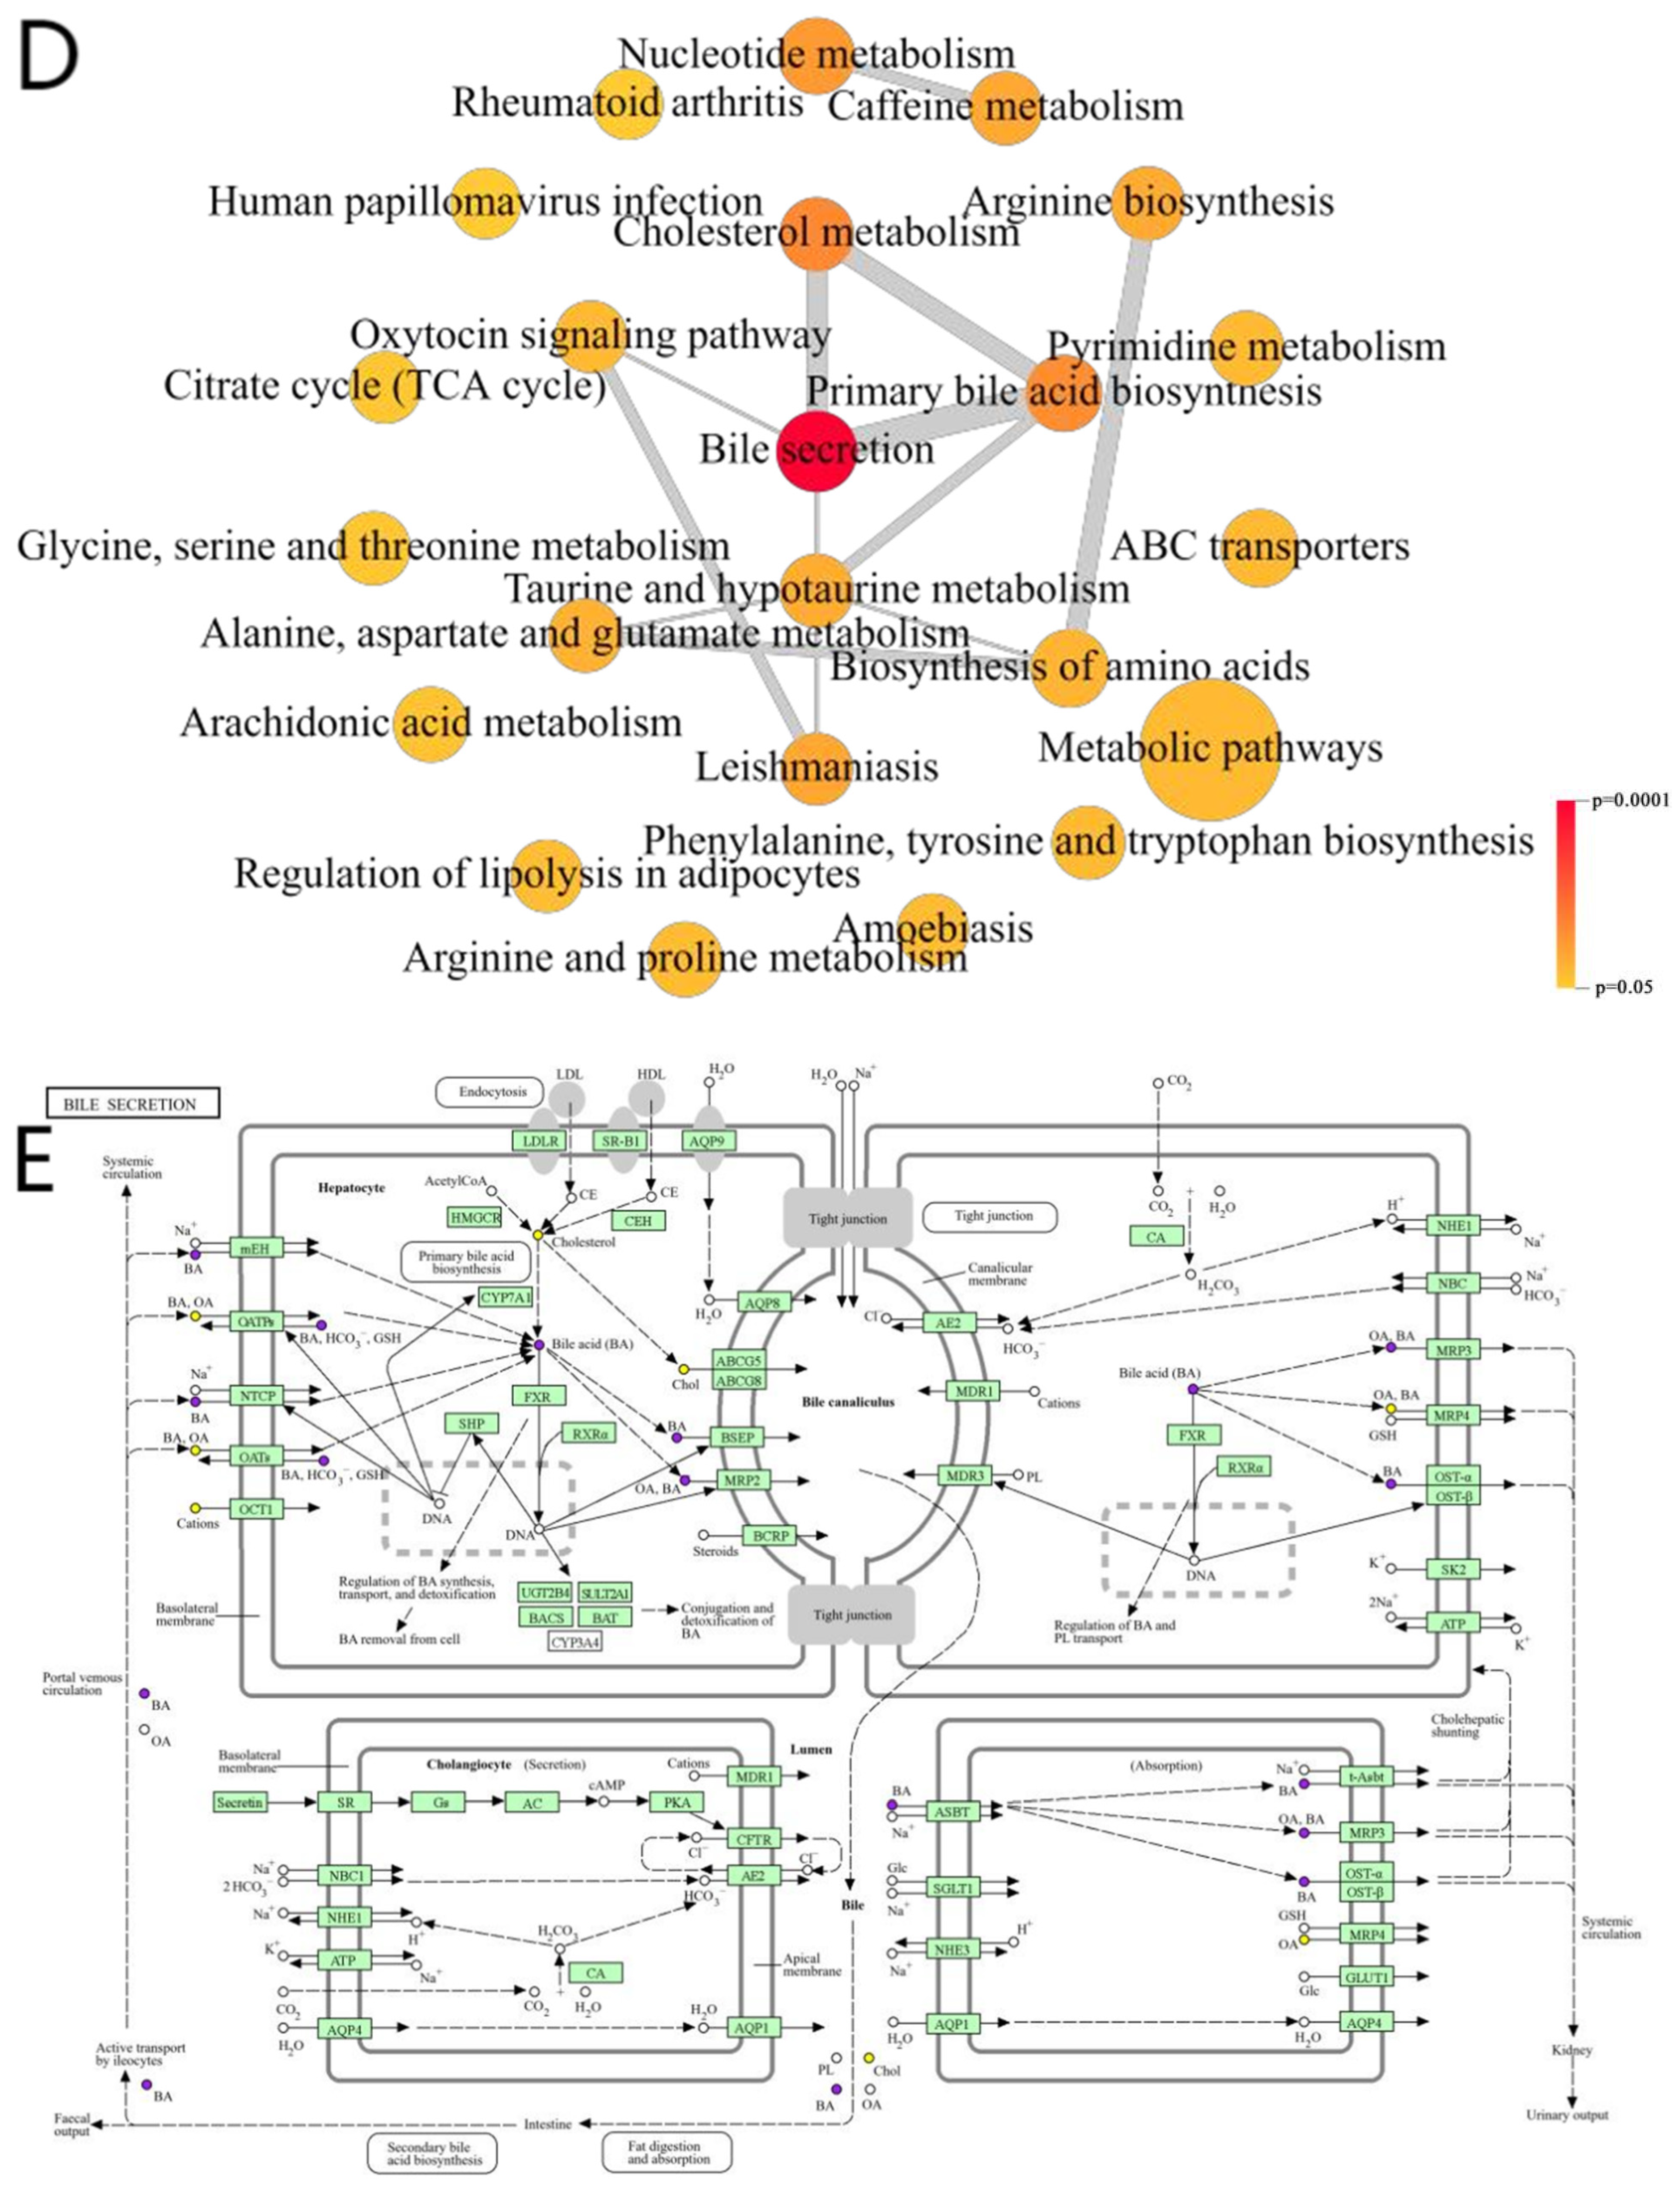
2.8.2. Functional Interaction Network Diagrams for Pathways

As can be seen in Figure 10D, after further functional interaction analysis of the pathways, we found that the bile secretion pathway had the smallest p-value, indicating the significance of its relationship with BBD-MASH. Therefore, the bile secretion pathway was regarded as the most important BBD-MASH pathway in this study. Notably, the bile secretion pathway is also closely related to several others, including the cholesterol metabolism pathway and taurine and hypotaurine metabolism.
In the KEGG mapping of the bile secretion pathway (Figure 10E), which involves four main processes—primary bile acid biosynthesis (RNO00120), endocytosis (RNO04144), tight junctions (RNO04530), and fat digestion and absorption (RNO04975)—there are changes in metabolites such as C00486 bilirubin, C00695 bile acids, C03642 taurocholate sulfate, C05122 taurocholate, C01829 thyroxine, and C00187 cholesterol, which may have a role in the treatment of MASH; however, the specific regulatory mechanisms of these metabolites still need to be further studied.

3. Discussion

3.1. Network Pharmacology

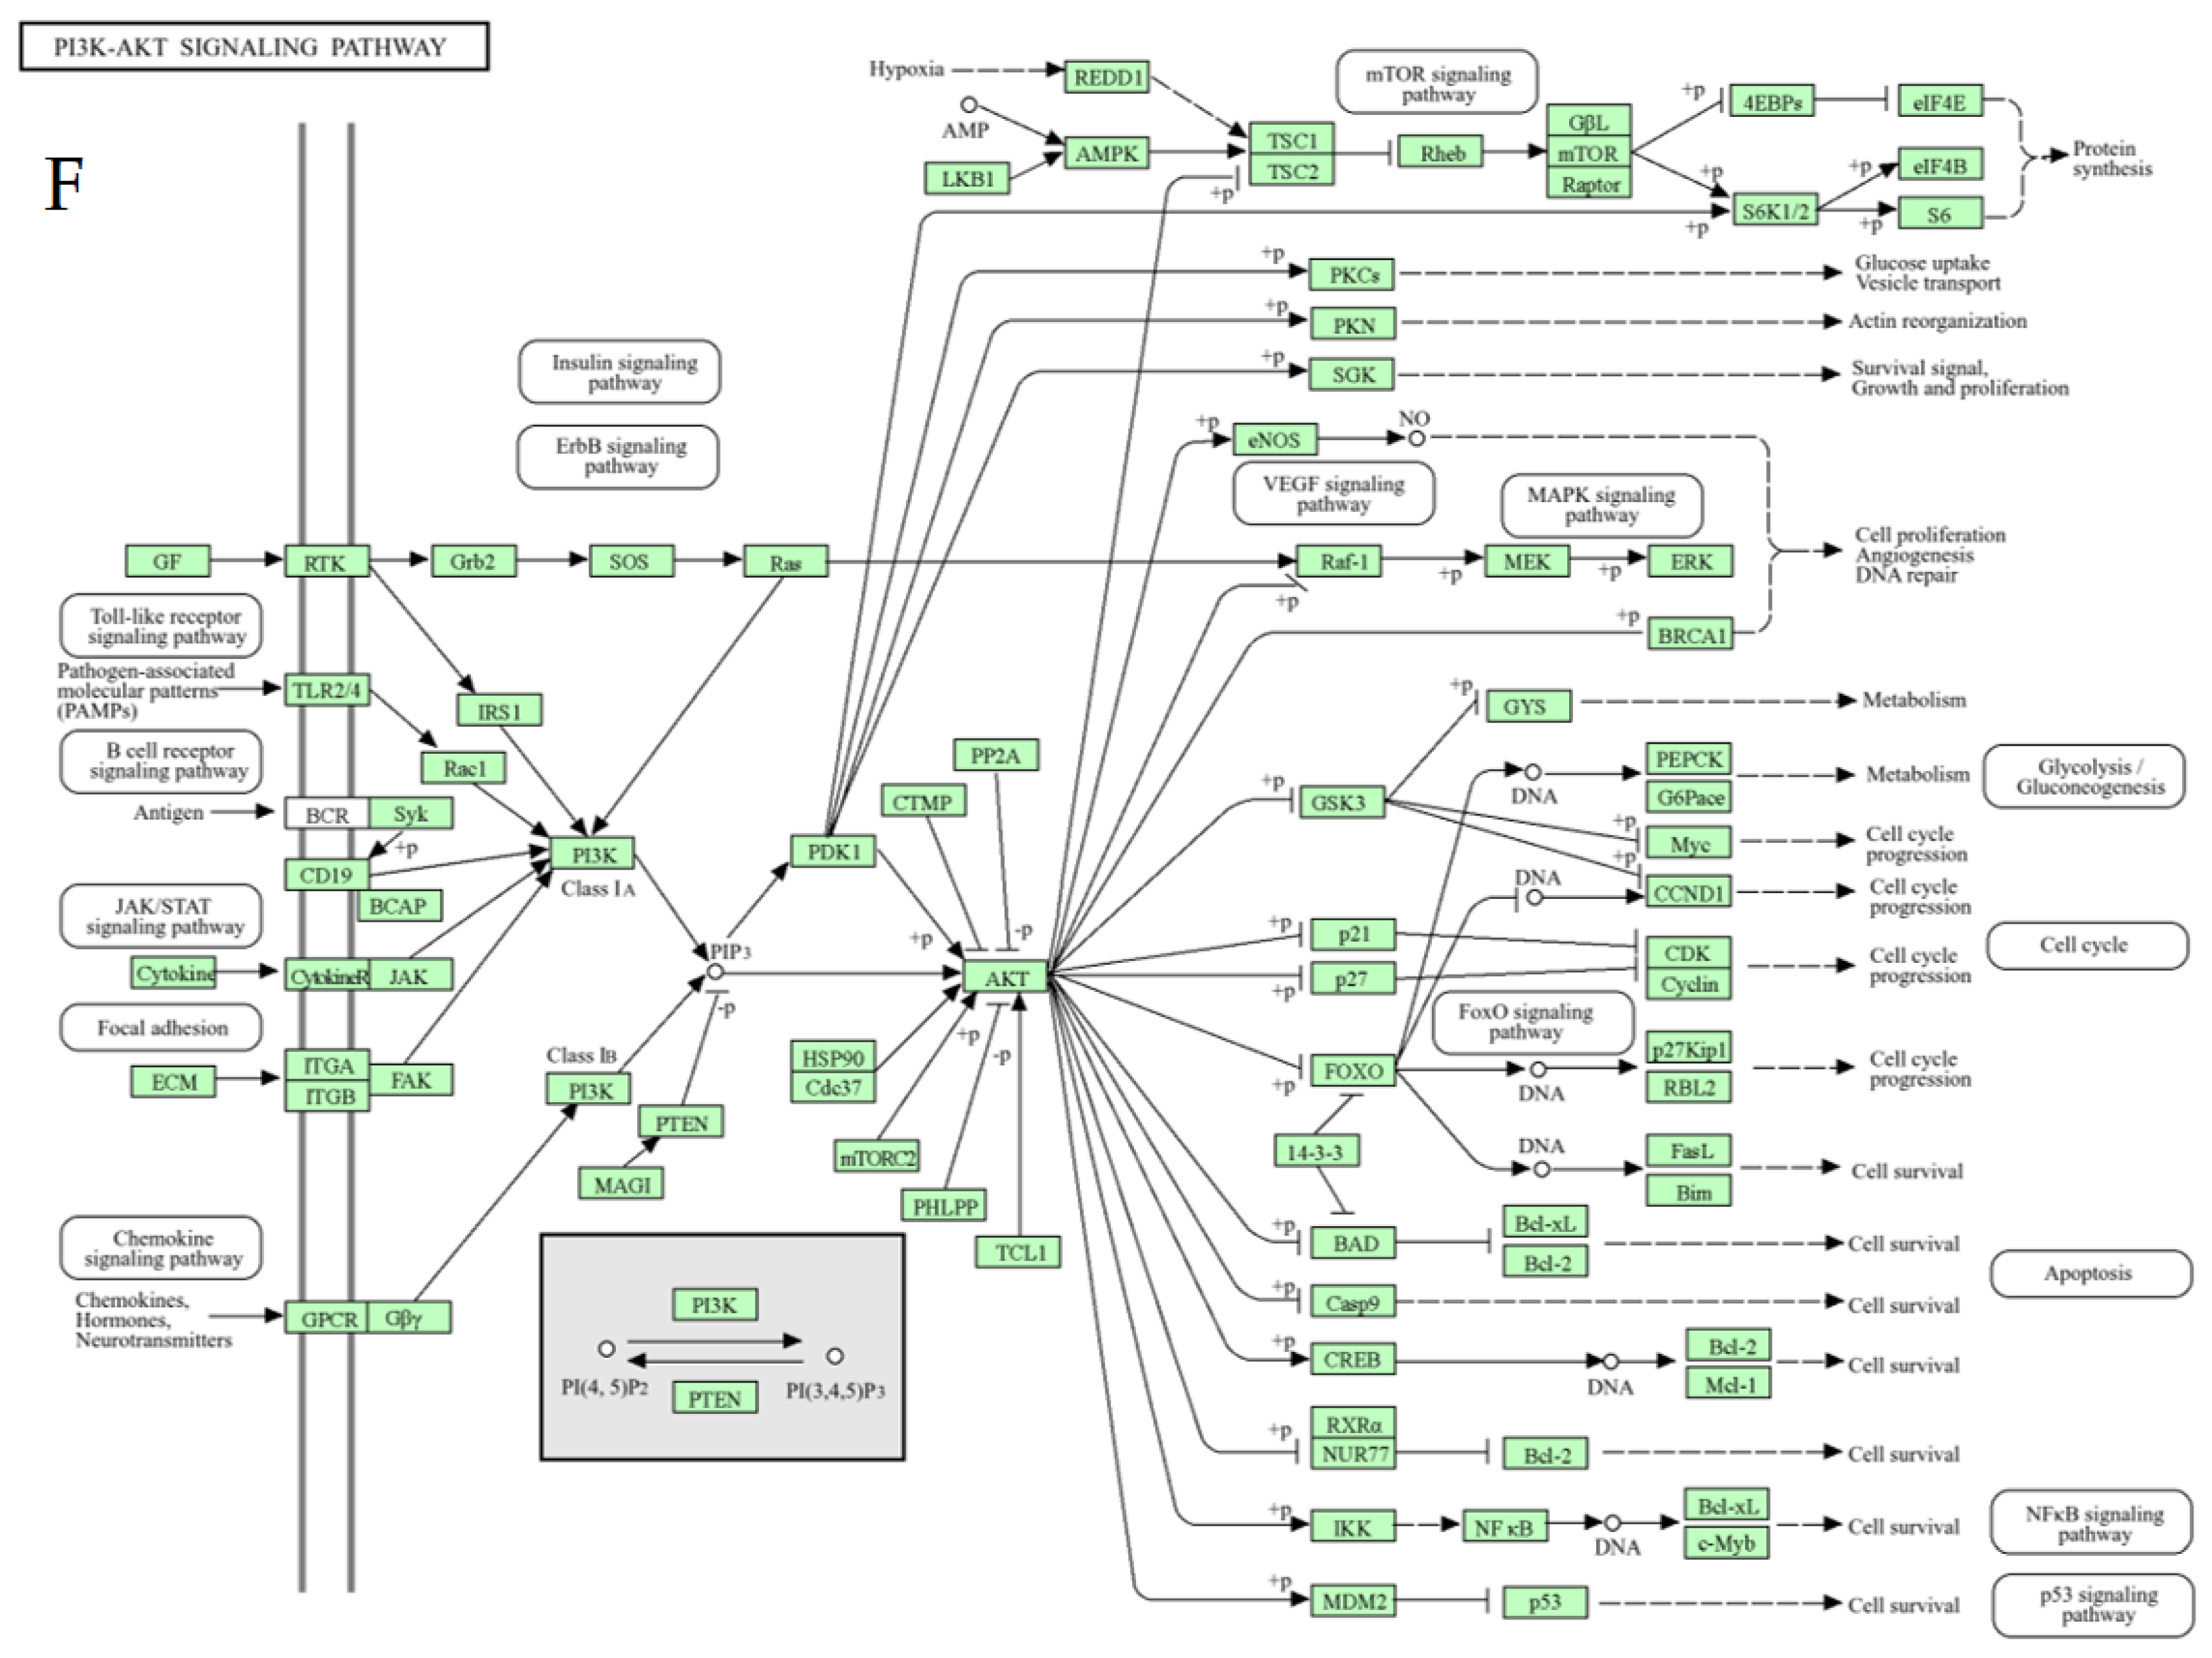
3.1.1. PI3K-AKT Signaling Pathway

In the network pharmacology KEGG pathway analyses, the cancer pathway and the nonalcoholic fatty liver disease pathway were identified as key pathways closely associated with BBD-MASH. In this experiment, we compared the KEGG results from network pharmacology with the KEGG results from the model and medium-dose BBD groups in metabolomics. By comparison, we found a common pathway: the HIF-1 signaling pathway. All three of these pathways involve a common signaling mechanism, the PI3K-Akt signaling pathway (RNO04151, Figure 10F). This finding provides important clues to our in-depth understanding of the pathogenesis and potential therapeutic targets of BBD-MASH.
The PI3K-AKT pathway is a crucial intracellular signaling mechanism that is involved in the regulation of many physiological aspects of cell growth, survival, and metabolic homeostasis [9]. At the same time, it has been shown to be associated with a variety of disorders of glycolipid metabolism metabolic diseases as well as inflammatory responses, affecting systemic metabolic regulation [10].
When the liver is stimulated by unfavorable factors such as a high-fat diet, the PI3K-AKT pathway may be overactivated. This activated state further promotes the accumulation of fat in the liver and exacerbates fatty liver. Further, the activation of this pathway may exacerbate oxidative stress, leading to hepatocyte damage and inflammation. Additionally, the aberrant activation of the PI3K-AKT pathway is closely linked to the progression of liver fibrosis and cirrhosis. Excessive activation of the pathway may promote the proliferation and activation of fibropoietic cells, leading to the accumulation of fibrous tissue in the liver and the subsequent development of cirrhosis [11].

3.1.2. Relationship of ESR1, IL6, PPARG, STAT3, and TP53 to the PI3K-AKT Signaling Pathway

ESR1 plays an important role in breast cancer and other estrogen-related diseases. Its activation can affect signaling in the PI3K-AKT pathway, which regulates cell growth and proliferation [12]. When ESR1 is stimulated, it activates PI3K, which then phosphorylates and activates AKT, promoting cell survival and proliferation.
IL-6 is a multifunctional cytokine that plays a crucial role in immune and inflammatory responses. IL-6 binding to its receptor allows signaling through the downstream JAK-STAT and PI3K-AKT pathways [13]. In particular, the STAT3 signaling pathway, which is considered a major pathway of cancer inflammation, interacts with the PI3K-AKT pathway to regulate tumor cell growth and survival.
PPARG acts as a nuclear receptor involved in the regulation of lipid metabolism and inflammatory responses. The activation of PPARG can affect the activity of the PI3K-AKT pathway, which in turn affects cell growth and differentiation [14].
STAT3 is an important transcription factor involved in the regulation of multiple cell signaling pathways. In cancer, STAT3 activation is usually closely associated with tumor growth, invasion, and metastasis. There is also an interaction between STAT3 and the PI3K-AKT pathway [15], which together regulate cell growth, survival, and metabolic processes.
Finally, TP53 is a well-known tumor suppressor gene that plays a critical role in regulating the cell cycle, apoptosis, and DNA repair. The activation of the PI3K-AKT pathway can negatively regulate the function of p53, thereby inhibiting its oncogenic effects [16]. In contrast, when p53 functions normally, it inhibits the activity of the PI3K-AKT pathway, thereby maintaining normal cell growth and differentiation.

3.1.3. Quercetin and 17-Beta-Estradiol

Quercetin, a natural polyphenolic flavonoid with antioxidant and anti-inflammatory properties, has shown promising results in alleviating MASH by reducing hepatic lipid accumulation, improving mitochondrial function, and enhancing autophagy [17]. Meanwhile, the addition of quercetin to the treatment of MASH helped to reduce the intensity of oxidative stress and enhance the antioxidant protective activity, resulting in a decrease in hepatocyte apoptosis [18].
17-Beta-Estradiol has been shown to enhance the proliferation of cholangiocytes and hepatocytes in vitro, and may delay the onset of liver disease by preventing to some extent the harmful effects of certain potentially toxic bile acids and reactive oxygen species [19]. Moreover, 17-Beta-Estradiol inhibits the action of hepatitis C virus through its intracellular receptor, mainly interfering with the assembly and release of the hepatitis C virus life cycle [20].

3.2. Animal Experimentation

3.2.1. GanShuangKeLi

GanShuangKeLi, a hepatoprotective drug commonly used in clinical practice, integrates various precious medicinal herbs, among which Codonopsis Radix (Dang Shen) and Bupleuri Radix (Chai Hu) dominate, and Angelicae Sinensis Radix (Dang Gui), Salviae Miltiorrhizae Radix et Rhizoma (Dan Shen), Atractylodis Macrocephalae Rhizoma (Bai Zhu), and Polygoni Cuspidati Rhizoma (Hu Zhang) are used as adjuncts. In addition, ingredients such as Persicae Semen (Tao Ren), Poria (Fu Ling), Taraxaci Herba (Pu Gong Ying), Prunellae Spica (Xia Ku Cao), Trionycis Carapax (Bie Jia), Aurantii Fructus (Zhi Ke), and Paeoniae Radix Alba (Bai Shao) are added. This unique combination effectively reduces inflammation and liver fibrosis and protects liver cells, thanks to the Chai Hu Saponin contained in Chai Hu and the flavonoids in Codonopsis. In addition, Dan Shen plays an equally important role by promoting the liver uptake and breakdown of specific substances, such as laminin and hyaluronic acid, which, in turn, positively affects liver fibrosis [21,22].
GanShuangKeLi has the effects of soothing the liver and spleen, reducing temperature, protecting the liver, and softening and reducing lumps. It not only significantly enhances the effectiveness of drugs, but also greatly reduces potential side effects and alleviates damage to organs such as the liver and kidneys. Because it is widely applicable for the treatment of hepatitis, liver fibrosis, and liver function damage, we chose Ganshuang granules as the positive control drug in this study.

3.2.2. Indicators

In the present study, the body mass of the MASH rats increased over time due to the administration of special diets, suggesting that a prolonged diet of high-calorie or high-fat foods directly causes obesity and changes in energy metabolism, fat metabolism, and glucose metabolism.
Inflammation is a central pathologic process in the MASH disease process that exacerbates disease progression and may lead to more severe liver injury. Inflammatory factors [23], such as TNFα, IL-6, and MCP-1, play a key role in the pathogenesis of MASH. Elevated levels of these factors exacerbate the inflammatory response in the liver, leading to liver cell damage and fibrosis. The improvement in inflammatory factor results after BBD treatment implies that the drug may attenuate the inflammatory response in the liver of MASH rats by modulating the immune response and inhibiting the production or release of inflammatory factors. This not only helps to relieve the current symptoms of inflammation, but may also stop or slow the progression of the disease and prevent further liver damage.
Insulin resistance is an important pathological feature of MASH [24] and a key factor in metabolic syndrome and type 2 diabetes. When the body’s cellular response to insulin is impaired, higher levels of insulin are required to maintain normal blood glucose levels, often resulting in elevated fasting blood glucose. The improvement in HOMA-IR after BBD treatment may mean that the drug enhances cellular sensitivity to insulin, thereby reducing fasting blood glucose levels. In addition, improving insulin resistance may also have a positive impact on other aspects of MASH, such as reducing fat accumulation and attenuating the inflammatory response, all of which can help improve the pathology of MASH.
After treatment with different doses of BBD and GSKL, hepatic index, hepatic pathology levels, biochemical index levels, and inflammatory factor levels recovered. Among them, the hepatic indices showed better improvement after treatment, indicating the effectiveness of drug treatment on MASH rats, the recovery of liver function, and the reversal of the disease process. Then, three staining methods were used to observe the level of liver pathology in MASH rats, and the results showed that steatosis, hepatic fibrosis, hepatic histological changes, and damage and inflammatory responses were significantly improved in MASH rats after treatment.
In conclusion, the animal experiments in this study support the use of BBD in traditional Chinese medicine. It demonstrates efficacy in reducing temperature and removing toxins, activating blood circulation, and alleviating blood stasis. These effects may positively influence lipid metabolism, reduce fibrosis, and mitigate the inflammatory response in the liver. Meanwhile, BBD was able to significantly improve various indices in MASH rats in a dose-dependent manner. The high-dose group demonstrated the superior therapeutic efficacy of BBD on most measures compared to the positive drug control group.

3.3. Metabolomics

3.3.1. Significantly Different Metabolites

In this study, Piceid was upregulated and NEG10082 was downregulated in the model group after successful modeling. This suggests that, when MASH occurs, NEG10082 is downregulated and the biosynthetic pathway associated with this metabolite is inhibited or regulated, which may be due to a reduction in the upstream substrate, a decrease in the activity of the associated enzyme, or other regulatory mechanisms. The upregulation of Piceid may imply that it plays some protective or mitigating role in the pathogenesis of MASH. Combining these two metabolite changes, we can hypothesize that the upregulation of Piceid may be a protective response that contributes to the alleviation of the pathological process of MASH. Meanwhile, it has been shown [25] that Piceid improves MASH, and the downregulation of NEG10082 may reflect an improvement of the condition or adjustment of related metabolic pathways.
Cryptochlorogenic acid was downregulated and hyodeoxycholic acid was upregulated after medium-dose BBD treatment, suggesting that cryptochlorogenic acid may be a negative factor in the pathogenesis of MASH; its downregulation may imply that BBD treatment helps to ameliorate or alleviate the pathology of the liver. It is also possible that some components of BBD directly or indirectly affect the metabolism of cryptochlorogenic acid, leading to its downregulation, which may be an important mechanism for the treatment of MASH with BBD. As a bile acid, the upregulation of hyodeoxycholic acid may enhance the digestion and absorption capacity of fat, which helps to improve the common fat metabolism disorders in MASH. At the same time, by promoting the metabolism of cholesterol and the recycling of bile acids, it may help to lower the levels of cholesterol and triglycerides in the blood, thus regulating lipid balance, which is positive for the treatment of MASH. It has been shown [26] that hyodeoxycholic acid treatment alleviates MAFLD by inhibiting intestinal farnesol X receptor (FXR) and upregulating hepatic CYP7B1. Taken together, the changes in these two metabolites allow us to hypothesize that the BBD treatment of MASH may work through multiple pathways: on the one hand, liver pathology is ameliorated by decreasing the level of cryptochlorogenic acid; on the other hand, fat metabolism and lipid homeostasis are regulated by increasing the level of hyodeoxycholic acid. These two effects may work together to promote therapeutic efficacy in MASH.
Overall, this study identified metabolite changes associated with the pathogenesis and treatment of MASH, providing important clues for a deeper understanding of the pathogenesis of MASH and the search for new therapeutic approaches.

3.3.2. Bile Secretion Pathway

In the present study, the bile secretion pathway was considered to be the metabolic pathway of greatest interest for BDD treatment as it plays a key role in the pathogenesis of MASH. Bile secretion and excretion are essential for fat metabolism, cholesterol homeostasis, and liver detoxification. In the MASH state, abnormalities in the bile secretion pathway may lead to the accumulation of fat in the liver and aggravate liver injury. The four processes associated with it and the changes in multiple metabolites shed light on the complex mechanisms and pathways that may be involved in MASH treatment.
First, it can be assumed that primary bile acid biosynthesis is one of the central processes of the bile secretion pathway. Bile acids [27], such as cholic acid and taurocholic acid, play a pivotal role in fat digestion and absorption as key components of bile. Changes in these metabolites may be a reflection of the regulation of bile acid metabolism during MASH treatment, which, in turn, affects fat metabolism and clearance. Key enzymes such as CYP7A1, CYP8B1, and CYP27A1 play important roles in maintaining bile acid homeostasis. Cholesterol is converted to 7α-hydroxycholesterol catalyzed by CYP7A1, which is subsequently further catalyzed by CYP8B1 to produce bile acids [28]. More than 75% of the bile acids in the human body are produced through this classical pathway. The action of these enzymes ensures the normal synthesis and metabolism of bile acids, which is important for maintaining the physiological balance of the body. Finally, the primary bile acids combine with glycine or taurine to form taurocholic acid or glycocholic acid. Subsequently, these bile acids are secreted into the bile with the assistance of transport mechanisms such as bile salt efflux pumps and multidrug-resistance-associated proteins [29]. This series of biosynthetic and transport processes ensures the correct composition and concentration of bile acids in the bile, thus maintaining the normal physiological function of bile.
Second, changes in endocytosis and tight junctions may be related to the function of hepatocytes and cholangiocytes. Endocytosis influences the cellular uptake and transport of substances, while tight junctions maintain the integrity of the biliary system. Changes in these processes may help to regulate bile secretion and excretion, thereby ameliorating the abnormal biliary function in MASH. In addition, changes in fat digestion and absorption are directly linked to the pathologic process of MASH. MASH is often accompanied by disorders of fat metabolism, and the buildup of fat in the liver can exacerbate liver damage. Therefore, the improvement of fat digestion and absorption processes may be an important part of MASH treatment.
Finally, changes in the metabolism of thyroxine and cholesterol are also of interest. Thyroxine plays a key role in lipid metabolism, and cholesterol is an important component of bile acids and cell membranes. Changes in these metabolites may reflect the overall regulation of lipid metabolism in MASH therapy. One study found that [30] thyroxine receptor agonists showed positive results in the treatment of MASH. Thyroxine or its analogs have the potential to be new targets for MAFLD treatment, showing potential in the treatment of MASH.

3.3.3. Relationship of ESR1, IL6, PPARG, STAT3, and TP53 to the Bile Secretion Pathway

ESR1 plays an important regulatory role in the bile secretion pathway [31]. Estrogen is able to influence bile secretion and excretion processes by binding ESR1. The activation of ESR1 regulates the expression of bile acid synthase, which, in turn, affects bile acid production and secretion. In addition, ESR1 may be involved in the proliferation and differentiation of biliary epithelial cells, thereby maintaining the normal function of the biliary system.
IL-6 plays a crucial role in the inflammatory response. In the occurrence of biliary-related diseases [32], the expression level of IL6 may be elevated, affecting the normal function of the bile secretion pathway by activating downstream signaling pathways.
In the bile secretion pathway, PPARG may influence bile composition and secretion by regulating the expression of genes involved in cholesterol metabolism and bile acid synthesis. In addition, PPARG may be involved in the metabolic regulation of biliary epithelial cells to maintain the homeostasis of the biliary system [33].
In the biliary system, the activation of STAT3 may affect the normal function of the bile secretion pathway by regulating processes such as the proliferation, differentiation, and apoptosis of biliary epithelial cells. In addition, an important role of STAT3 in bile-reflux-associated molecular oncogenic events has been demonstrated [34].
Although TP53 is primarily focused on intracellular signaling regulation, the aberrant expression of TP53 in biliary epithelial cells may also indirectly affect the bile secretion pathway. If TP53 is mutated or inactivated, it may lead to uncontrolled cell proliferation and biliary tumorigenesis, which, in turn, interferes with normal bile secretion and excretion [35].
In conclusion, there are complex and diverse relationships between ESR1, IL6, PPARG, STAT3, and TP53 and the bile secretion pathway. These molecules may work together to maintain the normal function of the biliary system by regulating the processes of proliferation, differentiation, and apoptosis in biliary epithelial cells, as well as the synthesis and secretion of bile components. They may act synergistically through multiple pathways to improve the pathology of MASH.

4. Materials and Methods

4.1. Chemicals and Reagents

Acetonitriles (LOT: 1.00030.4008) and methanol (LOT:1.06007.4008) were purchased from Merck (Darmstadt, Germany). Formic acid (LOT: 111670) was obtained from Millipore (Burlington, VT, USA).
Babao Dan (LOT: 210603) was purchased from Xiamen Traditional Chinese Medicine Factory Co. (Xiamen, Fujian, China). GanShuangKeLi (LOT: 220523) was purchased from Shandong Buchang Pharmaceutical Co. (Heze, Shandong, China). MASH modeling specific feed (LOT: 20221008) was purchased from Jiangsu Collaborative Medical Biotechnology Co. (Yangzhou, Jiangsu, China). Ordinary feed (LOT: 22083241) was purchased from Beijing Ke’ao Cooperative Feed Company (Beijing, China). The rat fasting insulin (FINS) enzyme-linked immunosorbent assay kit (LOT: Apr 2023), rat tumor necrosis factor alpha (TNFα) enzyme-linked immunosorbent assay kit (LOT: Apr 2023), rat monocyte chemoattractant protein-1 (MCP-1) enzyme-linked immunosorbent assay kit (LOT: Apr 2023), and rat interleukin-6 (IL-6) enzyme-linked immunosorbent assay kit (LOT: Apr 2023) were purchased from Xiamen Lunchangshuo Biotechnology Co. (Xiamen, Fujian, China)

4.2. Preparation Process, Quality Control Data, and Chemical Fingerprint of BBD

The Babao Dan used in the study were standardized preparation, it was supplied by Xiamen Traditional Chinese Medicine Factory Co., Ltd. Six Chinese herbal ingredients were used, namely 1 g Calculus Bovis, 1 g Snake Bile, 3 g Antelope Horn, 3 g Pearl, 0.5 g Moschus, and 6 g Notoginseng Radix et Rhizoma, in a ratio of 1:1:3:0.5:6; the extraction method involved slicing or grinding these ingredients into a powder. The powder was then added to an appropriate amount of water and soaked for 24 h. The soaking solution was then heated to boiling and boiled continuously for 1 h, after which the extraction solution was filtered and the filtrate was collected. The filtrate was concentrated to the desired volume during preparation, with an appropriate amount of honey or other sweetener added for seasoning. The concentrate was then made into pills or capsules, and finally BBD was obtained. It is stable, highly safe, and highly reliable. Its chemical fingerprint (HPLC) can be seen in Supplementary Material File S1.

4.3. Network Pharmacology

Network pharmacology analysis began with the collection of active compounds from Ling Yang Jiao (LYJ), She Dan (SD), She Xiang (SX), Zhen Zhu (ZZ), Niu Huang (NH), and San Qi (SQ) using the TCMSP, SwissTargetPrediction, and BATMAN-TCM databases, followed by screening based on OB ≥ 30%, DL ≥ 0.18, and Lipinski’s rule of five [36]. Targets were filtered (BATMAN score > 25, SwissTargetPrediction Probability > 0), standardized via UniProt, and visualized using Wayne diagrams. MASH-related targets were mined from TTD, Genecards, OMIM, and DisGeNet using keywords like “nonalcoholic steatohepatitis” and “MASH”, with results visualized in R4.0.3. The intersection targets of BBD and MASH were analyzed in the STRING database (Homo sapiens, interaction score ≥ 0.40), and the PPI network was constructed and visualized in Cytoscape 3.9.1, with core targets identified using the Centiscape2.2 plugin (Betweenness, Closeness, Degree). A “drug-active ingredient-target” network was built in Cytoscape to elucidate BBD’s potential mechanism against MASH. Finally, GO functional annotation and KEGG pathway enrichment were performed using DAVID, with the top 10 GO terms (BP, MF, CC) and top 20 KEGG pathways selected and visualized to clarify the biological processes and metabolic pathways involved.

4.4. Molecular Docking

The top 10 core targets were selected for molecular docking with corresponding compounds to verify their affinity. It is generally believed that a binding energy < −4.25 kcal/mol, −5.0 kcal/mol, or −7.0 kcal/mol indicates a certain, good, or strong binding activity, respectively, between the ligand and the receptor. In this study, a binding energy < −7.0 kcal/mol was used as a screening criterion. To obtain the crystal structure of each protein, the PDB database (https://www.rcsb.org/ (accessed on 1 June 2023)) was accessed and the search criteria were followed: “Homo sapiens” and refinement resolution < 3.0. Next, we made necessary preparations for the molecular docking task using AutoDockTools 1.5.6 software to ensure the accuracy and rationality of the protein structure. Meanwhile, the structure of the ligand was optimized to be in a low-energy stable conformation, which helped to more accurately simulate its binding process with the target protein. Next, molecular docking operations were performed using the vina algorithm built into the PyRx 0.8 software. Finally, the results were visualized.

4.5. Selection and Grouping of Experimental Animals

Sixty male Sprague-Dawley (SD) rats with a body mass of 180 ± 20 g were selected and provided by the Laboratory Animal Center of Henan University of Science and Technology [Quality Certificate: SCXK (Hubei) 2019-0002]. This study was approved by the Animal Laboratory of Henan University of Science and Technology (202210001). The feeding conditions were as follows: 12 h light/dark cycle (light on, 8:00–20:00); temperature, 22 ± 2 °C; humidity, 50 ± 10%. Food and water were forbidden for 24 h before the experiment, and the whole process of animal experiments followed the Guidelines for Ethical Review of Laboratory Animal Welfare (GB/T35892-2018) [37].
The animals were randomly divided into a blank control group (group A), model group (group B), low-dose BBD group (group C) (0.1 g/kg), medium-dose BBD group (group D) (0.2 g/kg), high-dose BBD group (group E) (0.4 g/kg), and positive drug control group (GanShuangKeLi, GSKL group) (0.9 g/kg), with a total of 6 groups (10 animals in each group) (each dose is calculated based on the equivalent dose ratio between experimental animals and humans, which means that the required dose per kilogram of rat is about 6 times that of humans; the dose calculated by BBD is the medium dose, and the low dose and high dose are reduced or doubling; the dose converted by GSKL is directly recorded as the dose used in the positive drug control group). After passing the acclimatization and feeding phase, modeling was performed based on a weekly intake of a high-fat diet (82.5% regular feed, 2% cholesterol, 10% lard, 5% egg yolk powder, and 0.5% sodium cholate) at 10% of the total body weight of each group, except the blank control group, for 12 weeks.
At the end of the 12th week, blood was collected from the tail vein of each group of rats, immediately frozen in liquid nitrogen, and stored at −80 °C for subsequent analysis. Then, the feed of the other groups was replaced with the same normal feed as the blank control group, and the gavage treatment was started for a period of 1 month. The blank control and model groups were given 10 mL/kg saline; the low-, medium-, and high-dose BBD groups were given 0.1 g/kg, 0.2 g/kg, and 0.4 g/kg BBD suspension, respectively; and the GanShuangKeLi (GSKL) group was given 0.9 g/kg aqueous solution of GSKL. At the end of treatment, blood was again collected from the tail vein of the rats in each group for subsequent ELISA testing as well as the analysis of biochemical indices in order to observe the effects on inflammatory factors and serum biochemical indices before and after treatment with BBD and GSKL. Meanwhile, the histopathological morphology, steatosis, and collagen fiber deposition of the rat livers were observed via HE, Oil Red O, and Sirius Red staining to assess whether the diagnostic criteria for MASH were met. Finally, venous blood was collected from the blank control group, the model group, and the medium-dose BBD group for subsequent metabolomics analysis. At the end of the animal experiments, we euthanized the rats. We deeply anesthetized the rats by intraperitoneal injection of sodium pentobarbital (50 mg/kg); then, we ensured the death of the rats by cardiac perfusion with 4% paraformaldehyde, and finally, we observed respiratory arrest, cardiac arrest, and corneal reflexes in the rats, and all the steps were independently verified by two experimenters.

4.6. Biochemical Indicator Testing

A fully automated biochemical analyzer (Shanghai Kehua Bio-engineering Co., Ltd., Shanghai, China) was used to detect the levels of fasting blood glucose (FBG), alanine transaminase (ALT), glutamic oxaloacetic transaminase (GOT/AST), triglycerides (TC), total cholesterol (TG), high-density lipoprotein cholesterol (HDL-C), and low-density lipoprotein cholesterol (LDL-C) in rat serum.

4.7. Serum Inflammatory Factor Levels and Fasting Insulin Tests

Fasting serum insulin (FINS), rat monocyte chemokine protein-1 (MCP-1), interleukin-6 (IL-6), and serum tumor necrosis factor alpha (TNFα) were all detected using the ELISA kit (LunChangShuo Biotechnology Co., Ltd., Beijing, China) in the rats. The kit and samples were removed 2 h before the operation to equilibrate the room temperature. The insulin resistance index (HOMA-IR) was calculated after calculating the content of each factor in the serum samples.

4.8. Tissue Embedding Sectioning and Staining

Firstly, the rats were anesthetized through an intraperitoneal injection of 3% pentobarbital sodium (30 mg/Kg), and their liver tissue was removed and fixed overnight (24 h) in 4% paraformaldehyde to ensure its fixation effect. Subsequently, paraffin embedding, dehydration, and sectioning were performed, and these liver tissue sections were stained with hematoxylin–eosin (HE) and observed under light microscope for pathologic changes in their liver histology. In addition, we placed fresh liver tissues in Optimal Cutting Temperature Compound (OCT) embedding agent, followed by cryosectioning, subjected the sections to Oil Red O staining, and, finally, sealed the sections with glycerol gelatin and observed the formation of lipid droplets in different groups of liver tissues under a light microscope. In addition to the above two staining methods, we also performed Sirius Red staining, which allowed us to clearly observe the distribution and deposition of collagen fibers in the liver, thus providing a basis for evaluating the extent and progression of liver fibrosis.

4.9. Data Analysis

The resulting data were analyzed in depth using GraphPad Prism 8.0 software to present the fluctuations in the data in the form of Mean ± Standard Deviation (Mean ± SD). In order to clarify the differences between the groups, statistical analyses were performed using one-way ANOVA or t-test.

4.10. Metabolomics

4.10.1. Extraction of Metabolites

The samples were thawed at 4 °C. A 100 μL aliquot of each sample was then mixed with 100 μL of pre-cooled distilled water and 800 μL of a methanol/acetonitrile mixture (1:1, v/v), and thoroughly mixed. The samples were placed in an ice bath for 1 h of sonication. Subsequently, they were left at −20 °C for 2 h to promote protein precipitation. Next, the supernatant was centrifuged for 20 min (16,000× g, 4 °C). The supernatant was evaporated using a high-speed vacuum centrifuge. For mass spectrometry, 100 μL of a mixture of methanol and water (1:1, v/v) was added to the evaporated sample and centrifuged again for 20 min under the above conditions, and then the supernatant was removed and analyzed.

4.10.2. LC-MS/MS Analysis

Chromatographic separation: Throughout the analysis, the samples were placed in an autosampler at 4 °C to maintain stability. A SHIMADZU-LC30 Ultra Performance Liquid Chromatography System (UPLC) was used with an ACQUITY UPLC®HSST3 (2.1 mm × 100 mm, 1.8 µm) (Waters, Milford, MA, USA) column. The injection volume was 4 μL, the column temperature was 40 °C, and the flow rate was 0.3 mL/min. The mobile phases were as follows: B: acetonitrile, A: 0.1% formic acid aqueous solution; the chromatographic gradient elution procedure was as follows: 0–2 min, 0B; 2–6 min, the B varied from 0% to 48%; 6–10 min, the B varied from 48% to 100%; 10–12 min, the B remained at 100%; 12–12.1 min, the B varied from 100% to 0%; 12.1–15 min, the B remained at 0%; 12.1–15 min, the B varied from 100% to 0%. From 12 to 12.1 min, B varied linearly from 100% to 0%, and from 12.1 to 15 min, B was maintained at 0%.
Mass Spectrometry Acquisition
Each sample was analyzed using electrospray ionization (ESI) in both positive (+) and negative (−) modes. The samples were separated via UPLC and then analyzed using mass spectrometry with a QE Plus mass spectrometer (Thermo Scientific, Waltham, MA, USA). Ionization was carried out using a HESI source with the following conditions: Spray voltage: 3.8 kV (+) and 3.2 kV (−); capillary temperature: 320 °C; sheath gas: 30 arbitrary units; aux gas: 5 arbitrary units; probe heater temperature: 350 °C; S-lens RF level: 50. The MS acquisition settings were as follows: acquisition time: 25 min; parent ion scan range: 80–1200 m/z; primary MS resolution: 70,000 @ m/z 200; AGC target: 3 × 10⁶; primary maximum IT: 100 ms. Secondary mass spectrometry analysis was conducted as follows: Triggered acquisition of secondary mass spectrometry (MS2scan) was performed on the 10 highest-intensity parent ions after each full scan. Secondary mass resolution was set to 17,500 @ m/z 200, with an AGC target of 1e5 and a maximum IT of 50 ms. MS2 activation was carried out using HCD with an isolation window of 2 m/z and normalized collision energies set to 20, 30, and 40.

4.10.3. Data Preprocessing

Raw data were processed with MSDIAL software v4.90. for peak alignment, retention time correction, and peak area extraction. Metabolite identification involved precise mass number matching (mass tolerance < 10 ppm) and secondary spectral matching (mass tolerance < 0.01 Da) using databases such as HMDB, MassBank, and GNPS. Ion peaks with >50% missing values were excluded from the statistical analysis. Data from positive and negative ions were normalized by total peak area, integrated, and pattern recognition was performed using Python software (3.10), with preprocessing by Unit Variance Scaling (UV) for the subsequent analysis.

5. Conclusions

In summary, it was experimentally verified that BBD demonstrated significant therapeutic effects on high-fat chow-induced MASH rats and effectively improved hepatic lipid metabolism, fibrosis and inflammatory responses. Combining in-depth analysis of network pharmacology and metabolomics, we found that BBD mainly exerts therapeutic effects on MASH rats by regulating four metabolic biomarkers, such as Piceid, and five targets, such as ESR1, as well as involving two key compounds quercetin and 17-Beta-Estradiol, and mainly regulate the PI3K-AKT signaling pathway and bile secretion pathway to improve liver injury in MASH rats. We will follow up with further validation against relevant target pathways to provide new ideas for advancing the modernization of BBD research.
The whole study combined network pharmacological prediction, molecular docking, metabolomics and relevant experimental validation to systematically elucidate the mechanism of action of BBD on MASH, providing a multi-level chain of evidence; we also set up different drug concentration groups to elucidate the dose-dependent effect, which improved the credibility of the conclusions; moreover, the experiments used a high-fat-diet-induced MASH rat model, which mimicked the pathology of human disease characteristics, and the results are more translational. In the future, we will further combine with targeted metabolomics to deepen this mechanism.

Supplementary Materials

The following supporting information can be downloaded at: https://www.mdpi.com/article/10.3390/ph18081111/s1, File S1: BBD chemical fingerprint (HPLC).

Author Contributions

S.Z.: conceptualization, data curation, formal analysis, writing—original draft, writing—review and editing. Y.S.: investigation, methodology, project administration. A.H.: software, supervision. H.Q.: supervision, validation. J.Z.: software, validation. X.Q. (Corresponding Author): project administration, resources, supervision, writing—review and editing. All authors understood the data and made important contributions to the manuscript. All authors have read and agreed to the published version of the manuscript.

Funding

This research received no external funding.

Institutional Review Board Statement

The whole process of animal experimentation followed the Guidelines for Ethical Review of Laboratory Animal Welfare (GB/T35892-2018) and this study was approved by the Ethics Committee of the Animal Laboratory of Henan University of Science and Technology (202210001) on 8 October 2022.

Informed Consent Statement

Not applicable.

Data Availability Statement

Data presented in this study is contained within the article and supplementary material. Further inquiries can be directed to the corresponding author.

Acknowledgments

We are very grateful to the School of Basic Medicine and Forensic Medicine at Henan University of Science and Technology for their support and the provision of instruments for our experiment. We also greatly appreciate every participant who provided assistance throughout the research process.

Conflicts of Interest

The authors declare that there are no conflicts of interest.

Abbreviations

ALTAlanine transaminase
BATMAN-TCMBioinformatics Analysis Tool for Molecular Mechanism of Traditional Chinese Medicine
BBDBabao Dan
CYP27A1Sterol 27-hydroxylase
CYP7A1Cholesterol 7α-hydroxylase
CYP8B1Sterol 12α-hydroxylase
DAVIDDatabase for Annotation, Visualization and Integrated Discovery
DisGeNetDatabase of gene–disease associations
DLDrug likeness
ESR1Estrogen receptor 1
FBGFasting blood glucose
FINSFasting serum insulin
GOGene Ontology
GOT/ASTGlutamic oxaloacetic transaminase
GSKLGanShuangKeLi
HDL-CHigh-density lipoprotein cholesterol
HEHematoxylin–eosin
IL-6Interleukin-6
KEGGKyoto Encyclopedia of Genes and Genomes
LDL-CLow-density lipoprotein cholesterol
MCP-1Rat monocyte chemokine protein-1
NASHNonalcoholic steatohepatitis
MASHMetabolic dysfunction-associated steatohepatitis
MAFLDMetabolic-associated fatty liver disease
OBOral bioavailability
OMIMOnline Mendelian Inheritance in Man
PPARGPeroxisome proliferator-activated receptor gamma
PPIProtein–protein interaction
STAT3Signal Transducer and Activator of Transcription 3
TCTriglyceride
TCMSPTraditional Chinese Medicine Systems Pharmacology Database and Analysis Platform
TGTotal cholesterol
TNFαSerum tumor necrosis factor alpha
TP53Tumor protein p53
TTDTherapeutic Target Database

References

  1. National Workshop on Fatty Liver and Alcoholic Liver Disease; Chinese Society of Hepatology, Chinese Medical Association; Fatty Liver Expert Committee; Chinese Medical Doctor Association. Guideline of prevention and treatment for nonalcoholic fatty liver disease. J. Pract. Hepatol. 2018, 21, 177–186. [Google Scholar]
  2. Xue, R.; Fan, J. Current situation and prospect of FXR agonist in the treatment of nonalcoholic steatohepatitis. Liver 2021, 26, 835–837. [Google Scholar]
  3. Yuan, P.; Chen, W. Insights to new medicine development for treatment of patients with nonalcoholic steatohepatitis. J. Pract. Hepatol. 2021, 24, 305–308. [Google Scholar]
  4. Kawaguchi, T.; Tsutsumi, T.; Nakano, D.; Torimura, T. MAFLD: Renovation of clinical practice and disease awareness of fatty liver. Hepatol. Res. 2021, 52, 422–432. [Google Scholar] [CrossRef]
  5. Liu, P. Clinical efficacy of Babaodan capsules in the treatment of jaundice type viral hepatitis. Clin. Med. Res. Pract. 2018, 3, 138–139. [Google Scholar]
  6. Lv, H.; Yin, X. Clinical Observation of the Combination of Babaodan Capsules and Ganxile Granules with Western Medicine in the Treatment of Acute Jaundice Virus Hepatitis. Chin. Med. Emerg. 2017, 26, 328–330. [Google Scholar]
  7. Li, Y.; Lu, Y.; Yang, Z.; Chen, Y.; Liu, J.; Zhang, M.; Chen, X.; Huang, Y. A randomized controlled study on the protective effect of Babaodan capsules on liver function after liver cancer resection. J. Integr. Tradit. West. Med. Hepatol. 2024, 34, 2022–2206. [Google Scholar]
  8. Sheng, D.; Zhao, S.; Gao, L.; Zheng, H.; Liu, W.; Hou, J.; Jin, Y.; Ye, F.; Zhao, Q.; Li, R.; et al. BabaoDan attenuates high-fat diet-induced non-alcoholic fatty liver disease via activation of AMPK signaling. Cell Biosci. 2019, 9, 77. [Google Scholar] [CrossRef]
  9. Glaviano, A.; Foo, A.C.; Lam, H.Y.; Yap, K.H.; Jacot, W.; Jones, R.H.; Eng, H.Y.; Nair, M.G.; Makvandi, P.; Geoerger, B.; et al. PI3K/AKT/mTOR signaling transduction pathway and targeted therapies in cancer. Mol. Cancer 2023, 22, 138. [Google Scholar] [CrossRef] [PubMed]
  10. Xiong, P.; Zhang, F.; Liu, F.; Zhao, J.; Huang, X.; Luo, D.; Guo, J. Metaflammation in glucolipid metabolic disorders: Pathogenesis and treatment. Biomed. Pharmacother. 2023, 161, 114545. [Google Scholar] [CrossRef] [PubMed]
  11. Lang, B.; Zhang, Z.; Chen, J.; Fan, Y.; Guo, J.; Su, Y.; Wang, H.; Zhang, X.; Wu, X.; Jiang, Q.; et al. High-fat diet promotes liver tumorigenesis via palmitoylation and activation of AKT. Gut 2024, 73, 1156–1168. [Google Scholar] [CrossRef] [PubMed]
  12. Li, Z.; Levine, K.M.; Bahreini, A.; Wang, P.; Chu, D.; Park, B.H.; Oesterreich, S.; Lee, A.V. Upregulation of IRS1 enhances IGF1 response in Y537S and D538G ESR1 mutant breast cancer cells. Endocrinology 2018, 159, 285–296. [Google Scholar] [CrossRef]
  13. Zegeye, M.M.; Lindkvist, M.; Fälker, K.; Kumawat, A.K.; Paramel, G.; Grenegård, M.; Sirsjö, A.; Ljungberg, L.U. Activation of the JAK/STAT3 and PI3K/AKT pathways are crucial for IL-6 trans-signaling-mediated pro-inflammatory response in human vascular endothelial cells. Cell Commun. Signal. 2018, 16, 55. [Google Scholar] [CrossRef] [PubMed]
  14. Cataldi, S.; Aprile, M.; Melillo, D.; Mucel, I.; Giorgetti-Peraldi, S.; Cormont, M.; Italiani, P.; Blüher, M.; Tanti, J.F.; Ciccodicola, A.; et al. TNFα mediates inflammation-induced effects on PPARG splicing in adipose tissue and mesenchymal precursor cells. Cells 2021, 11, 42. [Google Scholar] [CrossRef]
  15. Zhang, Z.; Li, M.; Wang, Z.; Zuo, H.; Wang, J.; Xing, Y.; Jin, C.; Xu, G.; Piao, L.; Piao, H.; et al. Convallatoxin promotes apoptosis and inhibits proliferation and angiogenesis through crosstalk between JAK2/STAT3 (T705) and mTOR/STAT3 (S727) signaling pathways in colorectal cancer. Phytomedicine 2020, 68, 153172. [Google Scholar] [CrossRef] [PubMed]
  16. Liu, J.; Zhang, C.; Lin, M.; Zhu, W.; Liang, Y.; Hong, X.; Zhao, Y.; Young, K.H.; Hu, W.; Feng, Z. Glutaminase 2 negatively regulates the PI3K/AKT signaling and shows tumor suppression activity in human hepatocellular carcinoma. Oncotarget 2014, 5, 2635–2647. [Google Scholar] [CrossRef]
  17. Katsaros, I.; Sotiropoulou, M.; Vailas, M.; Kapetanakis, E.I.; Valsami, G.; Tsaroucha, A.; Schizas, D. Quercetin’s Potential in MASLD: Investigating the Role of Autophagy and Key Molecular Pathways in Liver Steatosis and Inflammation. Nutrients 2024, 16, 3789. [Google Scholar] [CrossRef]
  18. Kravchenko, L.; Unhurian, L.; Tiuzhinska, S.K.; Ivanova, Y.; Obrazenko, M.; Zahorodnya, L.; Yamilova, T. Increasing the efficiency of hypolipidemic therapy with the combined use of quercetin in patients with non-alcoholic fatty liver disease on the background of the metabolic syndrome. Ceska Slov. Farm. 2023, 72, 296–302. [Google Scholar] [CrossRef]
  19. Kilanczyk, E.; Ruminkiewicz, D.; Banales, J.M.; Milkiewicz, P.; Milkiewicz, M. DHEA Protects Human Cholangiocytes and Hepatocytes against Apoptosis and Oxidative Stress. Cells 2022, 11, 1038. [Google Scholar] [CrossRef]
  20. Magri, A.; Barbaglia, M.N.; Foglia, C.Z.; Boccato, E.; Burlone, M.E.; Cole, S.; Giarda, P.; Grossini, E.; Patel, A.H.; Minisini, R.; et al. 17,β-Estradiol inhibits hepatitis C virus mainly by interference with the release phase of its life cycle. Liver Int. 2017, 37, 669–677. [Google Scholar] [CrossRef]
  21. Wu, Q.; Yu, P.; Bi, Y.; Wang, B.; Wang, Z.; Li, Z.; Chen, Y.; Duan, Z. Mechanism of Ganshuang granule extract in alleviating N-acetyl-p-aminophenol-induced hepatocellular injury. J. Clin. Hepatol. 2021, 37, 120–125. [Google Scholar]
  22. Zhou, X.; Yang, X.; Hu, R. Observation of the therapeutic effect of Ganshuang granules on patients with liver fibrosis and its impact on liver function. Guizhou Med. J. 2023, 47, 197–198. [Google Scholar]
  23. Ma, J.; Gao, L.; Zhang, M.; Gao, Q.; Tao, X.; Fan, Y.; Yang, J. Study on the Improvement Effect and Mechanism of Lycium barbarum Polysaccharides Combined with Aerobic Exercise on Non alcoholic Fatty Hepatitis Rat Model. J. Clin. Hepatol. 2021, 37, 1348–1353. [Google Scholar]
  24. Wang, X.; Wang, Y.; Shang, M.; Liu, Y.; Chen, G. Experimental study on the activation of IRS-1/PI3K/Akt signaling pathway by Di’ao Xinxuekang to improve insulin resistance in non-alcoholic fatty liver disease mice. Chin. J. Clin. Pharmacol. Ther. 2024, 29, 121–129. [Google Scholar]
  25. Deng, Y.; Ji, G.; Wang, Y.; Jiang, Z. Intervention effect of resveratrol on non-alcoholic steatohepatitis in mice. Chin. J. Public Health 2015, 31, 88–91. [Google Scholar]
  26. Kuang, J.; Wang, J.; Li, Y.; Li, M.; Zhao, M.; Ge, K.; Zheng, D.; Cheung, K.C.; Liao, B.; Wang, S.; et al. Hyodeoxycholic acid alleviates non-alcoholic fatty liver disease through modulating the gut-liver axis. Cell Metab. 2023, 35, 1752–1766.e8. [Google Scholar] [CrossRef]
  27. Zhang, J. Study on the Composition and Quality Control of Bile Acids in Traditional Chinese Medicine Snake Gallbladder. Ph.D. Thesis, Huazhong University of Science and Technology, Wuhan, China, 2019. [Google Scholar]
  28. Tan, Q.; Du, Y.; Huang, H.; Xu, J.; Wu, Y. The role of intestinal microecology/bile acid metabolism/FXR pathway in the development of NAFLD. Chin. J. Integr. Tradit. West. Med. Liver Dis. 2023, 33, 467–470. [Google Scholar]
  29. Zheng, W.; Wang, X.; Han, H.; Jing, Z.; Zhao, W.; Xue, B.; Zhang, Y. Study on the regulation of bile acid metabolism in sleep deprived mice by Jiaotai Pill based on LC-MS. Chin. J. Tradit. Chin. Med. 2021, 46, 5382–5392. [Google Scholar]
  30. Harrison, S.A.; Bedossa, P.; Guy, C.D.; Schattenberg, J.M.; Loomba, R.; Taub, R.; Labriola, D.; Moussa, S.E.; Neff, G.W.; Rinella, M.E.; et al. A phase 3, randomized, controlled trial of resmetirom in NASH with liver fibrosis. N. Engl. J. Med. 2024, 390, 497–509. [Google Scholar] [CrossRef] [PubMed]
  31. Liang, M.; Ye, S.; Jing, R.; Zhu, W.; Chu, X.; Li, Y.; Zhang, W. Estrogen receptor alpha-mediated mitochondrial damage in intrahepatic bile duct epithelial cells leading to the pathogenesis of primary biliary cholangitis. Environ. Toxicol. 2023, 38, 2803–2818. [Google Scholar] [CrossRef]
  32. Wang, Y.; Zhang, X.; Wang, X.; Zhang, N.; Yu, Y.; Gong, P.; Zhang, X.; Ma, Y.; Li, X.; Li, J. Clonorchis sinensis aggravates biliary fibrosis through promoting IL-6 production via toll-like receptor 2-mediated AKT and p38 signal pathways. PLoS Negl. Trop. Dis. 2023, 17, e0011062. [Google Scholar] [CrossRef] [PubMed]
  33. Wren, S.N.; Donovan, M.G.; Selmin, O.I.; Doetschman, T.C.; Romagnolo, D.F. A Villin-driven Fxr transgene modulates enterohepatic bile acid homeostasis and response to an n-6-enriched high-fat diet. Int. J. Mol. Sci. 2020, 21, 7829. [Google Scholar] [CrossRef] [PubMed]
  34. Vageli, D.P.; Doukas, P.G.; Siametis, A.; Judson, B.L. Targeting STAT3 prevents bile reflux-induced oncogenic molecular events linked to hypopharyngeal carcinogenesis. J. Cell. Mol. Med. 2022, 26, 75–87. [Google Scholar] [CrossRef] [PubMed]
  35. Wang, J.; Wang, X.; Xie, S.; Yan, Z.; Li, Z.; Li, Y.; Wang, L.; Jiao, F. p53 status and its prognostic role in extrahepatic bile duct cancer: A meta-analysis of published studies. Dig. Dis. Sci. 2011, 56, 655–662. [Google Scholar] [CrossRef]
  36. Liu, J.; Liu, J.; Tong, X.; Peng, W.; Wei, S.; Sun, T.; Wang, Y.; Zhang, B.; Li, W. Network pharmacology prediction and molecular docking-based strategy to discover the potential pharmacological mechanism of Huai Hua San against ulcerative colitis. Drug Des. Dev. Ther. 2021, 15, 3255–3276. [Google Scholar] [CrossRef]
  37. GB/T35892-2018; Laboratory Anima—Guideline for Ethical Review of Animal Welfare. National Standard of the People’s Republic of China: Beijing, China, 2018.
Figure 1. (A) Intersection Venn diagram and corresponding bar chart of four disease databases. (B) intersection Venn diagram and corresponding bar chart of six known components of MASH and BBD. (C) PPI image obtained from STRING. (D) PPI image visualized by Cytoscape 3.9.1. (E) Visualization of drug active ingredient target map. (F) Visualization of drug active ingredient target map. (G) Visualization of drug active ingredient target map.
Pharmaceuticals 18 01111 g001aPharmaceuticals 18 01111 g001bPharmaceuticals 18 01111 g001c
Figure 2. (A) ESR1 with quercetin; (B) IL6 with 17-beta-estradiol; (C) PPARG with quercetin; (D) STAT3 with 17-beta-estradiol; (E) TP53 with 17-beta-estradiol. Blue represents receptors, cyan represents ligands, and red represents the main interaction sites between receptor ligands.
Pharmaceuticals 18 01111 g002aPharmaceuticals 18 01111 g002b
Figure 3. (A) Changes in body weight of rats at 0, 4, 8, and 12 weeks. * represents the comparison with week 0, # represents the comparison with week 4, and + represents the comparison with week 8: ** p < 0.01, ## p < 0.01, ++ p < 0.01. (B) Liver index chart of each group of rats after treatment. (C) FIN level. (D) TNFα level. (E) MCP-1 level. (F) IL-6 level. * represents the comparison with Group A, and # represents the comparison with Group B. ** p < 0.01, # p < 0.5, ## p < 0.01.
Pharmaceuticals 18 01111 g003aPharmaceuticals 18 01111 g003b
Figure 4. (A) ALT level; (B) AST level; (C) TC level; (D) TG level; (E) HDL-C level; (F) LDL-C level; (G) FBG level; (H) HOMA-IR. * represents the comparison with Group A, and # represents the comparison with Group B. * p < 0.5, ** p < 0.01, # p < 0.5, ## p < 0.01.
Pharmaceuticals 18 01111 g004aPharmaceuticals 18 01111 g004b
Figure 5. HE staining (A) Blank control group; (B) model group; (C) low-dose BBD treatment group; (D) medium-dose BBD treatment group; (E) high-dose BBD treatment group; (F) GSKL treatment group. (Microscope magnification: 20×).
Pharmaceuticals 18 01111 g005aPharmaceuticals 18 01111 g005b
Figure 6. Oil Red O staining (A) Blank control group; (B) model group; (C) low-dose BBD treatment group; (D) medium-dose BBD treatment group; (E) high-dose BBD treatment group; (F) GSKL treatment group. (Microscope magnification: 20×).
Pharmaceuticals 18 01111 g006
Figure 7. Sirius Red staining (A) Blank control group; (B) model group; (C) low-dose BBD treatment group; (D) medium-dose BBD treatment group; (E) high-dose BBD treatment group; (F) GSKL treatment group. (Microscope magnification: 20×).
Pharmaceuticals 18 01111 g007aPharmaceuticals 18 01111 g007b
Figure 8. (A) Base peak spectrum of QC sample in positive ion mode; (B) base peak spectrum of QC sample in negative ion mode; (C) PCA score map of comparison groups A and B; (D) OPLS-DA score map of comparison groups A and B; (E) OPLS-DA permutation test map of comparison groups A and B; (F) PCA score map of comparison groups B and D; (G) OPLS-DA score map of comparison groups B and D; (H) OPLS-DA permutation test map of comparison groups B and D. The blue dots represent the R2Y or Q2Y values of the model after permutation; The red dots represent the true values of the original model. The line passing through the blue dot is the regression line, which is the trend line of the permutation test results, showing the distribution of R2Y/Q2Y with increasing permutation times; The line passing through the red dot is the reference line, which is the value of the original model used to compare the significance of the permutation results.
Pharmaceuticals 18 01111 g008aPharmaceuticals 18 01111 g008b
Figure 9. (A) Comparison of top 30 differential metabolites and VIP charts for group A and B; (B) comparison of top 30 differential metabolites and VIP charts for group B and D; (C) shake point plots for NEG10082; (D) shake point plots for Piceid; (E) shake point plots for cryptochlorogenic acid; (F) shake point plots for hyodeoxycholic acid.
Pharmaceuticals 18 01111 g009aPharmaceuticals 18 01111 g009b
Figure 10. (A) Comparison of KEGG enrichment bubble plots in group A vs. B (top 30); (B) KEGG enrichment bubble chart of comparison group B vs. D (Top 30); (C) comparison of KEGG enrichment bubble charts for group A, B, and D (top 30); (D) functional interaction network diagram of pathways; (E) KEGG mapping of bile secretion pathway; (F) KEGG mapping of the PI3K Akt signaling pathway. M, metabolism; G, genetic information processing; E, environmental information processing; C, cellular processes; O, organismal systems; H, human diseases; D, drug development. The horizontal coordinate represents the negative logarithmic transformation of the p-value and the vertical coordinate represents the pathway name. Attributing pathways to the level 1 category, the pathways in each category decreased from top to bottom −log10 (p-value), i.e., the p-value increased and the significance decreased sequentially. The size of the circle indicates count, i.e., the number of differential metabolites annotated to the pathway; the color of the circle corresponds to the corrected p-value, which is more significant from red to blue.
Pharmaceuticals 18 01111 g010aPharmaceuticals 18 01111 g010bPharmaceuticals 18 01111 g010cPharmaceuticals 18 01111 g010d
Table 1. The active ingredients of BBD.
IngredientNumberBioactive CompoundMolecular FormulaRelative Molecular MassKey Effects
Ling Yang JiaoLYJ1AlanineC3H7NO289.09 g/molAntipyretic, sedative, and liver-clearing
LYJ2ArginineC6H14N4O2174.2 g/mol
LYJ3Aspartic acidC4H7NO4133.1 g/mol
LYJ4CysteineC3H7NO2S121.16 g/mol
LYJ5Glutamic acidC5H9NO4147.13 g/mol
LYJ6HistidineC6H9N3O2155.15 g/mol
LYJ7IsoleucineC6H13NO2131.17 g/mol
LYJ8LeucineC6H13NO2131.17 g/mol
LYJ9L-ValineC5H11NO2117.15 g/mol
LYJ10MethionineC5H11NO2S149.21 g/mol
LYJ11PhenylalanineC9H11NO2165.19 g/mol
LYJ12ProlineC5H9NO2115.13 g/mol
LYJ13TryptophanC11H12N2O2204.22 g/mol
LYJ14TyrosineC9H11NO3181.19 g/mol
LYJ15ThreonineC4H9NO3119.12 g/mol
Niu HuangNH112α-Trihydroxy-5β-cholestane-24-oic acid methyl esterC25H42O5422.6 g/molAntispasmodic and neuroprotective
NH2Deoxycholic acid methyl esterC25H42O4406.6 g/mol
NH3Deoxycholic acidC24H40O4392.6 g/mol
NH4ZINC01280365C21H30O3330.5 g/mol
NH5CholesterolC27H46O386.7 g/mol
San QiSQ1GlycyrrhizinC15H12O4256.25 g/molHemostatic and anti-fibrotic
SQ2QuercetinC15H10O7302.23 g/mol
SQ3Diisooctyl phthalateC24H38O4390.6 g/mol
SQ4β-SitosterolC29H50O414.7 g/mol
SQ5Soy sterolsC29H48O412.7 g/mol
SQ6Ethyl linoleateC20H36O2308.5 g/mol
She DanSD1Bile acidsC24H40O5408.6 g/molHepatoprotective and antimicrobial
SD2Glycocholic acidC26H43NO6465.6 g/mol
SD3α-Usodeoxycholic acidC24H40O6424.6 g/mol
SD4Taurocholic acidC26H45NO7S515.7 g/mol
She XiangSX1Androst-4-ene-3,17-dioneC19H26O2286.4 g/molNeurostimulant and cardioprotective
SX2TestosteroneC19H28O2288.4 g/mol
SX33,5-Dihydroxybenzoic acidC7H6O4154.12 g/mol
SX4MuseninC51H82O211031.2 g/mol
SX517β-EstradiolC18H24O2272.4 g/mol
SX6AllantoinC4H6N4O3158.12 g/mol
SX73-Methylcyclotridecan-1-oneC14H26O210.36 g/mol
SX8Musk pyridineC16H25N231.38 g/mol
SX9SCHEMBL2197370C15H26O222.37 g/mol
SX10DecylamineC30H40Cl2N4527.6 g/mol
SX11Musk lactone A1C8H18O5S226.29 g/mol
SX12MethylpiperonylphenolC10H12O148.2 g/mol
SX13Cyclotetradecan-1-oneC14H26O210.36 g/mol
SX143β-hydroxy-5α-androstan-17-oneC19H30O2290.4 g/mol
SX15α-EstradiolC18H24O2272.4 g/mol
SX16AndrostenoneC19H30O2290.4 g/mol
SX17CyclopentadienoneC26H46N2O402.7 g/mol
SX18CholesterolC27H46O386.7 g/mol
SX19Musk ketoneC16H30O238.41 g/mol
SX202,6-decamethylene pyridineC15H23N217.35 g/mol
SX213α-hydroxy-5α-androstan-17-oneC19H30O2290.4 g/mol
SX22DiethyltoluamideC12H17NO191.27 g/mol
SX23Musk ketoneC15H28O224.38 g/mol
SX242,6-NinomethylidenepyridineC14H21N203.32 g/mol
SX255-cis-cyclotetradecen-1-oneC14H24O208.34 g/mol
Zhen ZhuZZ1AluminumAl26.981 g/molSedative and corneal repair
ZZ2CopperCu63.55 g/mol
ZZ3IronFe55.84 g/mol
ZZ4SiliconSi28.085 g/mol
‘Ingredient’ refers to the six main active ingredients of BBD, and ‘Number’ refers to the bioactive compounds corresponding to each of the six main active ingredients.
Table 2. The top 10 core targets screened by Centiscape2.2.
Betweenness unDirCloseness unDirDegree unDirName
1301.0639940.005291005250INS
827.15775150.005076142234TNF
648.09109670.005050505234AKT1
724.09594970.005076142234IL6
763.39847810.005000000230TP53
682.07823690.004878049220PPARG
482.44195340.004854369216IL1B
595.34560630.004784689214ESR1
542.90454890.004739336210STAT3
325.82175090.004739336208JUN
Table 3. The binding energy between the top 10 core targets and their corresponding components.
ProteinLigandBinding Energy (kcal/mol)
INSquercetin−6.6
TNFquercetin−6.8
AKT1quercetin−6.3
IL617-beta-estradiol−7.2
TP5317-beta-estradiol−7.7
PPARGquercetin−7.1
IL1BDFV−7.0
ESR1quercetin−7.3
STAT317-beta-estradiol−7.4
JUNglycocholic acid−5.6
Table 4. OPLS-DA model evaluation parameters.
Comparison GroupR2X (cum)R2Y (cum)Q2 (cum)RMSEE
A vs. B0.3160.990.8970.0543
B vs. D0.2910.9660.5290.102
Disclaimer/Publisher’s Note: The statements, opinions and data contained in all publications are solely those of the individual author(s) and contributor(s) and not of MDPI and/or the editor(s). MDPI and/or the editor(s) disclaim responsibility for any injury to people or property resulting from any ideas, methods, instructions or products referred to in the content.

