
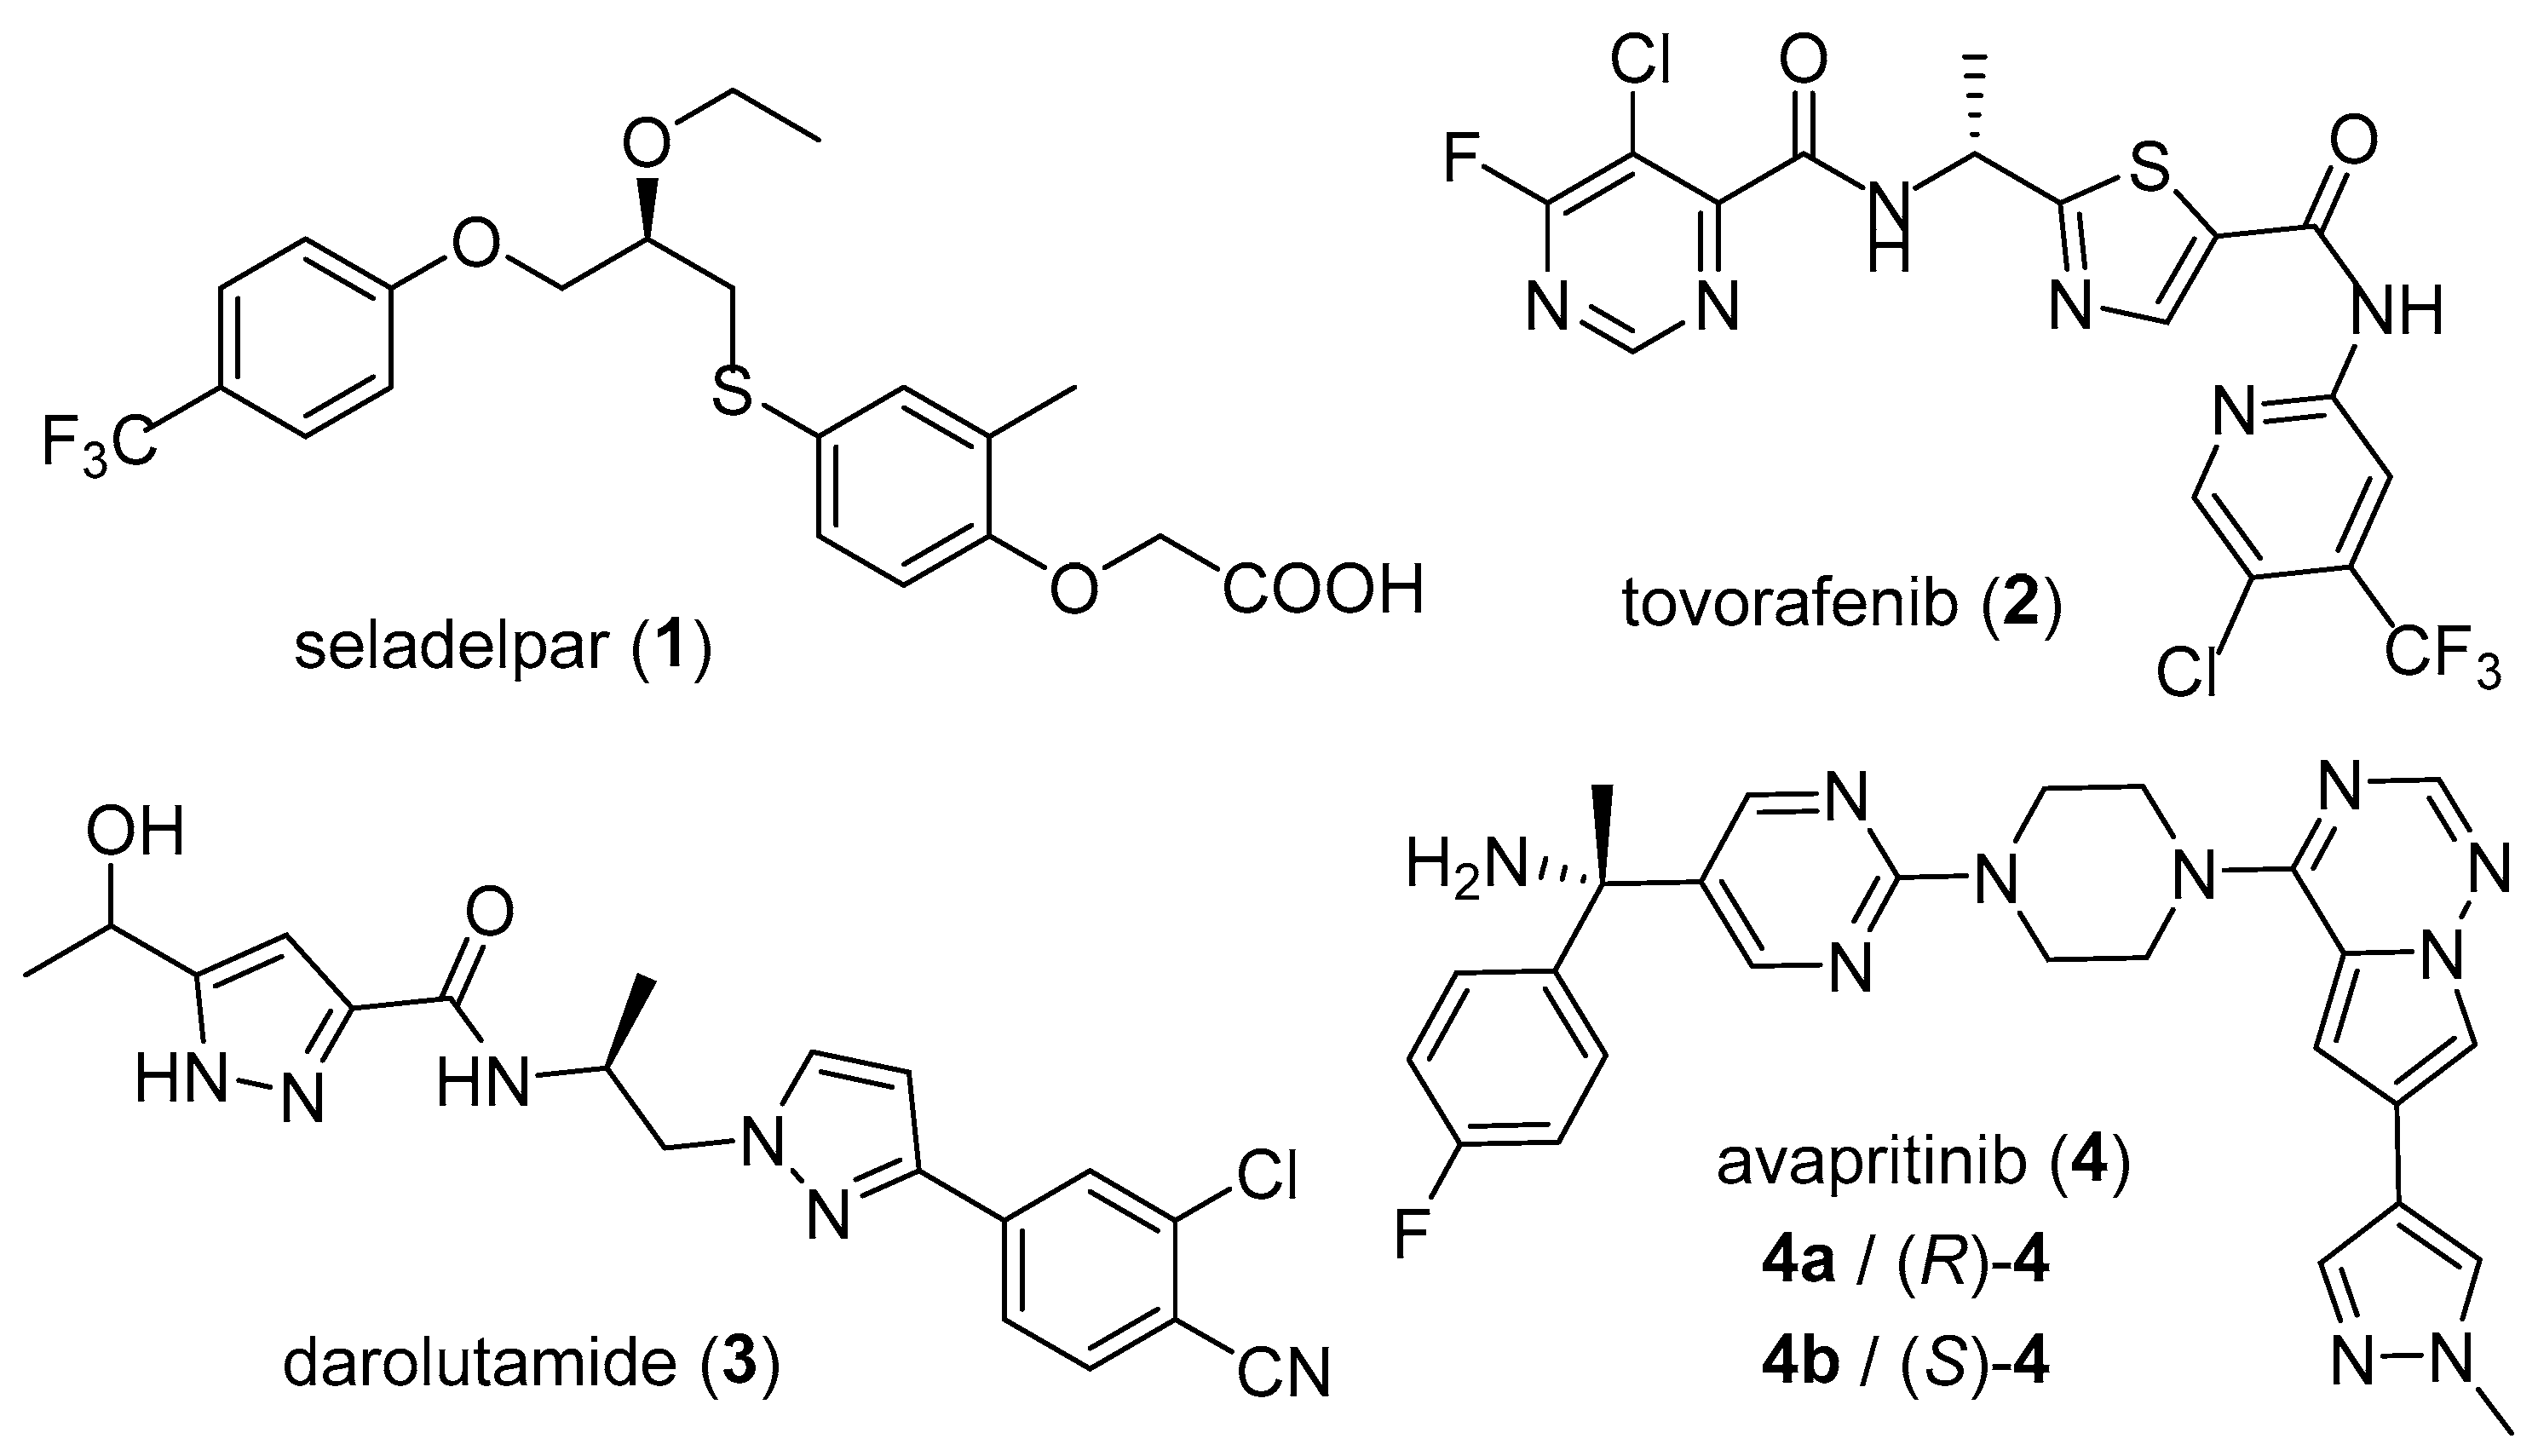
Absolute Configuration and Chiroptical Properties of Flexible Drug Avapritinib


Abstract

1. Introduction
2. Results
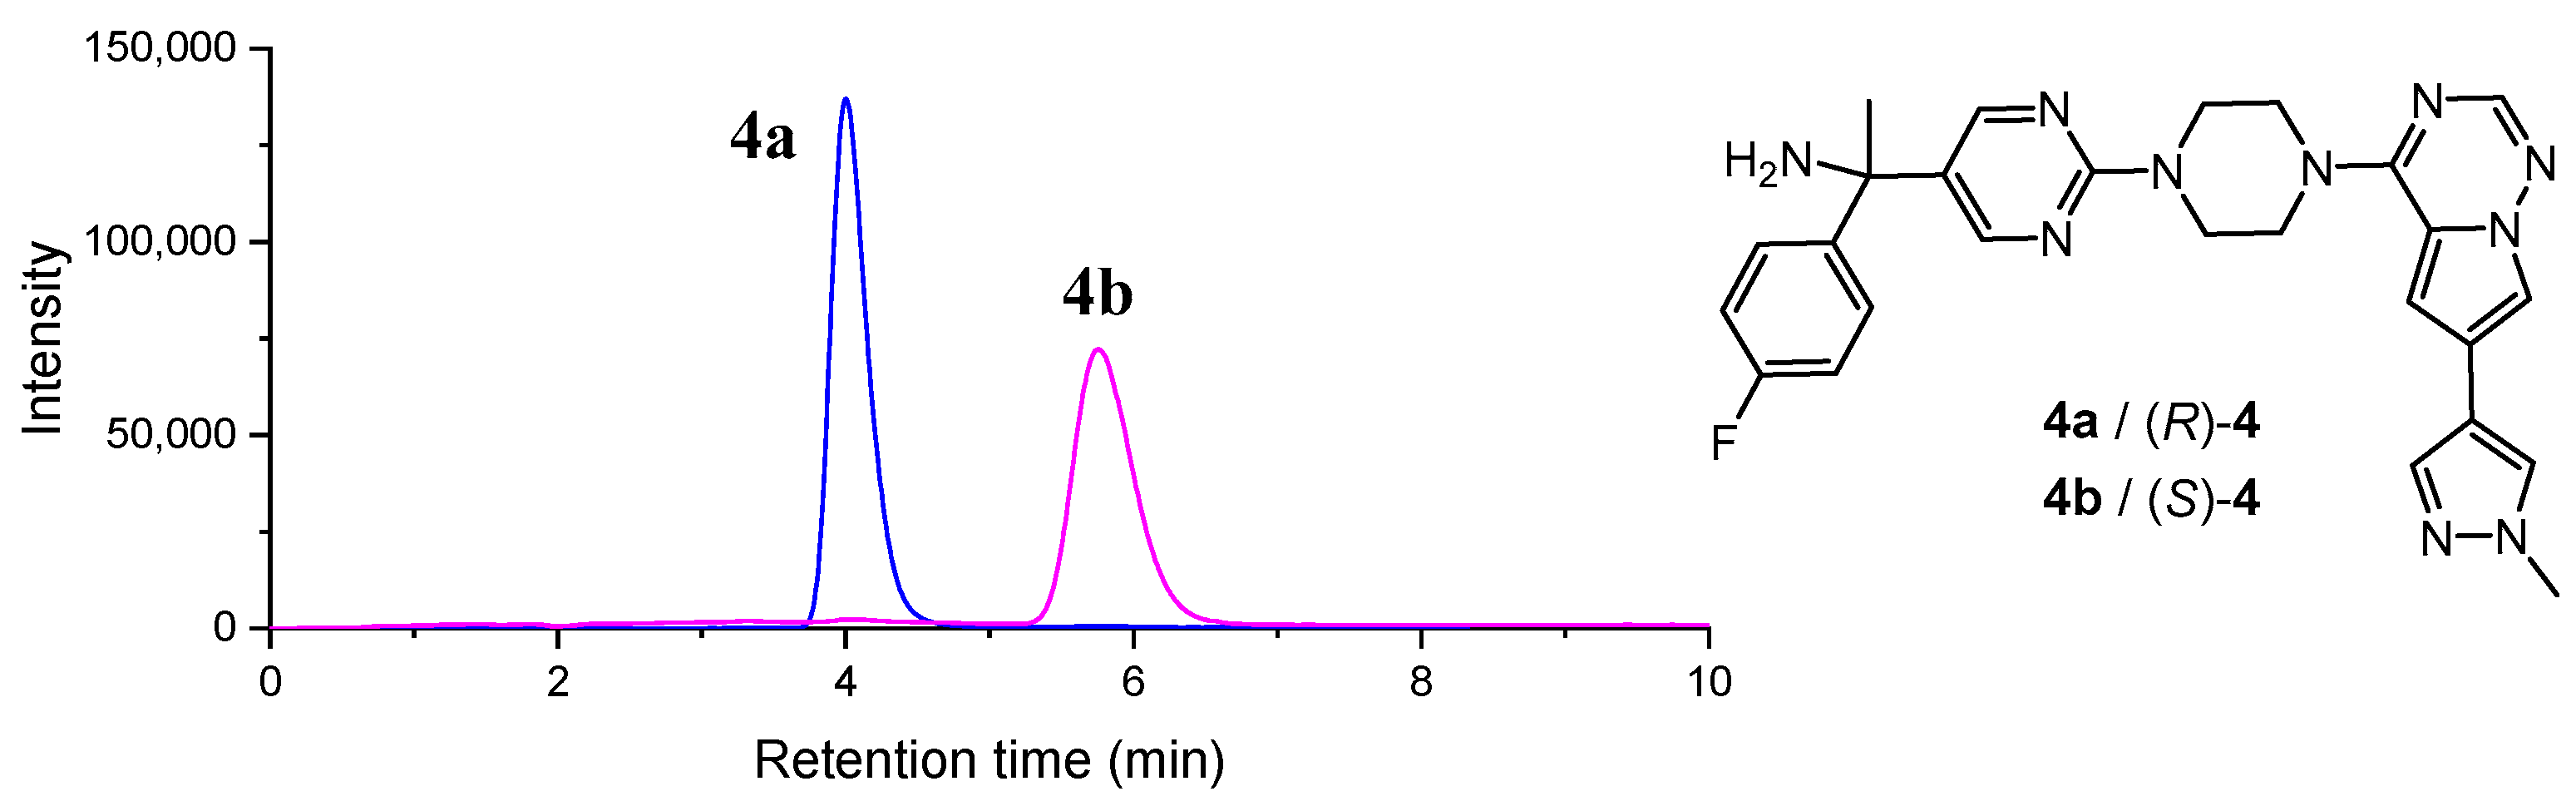
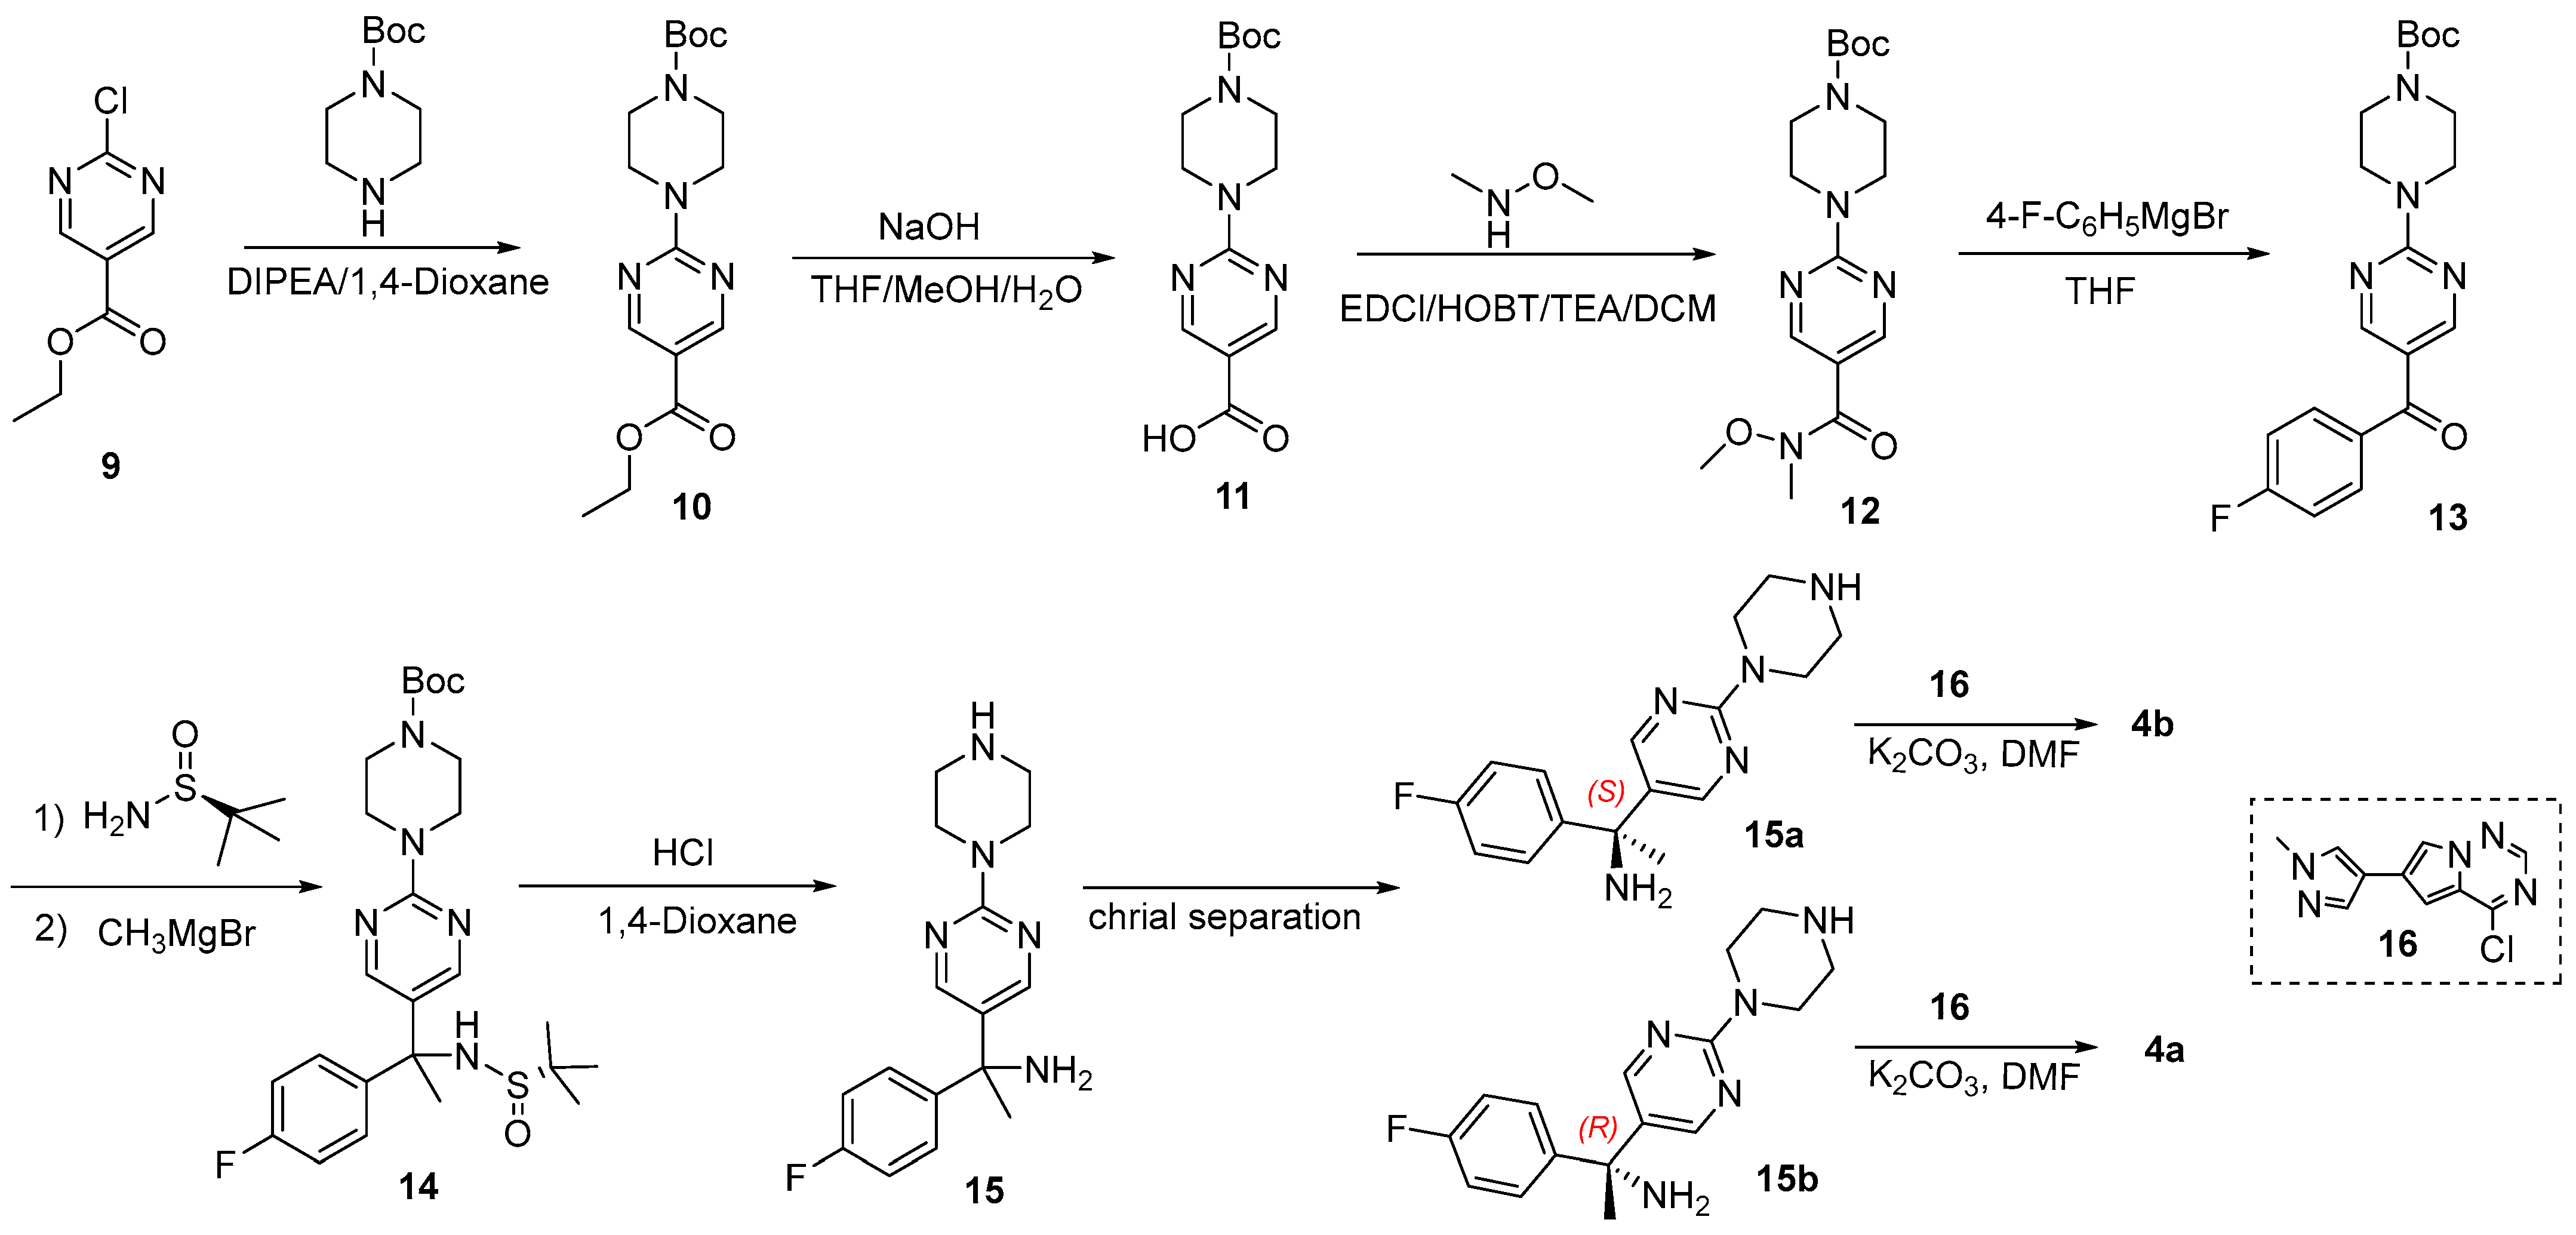
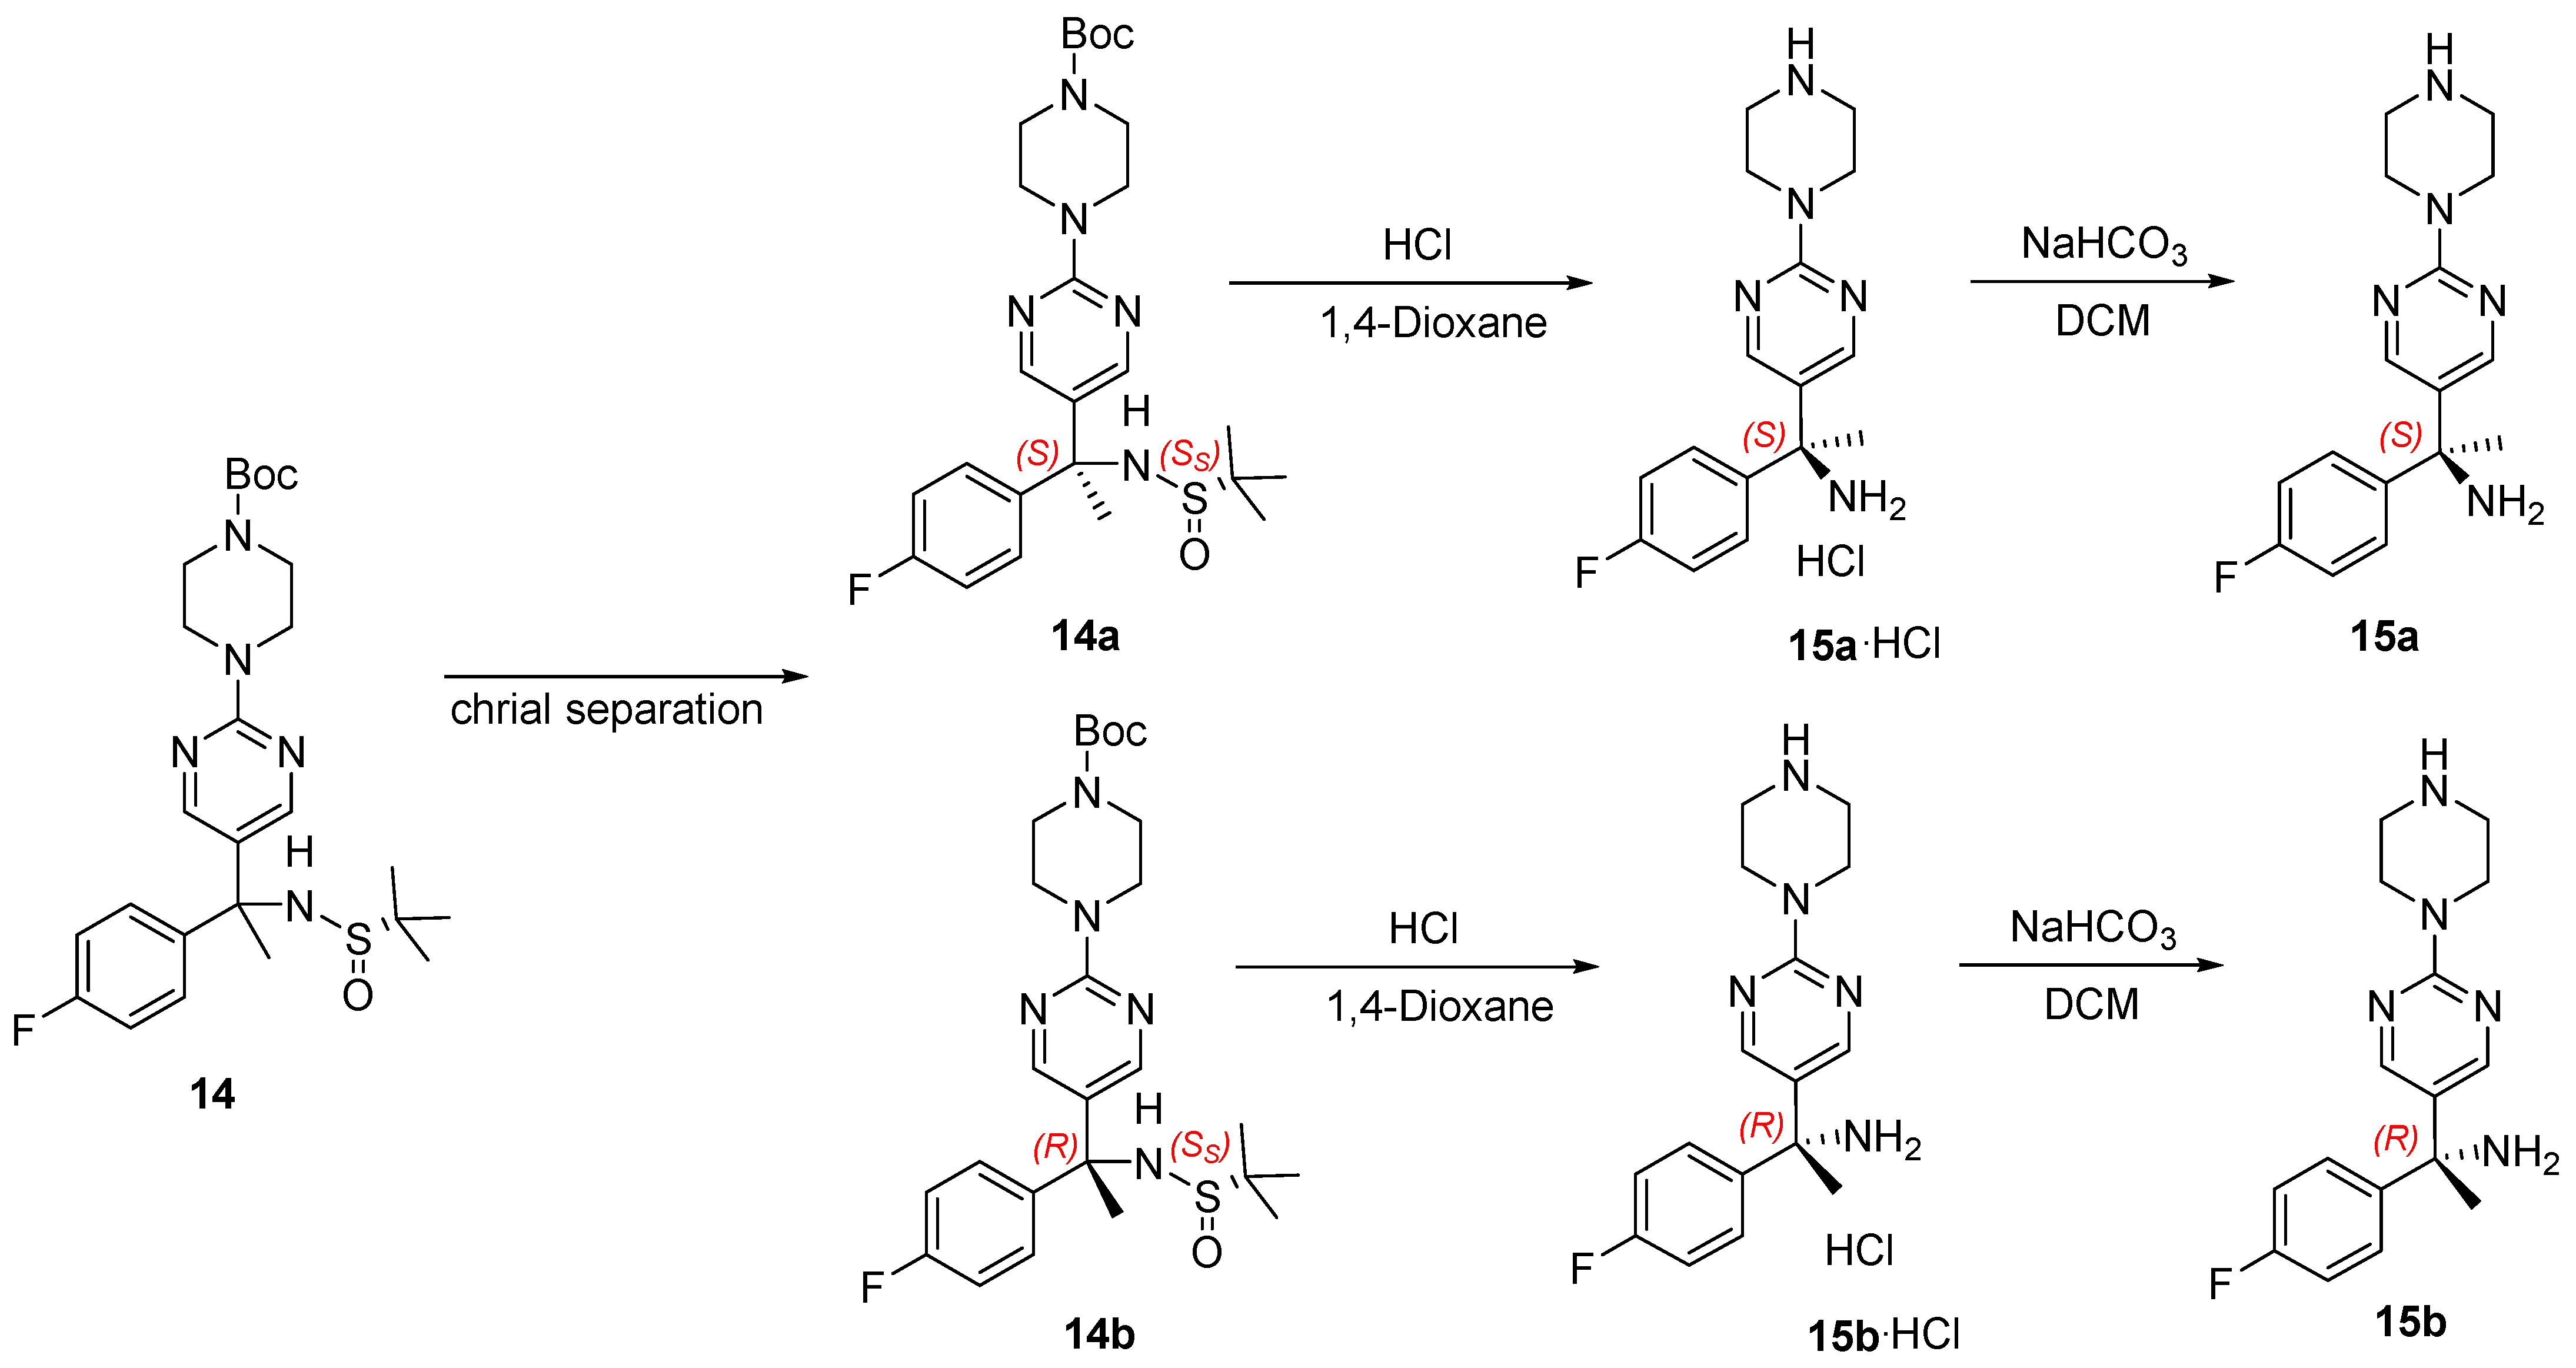
2.1. Chiral Resolution of Rac-4
2.2. Experimental Chiral Spectroscopy of 4a and 4b
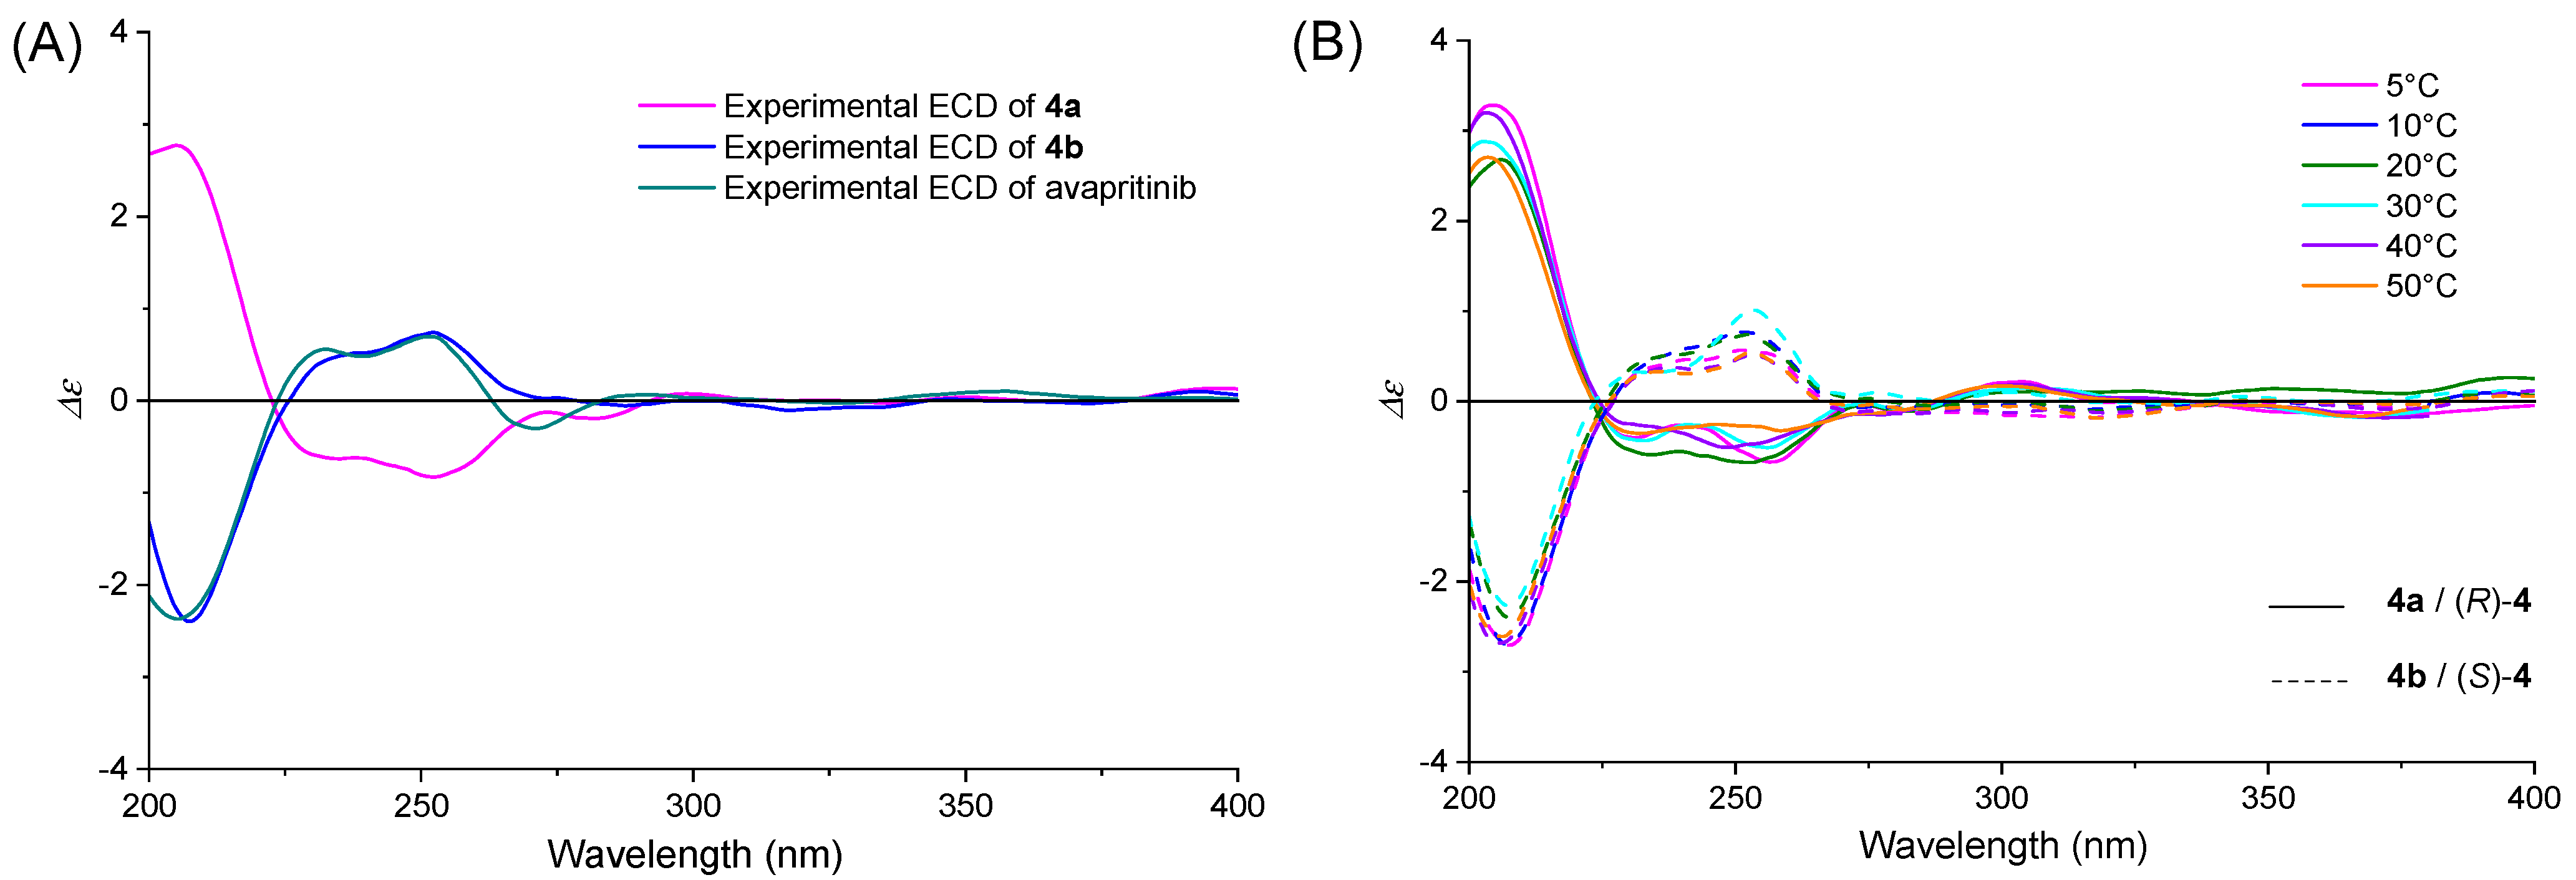
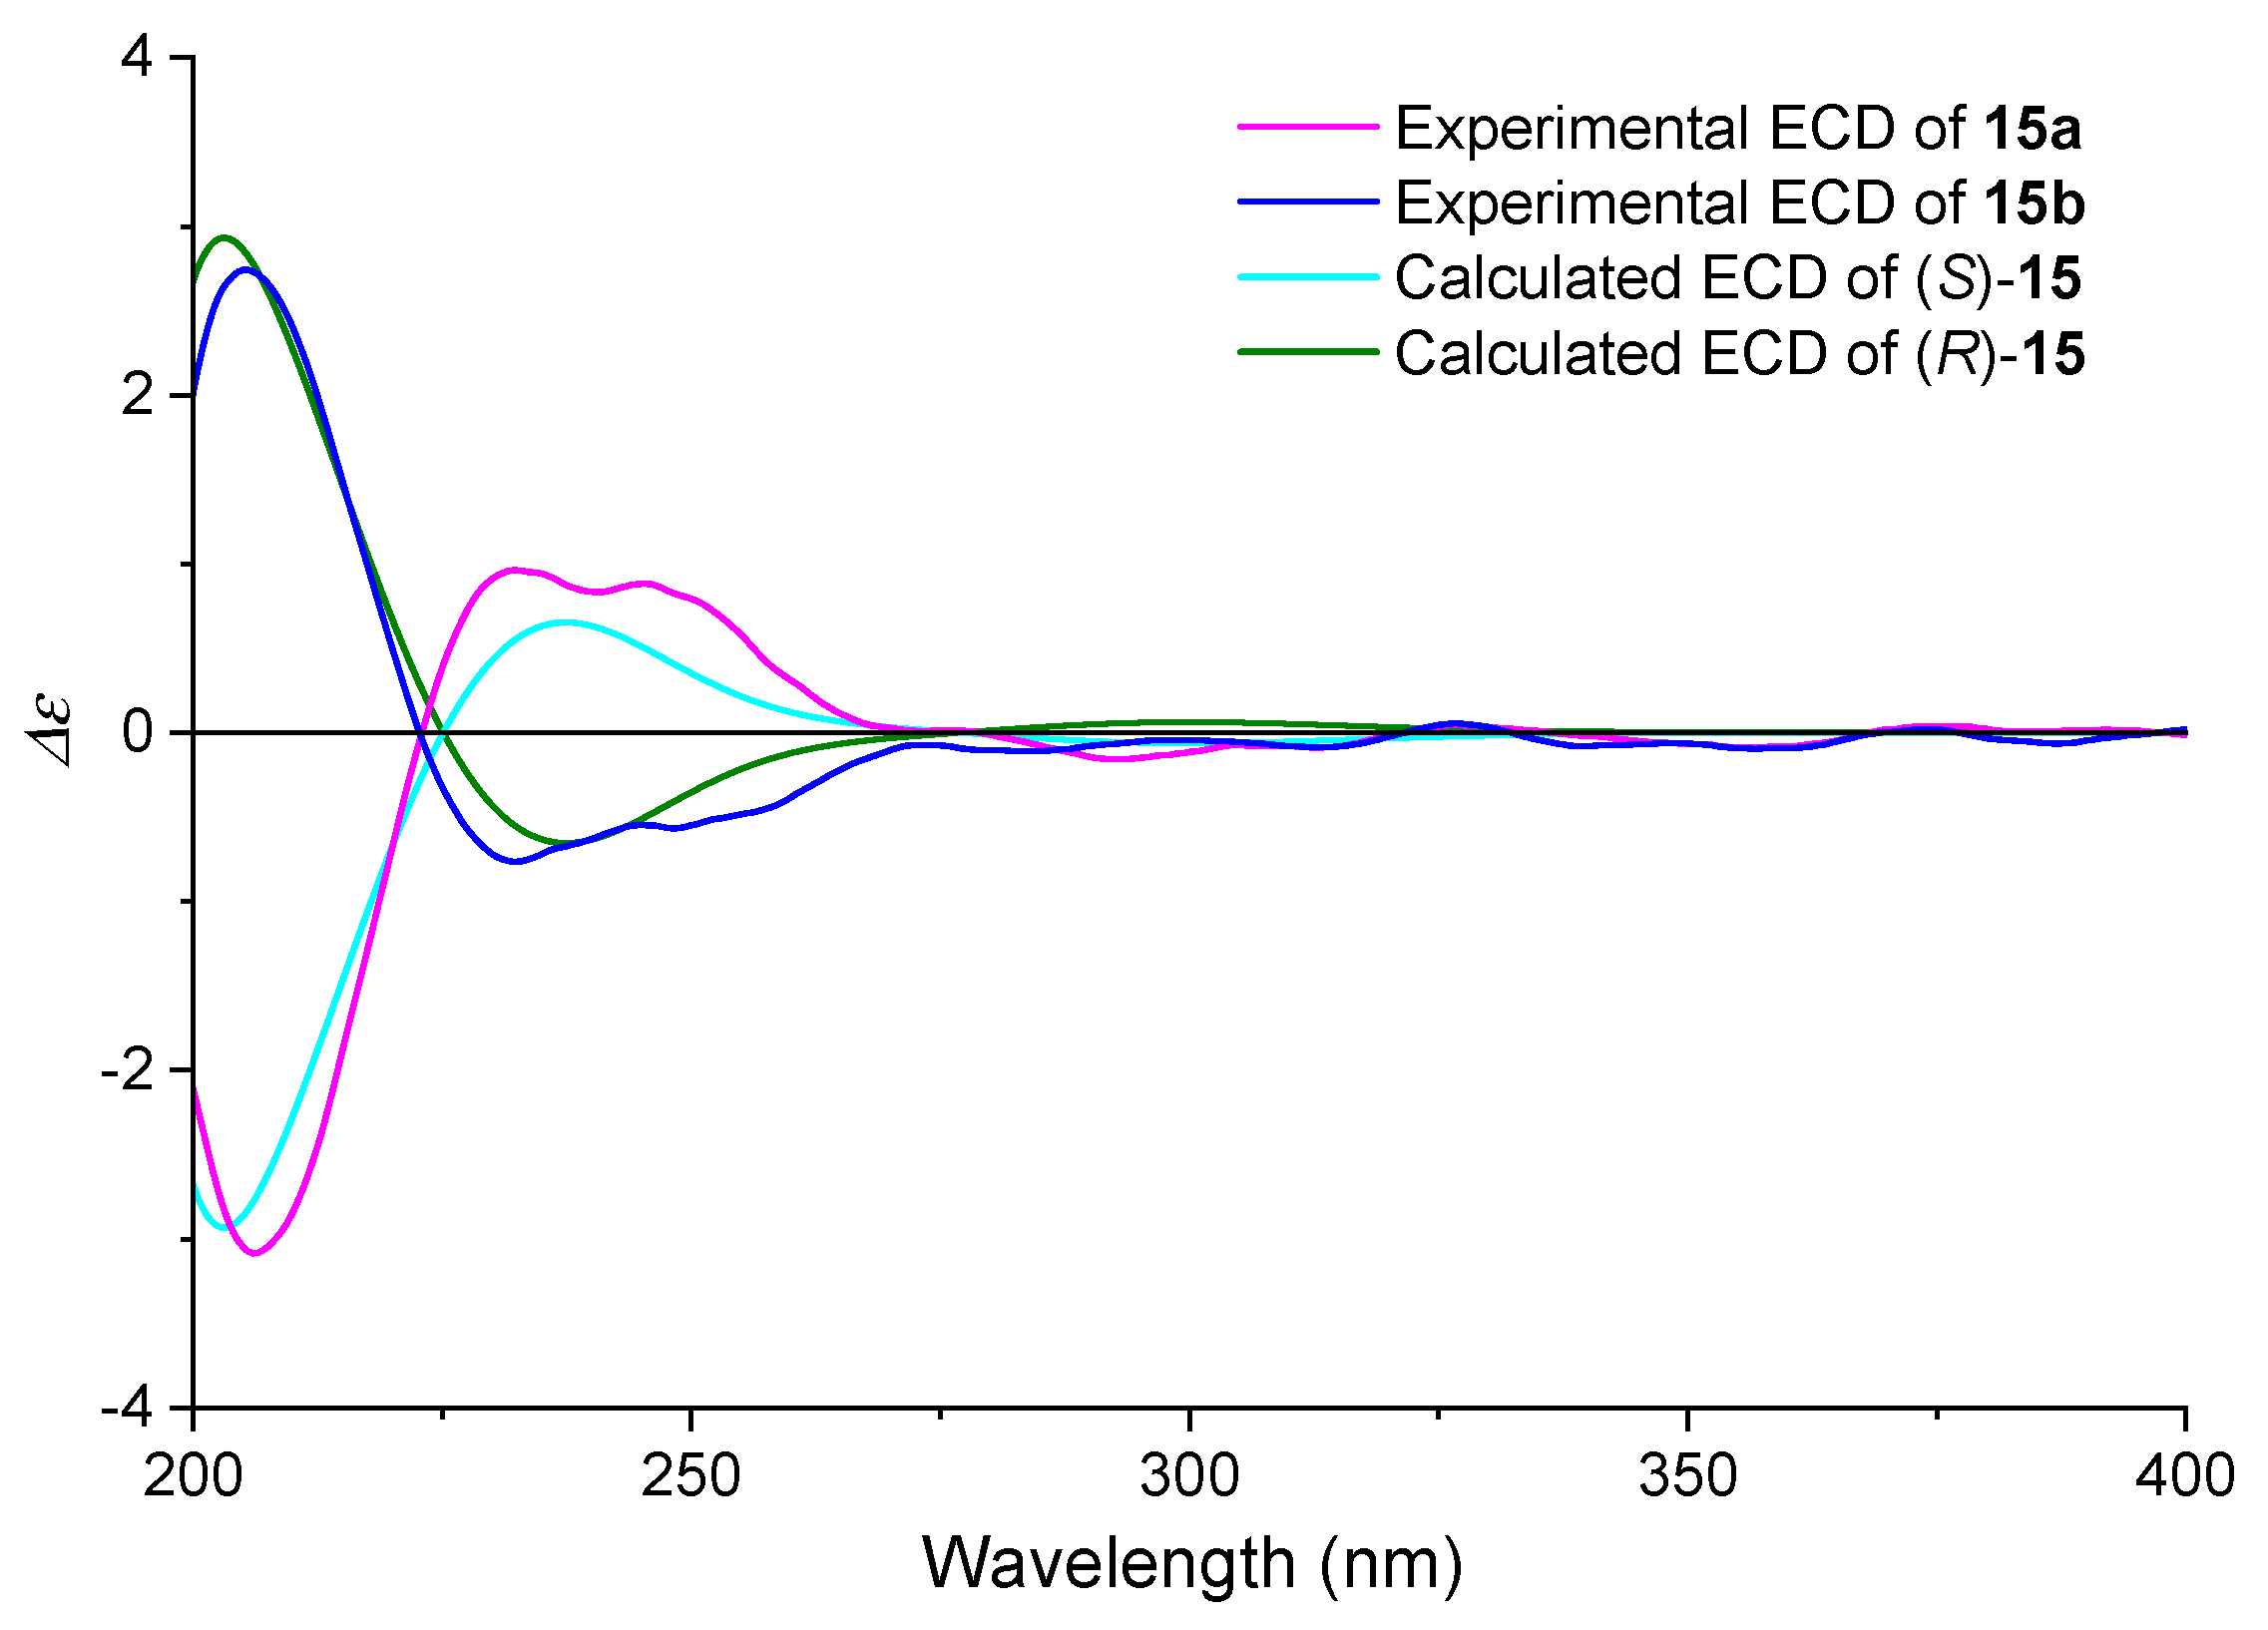
2.2.1. ECD Spectra
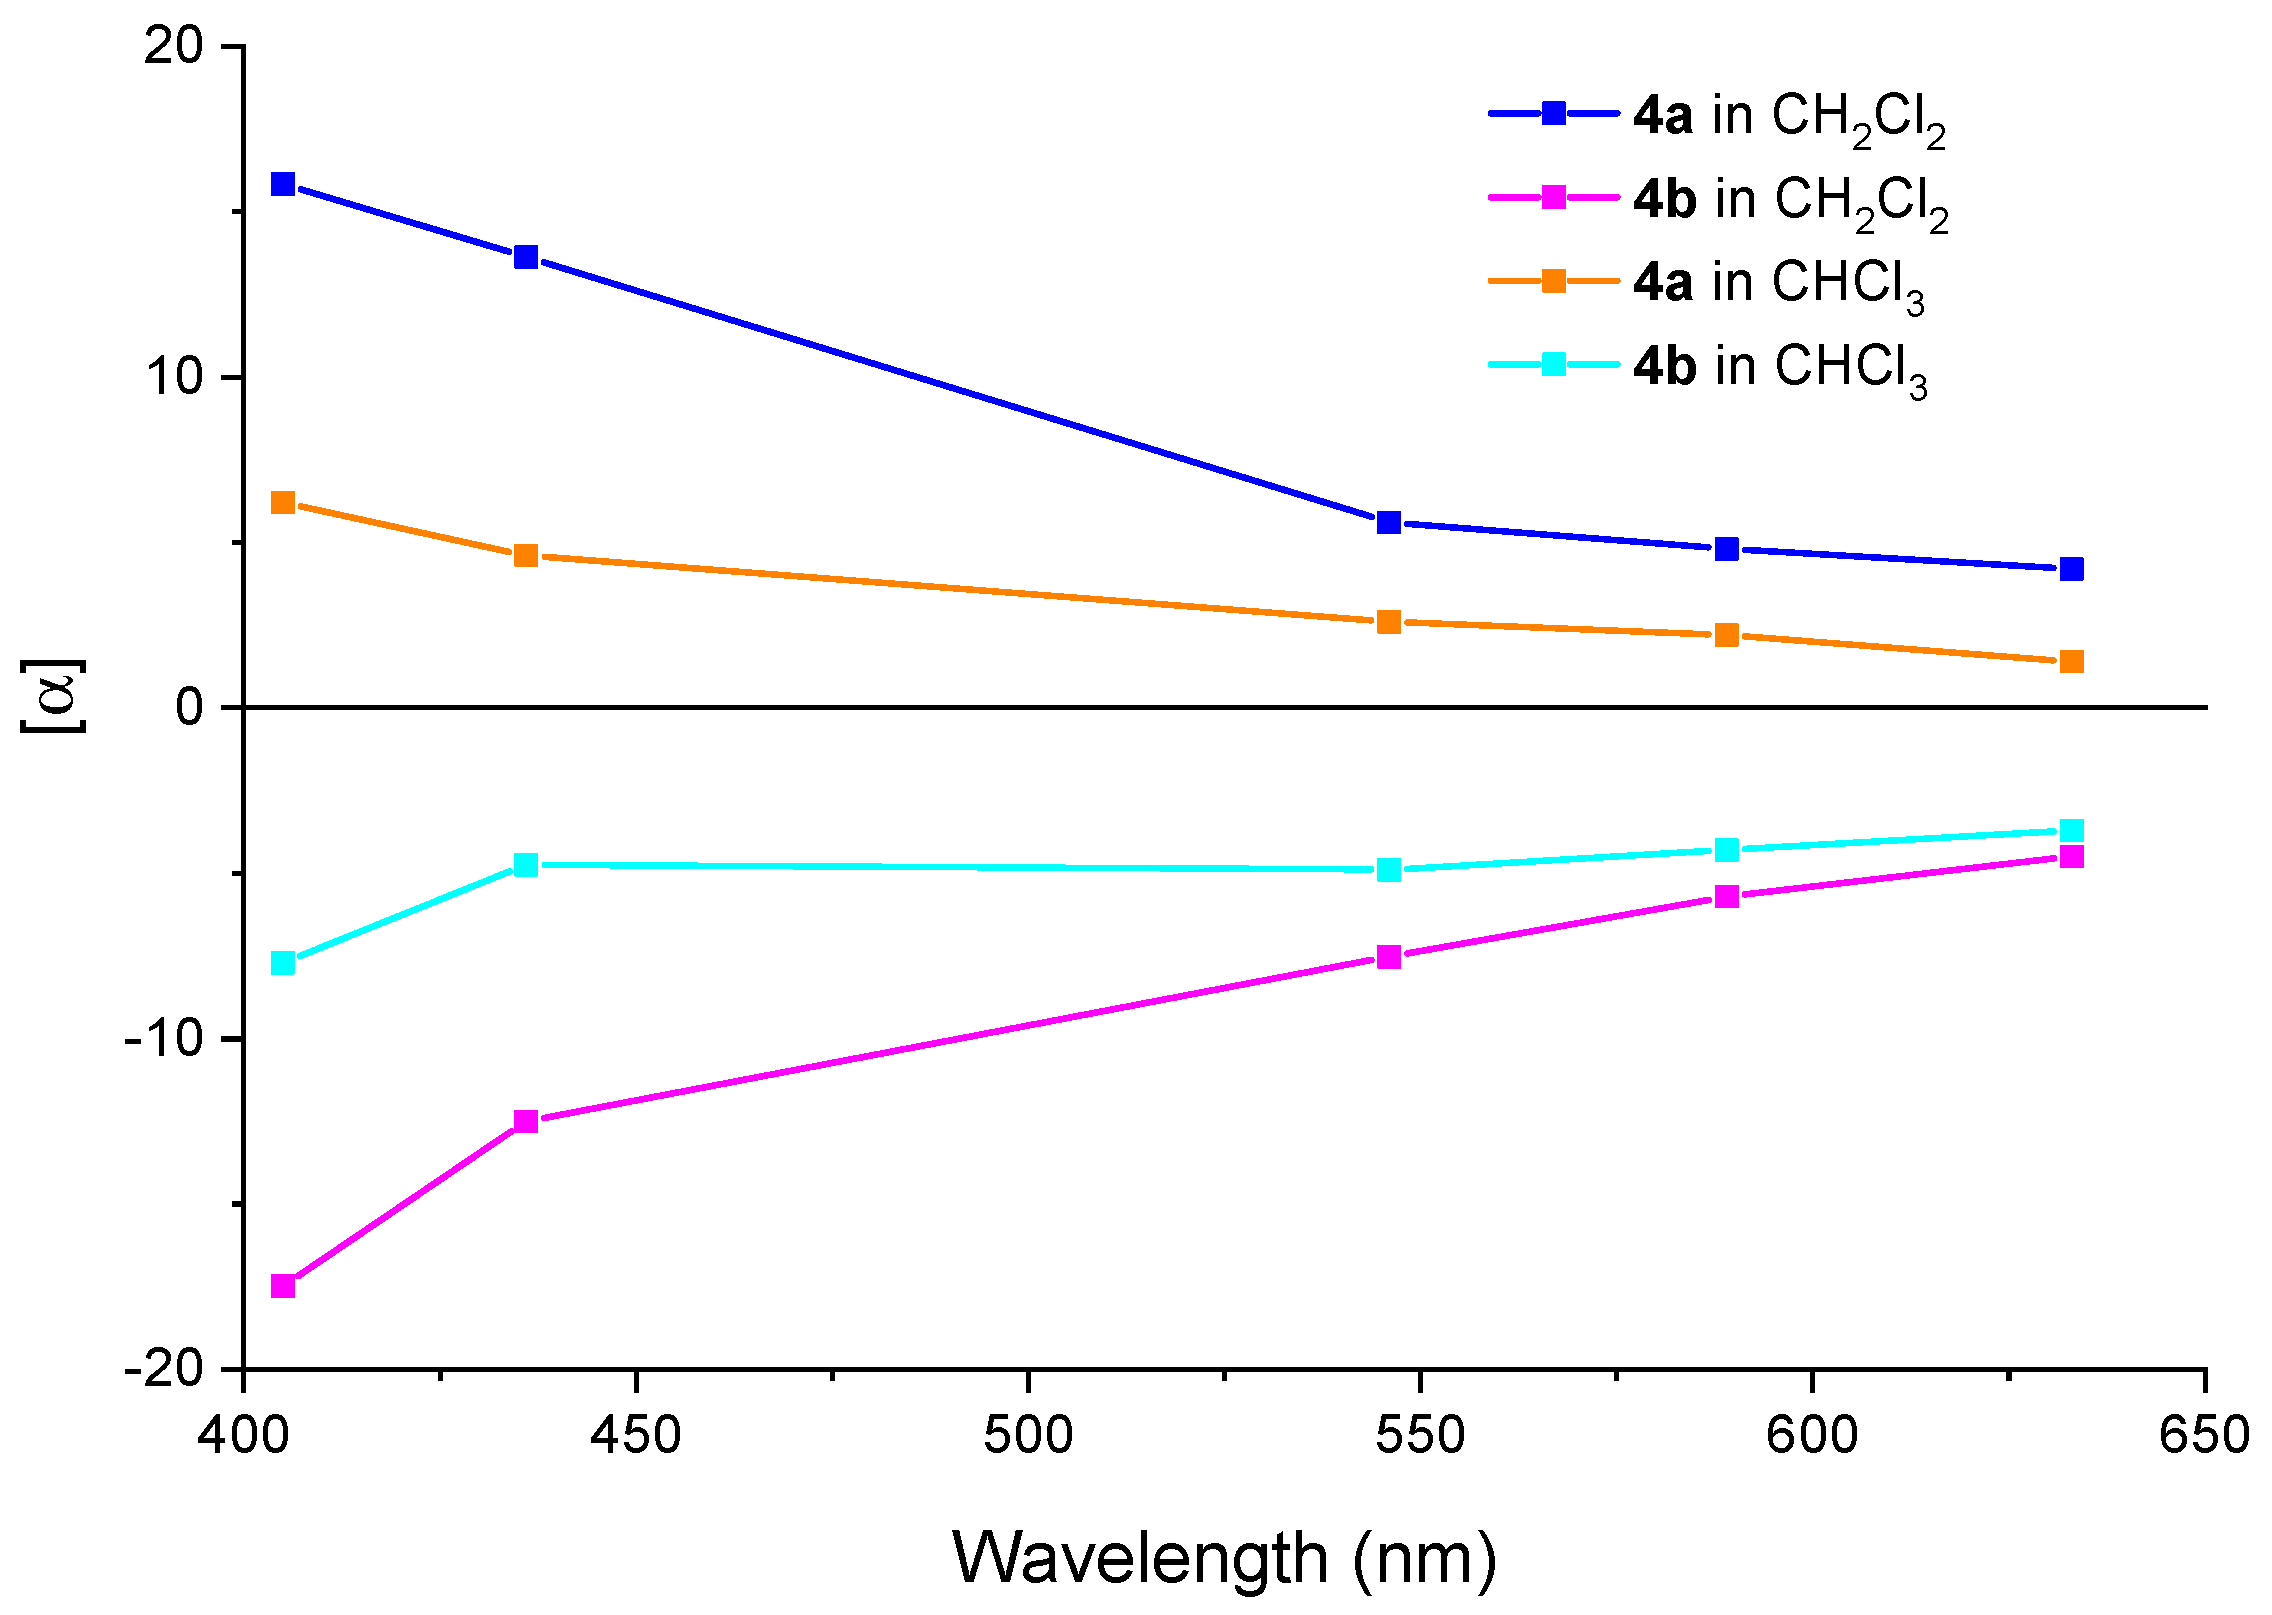
2.2.2. ORD
2.2.3. VCD Spectra
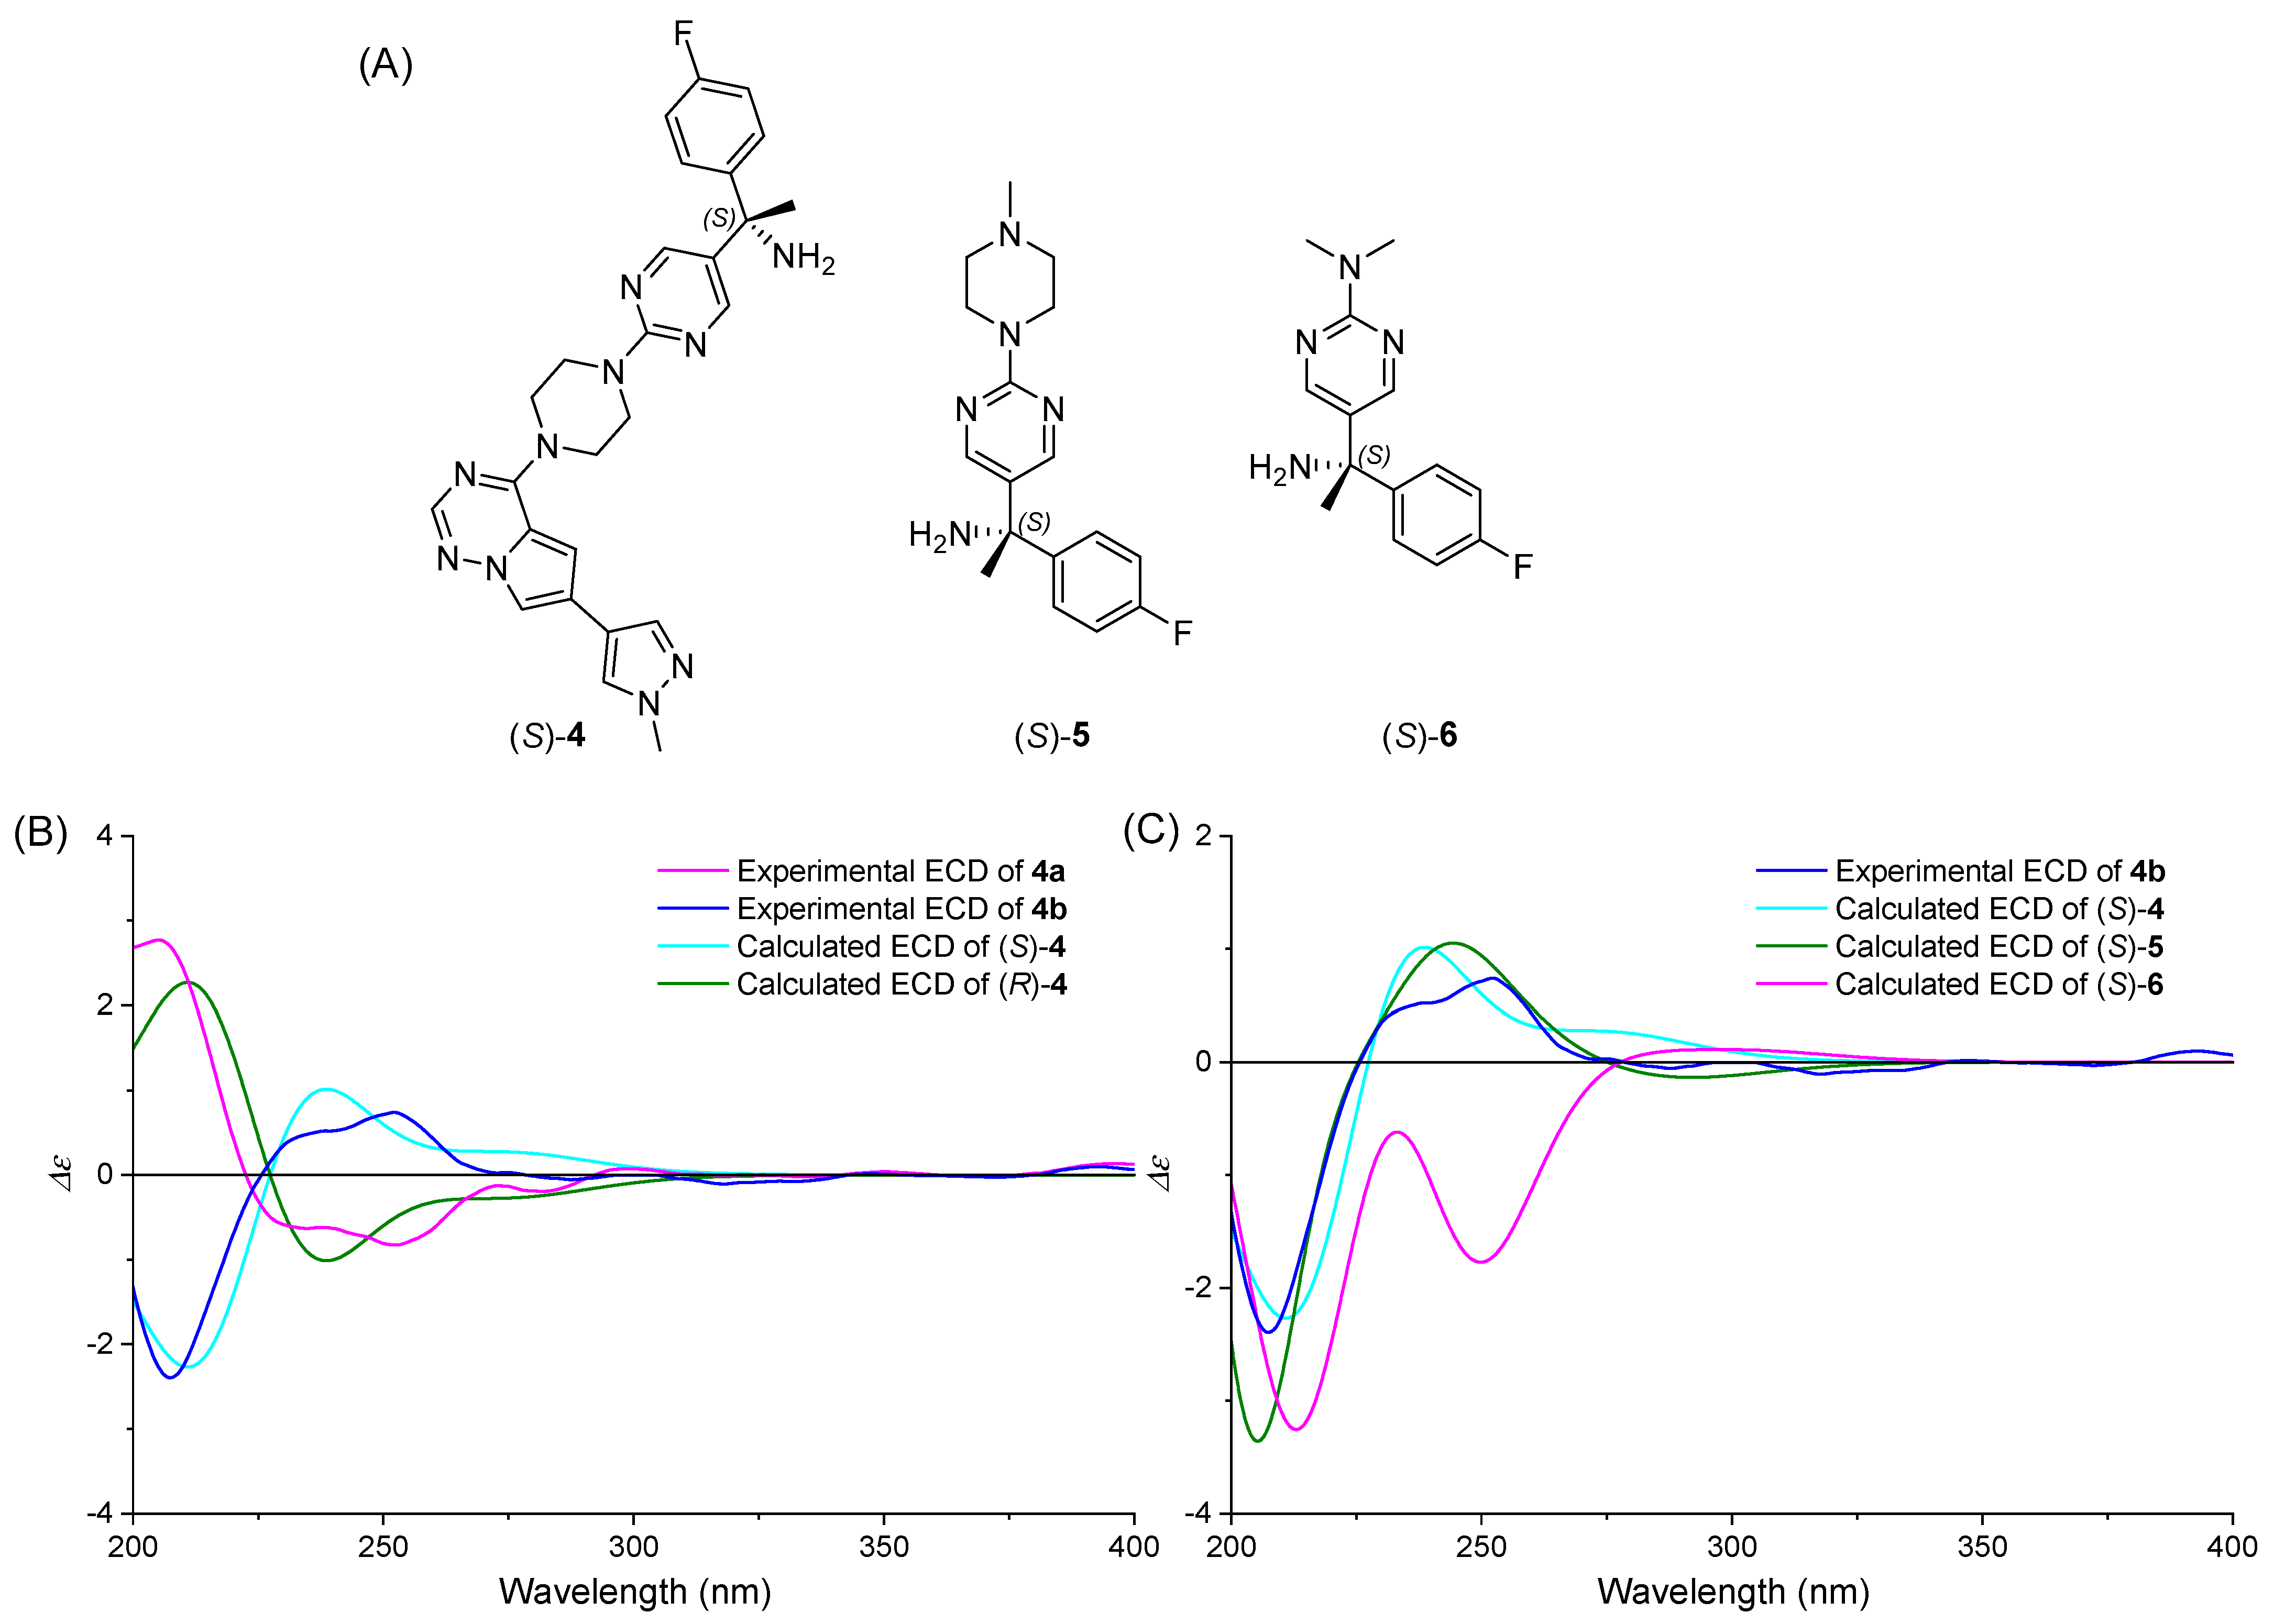
2.3. Absolute Configuration Assignment of 4a and 4b
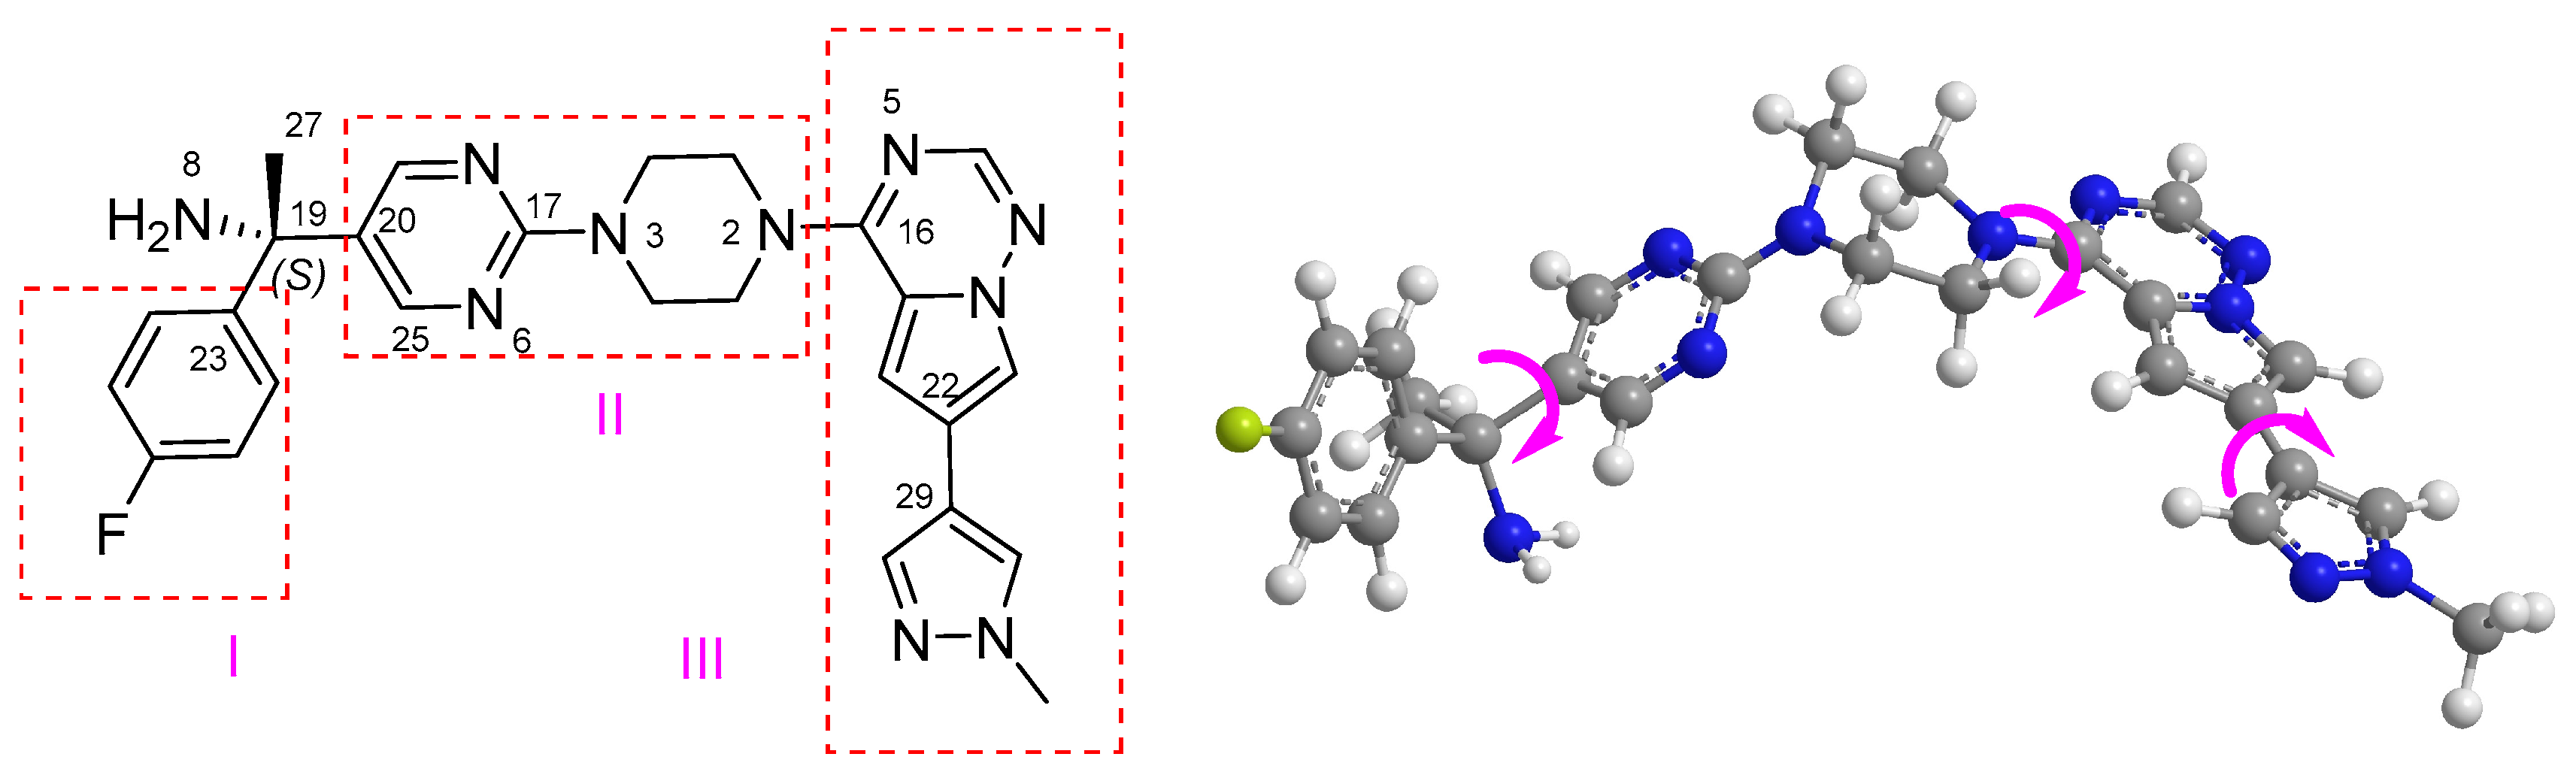
2.3.1. Conformational Analysis of 4
2.3.2. ECD Simulation
2.3.3. SOR and ORD Simulation
2.4. Confirmation of Absolute Configuration Assignment
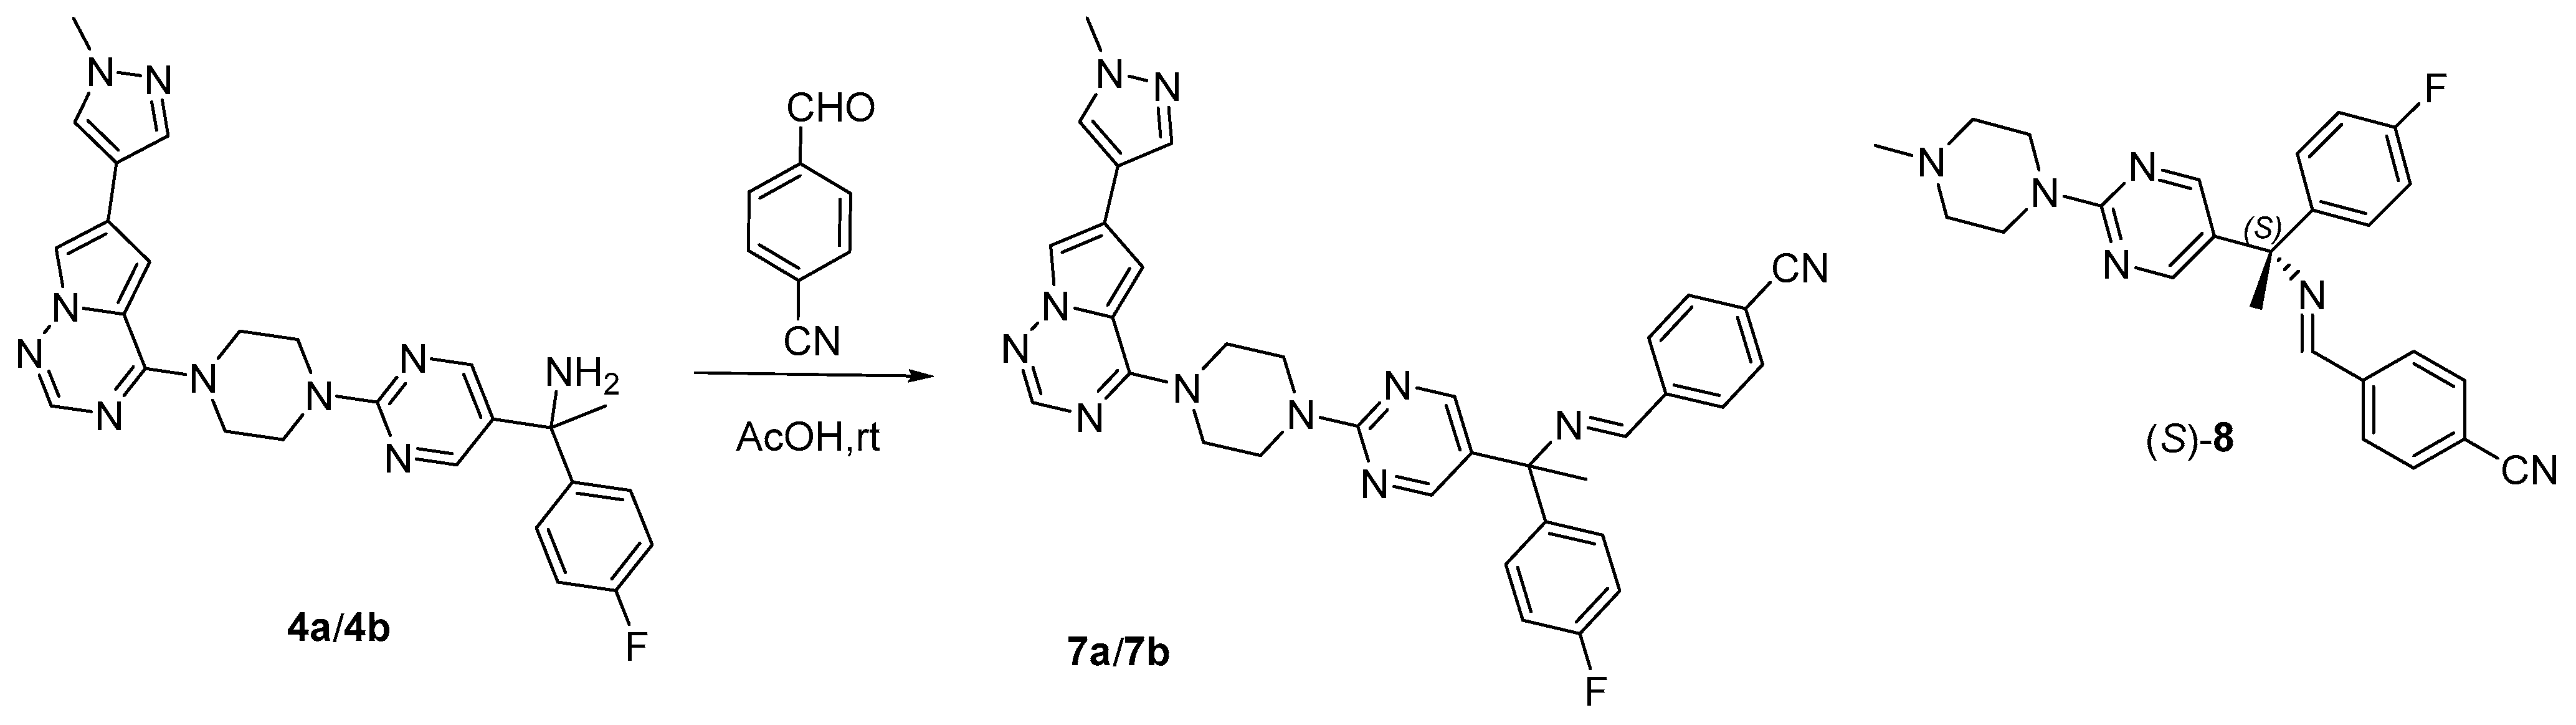
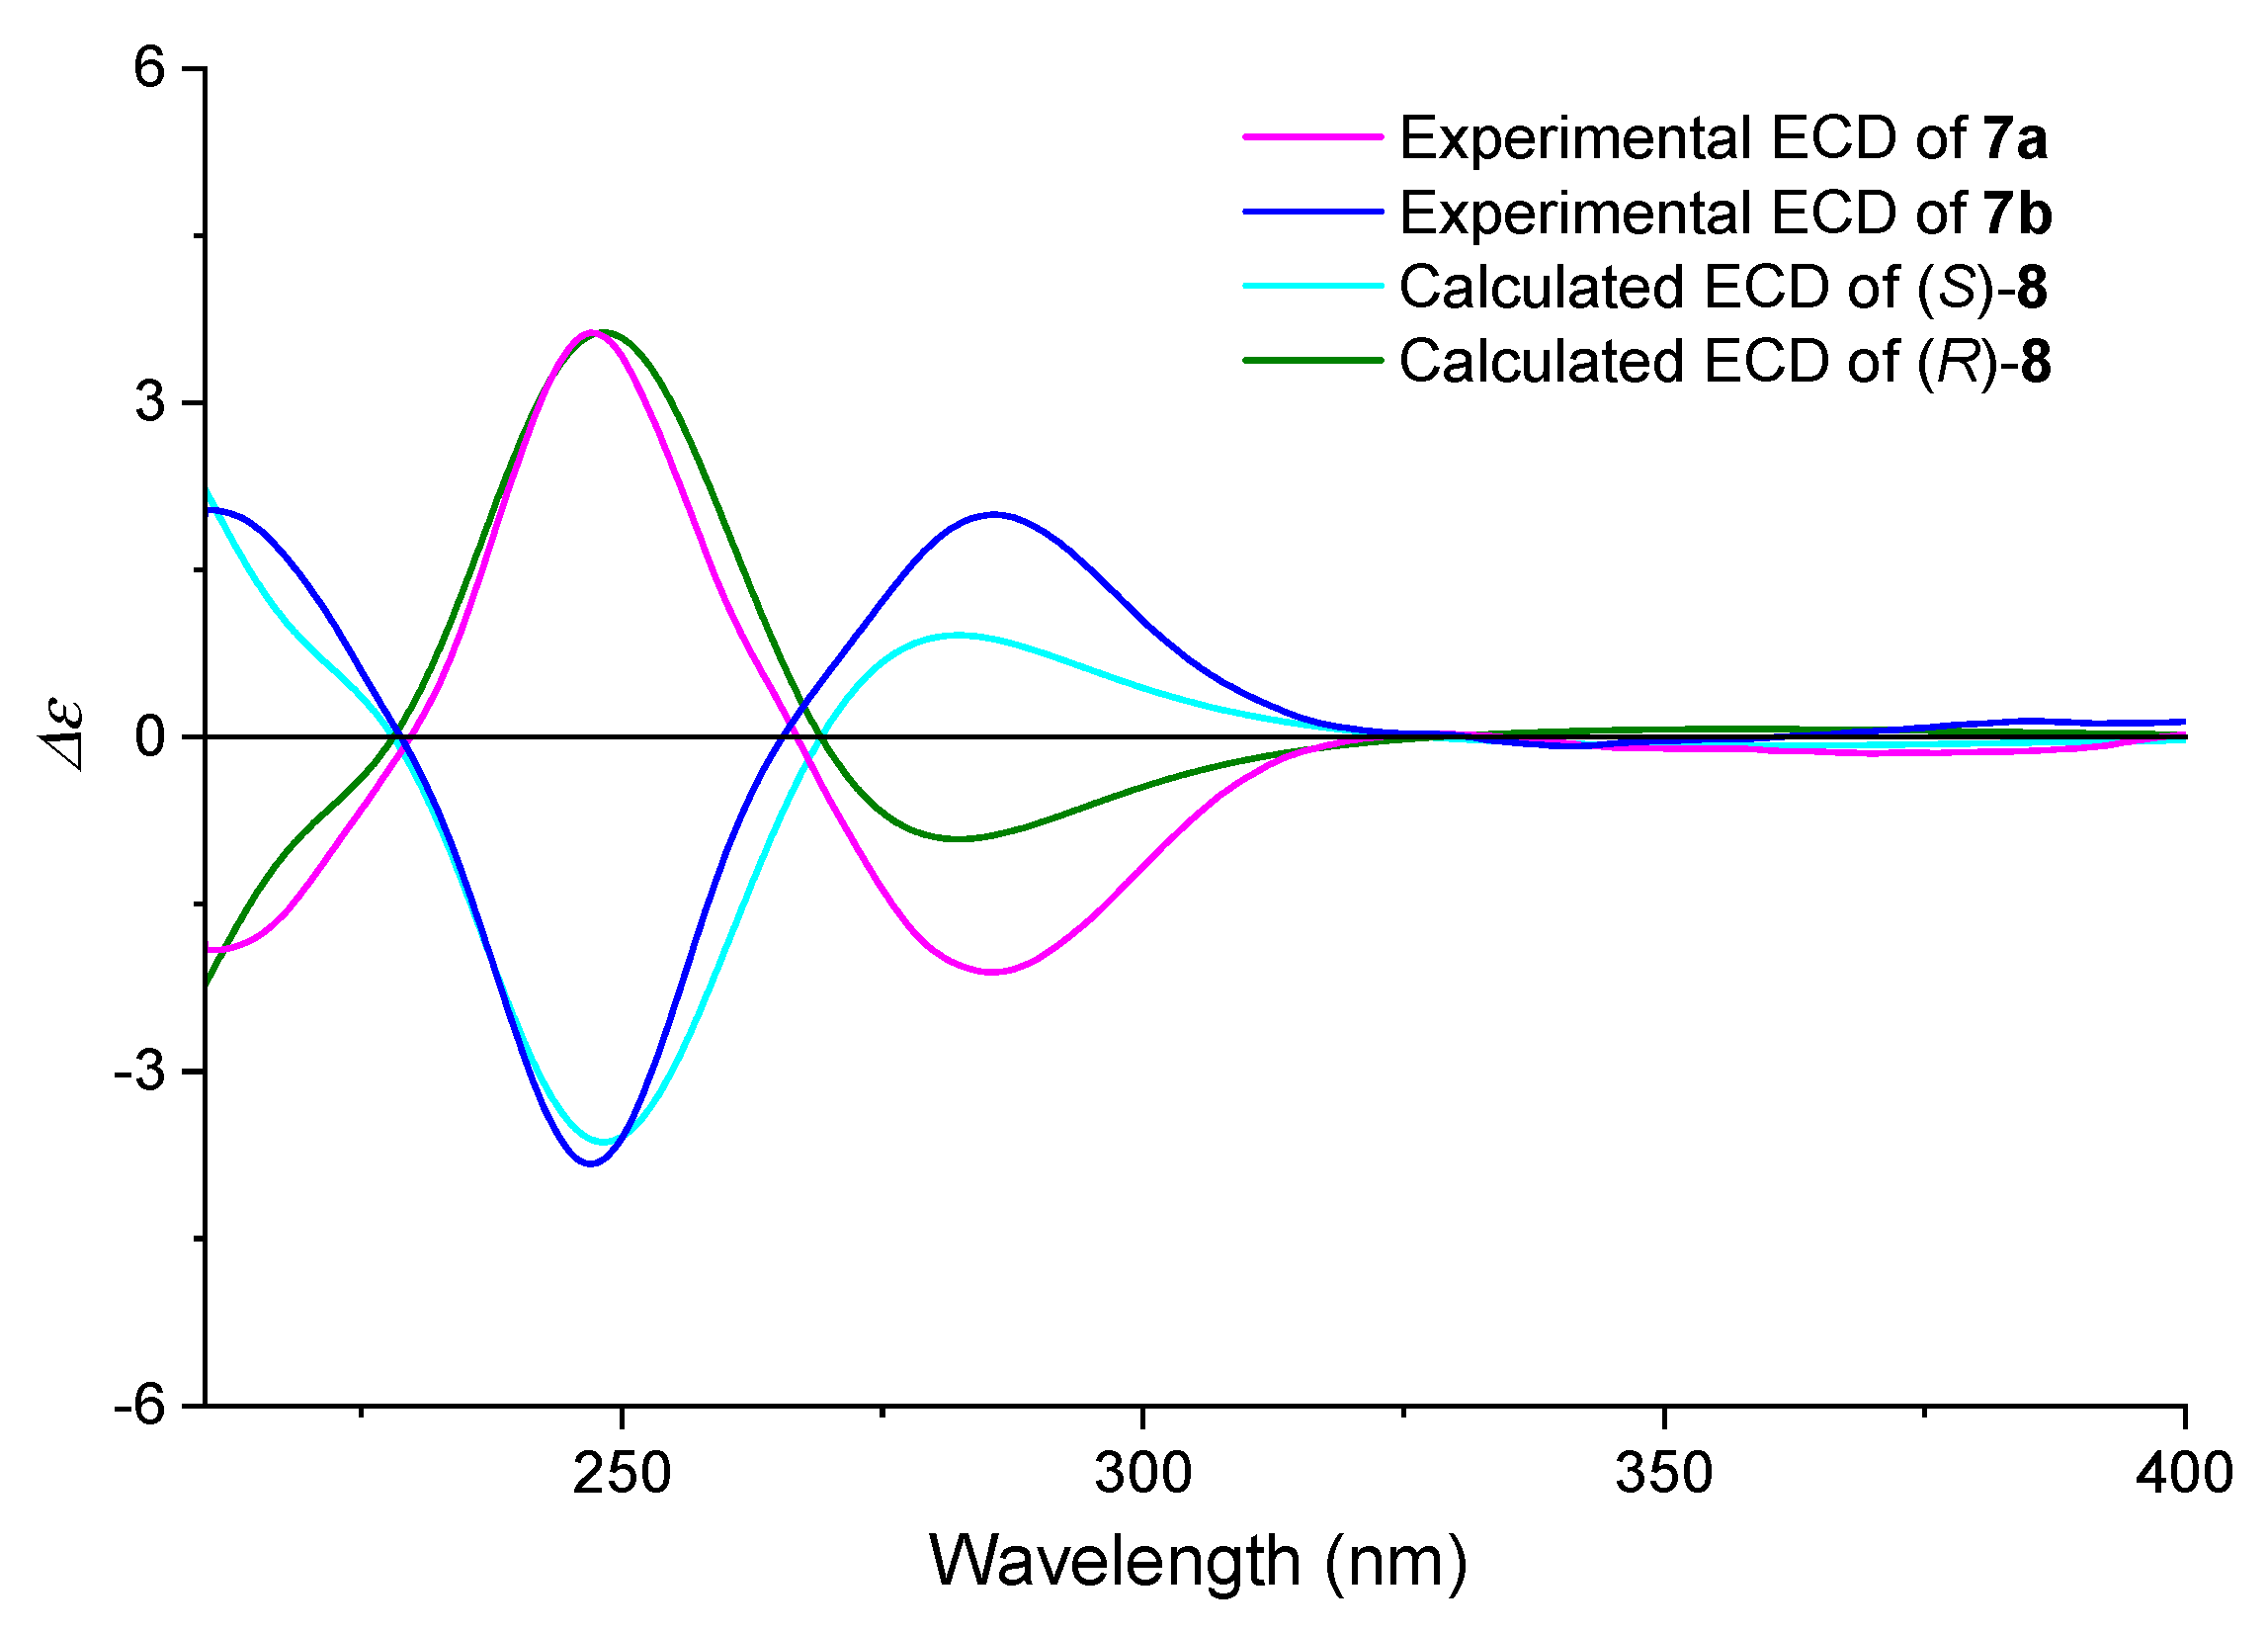
2.4.1. ECD Derivatization Method
2.4.2. Chemical Correlation Method
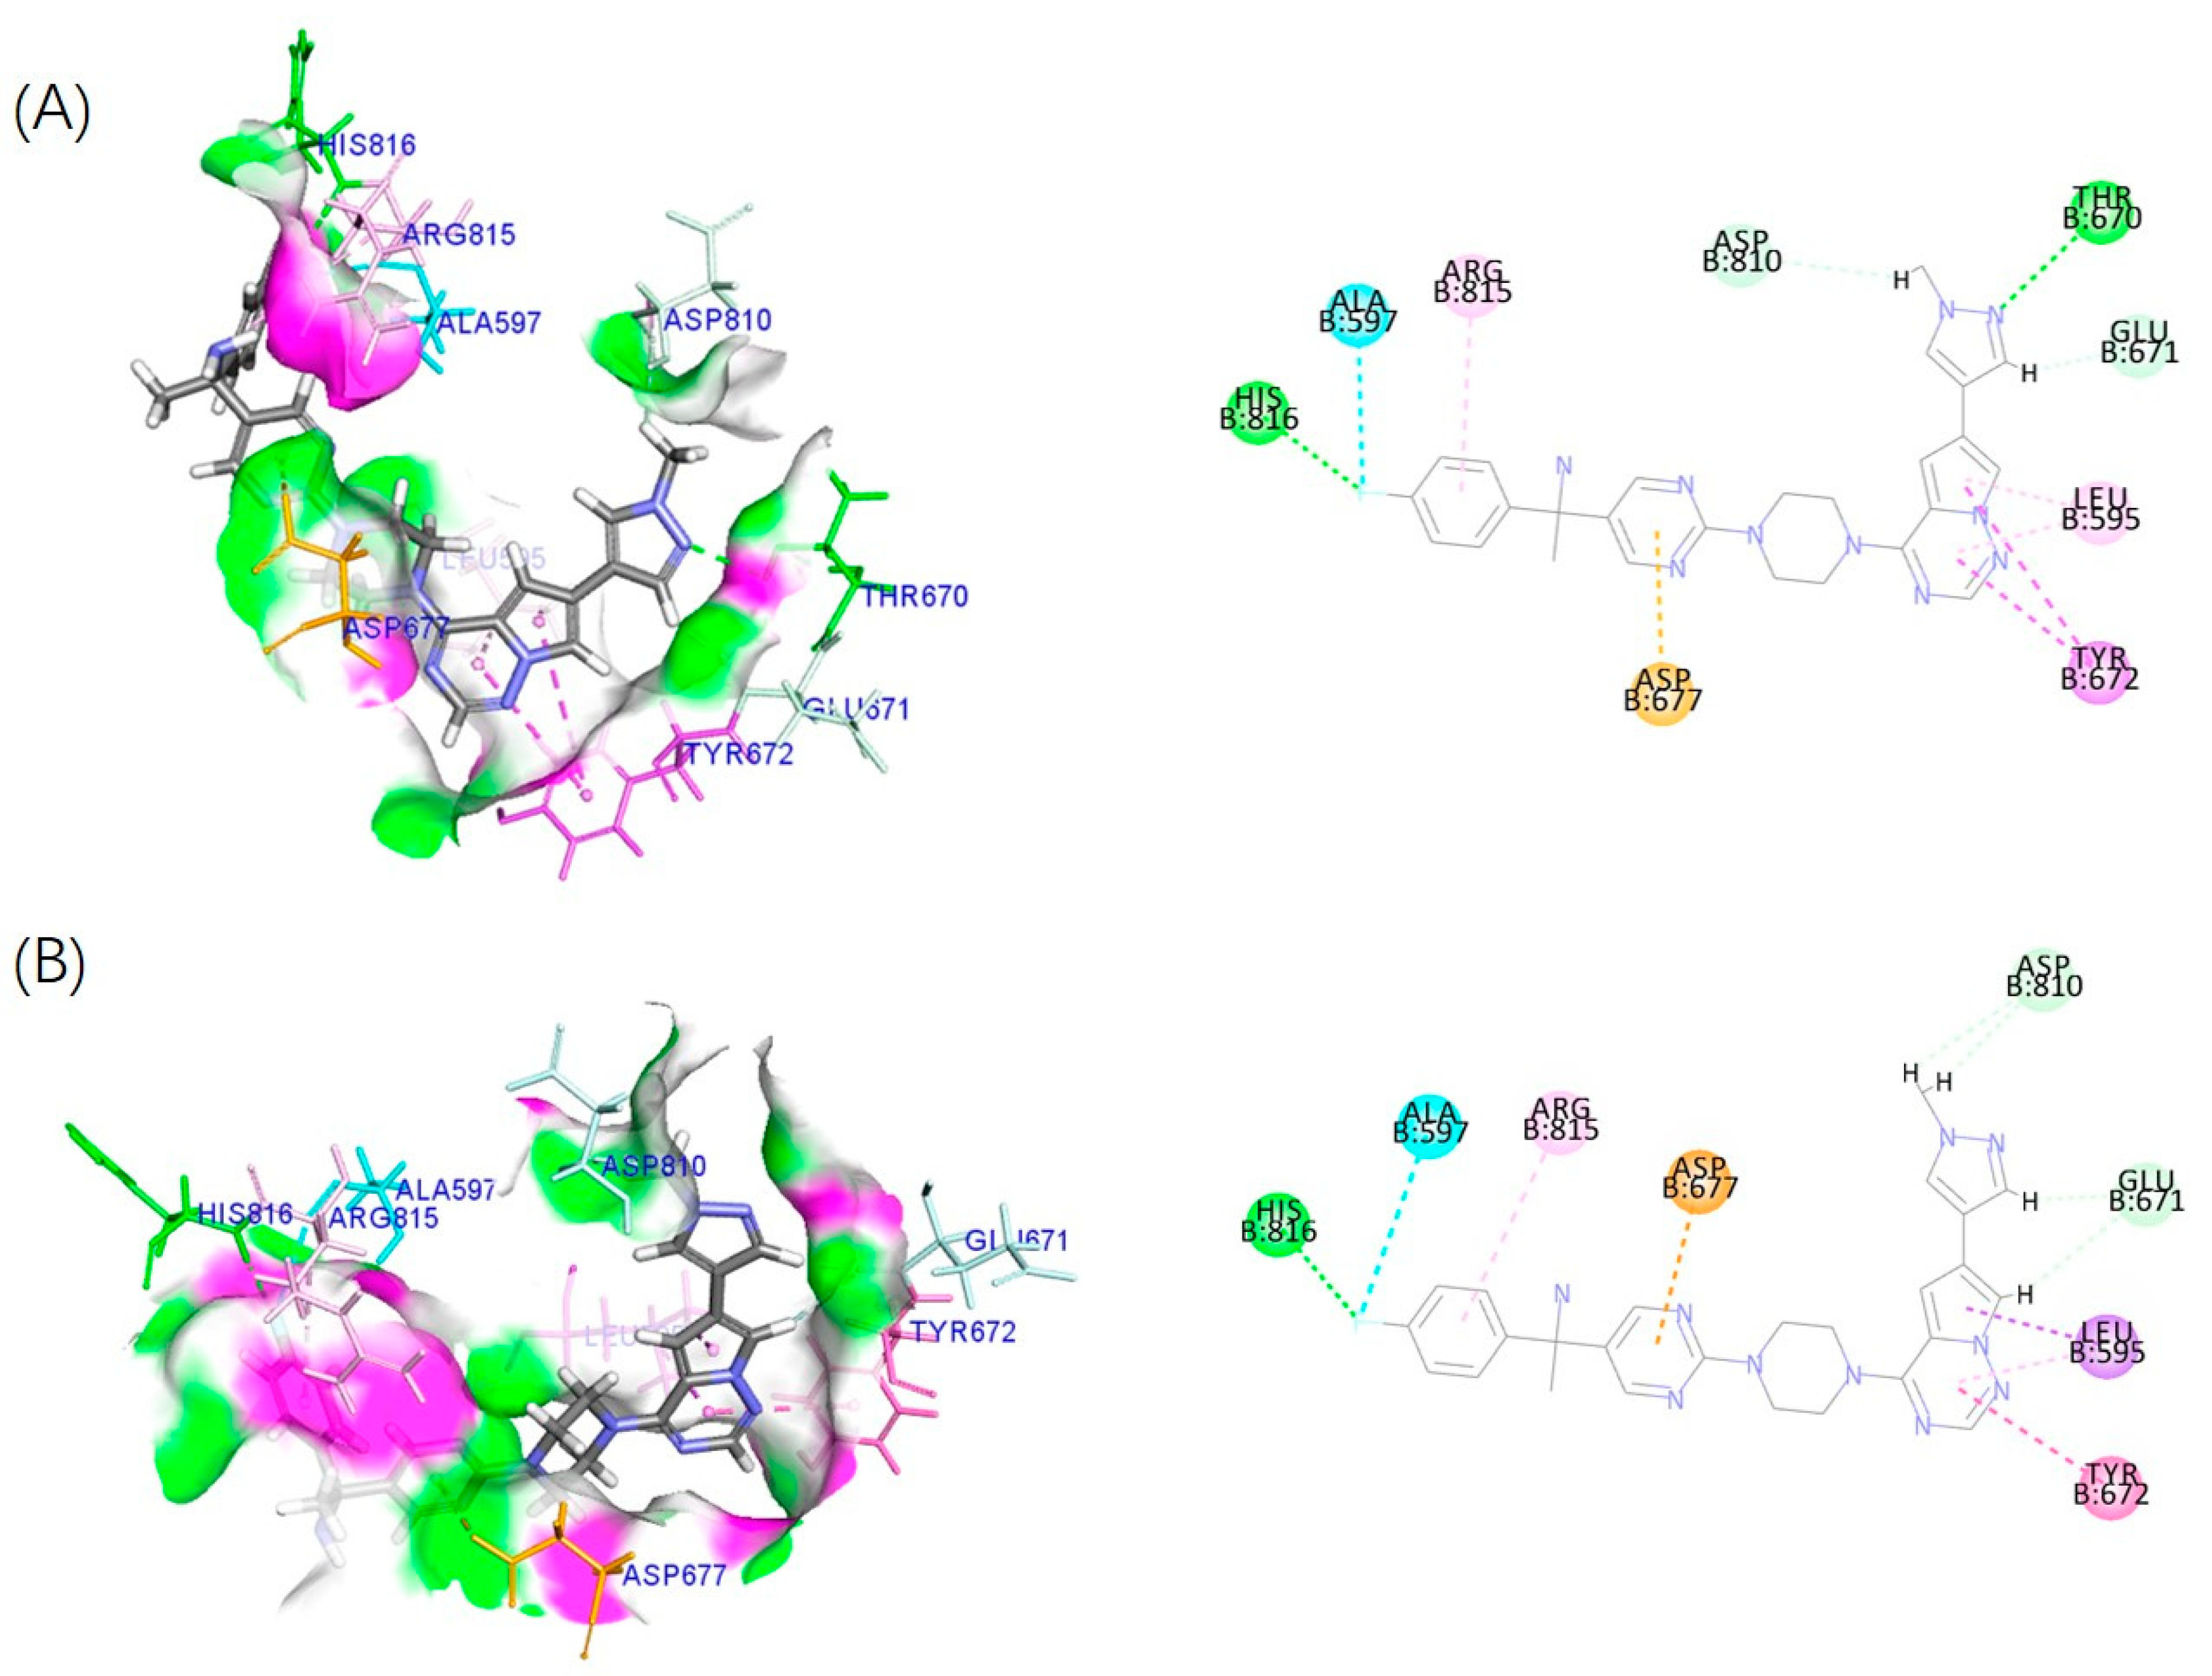
2.5. Effect of Configuration on Biological Activity
3. Conclusions
4. Materials and Methods
4.1. General Information
4.2. Computational Section
4.3. Chemical Synthesis
4.3.1. Synthesis of Derivatives 7a/7b
4.3.2. Synthesis of 4a and 4b
4.4. Docking Analysis
4.5. Biological Activity Assays
Supplementary Materials
Author Contributions
Funding
Institutional Review Board Statement
Informed Consent Statement
Data Availability Statement
Acknowledgments
Conflicts of Interest
References
- Krupp, F.; Frey, W.; Richert, C. Absolute configuration of small molecules by co-crystallization. Angew. Chem. Int. Ed. 2020, 59, 15875–15879. [Google Scholar] [CrossRef] [PubMed]
- Oyama, K.I.; Kondo, T.; Shimizu, T.; Yoshida, K. Determination of absolute configuration of photo-degraded catechinopyranocyanidin A by modified Mosher’s method. Chirality 2020, 32, 556–563. [Google Scholar] [CrossRef]
- Mandi, A.; Kurtan, T. Applications of OR/ECD/VCD to the structure elucidation of natural products. Nat. Prod. Rep. 2019, 36, 889–918. [Google Scholar] [CrossRef]
- Superchi, S.; Scafato, P.; Gorecki, M.; Pescitelli, G. Absolute configuration determination by quantum mechanical calculation of chiroptical spectra: Basics and applications to fungal metabolites. Curr. Med. Chem. 2018, 25, 287–320. [Google Scholar] [CrossRef]
- Wang, F.; Vasilyev, V.; Clayton, A.H.A. Optical spectra and conformation pool of tyrosine kinase inhibitor PD153035 using a robust quantum mechanical conformation search. New J. Chem. 2022, 46, 3168–3177. [Google Scholar] [CrossRef]
- Batista, A.N.L.; Valverde, A.L.; Nafie, L.A.; Batista, J.M., Jr. Stereochemistry of natural products from vibrational circular dichroism. Chem. Commun. 2024, 60, 10439–10450. [Google Scholar] [CrossRef]
- Parsons, S. Determination of absolute configuration using X-ray diffraction. Tetrahedron Asymmetr 2017, 28, 1304–1313. [Google Scholar] [CrossRef]
- Cabral, T.L.G.; Poggetto, G.D.; da Silva, J.P.B.; Nilsson, M.; Tormena, C.F. Determining the absolute configuration of small molecules by diffusion NMR experiments. Angew. Chem. Int. Ed. 2025, 64, e202418508. [Google Scholar] [CrossRef]
- Yang, B.B.; Gao, F.; Yang, Y.D.; Wang, R.; Li, X.; Li, L. Stereochemistry of chiral 2-substituted chromanes: Twist of the dihydropyran ring and specific optical rotation. Molecules 2023, 28, 439. [Google Scholar] [CrossRef]
- Padula, D.; Pescitelli, G. How and how much molecular conformation affects electronic circular dichroism: The case of 1,1-diarylcarbinols. Molecules 2018, 23, 128. [Google Scholar] [CrossRef]
- Brocks, D.R. Drug disposition in three dimensions: An update on stereoselectivity in pharmacokinetics. Biopharm. Drug Dispos. 2006, 27, 387–406. [Google Scholar] [CrossRef] [PubMed]
- McVicker, R.U.; O’Boyle, N.M. Chirality of new drug approvals (2013–2022): Trends and perspectives. J. Med. Chem. 2024, 67, 2305–2320. [Google Scholar] [CrossRef]
- Hoy, S.M. Seladelpar: First approval. Drugs 2024, 84, 1487–1495. [Google Scholar] [CrossRef]
- Dhillon, S. Tovorafenib: First approval. Drugs 2024, 84, 985–993. [Google Scholar] [CrossRef]
- Markham, A.; Duggan, S. Darolutamide: First approval. Drugs 2019, 79, 1813–1818. [Google Scholar] [CrossRef]
- Dhillon, S. Avapritinib: First approval. Drugs 2020, 80, 433–439. [Google Scholar] [CrossRef]
- Wu, C.P.; Lusvarghi, S.; Wang, J.C.; Hsiao, S.H.; Huang, Y.H.; Hung, T.H.; Ambudkar, S.V. Avapritinib: A selective inhibitor of KIT and PDGFRα that reverses ABCB1 and ABCG2-mediated multidrug resistance in cancer cell lines. Mol. Pharm. 2019, 16, 3040–3052. [Google Scholar] [CrossRef]
- Gotlib, J.; Reiter, A.; Radia, D.H.; Deininger, M.W.; George, T.I.; Panse, J.; Vannucchi, A.M.; Platzbecker, U.; Alvarez-Twose, I.; Mital, A.; et al. Efficacy and safety of avapritinib in advanced systemic mastocytosis: Interim analysis of the phase 2 PATHFINDER trial. Nat. Med. 2021, 27, 2192–2199. [Google Scholar] [CrossRef]
- Heinrich, M.C.; Zhang, X.; Jones, R.L.; George, S.; Serrano, C.; Deng, Y.; Bauer, S.; Cai, S.; Wu, X.; Zhou, Y.; et al. Clinical benefit of avapritinib in KIT-mutant gastrointestinal stromal tumors: A post hoc analysis of the phase I NAVIGATOR and phase I/II CS3007-001 studies. Clin. Cancer Res. 2024, 30, 719–728. [Google Scholar] [CrossRef]
- Pardanani, A.; Reichard, K.; Tefferi, A. Advanced systemic mastocytosis-Revised classification, new drugs and how we treat. Br. J. Haematol. 2024, 204, 402–414. [Google Scholar] [CrossRef]
- Hodous, B.L.; Kim, J.K.; Wilson, K.J.; Wilson, D.; Zhang, Y. Compositions useful for treating disorders related to kit. U.S. Patent 20170204104, 20 July 2017. [Google Scholar]
- Betzenbichler, G.; Huber, L.; Kräh, S.; Morkos, M.-L.K.; Siegle, A.F.; Trapp, O. Chiral stationary phases and applications in gas chromatography. Chirality 2022, 34, 732–759. [Google Scholar] [CrossRef] [PubMed]
- Liu, H.; Wu, Z.; Chen, J.; Wang, J.; Qiu, H. Recent advances in chiral liquid chromatography stationary phases for pharmaceutical analysis. J. Chromatogr. A 2023, 1708, 464367. [Google Scholar] [CrossRef]
- Lipka, E. Contribution of supercritical fluid chromatography to serially coupling columns for chiral and achiral separations. TrAC-Trends Anal. Chem. 2022, 149, 116563. [Google Scholar] [CrossRef]
- Liu, H.; Chen, J.; Chen, M.; Wang, J.; Qiu, H. Recent development of chiral ionic liquids for enantioseparation in liquid chromatography and capillary electrophoresis: A review. Anal. Chim. Acta 2023, 1274, 341496. [Google Scholar] [CrossRef]
- Berova, N.; Bari, L.D.; Pescitelli, G. Application of electronic circular dichroism in configurational and conformational analysis of organic compounds. Chem. Soc. Rev. 2007, 36, 914–931. [Google Scholar] [CrossRef]
- Li, L.; Si, Y.K. Study on the absolute configuration of levetiracetam via density functional theory calculations of electronic circular dichroism and optical rotatory dispersion. J. Pharmaceut Biomed. 2011, 56, 465–470. [Google Scholar] [CrossRef]
- Keiderling, T.A. Instrumentation for vibrational circular dichroism spectroscopy: Method comparison and newer developments. Molecules 2018, 23, 2404. [Google Scholar] [CrossRef]
- Demarque, D.P.; Heinrich, S.; Schulz, F.; Merten, C. Sensitivity of VCD spectroscopy for small structural and stereochemical changes of macrolide antibiotics. Chem. Commun. 2020, 56, 10926–10929. [Google Scholar] [CrossRef]
- Gorecki, M.; Zullo, V.; Iuliano, A.; Pescitelli, G. On the absolute stereochemistry of tolterodine: A circular dichroism study. Pharmaceuticals 2019, 12, 21. [Google Scholar] [CrossRef]
- Zhang, J.Y.; Yang, B.B.; Yang, Y.D.; Gao, F.; Liu, W.Q.; Li, L. Correlations between the ECD spectra and absolute configuration of bridged-ring lactones: Revisiting Beecham’s rule. Org. Biomol. Chem. 2021, 19, 9266–9275. [Google Scholar] [CrossRef] [PubMed]
- Giorgio, E.; Viglione, R.G.; Zanasi, R.; Rosini, C. Ab initio calculation of optical rotatory dispersion (ORD) curves: A simple and reliable approach to the assignment of the molecular absolute configuration. J. Am. Chem. Soc. 2004, 126, 12968–12976. [Google Scholar] [CrossRef]
- Lu, J.M.; Yang, B.B.; Li, L. Specific optical rotation and absolute configuration of flexible molecules containing a 2-methylbutyl residue. Eur. J. Org. Chem. 2020, 2020, 4768–4774. [Google Scholar] [CrossRef]
- Byers, L.A.; Horn, L.; Ghandi, J.; Kloecker, G.; Owonikoko, T.; Waqar, S.N.; Krzakowski, M.; Cardnell, R.J.; Fujimoto, J.; Taverna, P.; et al. A phase 2, open-label, multi-center study of amuvatinib in combination with platinum etoposide chemotherapy in platinum-refractory small cell lung cancer patients. Oncotarget 2017, 8, 81441–81454. [Google Scholar] [CrossRef]
- Teuber, A.; Schulz, T.; Fletcher, B.S.; Gontla, R.; Mühlenberg, T.; Zischinsky, M.-L.; Niggenaber, J.; Weisner, J.; Kleinbölting, S.B.; Lategahn, J.; et al. Avapritinib-based SAR studies unveil a binding pocket in KIT and PDGFRA. Nat. Commun. 2024, 15, 63. [Google Scholar] [CrossRef]
- MOE2009.10, Chemical Computing Group Inc. Available online: https://www.chemcomp.com/en/Products.htm (accessed on 16 November 2023).
- Frisch, M.J.; Trucks, G.W.; Schlegel, H.B.; Scuseria, G.E.; Robb, M.A.; Cheeseman, J.R.; Scalmani, G.; Barone, V.; Mennucci, B.; Petersson, G.A.; et al. Gaussian 16, Revision, B.01; Gaussian, Inc.: Wallingford, CT, USA, 2016. [Google Scholar]
- Bruhn, T.; Schaumlöffel, A.N.U.; Hemberger, Y.; Bringmann, G. SpecDis: Quantifying the comparison of calculated and experimental electronic circular dichroism spectra. Chirality 2013, 25, 243–249. [Google Scholar] [CrossRef]
- SpecDis; Version 1.71; SpecDis Manual: Berlin, Germany, 2017.

| Compounds | IC50 (nM) |
|---|---|
| 4a ((R)-4) | 2.81 ± 0.32 |
| 4b ((S)-4) | 0.59 ± 0.10 |
| Amuvatinib | 26.89 ± 1.51 |
Disclaimer/Publisher’s Note: The statements, opinions and data contained in all publications are solely those of the individual author(s) and contributor(s) and not of MDPI and/or the editor(s). MDPI and/or the editor(s) disclaim responsibility for any injury to people or property resulting from any ideas, methods, instructions or products referred to in the content. |
© 2025 by the authors. Licensee MDPI, Basel, Switzerland. This article is an open access article distributed under the terms and conditions of the Creative Commons Attribution (CC BY) license (https://creativecommons.org/licenses/by/4.0/).
Share and Cite
Yang, Y.-D.; Zhao, C.; Li, L.-P.; Lv, Y.-X.; Yang, B.-B.; Li, X.; Wang, R.; Li, L. Absolute Configuration and Chiroptical Properties of Flexible Drug Avapritinib. Pharmaceuticals 2025, 18, 833. https://doi.org/10.3390/ph18060833
Yang Y-D, Zhao C, Li L-P, Lv Y-X, Yang B-B, Li X, Wang R, Li L. Absolute Configuration and Chiroptical Properties of Flexible Drug Avapritinib. Pharmaceuticals. 2025; 18(6):833. https://doi.org/10.3390/ph18060833
Chicago/Turabian StyleYang, Ya-Dong, Chen Zhao, Liang-Peng Li, Yi-Xin Lv, Bei-Bei Yang, Xin Li, Ru Wang, and Li Li. 2025. "Absolute Configuration and Chiroptical Properties of Flexible Drug Avapritinib" Pharmaceuticals 18, no. 6: 833. https://doi.org/10.3390/ph18060833
APA StyleYang, Y.-D., Zhao, C., Li, L.-P., Lv, Y.-X., Yang, B.-B., Li, X., Wang, R., & Li, L. (2025). Absolute Configuration and Chiroptical Properties of Flexible Drug Avapritinib. Pharmaceuticals, 18(6), 833. https://doi.org/10.3390/ph18060833