Article

Unveiling the Antioxidant Power and Secondary Metabolites of Tabebuia chrysantha (Jacq.) Leaves and Flowers from Ecuador

by
Raluca A. Mihai
1,*,
Ramiro Fernando Vivanco Gonzaga
2,
Nelson Santiago Cubi Insuaste
2,
Nilo Rigoberto Maza Morocho
3 and
Rodica D. Catana
4
1
CIAM, Department of Life Science and Agriculture, Universidad de Las Fuerzas Armadas—ESPE, Av. General Ruminahui s/n y, Sangolqui 171103, Ecuador
2
Department of Life Science and Agriculture, Universidad de Las Fuerzas Armadas—ESPE, Av. General Ruminahui s/n y, Sangolqui 171103, Ecuador
3
IASA 1, Department of Life Science and Agriculture, Universidad de las Fuerzas Armadas—ESPE, Av. General Rumiñahui s/n y Ambato, Sangolquí 171103, Ecuador
4
Institute of Biology Bucharest of Romanian Academy, 296 Splaiul Independentei, 060031 Bucharest, Romania
*
Author to whom correspondence should be addressed.
Pharmaceuticals 2025, 18(5), 649; https://doi.org/10.3390/ph18050649
Submission received: 5 March 2025 / Revised: 10 April 2025 / Accepted: 12 April 2025 / Published: 29 April 2025

Abstract

:
BackgroundTabebuia chrysantha (Jacq.) Nichols, commonly known as Guayacan, is a prominent species within the Bignoniaceae family known for its medicinal value and ecological significance. This study aimed to characterize the antioxidant capacity and secondary metabolite composition of Guayacan leaves and flowers grown in Ecuador, a region where its chemical profile remains unexplored. Methods: Comprehensive analyses were conducted to determine the total phenolic content (TPC), total flavonoid content (TFC), and antioxidant activity using ABTS, DPPH, FRAP assays, and LC-MS. Results: The results revealed remarkable differences between mature leaves and flowers. Leaves exhibited consistently higher flavonoid levels (e.g., 0.280 ± 0.005 mg QE/g DW) and superior antioxidant capacity across all assays (e.g., 10.84 ± 0.51 µmol Trolox g1 DW in ABTS) compared to flowers, which showed greater variability but lower overall activity. These findings highlight a functional specialization, with leaves synthesizing more flavonoids to mitigate oxidative stress from environmental factors such as UV radiation. LC-MS analysis unveiled various bioactive compounds, including phenolic acids, flavonoids, and terpenoids. Unique metabolites like α-lipoamide in leaves and oleanolic acid in flowers suggest distinct adaptive roles, potentially linked to stress tolerance and reproductive functions. Additionally, strong correlations among antioxidant assays (e.g., FRAP vs. DPPH, r = 0.993, p < 0.001) emphasize the pivotal role of phenolics and flavonoids in free radical scavenging and reduction mechanisms. Conclusions: The findings of this study demonstrate the superior antioxidant capacity of leaves, driven by their higher accumulation of flavonoids and phenolic compounds. This research represents a foundational step toward uncovering the therapeutic potential of Ecuadorian Guayacan as a source of natural antioxidants and bioactive compounds, supporting its future applications in phytotherapy and drug development.

1. Introduction

The genus Tabebuia is the most diverse within the Bignoniaceae family, comprising flowering trees with over 100 species distributed across tropical and subtropical regions, extending from the United States to northern Argentina and Chile [1]. T. chrysantha, commonly known as the Golden Trumpet Tree, is a medium-sized deciduous tree, reaching heights between 12–22 m, distributed from Mexico to Colombia and Venezuela [2].
In Ecuador, this species is widely found, thriving at altitudes ranging from sea level to 1.500 m above sea level in regions with annual precipitation between 1.000–2.500 mm and temperatures from 12–24 °C [3]. It typically inhabits dry and tropophilous forests, predominantly in the southern regions of Esmeraldas, Manabí, Guayas, and El Oro provinces. The tree is renowned for its striking appearance, characterized by terminal inflorescences of vibrant yellow flowers with a bell-shaped calyx [3,4].
Oxidative stress (an imbalance between free radicals and antioxidants in the body) is a complex process influenced by a combination of internal (e.g., normal cellular processes, body’s immune response to infections or injuries, aging) and external (e.g., environmental pollutants, radiation, smoking, excessive alcohol consumption, poor diet, stress, excessive exercise) factors; it plays a significant role in the development of numerous chronic diseases [5]. Natural products offer a wealth of compounds that can effectively combat oxidative stress, making them invaluable in both prevention and treatment [6].
The genus Tabebuia is noted for its diverse array of secondary metabolites, which are active principles in treating various pathologies [7]. T. chrysantha shows potential in various pharmacological areas, particularly in its anti-parasitic and antioxidant properties; more research is needed to understand its therapeutic potential fully and to ensure its safe and effective use [8]. Species within this genus are commonly utilized in traditional medicine [9] and are acknowledged as therapeutic alternatives in rural communities. Ethnobotanical and ethnopharmacological studies substantiate these practices, demonstrating their potential to address multiple ailments. This interest has driven the exploration of new phytotherapeutic drugs [10]. The evidence suggests that the Tabebuia genus possesses antimicrobial and astringent properties. Moreover, the anti-infective activity of its plant extracts has been evaluated, yielding promising results. T. chrysantha and other species of the genus exhibit anti-inflammatory effects in both in vivo and in vitro studies. Ethnopharmacological investigations highlight the potential of T. chrysantha in cancer treatment due to its antitumor activity, attributed to compounds such as naphthoquinones and polyphenols [1]. Additionally, the bark contains bioactive compounds, including naphthoquinones, quinones, furanonaphthoquinones, benzoic acid, cyclopentenyl dialdehydes, and flavonoids and other classes of secondary metabolites, including tannins, alkaloids, and iridoids (Figure 1) [9]. Notably, a moderate concentration of flavonoids has been observed in the flowers of T. chrysantha.
The importance of this research lies in addressing the current gap in scientific studies on T. chrysantha (Golden Trumpet Tree) grown in Ecuador. Despite the abundance of this species in the country, its metabolic profile and biological capacities, including its antioxidant properties, remain unexplored. Evaluating these attributes is crucial, as they hold significant potential in the treatment of various diseases. This study seeks to unveil the therapeutic value of the metabolites found in T. chrysantha leaves and flowers. By leveraging the unique biochemical characteristics of Ecuadorian T. chrysantha, this work could pave the way for innovative solutions in phytotherapy and drug discovery.

2. Results

2.1. Bioactive Compound Determination

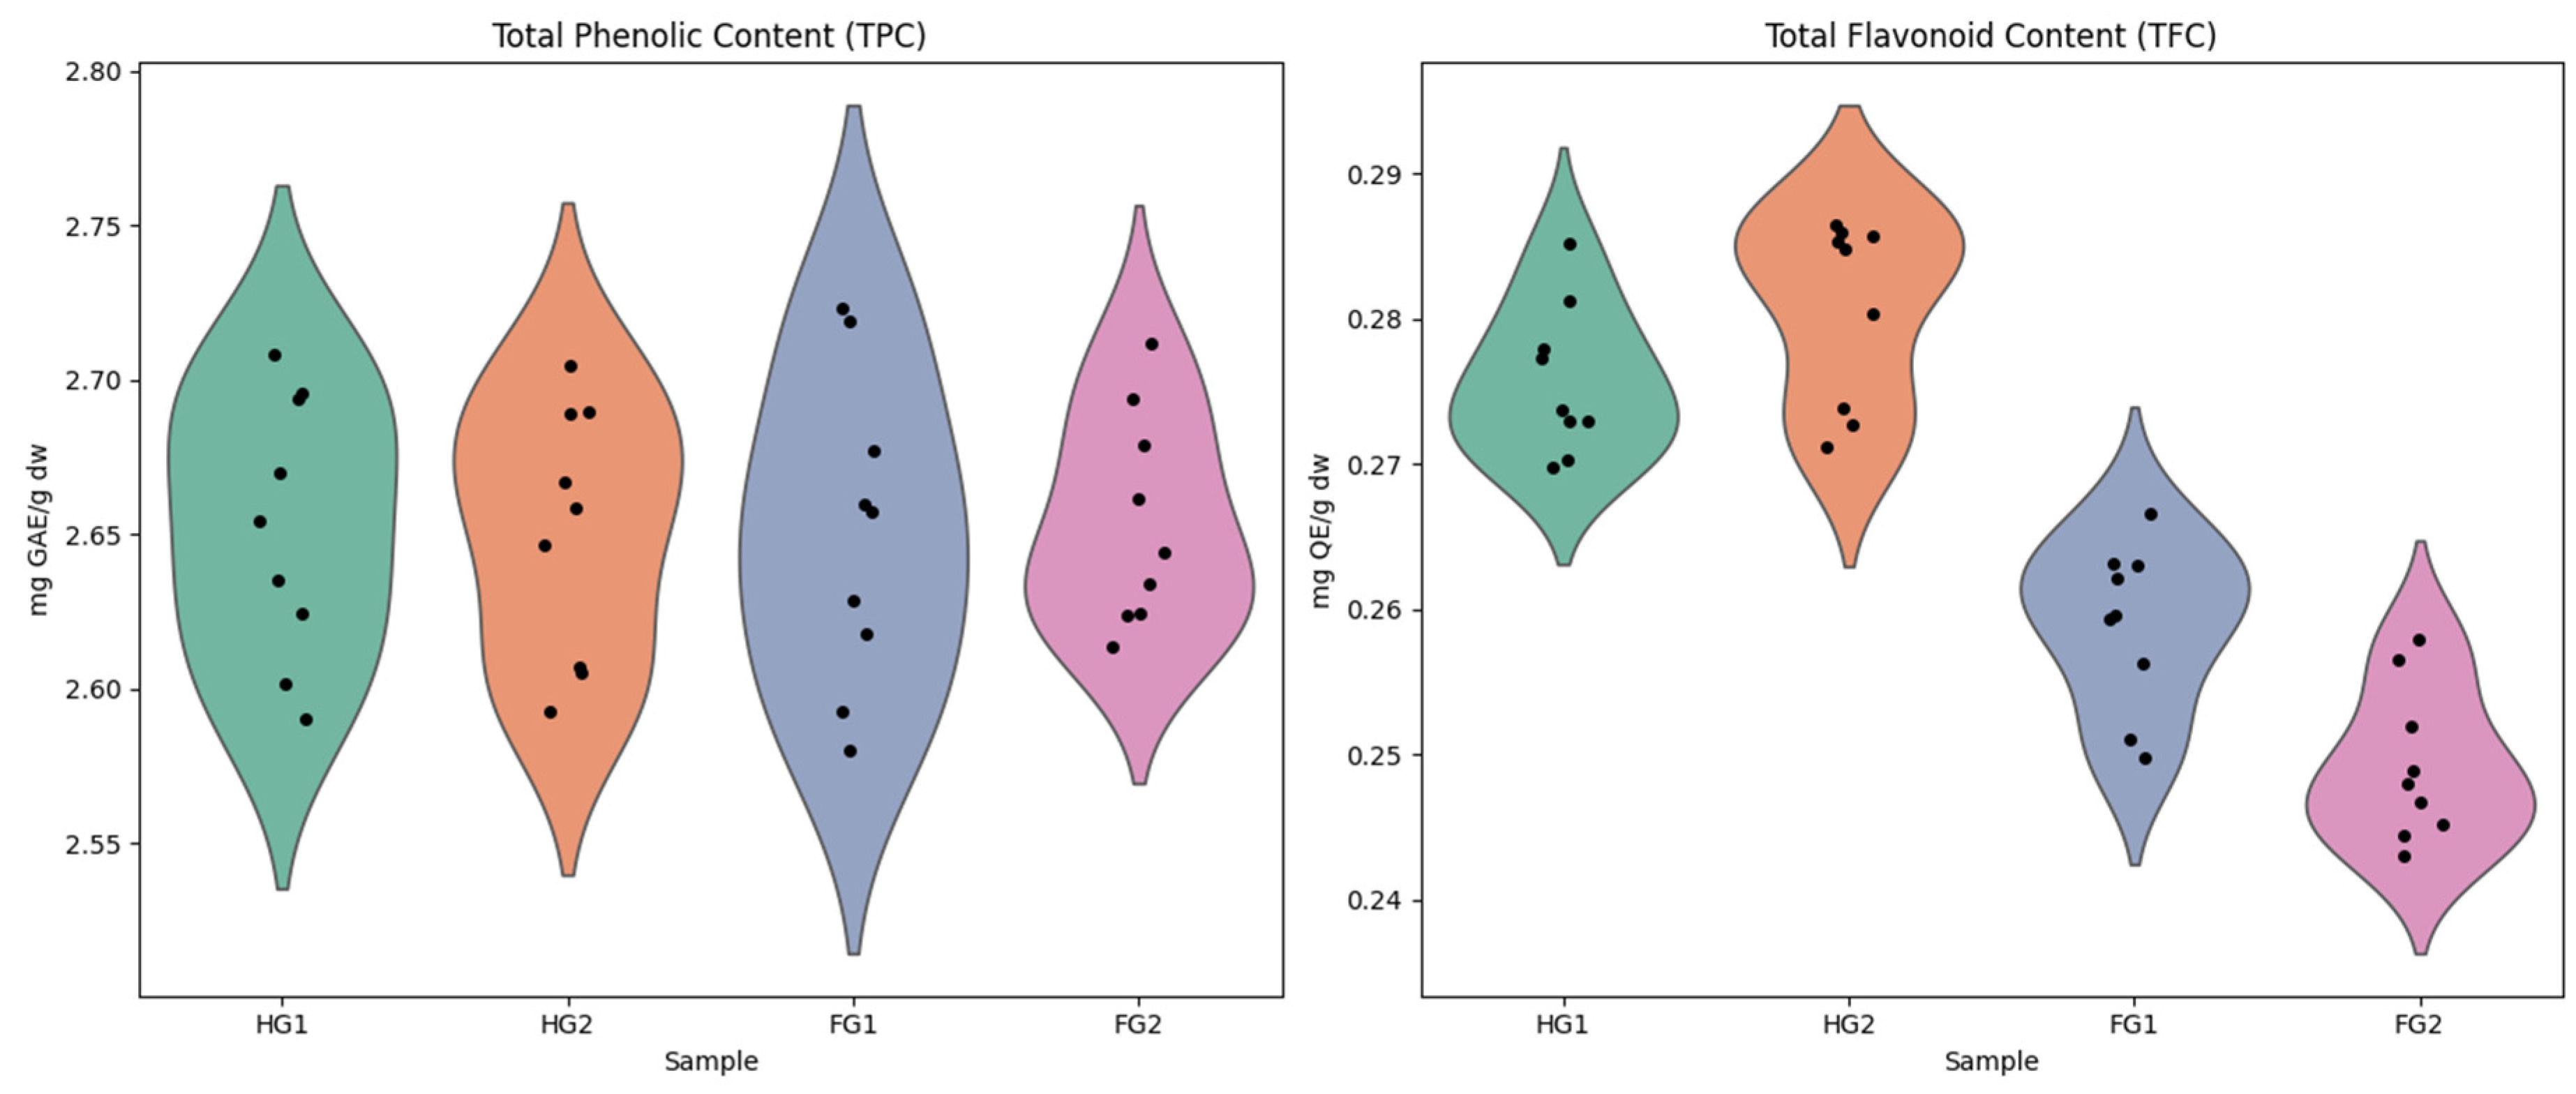
The total phenolic content (TPC) and total flavonoid content (TFC) varied among the samples analyzed of Guayacan leaves and flowers. The TPC values in Guayacan leaves ranged from 2.590 to 2.708 mg GAE/g DW in HG1 (collected from Esmeraldas) and from 2.592 to 2.705 mg GAE/g DW in HG2 (collected from Guayas), with average values of 2.645 ± 0.041 mg GAE/g DW and 2.646 ± 0.042 mg GAE/g DW, respectively. In Guayacan flowers, TPC values ranged from 2.580 to 2.723 mg GAE/g DW in FG1 and from 2.613 to 2.712 mg GAE/g DW in FG2, with averages of 2.653 ± 0.048 mg GAE/g DW and 2.646 ± 0.042 mg GAE/g DW. The TFC values in Guayacan leaves ranged from 0.269 to 0.285 mg QE/g DW in HG1 and from 0.271 to 0.286 mg QE/g DW in HG2, with average values of 0.275 ± 0.005 mg QE/g DW and 0.280 ± 0.005 mg QE/g DW, respectively. In Guayacan flowers, TFC values ranged from 0.249 to 0.266 mg QE/g DW in FG1 and from 0.244 to 0.257 mg QE/g DW in FG2, with averages of 0.260 ± 0.006 mg QE/g DW and 0.249 ± 0.006 mg QE/g DW (Figure 2).
These results indicate that Guayacan leaves generally accumulate higher levels of phenolic and flavonoid compounds compared to Guayacan flowers. The highest TPC value was detected in FG1 (2.723 mg GAE/g DW), whereas the highest TFC was recorded in HG2 (0.286 mg QE/g DW). The observed differences may be attributed to variations in metabolic pathways, environmental factors, or tissue-specific biosynthetic activity. The relatively higher TPC and TFC in leaves suggest a possible role in plant defense mechanisms and adaptation to environmental stress (Table 1).

2.2. Antioxidant Capacity Determination

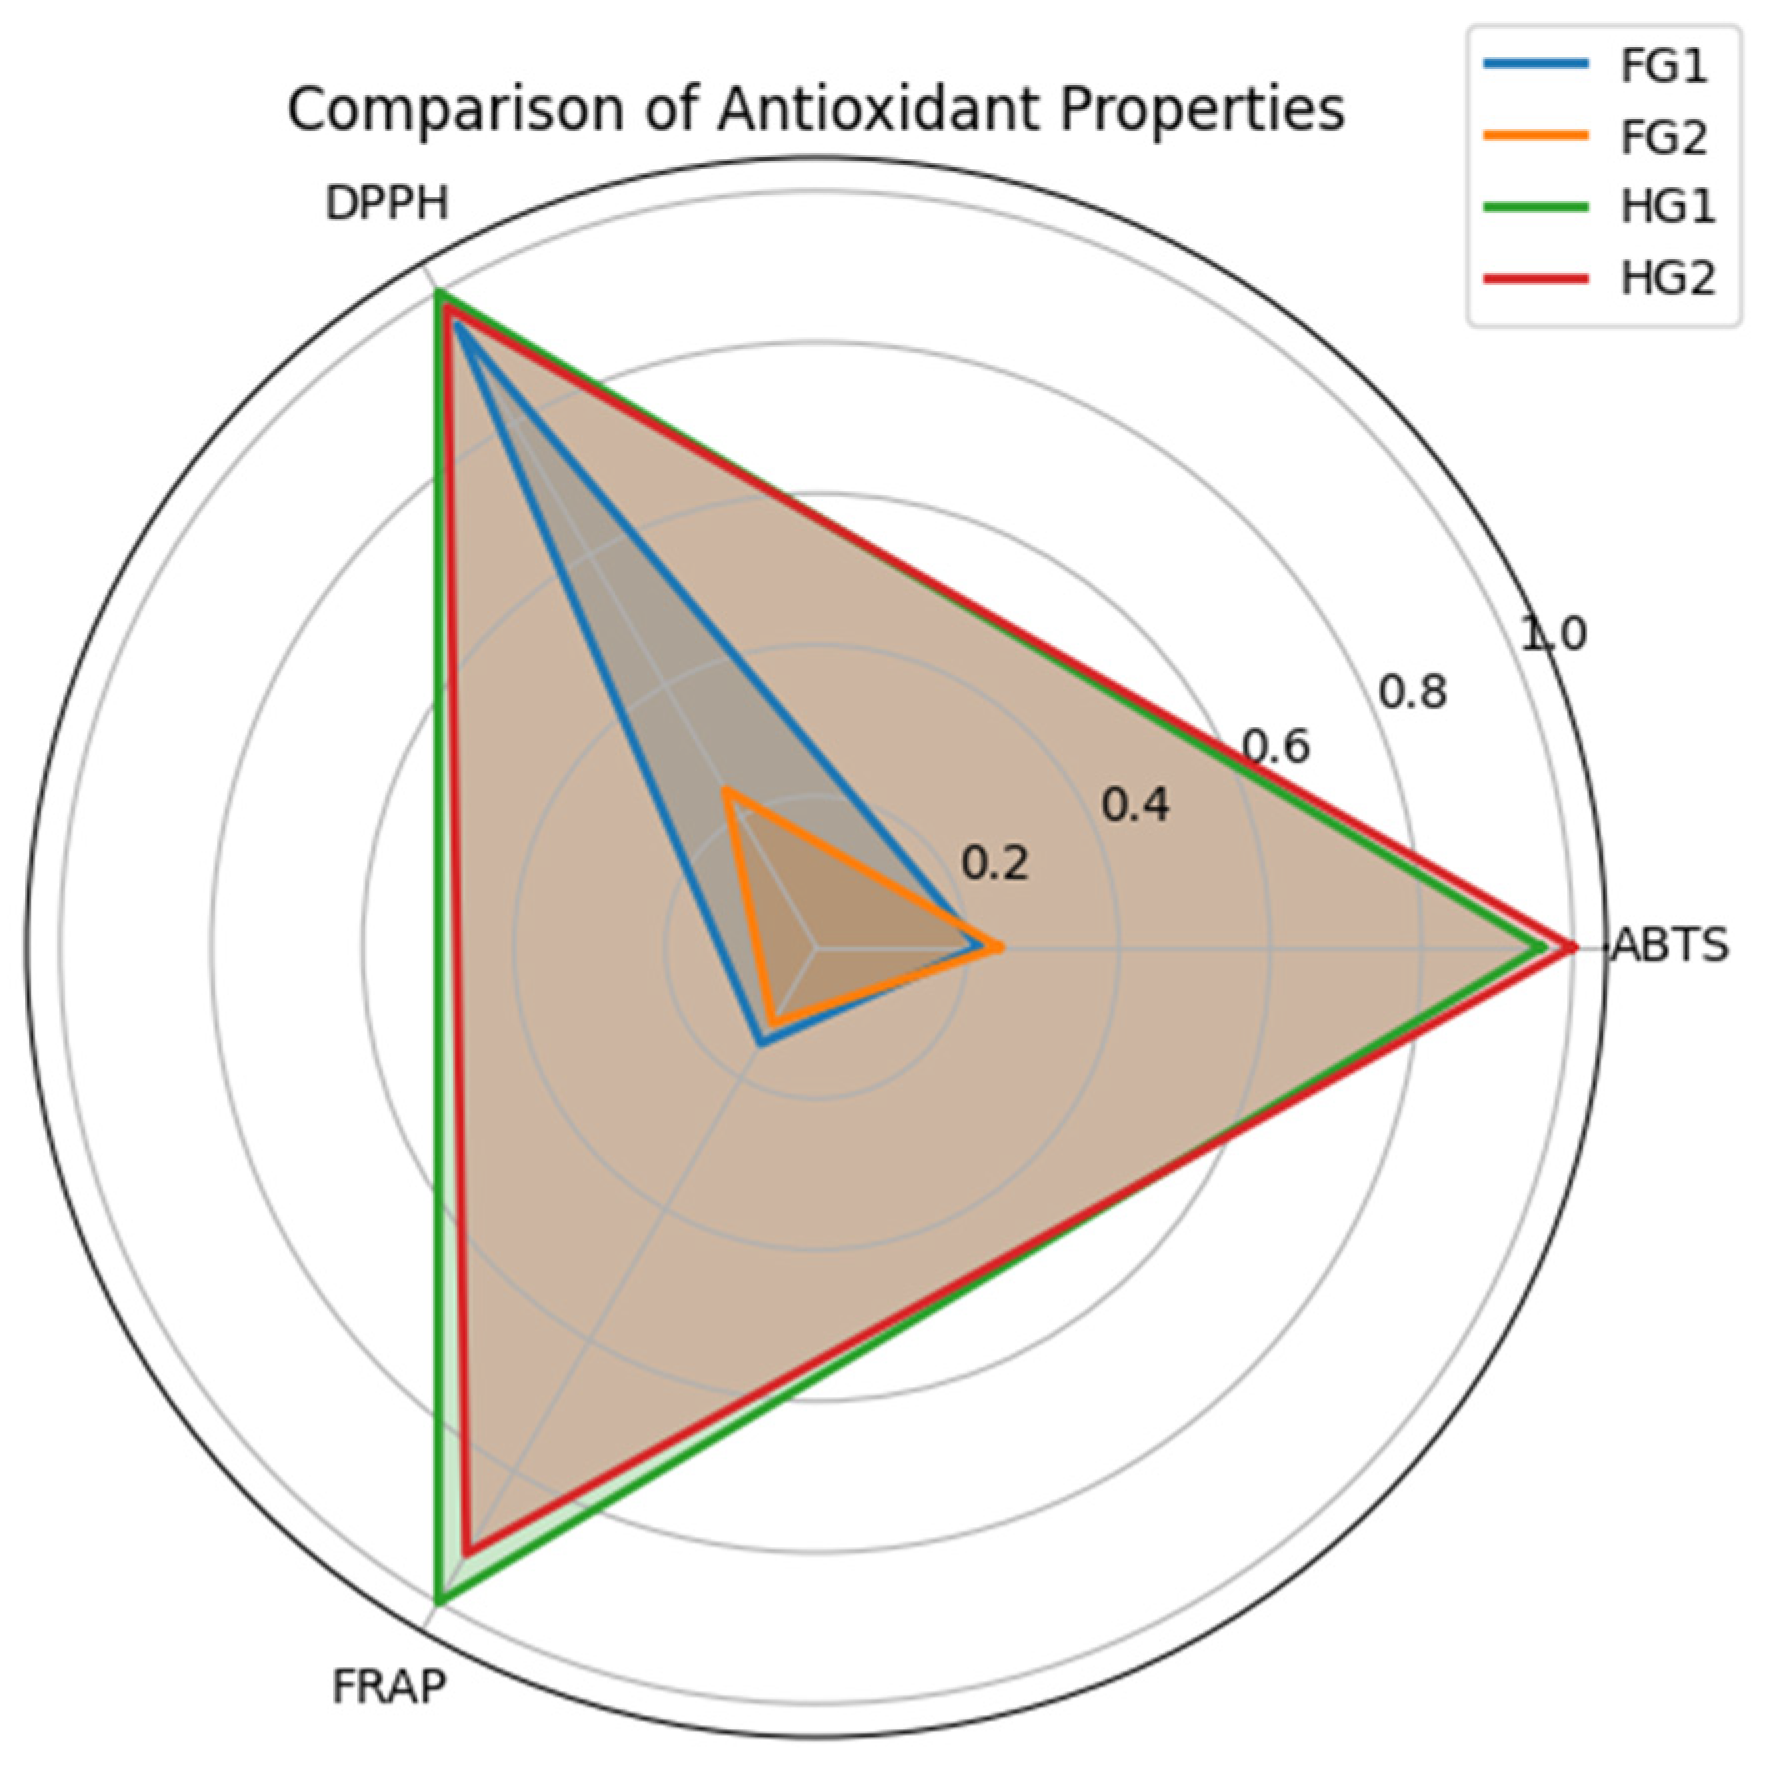
The antioxidant capacity of Guayacan leaves and flowers was evaluated using the ABTS, DPPH, and FRAP methods. The obtained values revealed significant differences among the analyzed samples (Figure 3, Table 1).
For the ABTS assay, Guayacan leaves (HG1 and HG2) exhibited considerably higher antioxidant activity compared to flowers (FG1 and FG2). The average values for HG1 were 10.57 ± 0.76 µmol Trolox g1 DW, while HG2 recorded 10.84 ± 0.51 µmol Trolox g1 DW. In contrast, the flowers presented significantly lower values, with FG1 reaching 2.32 ± 0.53 µmol Trolox g1 DW and FG2 at 2.61 ± 0.06 µmol Trolox g1 DW.
The DPPH assay reflected a similar trend, where HG1 exhibited the highest antioxidant capacity with an average value of 37.24 ± 0.89 µmol Trolox g1 DW, followed by HG2 with 37.04 ± 1.23 µmol Trolox g1 DW. The flowers, however, were discordant in antioxidant activity, as FG1 recorded values comparable to the leaves (35.93 ± 1.36 µmol Trolox g1 DW), while FG2 displayed significantly lower values (9.07 ± 0.21 µmol Trolox g1 DW).
On the other hand, the reducing activity assessed by FRAP once again demonstrated higher activity in leaves compared to flowers. HG1 had an average of 22.67 ± 0.43 µmol Fe2+ g1 DW, followed by HG2 with 20.88 ± 0.68 µmol Fe2+ g1 DW. Regarding the flowers, FG1 showed intermediate values (3.33 ± 0.14 µmol Fe2+ g1 DW), while FG2 recorded the lowest activity (2.65 ± 0.10 µmol Fe2+ g1 DW).

2.3. Correlation Between Bioactive Compounds and Antioxidant Capacity

The analysis of antioxidant properties in Guayacan leaves (HG1, HG2) and flowers (FG1, FG2) revealed significant correlations among various bioactive compounds and antioxidant assays (ABTS, DPPH, FRAP, TPC, and TFC). These findings highlight the intricate relationships between secondary metabolites and antioxidant capacity across different plant tissues. Strong positive correlations were observed, particularly between FRAP and DPPH (r = 0.993, p < 0.001), as well as FRAP and ABTS (r = 0.930, p < 0.001), indicating the central role of phenolic compounds in these antioxidant capacities. Similarly, ABTS and TFC showed a strong positive correlation (r = 0.930, p < 0.001), suggesting that flavonoids may play an important role in the ABTS antioxidant assay. In contrast, notable negative correlations were identified. For instance, DPPH and ABTS showed a moderate negative correlation (HG2: r = −0.948), suggesting that specific interactions or structural differences in the antioxidant mechanisms might underlie these observations. Furthermore, TPC exhibited weak or negligible correlations with other antioxidant assays, such as FRAP (r = −0.019), highlighting that total phenolic content measured by the TPC assay might not fully explain the antioxidant activity across the tested samples. When comparing plant tissues, the flowers (FG1 and FG2) generally demonstrated stronger positive correlations between antioxidant assays (e.g., FG2: FRAP vs. DPPH, r = 0.933) compared to leaves (HG1 and HG2), where mixed patterns were observed, including strong negative correlations (e.g., HG1: ABTS vs. DPPH, r = −0.776). These variations may reflect differences in the specific composition and concentrations of bioactive compounds between leaves and flowers (Figure 4).

2.4. Screening of Bioactive Compounds by Liquid Chromatography Coupled with Mass Spectrometry LC-MS

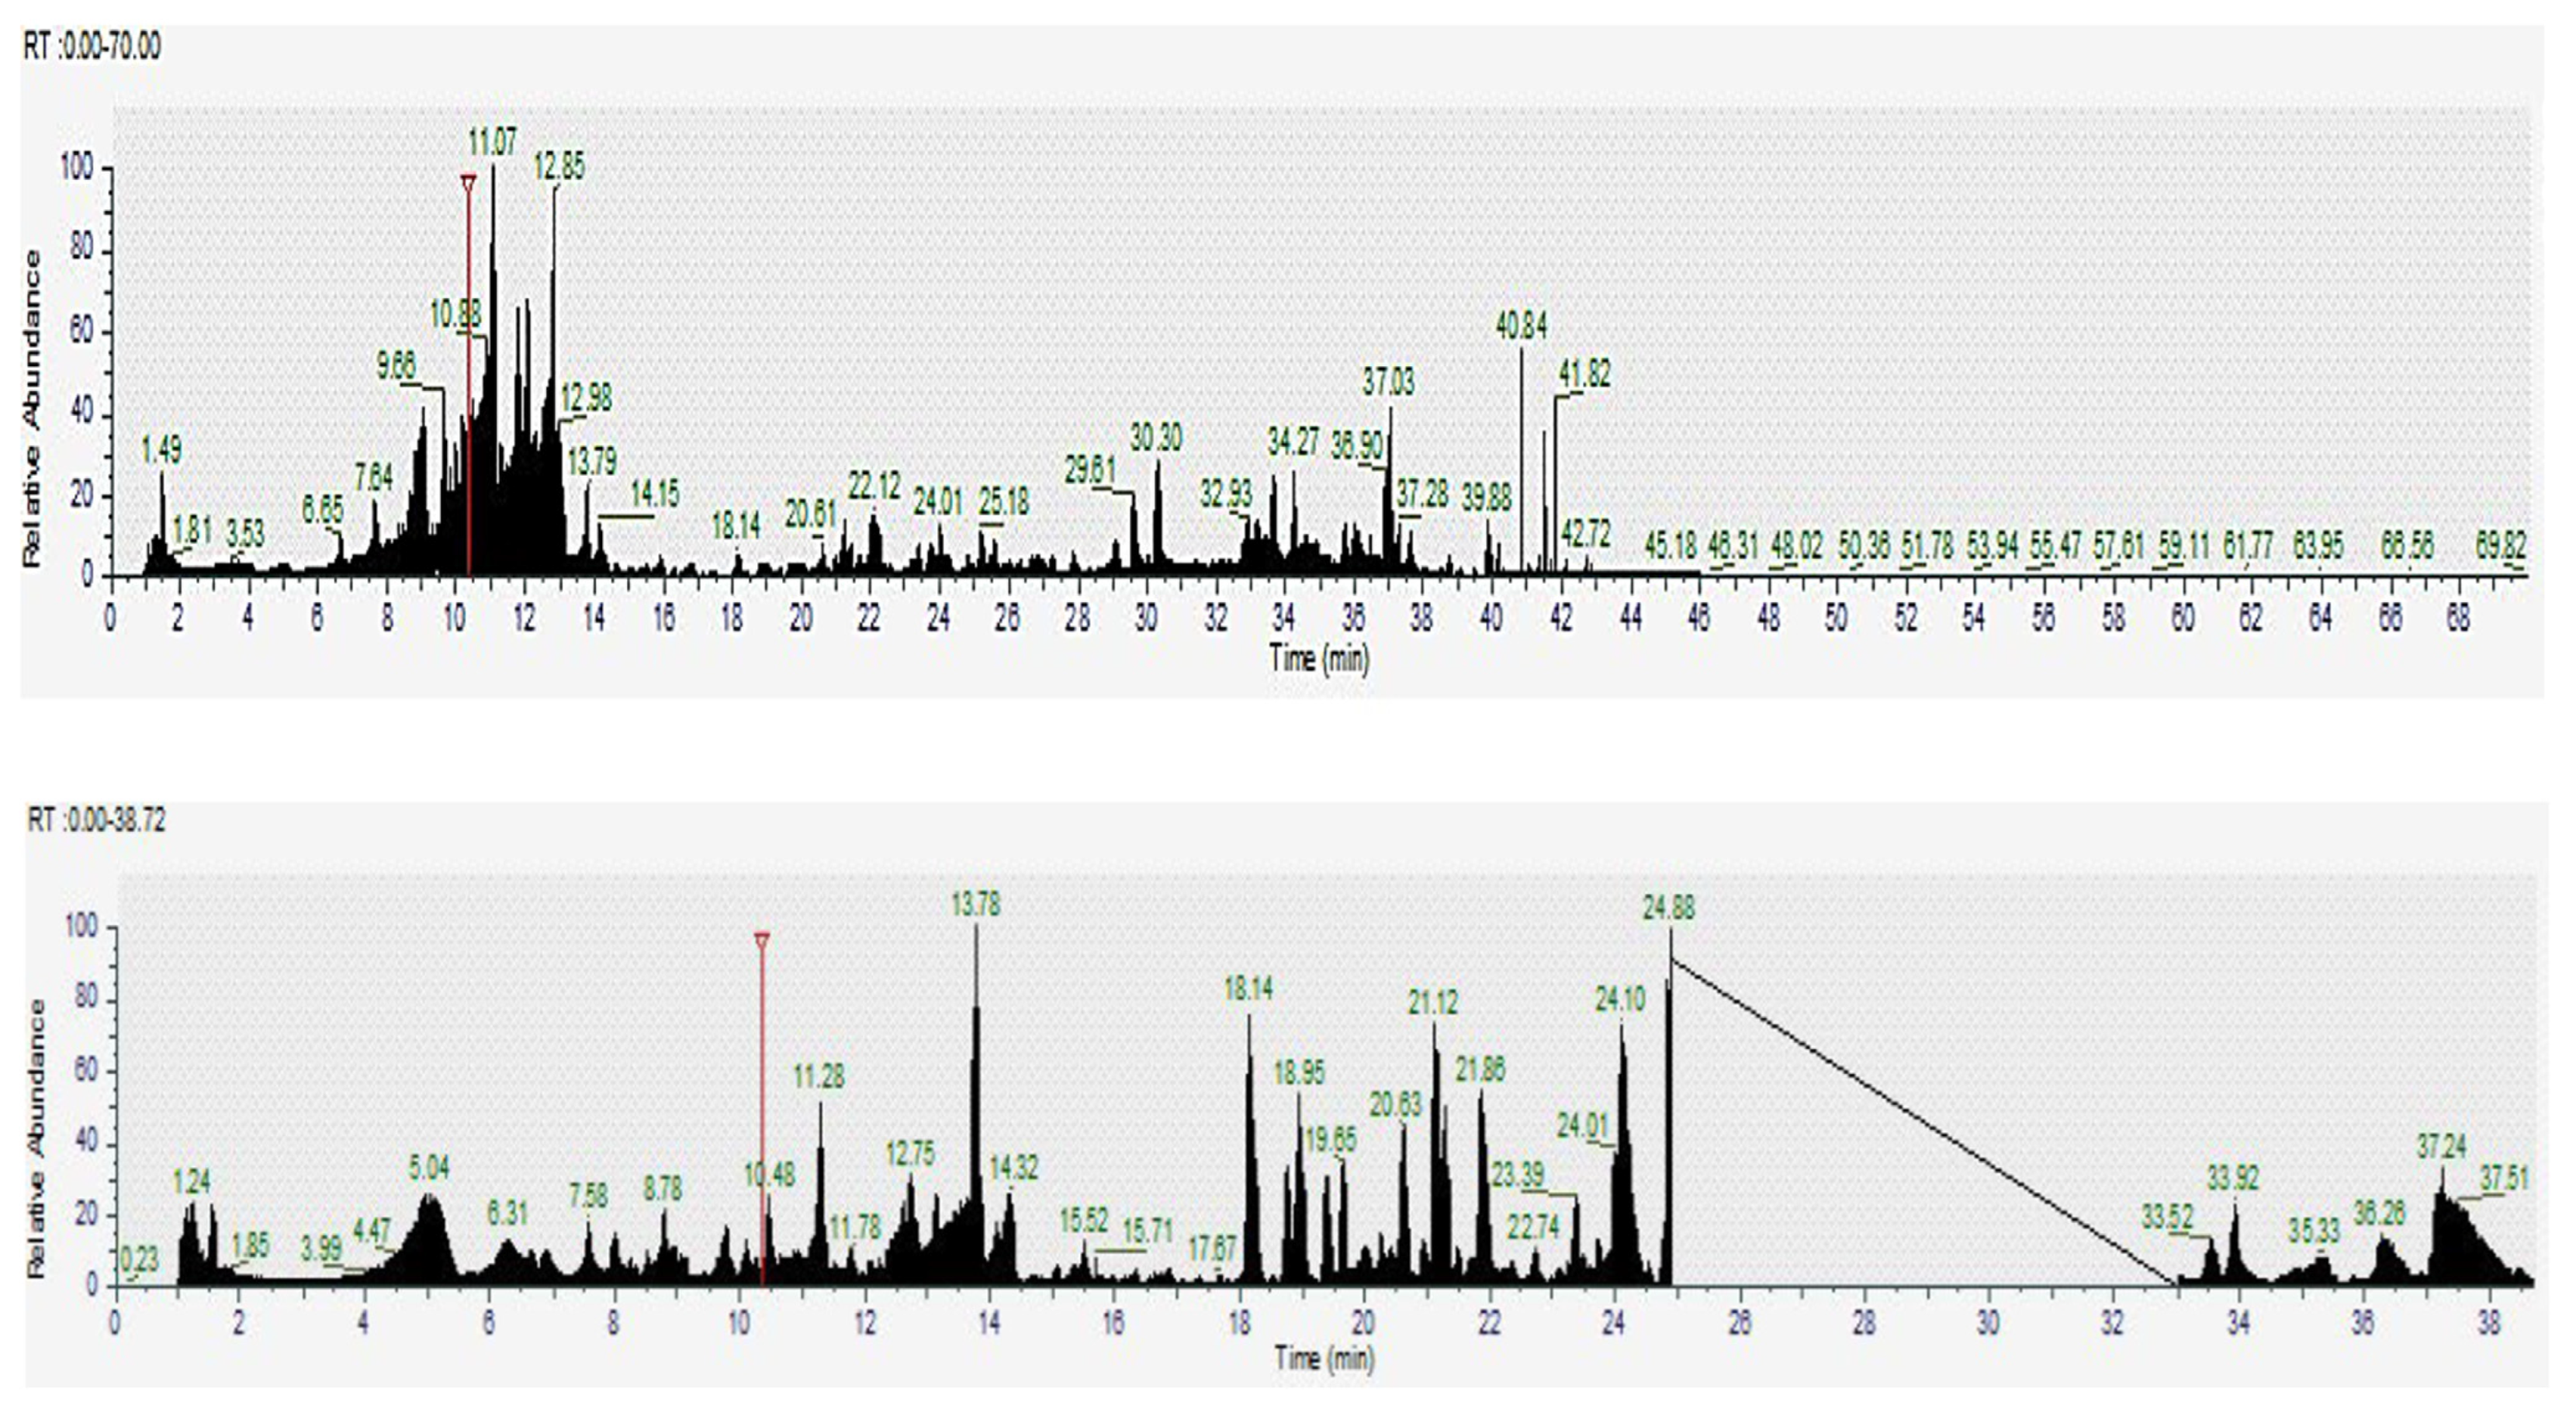
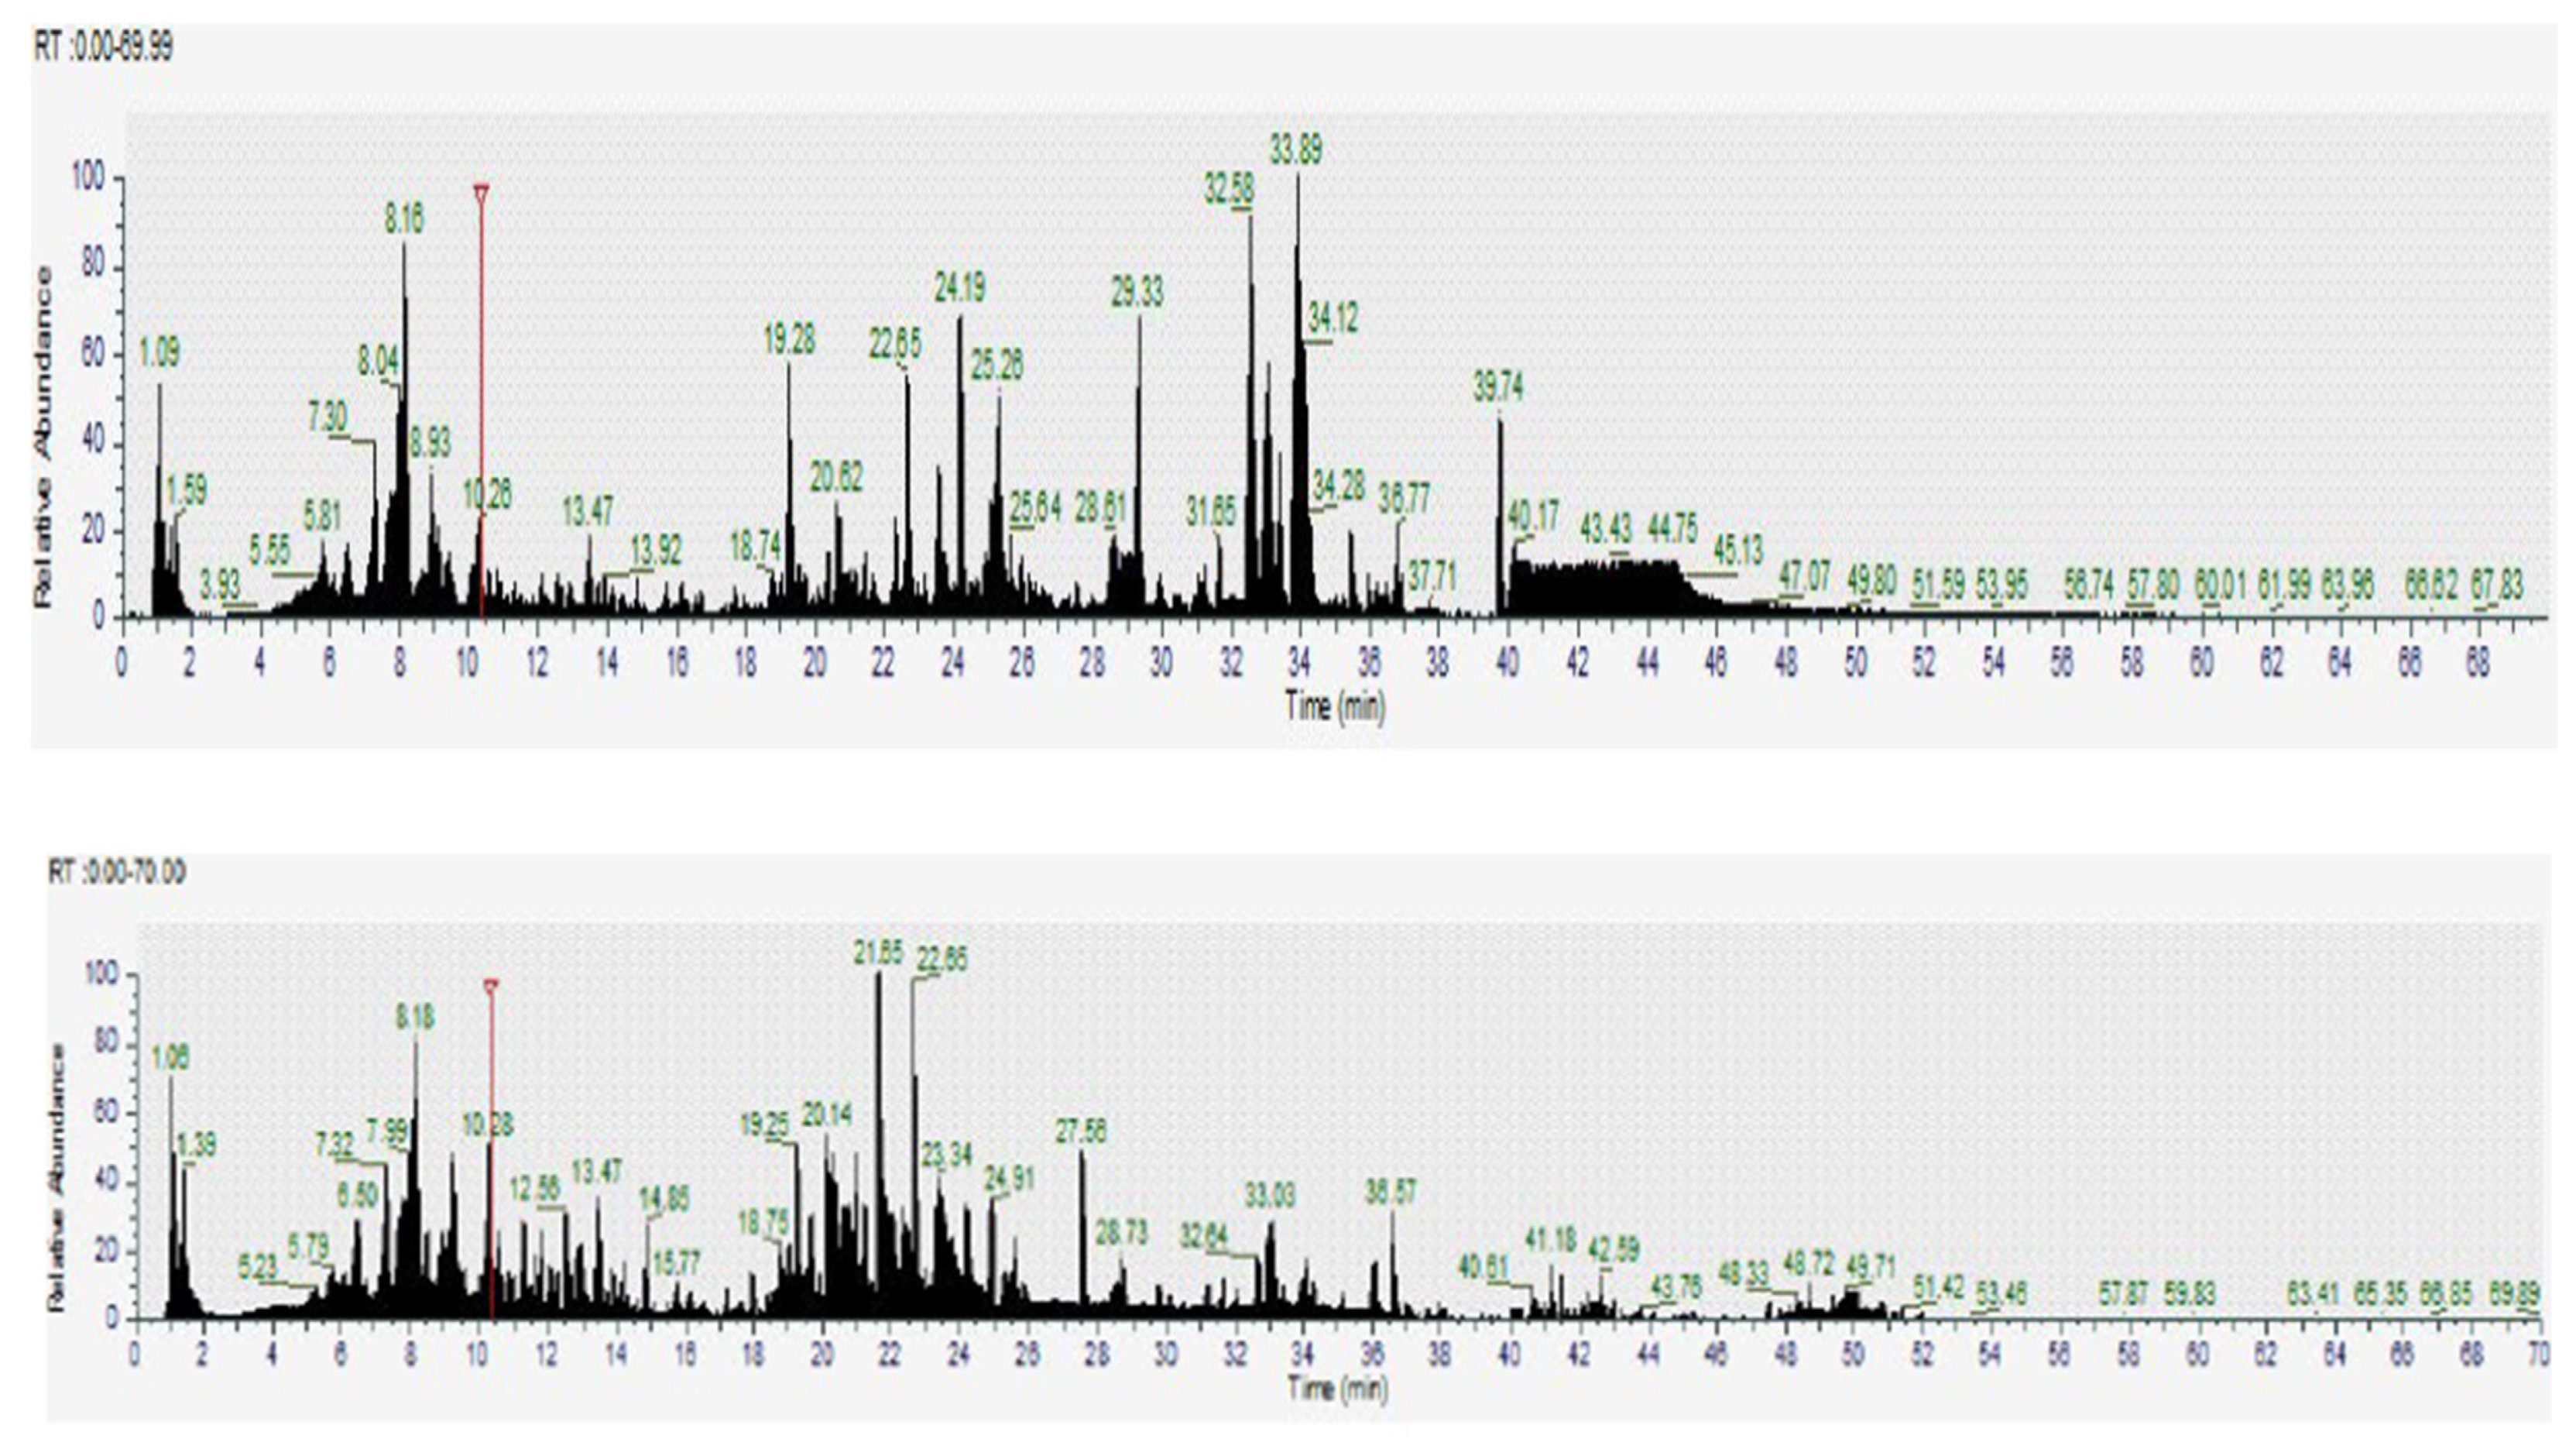
LC-MS was employed to identify bioactive and metabolic compounds in the leaves and flowers of Guayacan, a plant recognized for its potential medicinal properties. The analysis, based on molecular mass and retention times, revealed a wide diversity of significant compounds in both parts of the plant. Several bioactive compounds were identified using positive and negative ionization modes of LC-MS. In the leaves, key compounds such as phenolic acids (e.g., caffeic acid and sinapic acid), flavonoids such as luteolin-8-C-glucoside and quercetin-3-O-β-D-galactopyranoside, and other secondary metabolites such as α-lipoamide and quinurenic acid were highlighted. The flowers, on the other hand, presented a distinctive profile that included eriodictyol-7-O-glucoside, isorhamnetin-3-O-glucoside, and phenolic derivatives such as glycyrrhetinic acid and oleanolic acid (Table 2, Figure 5 and Figure 6).

3. Discussion

The analysis of total phenolic content and total flavonoid content in Guayacán leaves and flowers revealed significant tissue-specific variation in the accumulation of secondary metabolites, reflecting the plant’s adaptive strategies to different environmental and physiological demands. Although TPC levels were similar between leaves and flowers, leaves consistently exhibited higher TFC, with values such as 0.280 ± 0.005 mg QE/g DW in HG2 leaves compared to 0.249 ± 0.006 mg QE/g DW in FG2 flowers. This suggests a functional specialization in leaves, where flavonoid biosynthesis is prioritized due to their role as antioxidants and photoprotectors against environmental stresses such as UV radiation [11,12]. In contrast, flowers, despite having comparable TPC levels, may allocate phenolic resources to compounds involved in reproductive functions, such as pollinator attraction or floral pathogen defense [13]. The slight variation among samples (HG1, HG2, FG1, and FG2) highlights the influence of factors such as microclimatic conditions or phenological timing on secondary metabolite profiles [14]. These results align with studies emphasizing the need for multiple replicates to capture plant chemical diversity [14], underscoring the robustness of our experimental design.
The antioxidant capacity, assessed through ABTS, DPPH, and FRAP assays, demonstrated the superiority of leaves over flowers, with marked differences in their ability to mitigate oxidative stress. In the ABTS assay, leaves showed significantly higher activity (e.g., 10.57 ± 0.76 µmol Trolox/g DW in HG1) compared to flowers (e.g., 2.32 ± 0.53 µmol Trolox/g DW in FG1). This trend was reflected in the FRAP assay, where leaves exhibited strong reducing power (e.g., 22.67 ± 0.43 µmol Fe2+/g DW in HG1) compared to flowers (e.g., 3.33 ± 0.14 µmol Fe2+/g DW in FG1). These findings are consistent with the high flavonoid content in leaves, known for neutralizing reactive oxygen species (ROS) generated during photosynthesis [15]. The greater antioxidant capacity in leaves likely serves as a protective mechanism against environmental stressors such as solar radiation and herbivory [10], whereas the lower activity in flowers may reflect their transient nature and distinct metabolic priorities during reproduction [13]. This pattern reinforces the hypothesis of functional specialization between tissues in Guayacán.
The DPPH assay provided additional insights, revealing not only the superiority of leaves but also notable variability among flower samples. Leaves exhibited high antioxidant capacity, with values such as 37.24 ± 0.89 µmol Trolox/g DW in HG1 and 37.04 ± 1.23 µmol Trolox/g DW in HG2, while flowers showed divergent behavior: FG1 recorded 35.93 ± 1.36 µmol Trolox/g DW, comparable to leaves, whereas FG2 had only 9.07 ± 0.21 µmol Trolox/g DW. This discrepancy suggests that factors such as developmental stage or microenvironmental conditions influence antioxidant accumulation in floral tissues [13]. For instance, flowers at different maturity stages or those exposed to biotic stress may exhibit altered secondary metabolite profiles, as observed in other species [13]. The high DPPH value in FG1 indicates that, under certain conditions, Guayacán flowers can accumulate significant levels of bioactive compounds, warranting further investigation into the modulators of this variability.
Comparatively, the antioxidant capacity of Guayacán leaves rivals that of other well-studied natural sources. For example, the DPPH activity in HG1 leaves (37.24 ± 0.89 µmol Trolox/g DW) is similar to that reported for guava extracts (~30–40 µmol Trolox/g DW), a fruit recognized for its antioxidant properties. This positions Guayacán leaves as promising candidates for applications in functional foods or pharmaceuticals, where natural antioxidants are valued for their potential to mitigate oxidative stress-related disorders [16]. The consistent performance of leaves across multiple antioxidant assays underscores their reliability as a source of bioactive compounds, in contrast to the more variable profile of flowers. This comparison contextualizes the results and opens the door to exploring the economic and ecological value of Guayacán across different sectors.
The correlation analysis between antioxidant assays and bioactive compounds provided deeper insights into the underlying mechanisms. Strong positive correlations were observed between FRAP and DPPH (r = 0.993, p < 0.001) and between FRAP and ABTS (r = 0.930, p < 0.001), suggesting that phenolic compounds play a central role in free radical scavenging and reducing activities [17]. The positive correlation between ABTS and TFC (r = 0.930, p < 0.001) highlights the contribution of flavonoids to ABTS radical neutralization, likely due to their catechol groups and conjugated double bonds [18]. These findings reinforce the importance of employing multiple assays to capture diverse antioxidant mechanisms [18], validating the methodological robustness of this study and providing a solid foundation for future research on the antioxidant chemistry of Guayacán.
However, this study also revealed negative correlations and tissue-specific patterns that merit further exploration. A moderate negative correlation was observed between DPPH and ABTS in HG2 leaves (r = −0.948), possibly reflecting differential sensitivities of these assays to various antioxidant classes. While DPPH is more sensitive to lipophilic antioxidants, ABTS detects both hydrophilic and lipophilic compounds [19], which may explain the discrepancies. Additionally, the weak correlation between TPC and FRAP (r = −0.019) suggests that total phenolic content, as measured by the Folin–Ciocalteu method, does not fully explain the antioxidant activity [20]. This may be attributed to non-phenolic reducing agents or phenols with different reactivities [20], highlighting the complexity of plant antioxidant systems and the need for targeted analyses in future studies.
Tissue-specific differences in correlation patterns were also evident. Flowers (FG1 and FG2) showed consistently positive correlations between antioxidant assays (e.g., FRAP vs. DPPH, r = 0.933 in FG2), whereas leaves (HG1 and HG2) exhibited mixed results, including negative correlations (e.g., ABTS vs. DPPH, r = −0.776 in HG1).These disparities reflect variations in secondary metabolite composition between tissues [21,22]. Flowers may be enriched in specific flavonoids or phenolic acids that uniformly enhance antioxidant activity [21], whereas the more diverse profile of leaves, shaped by their roles in photosynthesis and defense, could result in more complex antioxidant interactions [22]. This analysis underscores the importance of considering physiological differences between tissues when interpreting antioxidant data.
The LC-MS analysis identified a diversity of secondary metabolites in Guayacán leaves and flowers, including bioactive compounds with known antioxidant properties. Flavonoids such as quercetin-3-O-glucoside and luteolin-8-C-glucoside, along with phenolic acids such as caffeic acid, were detected in both tissues, aligning with the metabolic profiles of Bignoniaceae [23,24]. These compounds are recognized for scavenging free radicals and mitigating oxidative stress [18,19], supporting the observed antioxidant potential. The presence of unique compounds—such as α-lipoamide in leaves and oleanolic acid in flowers—suggests chemical specialization [25,26]. α-Lipoamide may be linked to stress adaptation in leaves [25], while oleanolic acid in flowers could contribute to anti-inflammatory defenses [26]. These findings highlight the ecological and physiological importance of secondary metabolites in Guayacán, justifying future studies on their roles and applications.

4. Materials and Methods

4.1. Sample Collection

Mature leaves and flowers of Guayacan were collected in Esmeraldas (HG1 and FG1) and Guayas (HG2 and FG2) provinces to capture the diversity of environmental conditions in March 2023, during the dry season. Ten specimens were collected per site (5 leaves, 5 flowers), Flowers were collected at the full bloom stage to standardize the samples. The two provinces (Esmeraldas and Guayas) were chosen because of their differences in precipitation (Esmeraldas: ~1500 mm/year, Guayas: ~1000 mm/year) and mean temperature (Esmeraldas: 25–27 °C, Guayas: 23–25 °C), allowing the evaluation of environmental influences. These sites were strategically chosen to evaluate the potential influence of climatic and altitudinal variations on the antioxidant properties and secondary metabolite composition of Guayacan leaves and flowers.

4.2. Extraction of Bioactive Compounds

The extraction of bioactive compounds was performed following the protocol described by Claros (2021) [27] with modifications to optimize the process for Guayacan leaves and flowers. Fresh, mature plant material was finely ground using a mortar and pestle to obtain a homogeneous powder. Exactly 1 g of the powdered sample was weighed using an analytical balance and subsequently macerated in 15 mL Falcon tubes with 96% ethanol (10 mL), stirred with a glass rod, and kept for 72 h at 5 °C. Extractions were performed in triplicate; absorbance was measured with a UV–Vis spectrophotometer. Extracts were analyzed at a fixed concentration (1 g/10 mL ethanol) to establish a baseline. Future studies will incorporate dilution series to evaluate concentration-dependent effects. Analyses were performed with a UV–Vis spectrophotometer (Thermo Scientific Genesys 10S, Waltham, MA, USA), LC-MS (Vanquish HPLC, Thermo Fisher Scientific), and reagents from Sigma–Aldrich (Trolox, FeSO4-7H2O, DPPH, ABTS, AlCl3, and CH3COONa) (St. Louis, MO, USA).

4.3. Determination of Active Ingredients

The Folin–Ciocalteu colorimetric method (López-Froilán et al. (2018), [28]) with modifications, was used to determine the total phenolic content of Guayacan samples (leaves and flowers) by mixing the ethanolic extracts (0.4 mL) with Folin–Ciocalteu reagent diluted to 10% (v/v) (2 mL) and 7.5% sodium carbonate (1.6 mL). The absorbance of the mixture incubated at room temperature for 30 min was read at 765 nm. The calibration curve was performed using gallic acid solutions (0–250 mg/L), the blank being prepared by replacing the sample with ethanol. The results are expressed as milligrams of gallic acid equivalents per liter (mg GAE/L). For the determination of flavonoid content, the colorimetric aluminum chloride test was used, as described by Pekal et al. (2014) [29]. Ethanolic extracts (1 mL) were combined with 1.5 mL of solvent, 100 µL of 1 M sodium acetate (CH3COONa), 100 µL of 10% (v/v) aluminum chloride (AlCl3), and 2.3 mL of distilled water. The mixtures were incubated at room temperature for 40 min, after which their absorbance was recorded at 435 nm. A calibration curve was generated using quercetin solutions (0–1.5 mg/L), and the results were expressed as milligrams of quercetin equivalents per liter (mg QE/L).

4.4. Evaluation of Antioxidant Capacity Using FRAP, DPPH, and ABTS Assays

The antioxidant capacity of Guayacan leaves and flowers was evaluated using three complementary assays: FRAP, DPPH, and ABTS. These complementary methods provided a comprehensive assessment of the antioxidant potential of Guayacan leaves and flowers, elucidating their ability to scavenge free radicals and reduce metal ions under different conditions. All assays were conducted in triplicate for all samples (mature leaves and flowers) collected from two sites (Esmeraldas and Guayas).
The FRAP assay, which quantifies the reduction of Fe3+ to Fe2+, was conducted following the methodology described by Rajurkar et al. (2011) [30] with modifications. The FRAP reagent was prepared using 300 mM acetate buffer (pH 3.6), 40 mM HCl, and 20 mM FeCl3·6H2O. For the analysis, 100 µL of the plant extract was mixed with 300 µL of distilled water and 3 mL of the FRAP solution and incubated for 30 min at room temperature. The absorbance was measured at 593 nm. The calibration curve was constructed by using FeSO4 · 7H2O (0–5 mM). The results are expressed as Fe2+ equivalents.
The DPPH assay, used to determine the radical scavenging activity of antioxidants, was performed according to the method of Sachett et al. (2021) [31] and Thaweesang (2019) [32], with modifications. A DPPH stock solution (1 µg L1) was prepared, and 2 mL of this solution was mixed with 0.1 mL of plant extract. The reaction mixture was incubated in the dark at room temperature for 30 min, and absorbance was recorded at 517 nm. The percentage of radical scavenging activity was calculated using a standard curve, with Trolox as a reference compound.
The method of Kuskoski et al. (2005) [33] was used for the ABTS assay. In this method, the ABTS•+ radical is generated and adjusted to an absorbance of 0.7 ± 0.1 at 754 nm. The mixture (ABTS solution (2 mL) and extract (20 µL)) was incubated for 7 min in the dark. The absorbance was measured at 754 nm, and the results are expressed in Trolox equivalents (TE).

4.5. Determination of Bioactive Compounds by LC-MS

Liquid chromatography–mass spectrometry (LC-MS) was used to identify bioactive compounds from Guayacan samples (leaves and flowers) collected from Guayas according to the methodology described by Tohma et al. (2016) [34], with modifications. Extracts were produced using 20 mL of 80% ethanol starting from 1 g of lyophilized plant material; subsequently, the extract was incubated at 30 °C for 2 h [35]. Samples were centrifuged (5000 rpm) for 10 min at 4 °C, filtered, and the solvent was removed by rotary evaporation at 30 °C. The extracts thus obtained were stored at −20 °C in airtight tubes.
The LC-MS system used for the analysis consisted of a Vanquish HPLC unit (Thermo Fisher Scientific) coupled to an Ion Trap mass spectrometer. Chromatographic separation was performed using an Accucore Vanquish column (150 × 2.1 mm) maintained at 35 °C, with a flow rate of 0.5 mL/min [36]. A 10 µL injection of 0.1% formic acid solution was employed as the mobile phase. The identification of bioactive compounds was achieved by comparing mass spectra and retention times with standard ions from reference databases such as PubChem, ChEBI, Metlin, and HPLC repositories. Data processing and metabolite identification were conducted using MZmine 2.53 software, complemented with information from the scientific literature [37].

4.6. Statistical Analysis

Statistical analyses were performed using RStudio software (R version 4.3.2). A two-factor ANOVA was conducted to determine significant differences among groups, with a significance threshold set at p < 0.05. All experiments (TPC, TFC, ABTS, DPPH, and FRAP) were performed in triplicate for each sample (HG1, HG2, FG1, and FG2), with results expressed as mean ± standard deviation (n = 3 per sample, total n = 12 per essay). Additionally, Pearson’s correlation coefficient was calculated to assess the relationship between secondary metabolite content and antioxidant capacity.

5. Conclusions

This study highlights the significant role of Tabebuia chrysantha (Guayacan) as a source of natural antioxidants and bioactive compounds, particularly in leaves and flowers grown in Ecuador. The findings demonstrate the superior antioxidant capacity of leaves, driven by their higher accumulation of flavonoids and phenolic compounds, which are essential for mitigating oxidative stress caused by environmental factors like UV radiation. Flowers, while exhibiting lower antioxidant activity on average, revealed variability that could be influenced by factors such as growth conditions, developmental stages, or genetic variability. This underscores the importance of tissue-specific adaptations and their functional roles in the plant’s metabolism.
The LC-MS analysis further confirmed the presence of diverse secondary metabolites, including phenolic acids, flavonoids, and terpenoids, which exhibit strong antioxidant properties. The detection of unique compounds, such as α-lipoamide in leaves and oleanolic acid in flowers, highlights their potential as valuable bioactive resources for applications in phytotherapy and drug development. The strong correlations between antioxidant assays and bioactive compounds emphasize the importance of phenolics and flavonoids in free radical scavenging mechanisms, although the observed discrepancies point to the complexity of interactions among different metabolites.
In conclusion, this research established a foundational understanding of the chemical and biological potential of T. chrysantha cultivated in Ecuador, a species previously understudied in this region. By unveiling its antioxidant properties and metabolic diversity, this study not only highlights its therapeutic potential but also paves the way for further exploration into its application in pharmacology. These findings reinforce the need for continued research into Ecuadorian flora as a source of innovative solutions for health and wellness challenges.

Author Contributions

Conceptualization, R.A.M.; methodology, R.A.M.; formal analysis, R.F.V.G. and N.S.C.I.; investigation, R.F.V.G., N.R.M.M. and N.S.C.I.; resources, R.A.M.; writing—original draft preparation, R.A.M.; writing—review and editing, R.D.C.; supervision, R.A.M.; project administration, R.A.M.; funding acquisition, R.A.M. All authors have read and agreed to the published version of the manuscript.

Funding

This research was funded by Universidad de Las Fuerzas Armadas-ESPE, grant number CV-GNP-0066-2020, and the Institute of Biology Bucharest, Romanian Academy RO1567-IBB06/2025.

Institutional Review Board Statement

Not applicable.

Informed Consent Statement

Not applicable.

Data Availability Statement

The original contributions presented in this study are included in the article; further inquiries can be directed to the corresponding author due to privacy.

Acknowledgments

The authors would like to express their sincere gratitude to the communities of Cotopaxi Province, particularly the members of Jatari Unancha College in Guasaganda, for their invaluable assistance during the plant collection process and also to the Universidad de Las Fuerzas Armadas-ESPE for financial support.

Conflicts of Interest

The authors declare no conflicts of interest. The funders had no role in the design of the study; in the collection, analyses, or interpretation of data; in the writing of the manuscript; or in the decision to publish the result.

References

  1. Panda, S.P.; Panigrahy, U.P.; Panda, S.; Jena, B.R. Stem extract of Tabebuia chrysantha induces apoptosis by targeting sEGFR in Ehrlich Ascites Carcinoma. J. Ethnopharmacol. 2019, 235, 219–226. [Google Scholar] [CrossRef]
  2. Döring, M. GBIF Backbone Patch. GBIF Secretariat. Checklist Dataset. 2023. Available online: https://doi.org/10.15468/l07d61 (accessed on 4 March 2025).
  3. Vinueza, M. Tabebuia chrysantha (Jacq.) Nicholson. 201). Available online: https://ecuadorforestal.org/fichas-tecnicas-de-especies-forestales/ficha-tecnica-no-6-guayacan (accessed on 5 March 2025).
  4. Rojas-Rodríguez, F.; Torres-Córdoba, G. Árboles del Valle Central de Costa Rica: Reproducción cortés amarillo Tabebuia chrysantha (Jacq.) Nichols. Revista Forestal Mesoamericana Kurú 2016, 13, 66–68. [Google Scholar] [CrossRef]
  5. Block, G.; Dietrich, M.; Norkus, E.P.; Morrow, J.D.; Hudes, M.; Caan, B.; Packer, L. Factors Associated with Oxidative Stress in Human Populations. Am. J. Epidemiol. 2022, 156, 274–285. [Google Scholar] [CrossRef]
  6. Pizzino, G.; Irrera, N.; Cucinotta, M.; Pallio, G.; Mannino, F.; Arcoraci, V.; Squadrito, F.; Altavilla, D.; Bitto, A. Oxidative Stress: Harms and Benefits for Human Health. Oxid. Med. Cell Longev. 2017, 2017, 8416763. [Google Scholar] [CrossRef] [PubMed]
  7. Martínez, J.; Sierra, J.; Arrubla, R.; Martínez, P. Metabolitos secundarios en el guayacán amarillo y en el guayacán. Scientia et Technica 2011, 1, 297–301. [Google Scholar]
  8. Cardona-Trujillo, M.C.; Jiménez-González, F.J.; Veloza, L.A.; Sepúlveda-Arias, J.C. In Vitro Anti-Toxoplasma Activity of Extracts Obtained from Tabebuia rosea and Tabebuia chrysantha: The Role of β-Amyrin. Molecules 2024, 29, 920. [Google Scholar] [CrossRef] [PubMed]
  9. El-Hawary, S.S.; Taher, M.A.; Saleh, E.; AbouZid, S.F.; Mohammed, R. Genus Tabebuia: A comprehensive review journey from past achievements to future perspectives. Arabian J. Chem. 2021, 14, 103046. [Google Scholar] [CrossRef]
  10. Jiménez, F.V.L.; Sepúlveda, J. Anti-infectious activity in plants of the genus Tabebuia. Scientiarum 2013, 18, 257–267. [Google Scholar] [CrossRef]
  11. Fini, A.; Brunetti, C.; Di Ferdinando, M.; Ferrini, F.; Tattini, M. Stress-induced flavonoid biosynthesis and the antioxidant machinery of plants. Plant Sign Behav. 2011, 6, 709–711. [Google Scholar] [CrossRef]
  12. Tattini, M.; Loreto, F.; Fini, A.; Guidi, L.; Brunetti, C. Isoprenoids and phenylpropanoids are part of the antioxidant defense orchestrated daily by drought-stressed Platanus × acerifolia leaves during Mediterranean summers. New Phytol. 2015, 207, 613–626. [Google Scholar] [CrossRef]
  13. Schiestl, F.P.; Johnson, S.D. Pollinator-mediated evolution of floral signals. Trends Ecol. Evol. 2013, 28, 307–315. [Google Scholar] [CrossRef] [PubMed]
  14. Zargoosh, Z.; Ghavam, M.; Tavili, A. Environmental factors affecting the phenolic content and antioxidant activity of medicinal plants: A review. Ind. Crops Product. 2023, 198, 116684. [Google Scholar] [CrossRef]
  15. Agati, G.; Brunetti, C.; Fini, A.; Gori, A.; Guidi, L.; Landi, M.; Sebastiani, F.; Tattini, M. Are flavonoids sensors of environmental changes? A review on their biosynthesis and functions in plants under abiotic stress. Plant Cell Environ. 2020, 43, 2357–2375. [Google Scholar] [CrossRef]
  16. Kumar, S.; Pandey, A.K. Chemistry and biological activities of flavonoids: An overview. Sci. World J. 2013, 2013, 162750. [Google Scholar] [CrossRef]
  17. Thaipong, K.; Boonprakob, U.; Crosby, K.; Cisneros-Zevallos, L.; Byrne, D.H. Comparison of ABTS, DPPH, FRAP, and ORAC assays for estimating antioxidant activity from guava fruit extracts. J. Food Compos. Anal. 2006, 19, 669–675. [Google Scholar] [CrossRef]
  18. Pietta, P.G. Flavonoids as antioxidants. J. Nat. Prod. 2000, 63, 1035–1042. [Google Scholar] [CrossRef] [PubMed]
  19. Huang, D.; Ou, B.; Prior, R.L. The chemistry behind antioxidant capacity assays. J. Agric. Food Chem. 2005, 53, 1841–1856. [Google Scholar] [CrossRef]
  20. Ksouri, R.; Megdiche, W.; Falleh, H.; Trabelsi, N.; Boulaaba, M.; Smaoui, A.; Abdelly, C. Influence of biological, environmental and technical factors on phenolic content and antioxidant activities of Tunisian halophytes. C. R. Biol. 2008, 331, 865–873. [Google Scholar] [CrossRef]
  21. Wojdyło, A.; Oszmiański, J.; Czemerys, R. Antioxidant activity and phenolic compounds in 32 selected herbs. Food Chem. 2007, 105, 940–949. [Google Scholar] [CrossRef]
  22. Wang, W.; Sun, C.; Mao, L.; Ma, P.; Liu, F.; Yang, J.; Gao, Y. The biological activities, chemical stability, metabolism and delivery systems of quercetin: A review. Trends Food Sci. Technol. 2016, 56, 21–38. [Google Scholar] [CrossRef]
  23. Martins, F.O.; Esteves, P.F.; Mendes, G.S.; Barbi, N.S.; Menezes, F.S. Phytochemical and pharmacological overview of Bignoniaceae family. J. Pharm. Pharmacol. 2018, 70, 1293–1308. [Google Scholar] [CrossRef]
  24. Ferraz-Filha, Z.S.; Araújo, M.C.D.P.M.; Ferrari, F.C.; Dutra, I.P.A.R. Tabebuia roseoalba: In vivo hypouricemic and anti-inflammatory effects of its ethanolic extract and constituents. Planta Med. 2016, 82, 1395–1402. [Google Scholar] [CrossRef]
  25. Packer, L.; Cadenas, E. Lipoic acid: Energy metabolism and redox regulation of transcription and cell signaling. J. Clin. Biochem. Nutr. 2019, 65, 183–192. [Google Scholar] [CrossRef] [PubMed]
  26. Ayeleso, T.B.; Matumba, M.G.; Mukwevho, E. Oleanolic acid and its derivatives: Biological activities and therapeutic potential in chronic diseases. Molecules 2017, 22, 1915. [Google Scholar] [CrossRef] [PubMed]
  27. Claros, P. Evaluacion de la Capacidad Antioxidante Total y Contenido de Polifenoles Totales del Phaseolus vulgaris “Frijol”; Universidad Nacional José Faustino Sánchez Carrión: Huacho, Peru, 2021; Available online: https://repositorio.unjfsc.edu.pe/handle/20.500.14067/5297 (accessed on 5 March 2025).
  28. López-Froilán, R.; Hernández-Ledesma, B.; Cámara, M.; Pérez-Rodríguez, M. Evaluation of the Antioxidant Potential of Mixed Fruit-Based Beverages: A New Insight on the Folin-Ciocalteu Method. Food Anal. Met. 2018, 11, 2897–2906. [Google Scholar] [CrossRef]
  29. Pekal, A.; Pyrzynska, K. Evaluation of aluminum complexation reaction for flavonoid content assay. Food Anal. Met. 2014, 7, 1776–1782. [Google Scholar] [CrossRef]
  30. Rajurkar, N.S.; Hande, S.M. Estimation of phytochemical content and antioxidant activity of some selected traditional. Indian. J. Pharm. Sci. 2011, 73, 146–151. [Google Scholar] [CrossRef]
  31. Sachett, A.; Gallas-Lopes, M.; Conterato, G.M.M.; Herrmann, A.; Piato, A. Antioxidant Activity by DPPH Assay: In Vitro Protocol. Protocols Io. 2021. Available online: https://www.protocols.io/view/antioxidant-activity-by-dpph-assay-in-vitro-protocbtbpnimn (accessed on 3 September 2024).
  32. Thaweesang, S. Antioxidant activity and total phenolic compounds of fresh and blanching banana blossom (Musa ABB CV. Kluai “Namwa”) in Thailand. IOP Conf. Series Mater. Sci. Eng. 2019, 639, 012047. [Google Scholar] [CrossRef]
  33. Kuskoski, E.M.; Asuero, A.G.; Troncoso, A.M.; Mancini-Filho, J.; Fett, R. Aplicación de diversosmétodos químicos para determiner actividad antioxidante en pulpa de frutos. Food Sci. Technol. 2005, 25, 726–732. [Google Scholar] [CrossRef]
  34. Tohma, H.; Koksal, E.; Kılıc, O.; Alan, Y.; Yılmaz, M.A.; Gulcin, I.; Bursal, E.; Alwasel, S.H. RP-HPLC/MS/MS analysis of the phenolic compounds, antioxidant and antimicrobial activities of Salvia L. species. Antioxidants 2016, 5, 5040038. [Google Scholar] [CrossRef]
  35. Irakli, M.; Skendi, A.; Bouloumpasi, E.; Chatzopoulou, P.; Biliaderis, C.G. LC-MS identification and quantification of phenolic compounds in solid residues from the essential oil industry. Antioxidants 2021, 10, 2016. [Google Scholar] [CrossRef] [PubMed]
  36. Kluskal, T.; Castillo, S.; Villar-Briones, A.; Orešič, M. MZmine 2: Modular framework for processing, visualizing, and analyzing mass spectrometry-based molecular profile data. BMC Bioinform. 2010, 11, 395. [Google Scholar]
  37. Cellier, G.; Moreau, A.; Chabirand, A.; Hostachy, B.; Ailloud, F.; Prior, P. A Duplex PCR Assay for the Detection of Ralstonia solanacearum Phylotype II Strains in Musa spp. PLoS ONE 2015, 10, e0122182. [Google Scholar] [CrossRef] [PubMed]
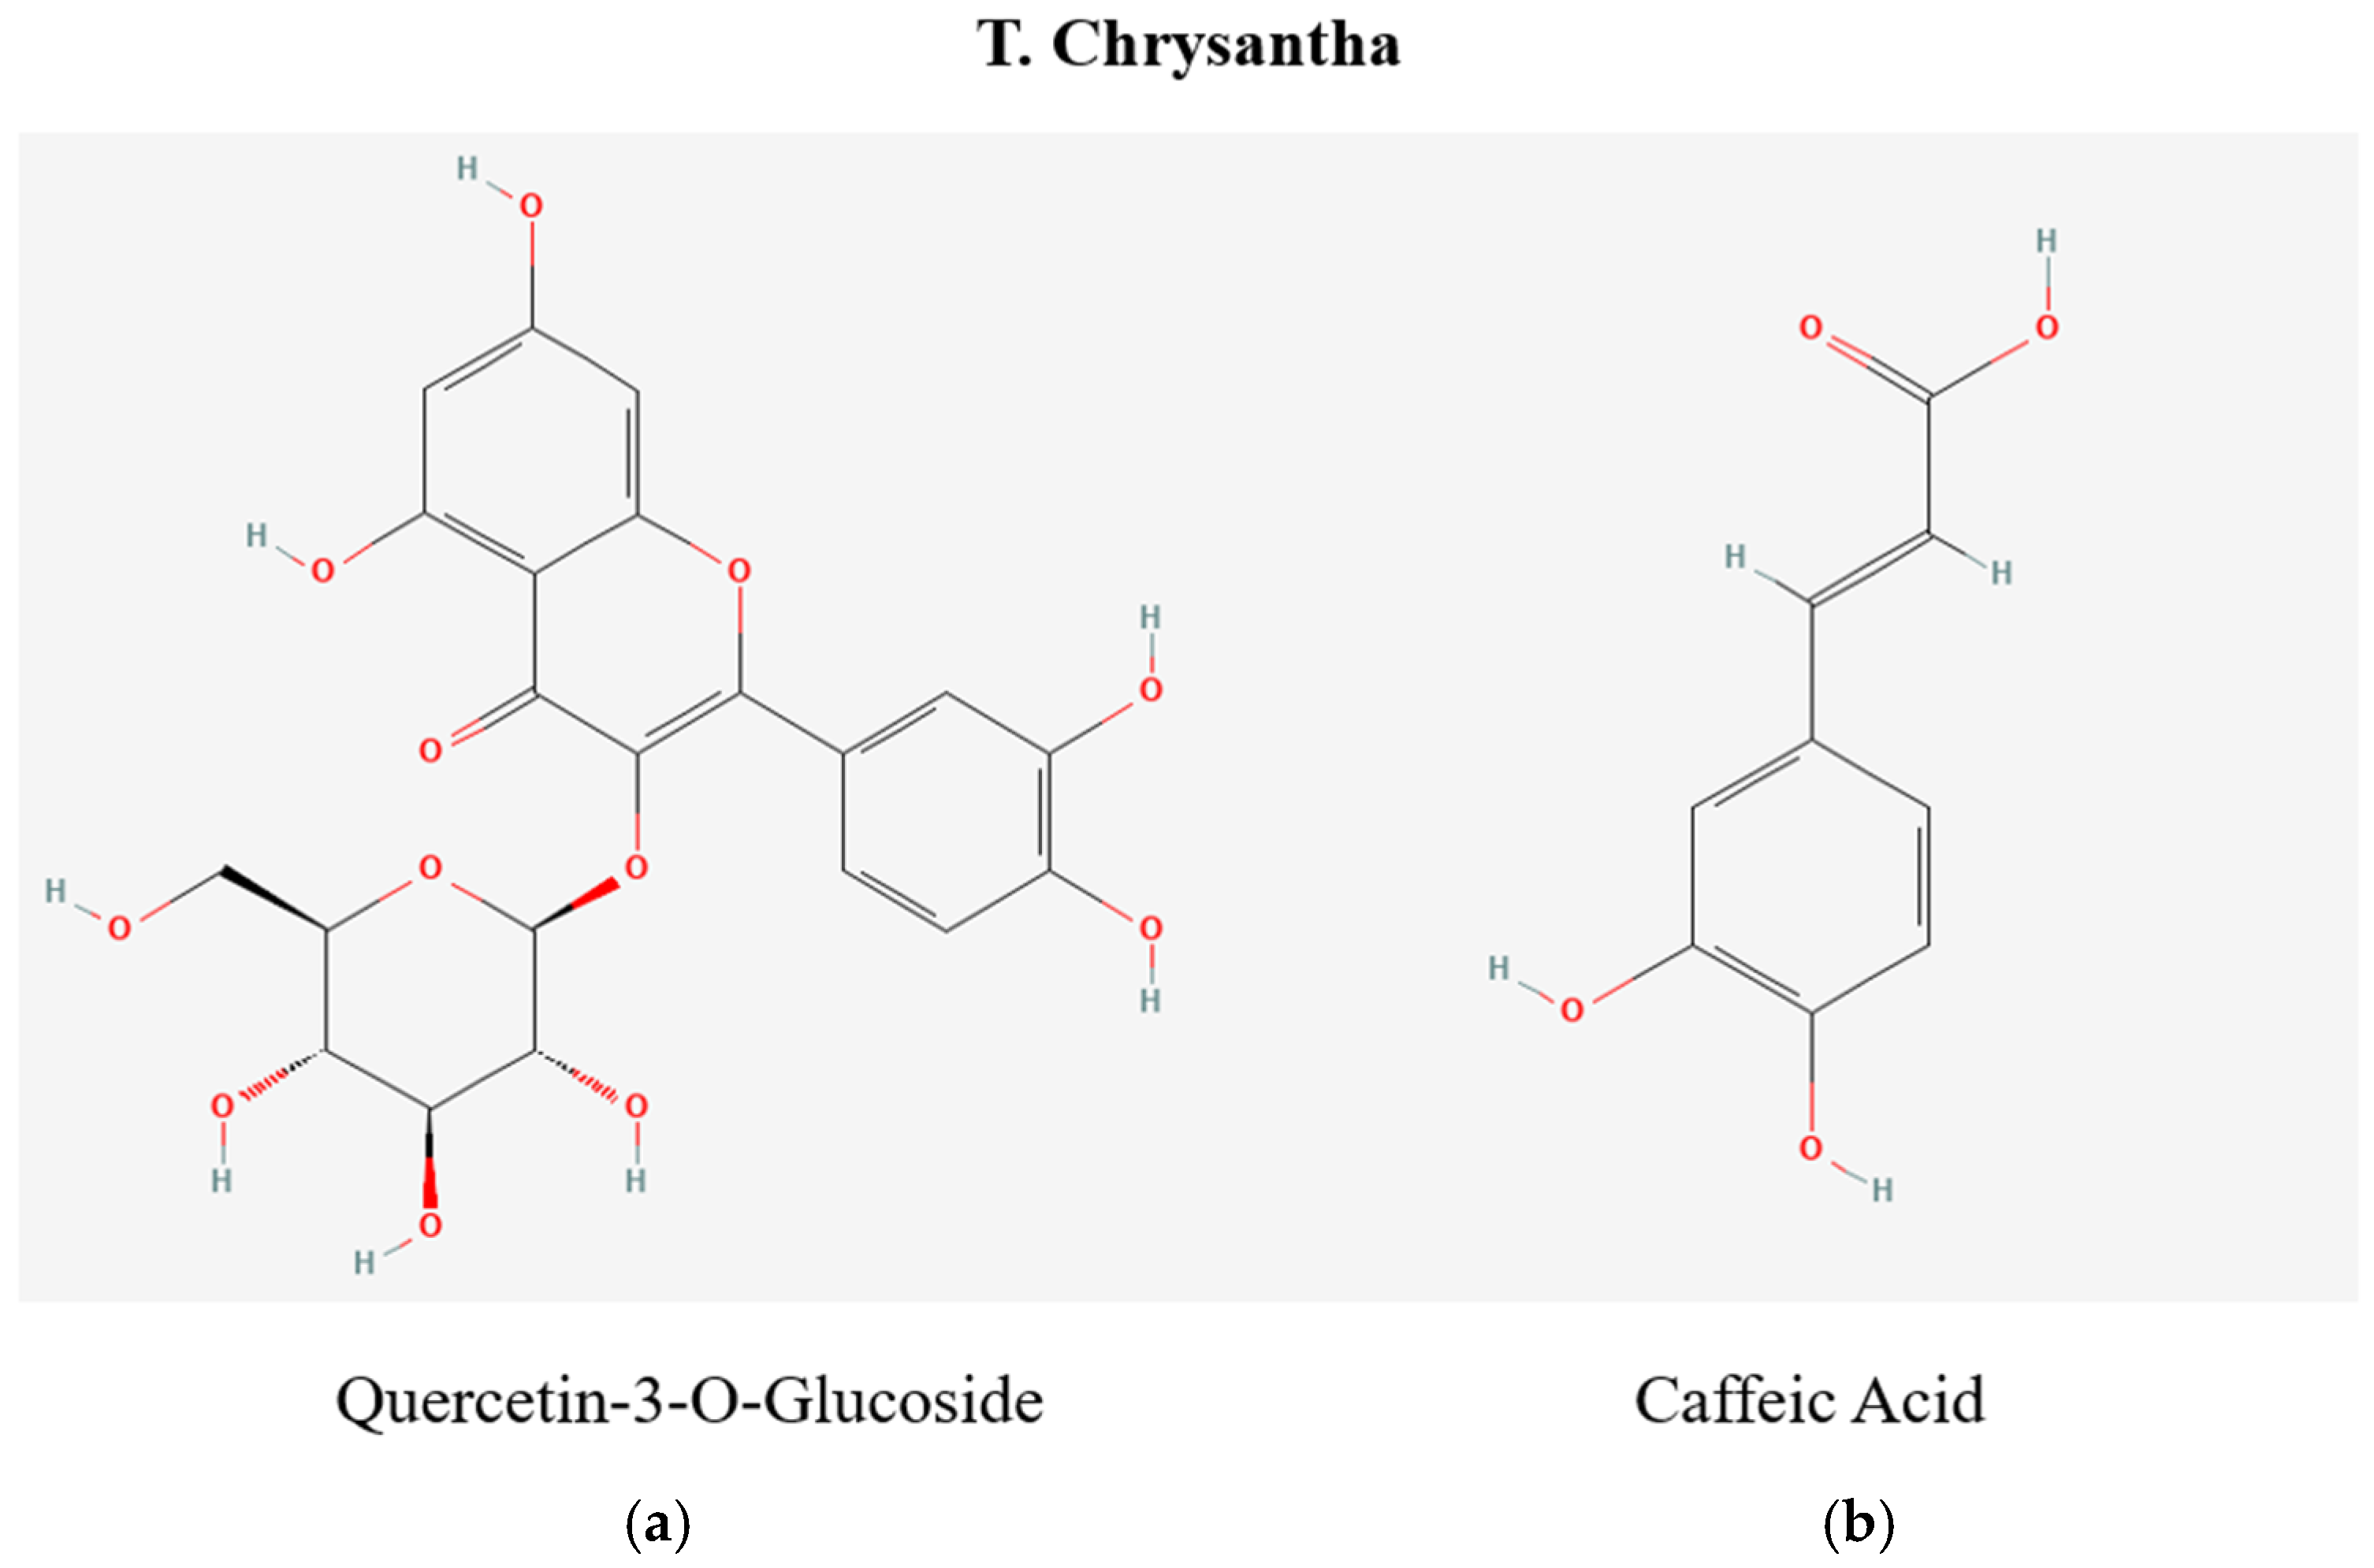
Figure 1. Chemical structures of key bioactive compounds in T. chrysantha: (a) quercetin-3-O-glucoside, (b) caffeic acid.
Pharmaceuticals 18 00649 g001
Figure 2. Distribution of total phenolic content (TPC) and total flavonoid content (TFC) in Guayacan leaves and flowers. The violin plots illustrate the variation in TPC (left) and TFC (right) across four samples: HG1 and HG2 (leaves) and FG1 and FG2 (flowers). Black dots represent individual measurements, providing insight into the variability within each group.
Pharmaceuticals 18 00649 g002
Figure 3. Antioxidant activity determined by FRAP, DPPH, and ABTS assays in Guayacan leaves and flowers. The radar chart represents the average antioxidant activity values for each sample, highlighting significant differences among the methods. Values are based on triplicate replications.
Pharmaceuticals 18 00649 g003
Figure 4. Correlation matrix between antioxidant capacity assays (ABTS, DPPH, and FRAP) and bioactive compounds (TPC and TFC) in Guayacan leaves (HG1 and HG2) and flowers (FG1 and FG2). Correlation coefficients (r) are displayed in each cell, with statistical significance indicated by asterisks (* p < 0.05; ** p < 0.01; *** p < 0.001). The diagonal shows density distributions for each variable, while scatterplots with regression lines illustrate pairwise relationships. The data were analyzed for each tissue type, highlighting differences in the interplay between secondary metabolites and antioxidant properties, different colors indicate data for each sample, lines represent the fitted correlation trend for the respective assays.
Pharmaceuticals 18 00649 g004
Figure 5. LC-MS chromatogram (positive and negative ion mode) of Guayacan leaves in Guayas. The chromatogram displays the retention times and corresponding molecular ion peaks of various bioactive compounds identified in the sample. Key peaks represent different bioactive metabolites, which contribute to the biochemical profile of the Guayacan leaves. The data obtained from the LC-MS analysis helps to identify compounds associated with the antioxidant and metabolic properties of this plant. Base Peak m/z = 50.00–2000.00 MS.
Pharmaceuticals 18 00649 g005
Figure 6. LC-MS chromatogram (positive and negative ion mode) of Guayacan flowers in Guayas. The chromatogram illustrates the retention times and molecular ion peaks of various bioactive compounds identified in the sample. Prominent peaks correspond to flavonoids such as eriodictyol-7-O-glucoside and isorhamnetin-3-O-glucoside, as well as phenolic derivatives like glycyrrhetinic acid and oleanolic acid, which contribute to the antioxidant properties of Guayacan flowers. This profile highlights the richness of secondary metabolites present in this part of the plant. Base Peak m/z = 50.00–2000.00 MS.
Pharmaceuticals 18 00649 g006
Table 1. Summary of Total Phenol Content (TPC), Total Flavonoids (TFC) and Antioxidant Capacity in Guaiacum Leaves and Flowers.
SamplesTPC (mg GAE/g DW)TFC (mg QE/g DW)ABTS (µmol Trolox/g DW)DPPH (µmol Trolox/g DW)FRAP (µmol Fe2+/g DW)
HG12.645 ± 0.0410.275 ± 0.00510.57 ± 0.7637.24 ± 0.8922.67 ± 0.43
HG22.646 ± 0.0420.280 ± 0.00510.84 ± 0.5137.04 ± 1.2320.88 ± 0.68
FG12.653 ± 0.0480.260 ± 0.0062.32 ± 0.5335.93 ± 1.363.33 ± 0.14
FG22.646 ± 0.0420.249 ± 0.0062.61 ± 0.069.07 ± 0.212.65 ± 0.10
Note: Values expressed as mean ± standard deviation (n = 3).
Table 2. Bioactive and Metabolic Compounds tentatively assigned in Guayacan Leaves and Flowers Using LC-MS.
IDm/zRetention TimeProposed Compound IdentityMolecular IonMolecular
Formula
Plant
Source
Ionization Mode
2057465.3071511Quercetin-3-O-glucoside (Hyperoside)M+HC21H20O12Flower and LeafPositive
3915449.2767392Luteolin-8-C-glucosideM+HC21H20O11Flower and LeafPositive
8557465.35111,135Quercetin-3-O-β-D-galactopyranosideM+HC21H20O12Flower and LeafPositive
11474419.35713,177LiquiritinM+HC21H22O9Flower and LeafPositive
13457593.18714,666Acacetin-7-O-rhamnosylglucoside (Fortunellin)M+HC28H32O14Flower and LeafPositive
1820179.18819.878Caffeic acid *M-HC9H8O4Flower and LeafNegative
2443223.23324.767Sinapinic acidM-HC11H12O5Flower and LeafNegative
1966340.04621.087Aristolochic acid CM-HC17H11NO7Flower and LeafNegative
1242375.12915.621Deoxyloganic acidM-HC16H24O10Flower and LeafNegative
2136206.1691623α-LipoamideM+HC8H15NOS2LeafPositive
2446190.1353799Kynurenic acidM+HC10H7NO3LeafPositive
3159419.2865999Aloin AM+HC21H22O9LeafPositive
4606463.0888073Kaempferol-3-O-glucuronideM+HC21H18O12LeafPositive
6315449.3209576PlantagininM+HC21H20O11LeafPositive
6331481.36596533,5,7,8,3,4-Hexahydroxyflavone-8-O-glucosideM+HC21H20O13LeafPositive
7746519.38910.516-O-MalonylcosmosiinM+HC24H22O14LeafPositive
10032479.39812,051Isorhamnetin-3-O-glucosideM+HC22H22O12LeafPositive
10052315.31612.09VelutinM+HC16H12O6LeafPositive
10463257.28412,389PinocembrinM+HC15H12O4LeafPositive
10896241.26512,6936-HydroxyflavanoneM+HC15H12O3LeafPositive
11006293.36812,932(10E,15E)-9,12,13-Trihydroxyoctadeca-10,15-dienoic acidM-2H2O+HC18H28O3LeafPositive
12854623.43014.12PectolinarinM+HC29H34O15LeafPositive
19210449.10824,978Luteolin-6-C-glucosideM+C21H20O11LeafPositive
1996205.0971472L-TryptophanM+HC11H12N2O2LeafPositive
3409225.1846465Phenazine-1-carboxylic acidM+HC13H8N2O2LeafPositive
18477329.30922,338LabetalolM+HC19H24N2O3LeafPositive
18850255.31623,71710,11-Dihydro-10-hydroxycarbamazepineM+HC15H14N2O2LeafPositive
321181.2545.192SorbitolM-HC6H14O6LeafNegative
566179.2315.365Hexose (e.g., glucose, fructose, mannose, galactose)M-HC6H12O6LeafNegative
1961190.28121.0535-Hydroxyindoleacetic acid (5-HIAA)M-HC10H9NO3LeafNegative
9962451.40412,045Eriodictyol-7-O-glucosideM+HC21H22O11FlowerPositive
10032479.39812,051Isorhamnetin-3-O-glucosideM+HC22H22O12FlowerPositive
17819415.3962051Chafuroside AM+HC21H20O11FlowerPositive
18383427.29221,962LeupeptinM+HC20H38N6O4FlowerPositive
18391291.31121,978CatechinM+HC15H14O6FlowerPositive
18569299.31322,705EnterolactoneM+HC18H18O4FlowerPositive
18887471.44723,737Glycyrrhetinic acidM+C30H46O4FlowerPositive
19210281.30324,938AspartylphenylalanineM+HC13H16N2O5FlowerPositive
19406299.29525,884EnterolactoneM+HC18H18O4FlowerPositive
19422365.41725,948Xanthosine 5′-monophosphate (XMP)M+HC10H13N4O9PFlowerPositive
19630427.4722698LeupeptinM+C20H38N6O4FlowerPositive
20879265.29730,936Abscisic acidM+HC15H20O4FlowerPositive
20907323.35230,936ChloramphenicolM+C11H12Cl2N2O5FlowerPositive
21401277.33832,298Glutamylglutamic acidM+HC10H16N2O7FlowerPositive
21903415.47633,398PodophyllotoxinM+HC22H22O8FlowerPositive
23063609.53135,2843,10S-DihydroxypheophorbideM+HC33H34N4O6FlowerPositive
23713457.51336,385Oleanolic acidM+HC30H48O3FlowerPositive
Legend: Compounds tentatively identified by a comparison of fragmentation and formulas with databases (PubChem, Metlin) and the literature. m/z observed to three decimal places; m/z calculated according to exact masses in [M+H]+ or [M-H]-mode. Tolerance: ±0.001 Da. Retention in minutes. *—previously mentioned in the literature for the same species.
Disclaimer/Publisher’s Note: The statements, opinions and data contained in all publications are solely those of the individual author(s) and contributor(s) and not of MDPI and/or the editor(s). MDPI and/or the editor(s) disclaim responsibility for any injury to people or property resulting from any ideas, methods, instructions or products referred to in the content.