
Comparison of the Blood–Brain Barrier Penetration Ability and Anti-Neuroinflammatory Activity of Chromones in Two Types of Agarwood


Abstract
1. Introduction
2. Results
2.1. Species Identification
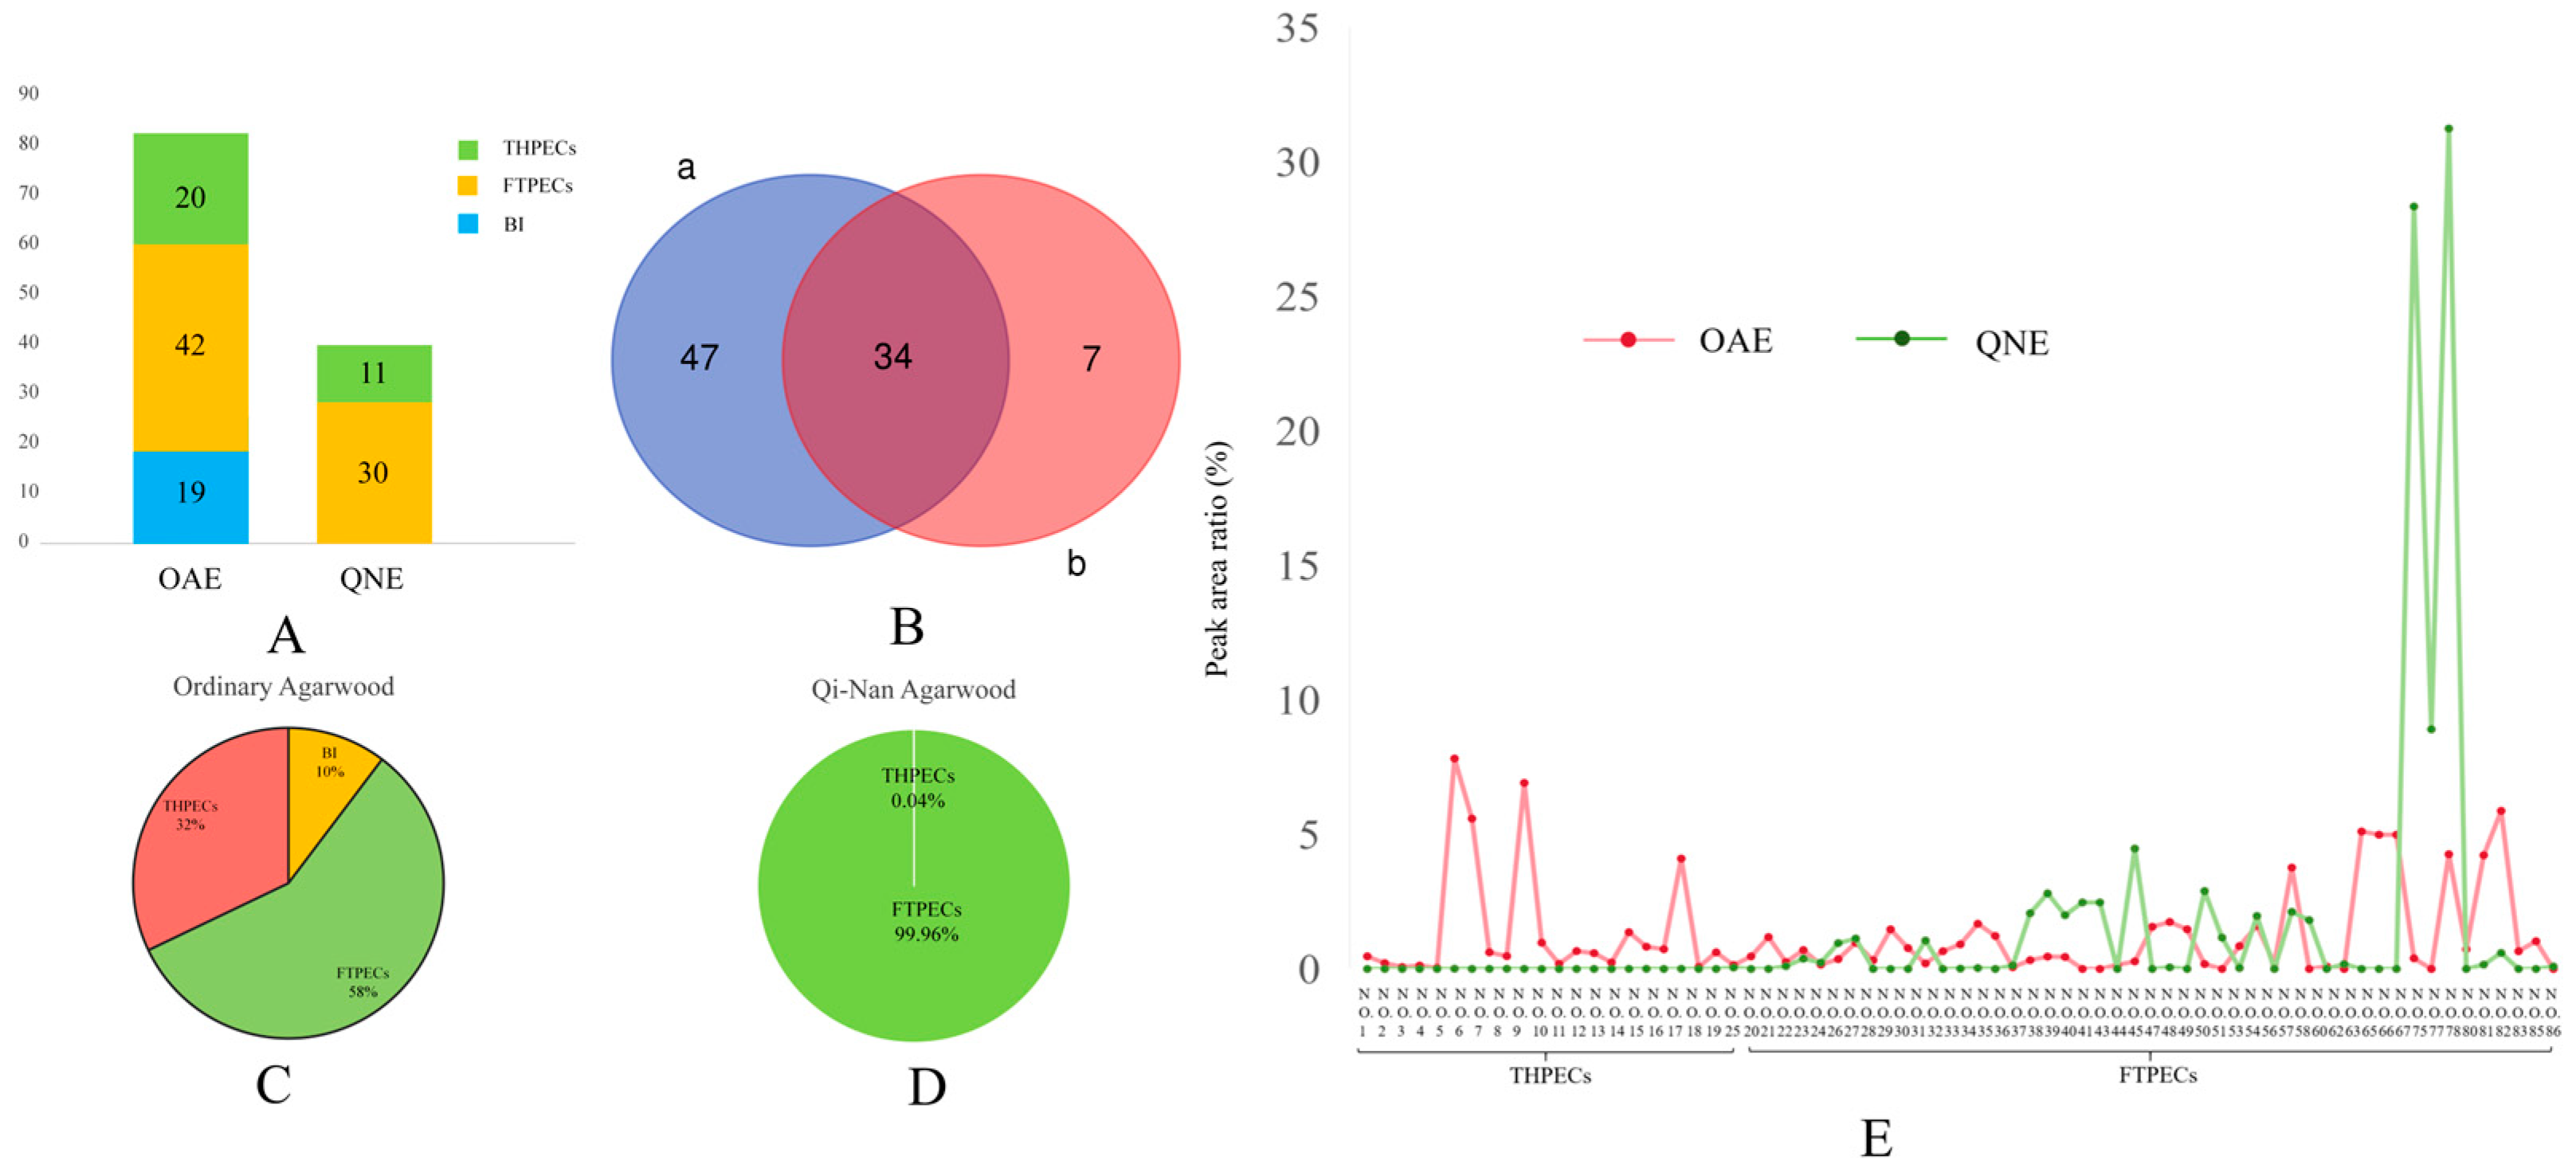
2.2. Comparative Analysis of the Chromones in Ordinary and Qi-Nan Agarwood
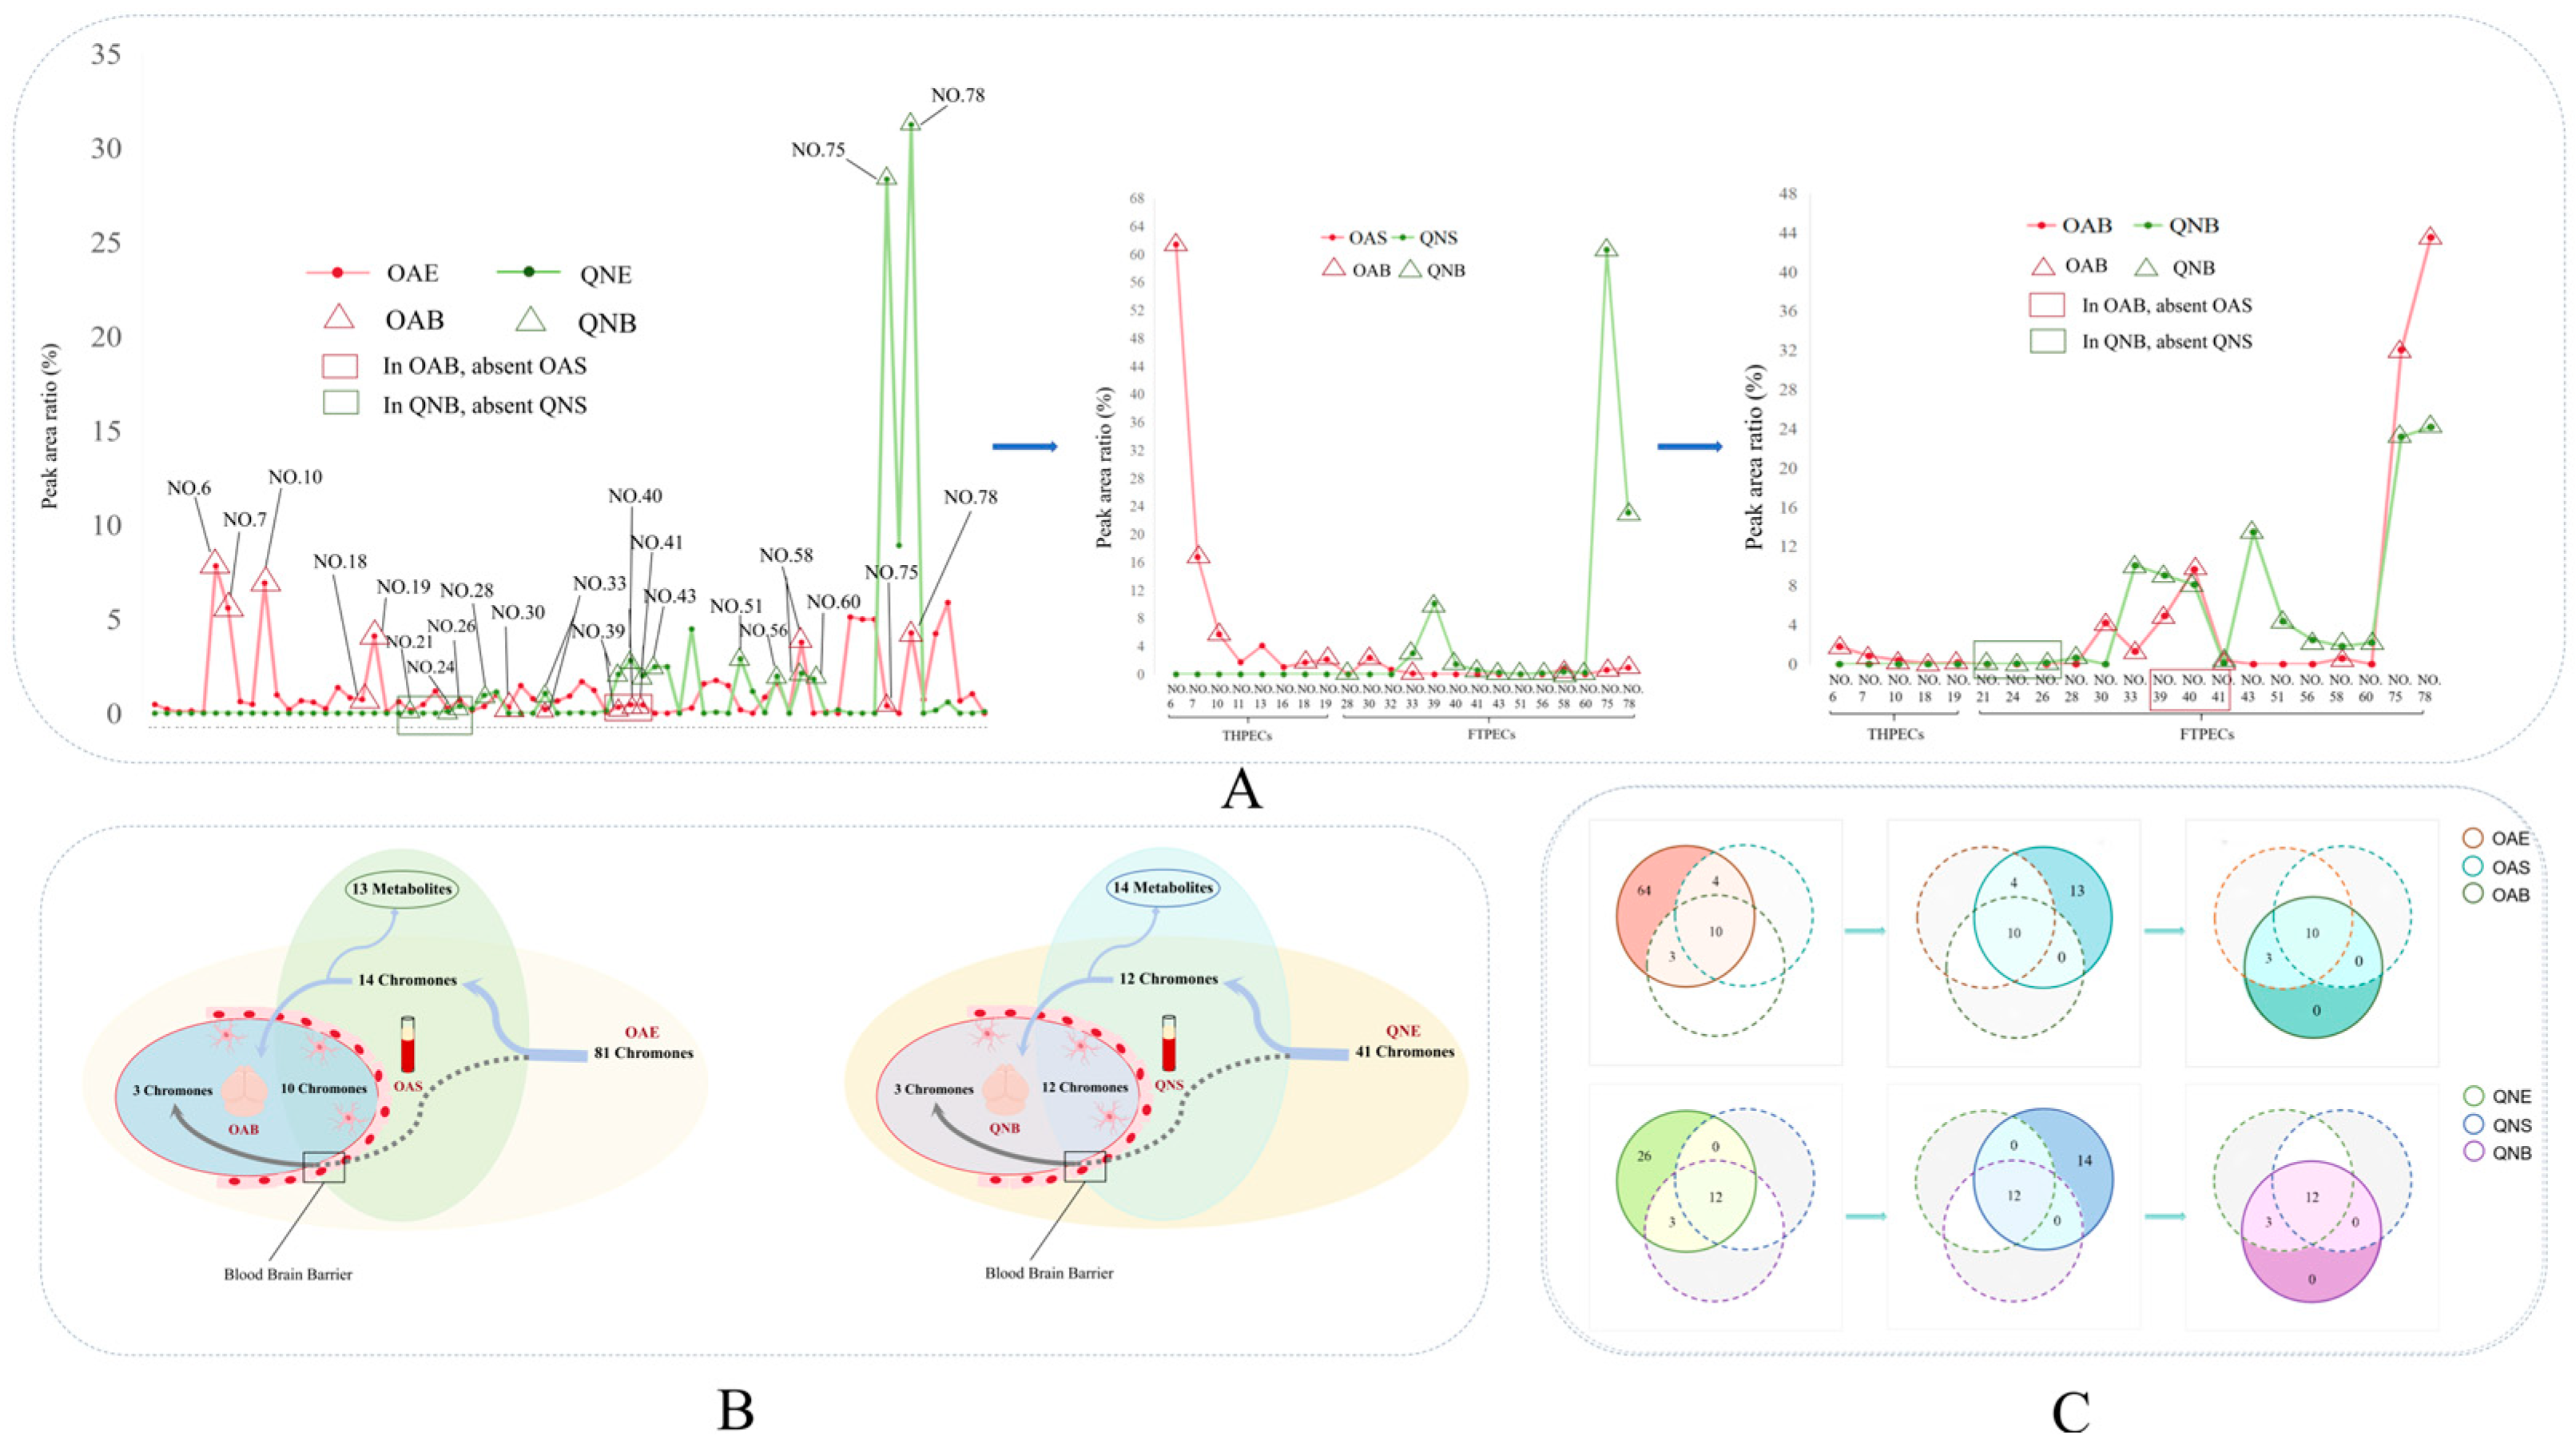
2.3. Comparative Analysis of the Blood-Penetrating Chromones in the Two Types of Agarwood
2.4. Comparative Analysis of the Brain-Penetrating Chromone Components in the Two Types of Agarwood
2.5. The Transfer Process of the Chromone Components of the Two Types of Agarwood in Ethanol Extract, Serum, and Brain Tissue
2.6. Blood–Brain Relative Abundance of the Two Types of Chromones
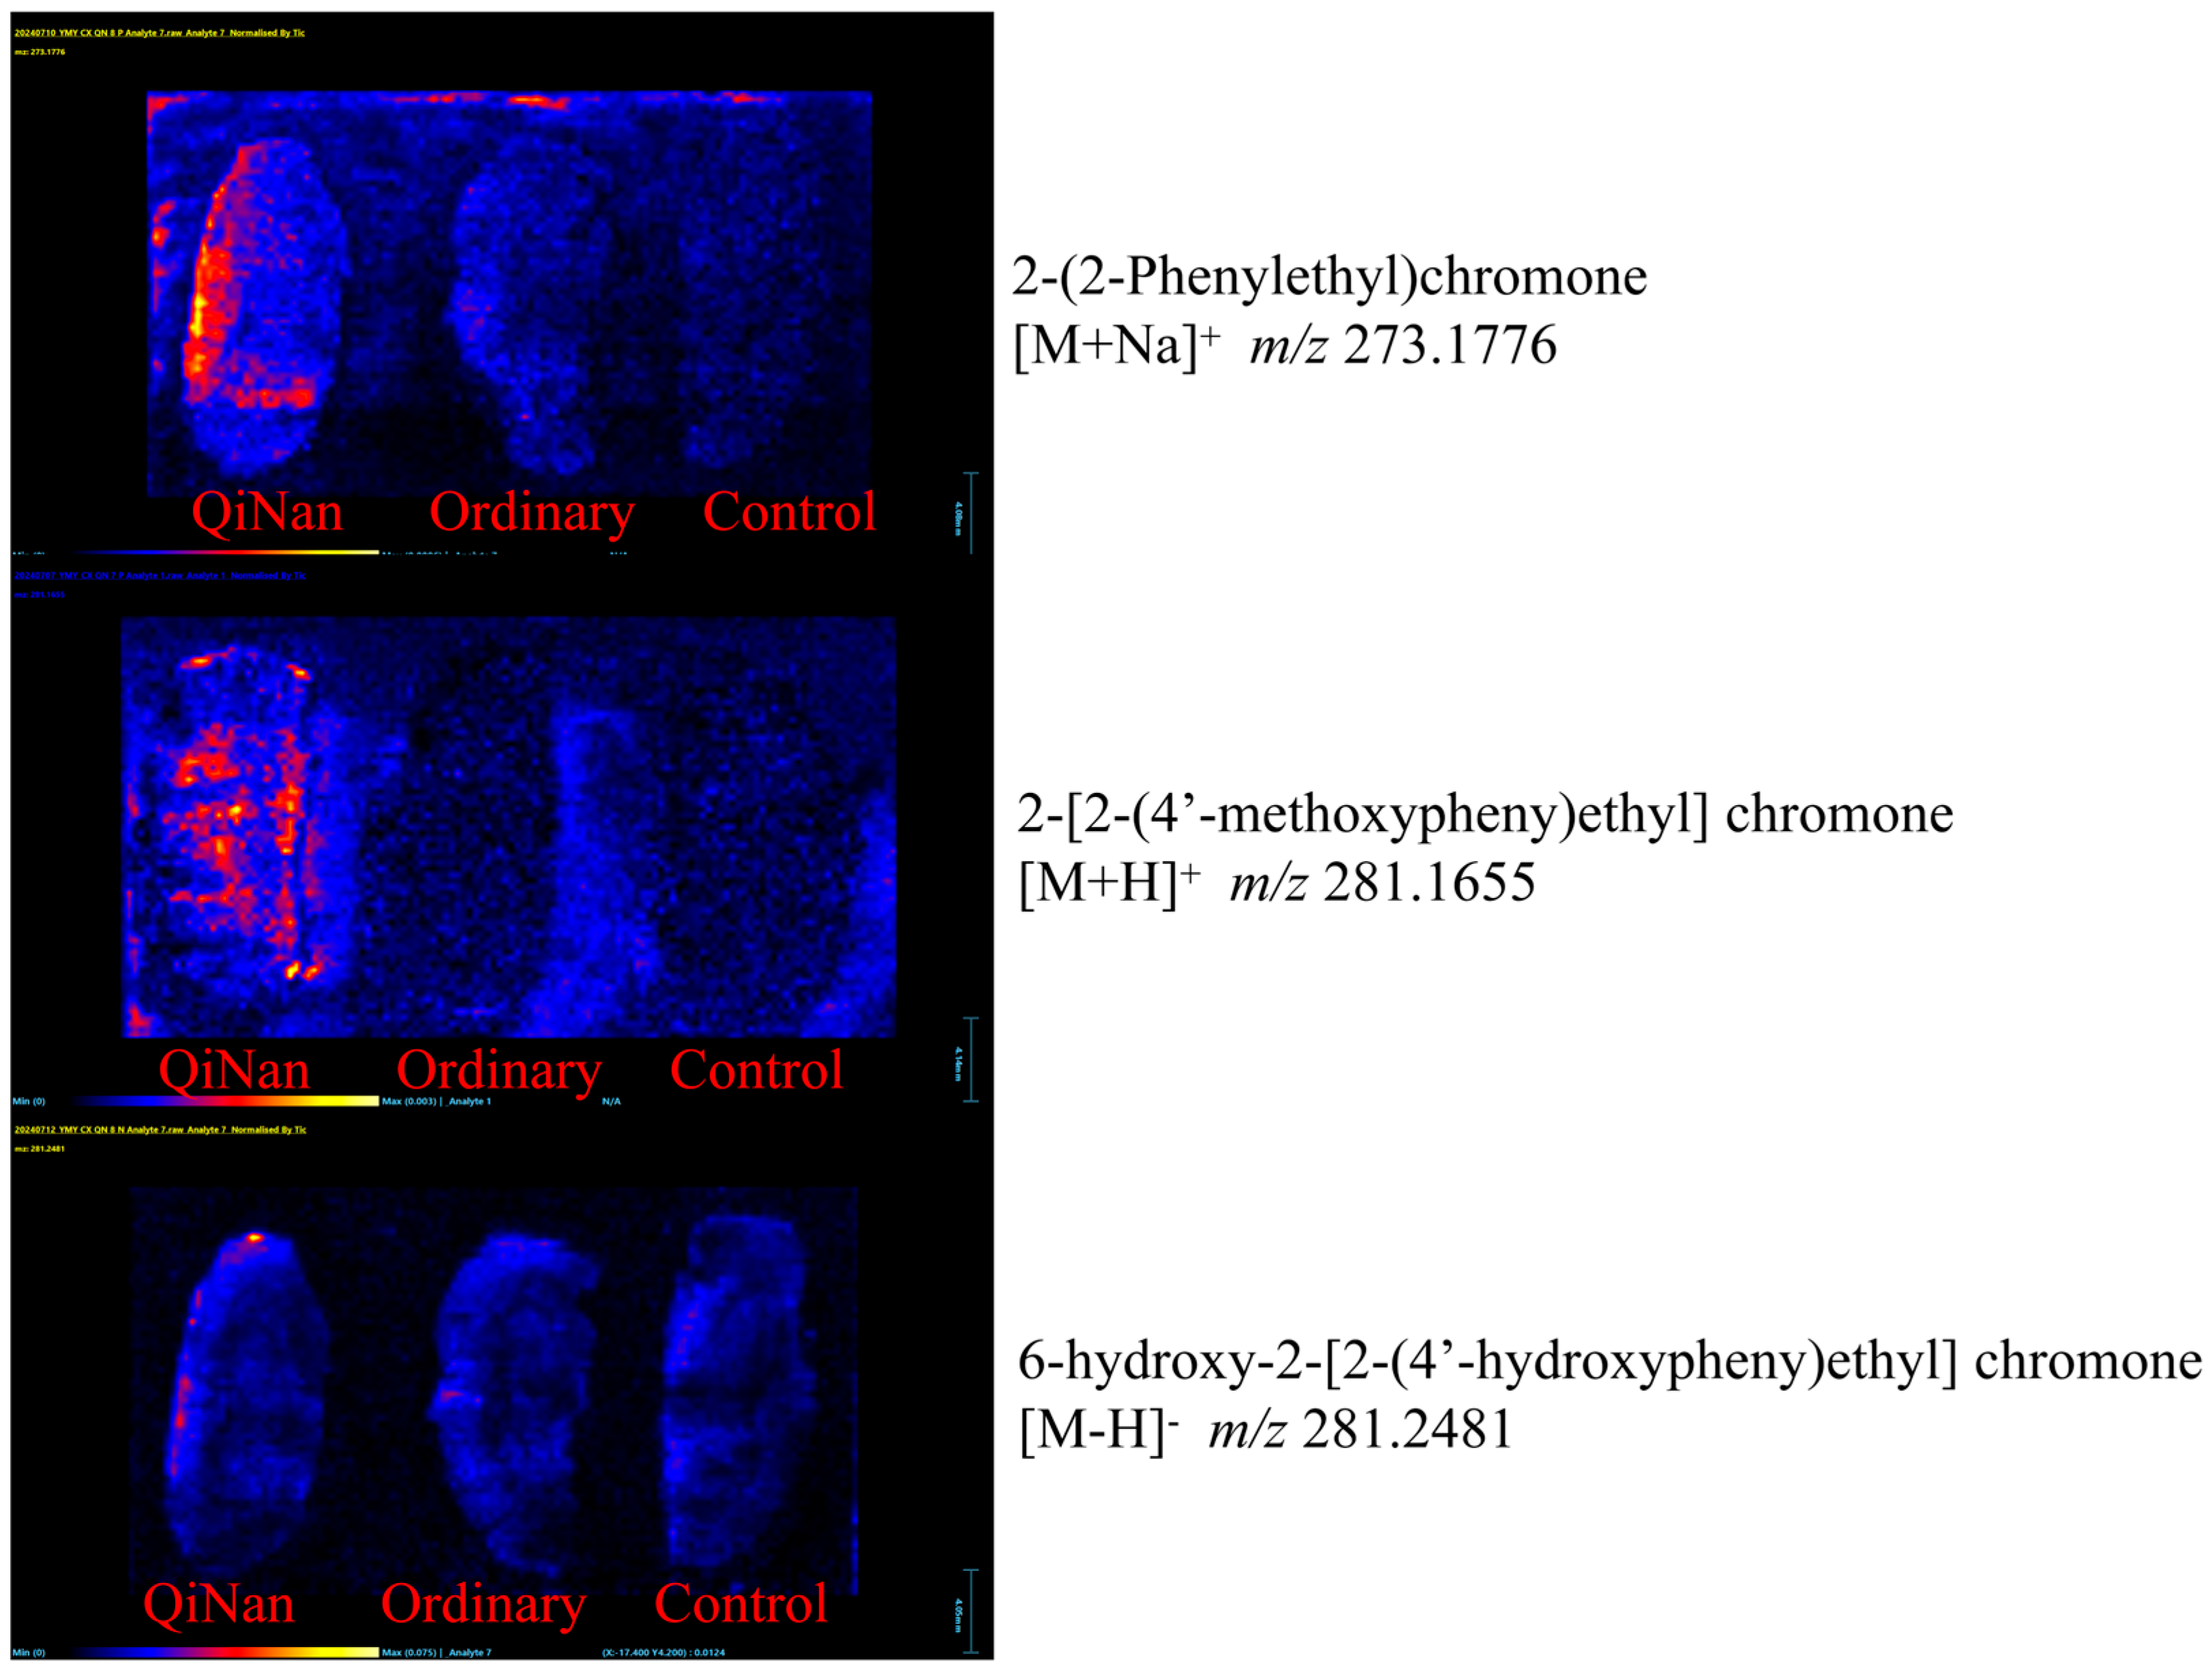
2.7. Distribution of the Chromone Components in Brain Tissue
2.8. Comparison of the Anti-Neuroinflammation Effects of the Two Types of Agarwood and Their FTPEC and THPEC Components
3. Discussion
4. Materials and Methods
4.1. Materials
4.1.1. Samples and Reference Substances
4.1.2. Equipment and Reagents
4.1.3. Cells and Animals
4.2. Methods
4.2.1. Species Identification
4.2.2. Preparation of Ethanol Extracts from the Two Types of Agarwood
4.2.3. Preparation of the Administration Solution
4.2.4. Animal Administration and Grouping
4.2.5. Serum and Brain Tissue Processing
4.2.6. Preparation of Brain Slices
4.2.7. UPLC-MS Analysis
4.2.8. DESI-MS Analysis
4.2.9. Comparison of the In Vitro Activities of the Different Types of Chromones
5. Conclusions
Supplementary Materials
Author Contributions
Funding
Institutional Review Board Statement
Informed Consent Statement
Data Availability Statement
Acknowledgments
Conflicts of Interest
Abbreviations
| OAE | ordinary agarwood ethanol extract |
| QNE | Qi-Nan agarwood ethanol extract |
| OAS | drug-containing serum of rats in ordinary agarwood ethanol extract |
| QNS | drug-containing serum of rats in Qi-Nan agarwood ethanol extract |
| OAB | brain tissue of rats in ordinary agarwood ethanol extract |
| QNB | brain tissue of rats in Qi-Nan agarwood ethanol extract |
| Herb-Q | herb molecular quantification |
| UPLC-MS | ultra performance liquid chromatography–mass spectrometry |
| DESI-MSI | desorption electrospray ionization–imaging mass spectrometry |
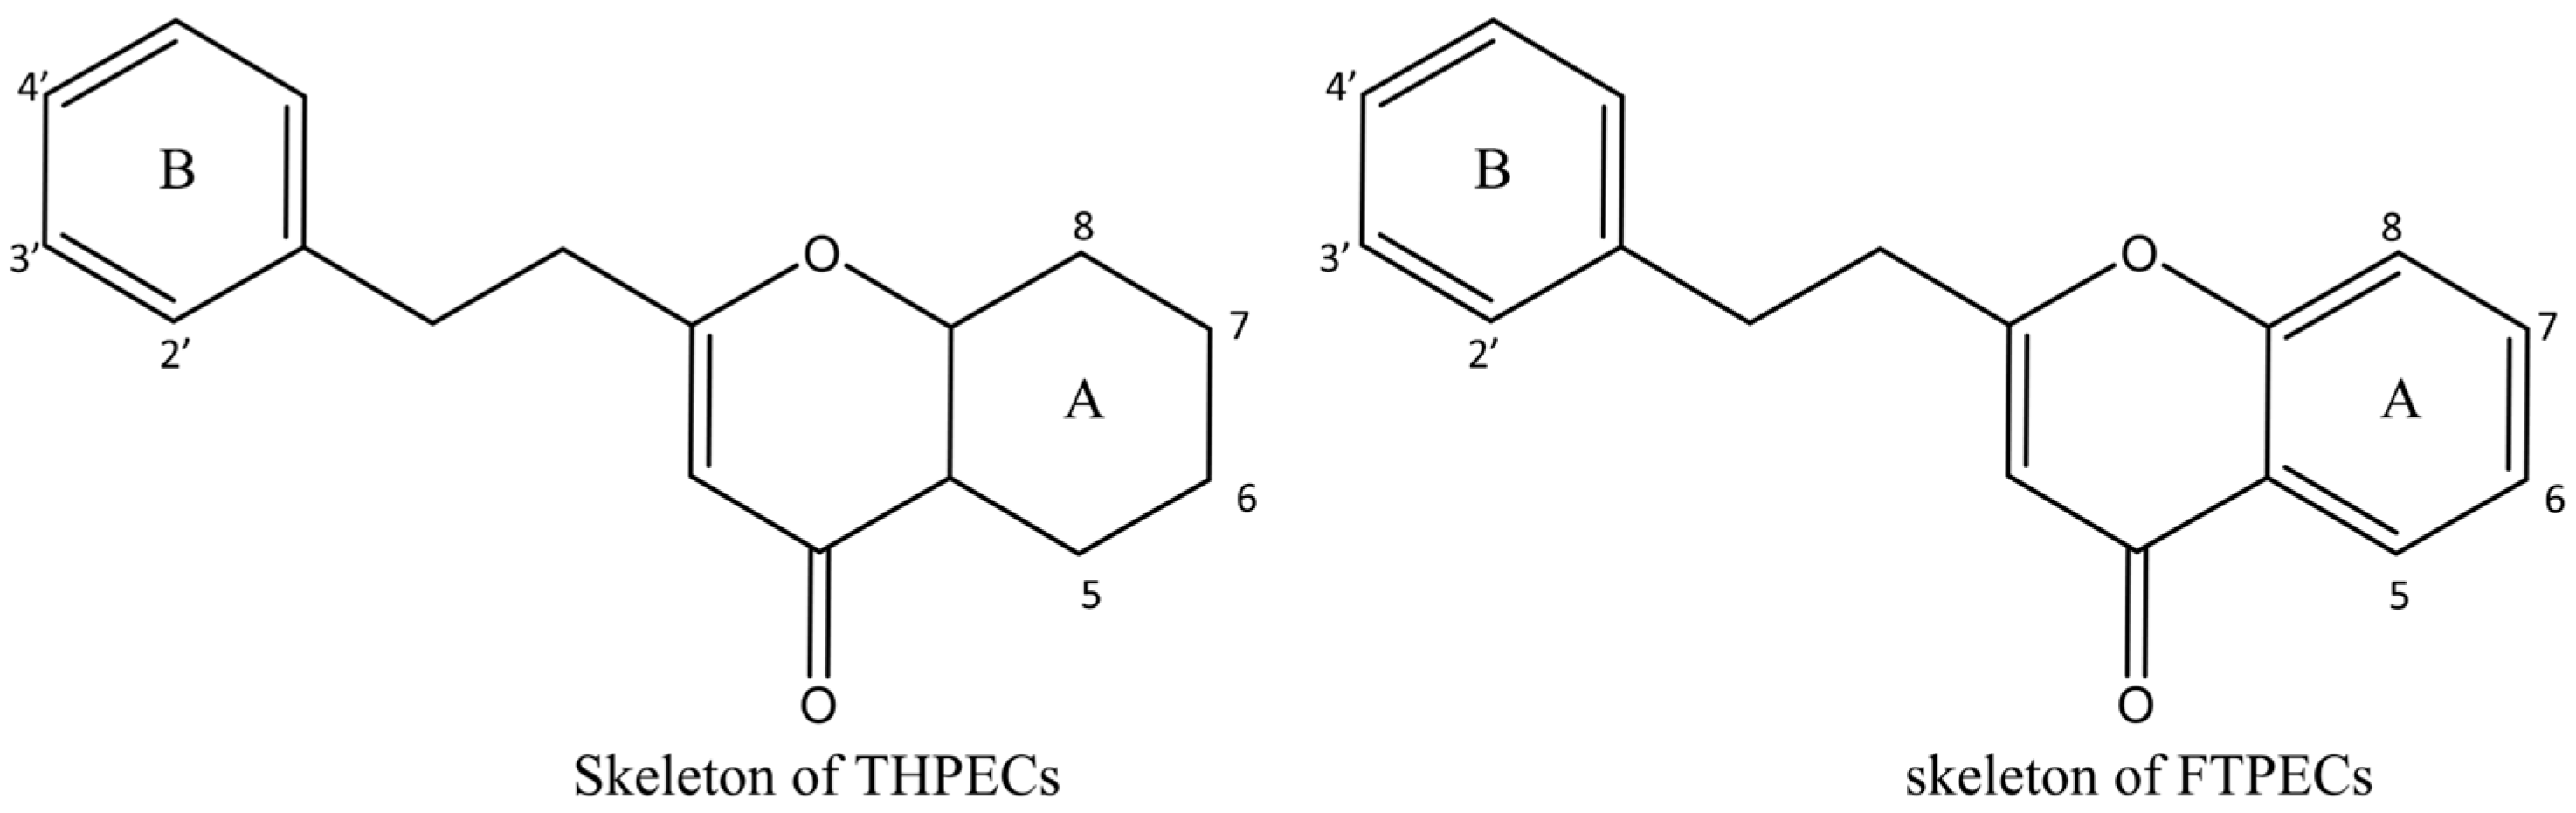
| FTPECs | Flindersia-type 2-(2-phenylethyl)chromones |
| THPECs | 5,6,7,8-tetrahydro-2-(2-phenylethyl)chromones |
| CCK-8 | Cell Counting Kit-8 |
| LPS | lipopolysaccharide |
| DEX | dexamethasone |
| DMSO | dimethylsulfoxide |
| IL-6 | Interleukin 6 |
| TNF-α | tumor necrosis factor alpha |
| log Po/w | N-octanol/water partition coefficient |
| TPSA | topological polar surface area |
References
- Yang, L.; Yang, J.L.; Dong, W.H.; Wang, Y.L.; Zeng, J.; Yuan, J.Z.; Wang, H.; Mei, W.L.; Dai, H.F. The Characteristic Fragrant Sesquiterpenes and 2-(2-Phenylethyl)chromones in Wild and Cultivated “Qi-Nan” Agarwood. Molecules 2021, 26, 436. [Google Scholar] [CrossRef] [PubMed]
- Lv, F.F.; Yang, Y.; Sun, P.W.; Zhang, Y.; Liu, P.W.; Fan, X.H.; Xu, Y.H.; Wei, J.H. Comparative transcriptome analysis reveals different defence responses during the early stage of wounding stress in Chi-Nan germplasm and ordinary Aquilaria sinensis. BMC Plant Biol. 2022, 22, 464. [Google Scholar] [CrossRef]
- Pang, S.J.; Zhou, Z.Z.; Li, Y.J.; Zhang, P.; Li, Z.G.; Deng, S.K. Effect of Different Agarwood-induction Technique Treatments on the Formation of Aromatic Substances in Xylem of Aquilaria sinensis. Acta Bot. Boreali-Occident. Sin. 2023, 43, 1942–1949. [Google Scholar]
- Ishihara, M.; Tsuneya, T.; Uneyama, K. Components of the agarwood smoke on heating. J. Essent. Oil Res. 1993, 5, 419–423. [Google Scholar] [CrossRef]
- Chen, F.M.; Huang, Y.; Luo, L.; Wang, Q.C.; Huang, N.X.; Zhang, Z.Z.; Li, Z. Comprehensive Comparisons between Grafted Kynam Agarwood and Normal Agarwood on Traits, Composition, and In Vitro Activation of AMPK. Molecules 2023, 28, 1667. [Google Scholar] [CrossRef]
- Yu, M.; Liu, Y.Y.; Feng, J.; Chen, D.L.; Yang, Y.; Liu, P.W.; Yu, Z.X.; Wei, J.H. Remarkable Phytochemical Characteristics of Chi-Nan Agarwood Induced from New-Found Chi-Nan Germplasm of Aquilaria sinensis Compared with Ordinary Agarwood. Int. J. Anal. Chem. 2021, 2021, 5593730. [Google Scholar] [CrossRef]
- Ibrahim, S.R.; Mohamed, G.A. Natural occurring 2-(2-phenylethyl) chromones, structure elucidation and biological activities. Nat. Prod. Res. 2015, 29, 1489–1520. [Google Scholar] [CrossRef]
- Li, W.; Chen, H.Q.; Wang, H.; Mei, W.L.; Dai, H.F. Natural products in agarwood and Aquilaria plants: Chemistry, biological activities and biosynthesis. Nat. Prod. Rep. 2021, 38, 528–565. [Google Scholar] [CrossRef]
- Chen, F.M. Study on Chemical Constituents and Quality Evaluation of Kynam Agarwood. Master’s Thesis, China Academy of Chinese Medical Sciences, Beijing, China, 2023. [Google Scholar] [CrossRef]
- Yu, M.; He, Q.Q.; Chen, X.Q.; Feng, J.; Wei, J.H.; Liu, Y.Y. Chemical and Bioactivity Diversity of 2-(2-Phenylethyl)chromones in Agarwood: A Review. Chem. Biodivers. 2022, 19, e202200490. [Google Scholar] [CrossRef]
- Yang, L.; Qiao, L.R.; Xie, D.; Yuan, Y.H.; Chen, N.H.; Dai, J.G.; Guo, S.X. 2-(2-phenylethyl)chromones from Chinese eaglewood. Phytochemistry 2012, 76, 92–97. [Google Scholar] [CrossRef]
- Yoon, J.S.; Lee, M.K.; Sung, S.H.; Kim, Y.C. Neuroprotective 2-(2-phenylethyl)chromones of Imperata cylindrica. J. Nat. Prod. 2006, 69, 290–291. [Google Scholar] [CrossRef]
- Pei, Y.F.; Liu, Z.Y.; Yu, D.D.; Zhang, X.Y.; Sun, W.; Chen, X.F.; Feng, X.; Li, X.W. Molecular quantification of herbs (Herb-Q): A pyrosequencing-based approach and its application in Pinellia ternata. Chin. J. Nat. Med. 2024, 22, 663–672. [Google Scholar] [CrossRef]
- Liu, Z.Y.; Pei, Y.F.; Chen, T.Z.; Yang, Z.M.; Jiang, W.J.; Feng, X.; Li, X.W. Molecular quantification of fritillariae cirrhosae bulbus and its adulterants. Chin. Med. 2024, 19, 138. [Google Scholar] [CrossRef]
- Liu, Z.Y.; Pei, Y.F.; Feng, X.; Zhao, G.P.; Chen, T.Z.; Li, X.W. Identification of mixed medicinal powder of Epimedii Folium with different origins based on pyrosequencing technology. Acta Pharm. Sin. 2023, 58, 2532–2540. [Google Scholar] [CrossRef]
- Kumar, B.S. Desorption electrospray ionization mass spectrometry imaging (DESI-MSI) in disease diagnosis: An overview. Anal. Methods 2023, 15, 3768–3784. [Google Scholar] [CrossRef]
- Zhou, S.H. The Distribution of Key Component in Coriandrum sativum L. by Desorption Electrospray Ionization Mass Spectrometry Imaging (DESI-MSI). Master’s Thesis, Harbin Institute of Technology, Harbin, China, 2021. [Google Scholar] [CrossRef]
- Kang, Y.; Liu, P.W.; Lv, F.F.; Zhang, Y.X.; Yang, Y.; Wei, J.H. Genetic relationship and source species identification of 58 Qi-Nan germplasms of Aquilaria species in China that easily form agarwood. PLoS ONE 2022, 17, e0270167. [Google Scholar] [CrossRef]
- Shivanand, P.; Arbie, N.F.; Krishnamoorthy, S.; Ahmad, N. Agarwood-The Fragrant Molecules of a Wounded Tree. Molecules 2022, 27, 3386. [Google Scholar] [CrossRef]
- Thakur, M.; Bhattacharya, S.; Khosla, P.K.; Puri, S. Improving production of plant secondary metabolites through biotic and abiotic elicitation. J. Appl. Res. Med. Aromat. Plants 2019, 12, 1–12. [Google Scholar] [CrossRef]
- Zhang, P.; Li, X.F.; Cui, Z.Y.; Xu, D.P. Morphological, physiological, biochemical and molecular analyses reveal wounding-induced agarwood formation mechanism in two types of Aquilaria sinensis (Lour.) Spreng. Ind. Crops Prod. 2022, 178, 114603. [Google Scholar] [CrossRef]
- Morita, H.; Wong, C.P.; Abe, I. How structural subtleties lead to molecular diversity for the type III polyketide synthases. J. Biol. Chem. 2019, 294, 15121–15136. [Google Scholar] [CrossRef]
- Xiao, M.J.; Wang, B.B.; Feng, Y.N.; Sun, P.W.; Rong, M.; Liu, Y.Y.; Chen, D.L.; Lv, F.F.; Gao, Z.H.; Wei, J.H. Three candidate 2-(2-phenylethyl)chromone-producing type III polyketide synthases from Aquilaria sinensis (Lour.) Gilg have multifunctions synthesizing benzalacetones, quinolones and pyrones. Ind. Crops Prod. 2022, 186, 115263. [Google Scholar] [CrossRef]
- Sun, P.W.; Lv, F.F.; Yang, Y.; Hou, W.C.; Xiao, M.J.; Gao, Z.H.; Xu, Y.H.; Wei, J.H. Comparative transcriptome analysis reveals the differences in wound-induced agarwood formation between Chi-Nan and ordinary germplasm of Aquilaria sinensis. Heliyon 2024, 10, e35874. [Google Scholar] [CrossRef]
- Liao, G.; Dong, W.H.; Yang, J.L.; Li, W.; Wang, J.; Mei, W.L.; Dai, H.F. Monitoring the Chemical Profile in Agarwood Formation within One Year and Speculating on the Biosynthesis of 2-(2-Phenylethyl)Chromones. Molecules 2018, 23, 1261. [Google Scholar] [CrossRef]
- Li, W.; Cai, C.H.; Dong, W.H.; Guo, Z.K.; Wang, H.; Mei, W.L.; Dai, H.F. 2-(2-phenylethyl)chromone derivatives from Chinese agarwood induced by artificial holing. Fitoterapia 2014, 98, 117–123. [Google Scholar] [CrossRef]
- Mensch, J.; Oyarzabal, J.; Mackie, C.; Augustijns, P. In vivo, in vitro and in silico methods for small molecule transfer across the BBB. J. Pharm. Sci. 2009, 98, 4429–4468. [Google Scholar] [CrossRef]
- Ghose, A.K.; Herbertz, T.; Hudkins, R.L.; Dorsey, B.D.; Mallamo, J.P. Knowledge-Based, Central Nervous System (CNS) Lead Selection and Lead Optimization for CNS Drug Discovery. ACS Chem. Neurosci. 2012, 3, 50–68. [Google Scholar] [CrossRef]
- Moreno, E.; Gabano, E.; Torres, E.; Platts, J.A.; Ravera, M.; Aldana, I.; Monge, A.; Pérez-Silanes, S. Studies on log Po/w of quinoxaline di-N-oxides: A comparison of RP-HPLC experimental and predictive approaches. Molecules 2011, 16, 7893–7908. [Google Scholar] [CrossRef]
- Daina, A.; Michielin, O.; Zoete, V. iLOGP: A simple, robust, and efficient description of n-octanol/water partition coefficient for drug design using the GB/SA approach. J. Chem. Inf. Model. 2014, 54, 3284–3301. [Google Scholar] [CrossRef]
- Qin, W.; Li, H.H.; Chen, J.L.; Qiu, Y.; Ma, L.M.; Nie, L.M. Amphiphilic hemicyanine molecular probes crossing the blood-brain barrier for intracranial optical imaging of glioblastoma. Sci. Adv. 2025, 11, eadq5816. [Google Scholar] [CrossRef]
- Akawa, O.B.; Okunlola, F.O.; Alahmdi, M.I.; Abo-Dya, N.E.; Sidhom, P.A.; Ibrahim, M.A.A.; Shibl, M.F.; Khan, S.; Soliman, M.E.S. Multi-cavity molecular descriptor interconnections: Enhanced protocol for prediction of serum albumin drug binding. Eur. J. Pharm. Biopharm. 2024, 194, 9–19. [Google Scholar] [CrossRef]
- Gupta, S.; Basant, N.; Singh, K.P. Qualitative and quantitative structure-activity relationship modelling for predicting blood-brain barrier permeability of structurally diverse chemicals. SAR QSAR Environ. Res. 2015, 26, 95–124. [Google Scholar] [CrossRef] [PubMed]
- van de Waterbeemd, H.; Camenisch, G.; Folkers, G.; Chretien, J.R.; Raevsky, O.A. Estimation of blood-brain barrier crossing of drugs using molecular size and shape, and H-bonding descriptors. J. Drug Target. 1998, 6, 151–165. [Google Scholar] [CrossRef] [PubMed]
- Xie, A.H.; Cheng, G.W.; Wu, J.X.; Li, Z.L.; Yu, G.T.; Zhu, X.Z.; Chen, T.K. Highly BBB-permeable nanomedicine reverses neuroapoptosis and neuroinflammation to treat Alzheimer’s disease. Biomaterials 2025, 312, 122749. [Google Scholar] [CrossRef]
- Alsbrook, D.L.; Di, N.M.; Bhatia, K.; Biller, J.; Andalib, S.; Hinduja, A.; Rodrigues, R.; Rodriguez, M.; Sabbagh, S.Y.; Selim, M.; et al. Neuroinflammation in Acute Ischemic and Hemorrhagic Stroke. Curr. Neurol. Neurosci. Rep. 2023, 23, 407–431. [Google Scholar] [CrossRef]
- Singh, D. Astrocytic and microglial cells as the modulators of neuroinflammation in Alzheimer’s disease. J. Neuroinflamm. 2022, 19, 206. [Google Scholar] [CrossRef]


| No. | Type | Component Name | OAS | QNS |
|---|---|---|---|---|
| 6 | THPECs | Agarotetrol |  | |
| 7 | THPECs | 4′-methoxyagarotetrol | 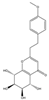 | |
| 10 | THPECs | Agarotetrol (isomer 1) |  | |
| 11 | THPECs | 4′-methoxyagarotetrol (isomer 2) |  | |
| 13 | THPECs | 5,6,7-trihydroxy-5,6,7,8-tetrahydro-2-(2-phenylethyl)chromone |  | |
| 16 | THPECs | 6,7-dihydroxy-5,6,7,8-tetrahydro-2-(2-phenylethyl)chromone |  | |
| 18 | THPECs | 8-chloro-5,6,7-trihydroxy-2-(4-methoxyphenethyl)-5,6,7,8-tetrahydrochromone | 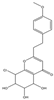 | |
| 19 | THPECs | 8-chloro-5,6,7-trihydroxy-2-(2-phenylethyl)-5,6,7,8-tetrahydrochromon | 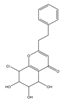 | |
| 28 | FTPECs | 6-hydroxy-2-[2-(3-methoxyl-4-hydroxyphenyl)ethyl]chromone |  | |
| 30 | FTPECs | 6-methoxy-2-[2-(3-hydroxy-4-methoxyphenyl)ethyl]chromone |  | |
| 32 | FTPECs | 6-methoxy-7-hydroxy-2-[2-(4-methoxyphenyl)ethyl]chromone |  | |
| 33 | FTPECs | 2-[2-(3-hydroxyphenyl)ethyl]chromone |  |  |
| 39 | FTPECs | 2-[2-(4-hydroxyphenyl)ethyl]chromone |  | |
| 40 | FTPECs | 2-[2-(3-methoxy-4-hydroxyphenyl)ethyl]chromone |  | |
| 41 | FTPECs | 7-hydroxy-2-(2-phenylethyl)chromone |  | |
| 43 | FTPECs | 2-[2-(3-hydroxy-4-methoxyphenyl)ethyl]chromone |  | |
| 51 | FTPECs | 2-[2-(2-hydroxyphenyl)ethyl]chromone |  | |
| 56 | FTPECs | 6-hydroxy-2-[2-(3-methoxyphenyl)ethyl]chromone |  | |
| 58 | FTPECs | 6-hydroxy-2-(2-phenylethyl)chromone |  |  |
| 60 | FTPECs | 6-methoxy-2-[2-(3-methoxyphenyl)ethyl]chromone |  | |
| 75 | FTPECs | 2-[2-(4-methoxyphenyl)ethyl]chromone |  |  |
| 78 | FTPECs | 2-(2-phenylethyl)chromone |  |  |
| No. | Type | Component Name | OAB | QNB |
|---|---|---|---|---|
| 6 | THPECs | Agarotetrol |  | |
| 7 | THPECs | 4′-methoxyagarotetrol | 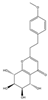 | |
| 10 | THPECs | Agarotetrol (isomer 1) |  | |
| 18 | THPECs | 8-chloro-5,6,7-trihydroxy-2-(4-methoxyphenethyl)-5,6,7,8-tetrahydrochromene |  | |
| 19 | THPECs | 8-chloro-5,6,7-trihydroxy-2-(2-phenylethyl)-5,6,7,8-tetrahydrochromon |  | |
| 21 | FTPECs | 6-hydroxy-2-[2-(4-hydroxyphenyl)ethyl]chromone |  | |
| 24 | FTPECs | 6-hydroxy-2-[2-(4-hydroxyphenyl)ethyl]chromone (isomer 1) |  | |
| 26 | FTPECs | 6-hydroxy-2-[2-(3-hydroxy-4-methoxylphenyl)ethyl]chromone |  | |
| 28 | FTPECs | 6-hydroxy-2-[2-(3-methoxyl-4-hydroxyphenyl)ethyl]chromone |  | |
| 30 | FTPECs | 6-methoxy-2-[2-(3-hydroxy-4-methoxyphenyl)ethyl]chromone |  | |
| 33 | FTPECs | 2-[2-(3-hydroxyphenyl)ethyl]chromone |  |  |
| 39 | FTPECs | 2-[2-(4-hydroxyphenyl)ethyl]chromone |  |  |
| 40 | FTPECs | 2-[2-(3-methoxy-4-hydroxyphenyl)ethyl]chromone |  |  |
| 41 | FTPECs | 7-hydroxy-2-(2-phenylethyl)chromone |  |  |
| 43 | FTPECs | 2-[2-(3-hydroxy-4-methoxyphenyl)ethyl]chromone |  | |
| 51 | FTPECs | 2-[2-(2-hydroxyphenyl)ethyl]chromone |  | |
| 56 | FTPECs | 6-hydroxy-2-[2-(3-methoxyphenyl)ethyl]chromone |  | |
| 58 | FTPECs | 6-hydroxy-2-(2-phenylethyl)chromone |  |  |
| 60 | FTPECs | 6-methoxy-2-[2-(3-methoxyphenyl)ethyl]chromone |  | |
| 75 | FTPECs | 2-[2-(4-methoxyphenyl)ethyl]chromone |  |  |
| 78 | FTPECs | 2-(2-phenylethyl)chromone |  |  |
| No. | Type | Component Name | Log Po/w | TPSA |
|---|---|---|---|---|
| 6 | THPECs | Agarotetrol | 0.27 | 111.13 |
| 7 | THPECs | 4′-methoxyagarotetrol | 0.26 | 120.36 |
| 10 | THPECs | Agarotetrol (isomer 1) | 0.27 | 111.13 |
| 18 | THPECs | 8-chloro-5,6,7-trihydroxy-2-(4-methoxyphenethyl)-5,6,7,8-tetrahydrochromene | 1.09 | 91.44 |
| 19 | THPECs | 8-chloro-5,6,7-trihydroxy-2-(2-phenylethyl)-5,6,7,8- tetrahydrochromon | 1.16 | 90.90 |
| 21 | FTPECs | 6-hydroxy-2-[2-(4-hydroxyphenyl)ethyl]chromone | 2.89 | 70.67 |
| 24 | FTPECs | 6-hydroxy-2-[2-(4-hydroxyphenyl)ethyl]chromone | 2.89 | 70.67 |
| 26 | FTPECs | 6-hydroxy-2-[2-(3-hydroxy-4-methoxylphenyl)ethyl]chromone | 2.77 | 79.9 |
| 28 | FTPECs | 6-hydroxy-2-[2-(3-methoxyl-4-hydroxyphenyl)ethyl] chromone | 2.76 | 79.9 |
| 30 | FTPECs | 6-methoxy-2-[2-(3-hydroxy-4-methoxyphenyl) ethyl]chromone | 3.17 | 68.9 |
| 33 | FTPECs | 2-[2-(3-hydroxyphenyl)ethyl]chromone | 3.22 | 50.44 |
| 39 | FTPECs | 2-[2-(4-hydroxyphenyl)ethyl]chromone | 3.21 | 50.44 |
| 40 | FTPECs | 2-[2-(3-methoxy-4-hydroxyphenyl)ethyl]chromone | 3.16 | 59.67 |
| 41 | FTPECs | 7-hydroxy-2-(2-phenylethyl)chromone | 3.29 | 50.44 |
| 43 | FTPECs | 2-[2-(3-hydroxy-4-methoxyphenyl)ethyl]chromone | 3.17 | 59.67 |
| 51 | FTPECs | 2-[2-(2-hydroxyphenyl)ethyl]chromone | 3.13 | 50.44 |
| 56 | FTPECs | 6-hydroxy-2-[2-(3-methoxyphenyl)ethyl]chromone | 3.13 | 59.67 |
| 58 | FTPECs | 6-hydroxy-2-(2-phenylethyl)chromone | 3.26 | 50.44 |
| 60 | FTPECs | 6-methoxy-2-[2-(3-methoxyphenyl)ethyl]chromone | 3.54 | 48.67 |
| 75 | FTPECs | 2-[2-(4-methoxyphenyl)ethyl]chromone | 3.61 | 39.44 |
| 78 | FTPECs | 2-(2-phenylethyl)chromone | 3.63 | 30.21 |
| Number | Name |
|---|---|
| TH-1 | Agarotetrol |
| TH-2 | 4′-methoxyagarotetrol |
| TH-3 | Isoagarotetrol |
| TH-4 | 4’-methoxyisoagarotetrol |
| TH-5 | 6,7-dihydroxy-2-(2-phenylethyl)-5,6,7,8-tetrahydrochromone |
| TH-6 | (5S,6S,7S,8R)-8-chloro-5,6,7-trihydroxy-2-(2-phenylethyl)-5,6,7,8-tetrahydrochromen-4-one |
| FT-1 | 2-(2-phenylethyl)chromone |
| FT-2 | 6-hydroxy-2-(2-phenylethyl)chromone |
| FT-3 | 2-[2-(4’-methoxyphenyl)ethyl]chromone |
| FT-4 | 6-methoxy-2-[2-(3’-methoxyphenyl)ethyl]chromone |
Disclaimer/Publisher’s Note: The statements, opinions and data contained in all publications are solely those of the individual author(s) and contributor(s) and not of MDPI and/or the editor(s). MDPI and/or the editor(s) disclaim responsibility for any injury to people or property resulting from any ideas, methods, instructions or products referred to in the content. |
© 2025 by the authors. Licensee MDPI, Basel, Switzerland. This article is an open access article distributed under the terms and conditions of the Creative Commons Attribution (CC BY) license (https://creativecommons.org/licenses/by/4.0/).
Share and Cite
Yang, M.; Yuan, Y.; Wei, J.; Pei, Y.; Niu, Y.; Zhao, Y.; Kong, X.; Zhang, Z. Comparison of the Blood–Brain Barrier Penetration Ability and Anti-Neuroinflammatory Activity of Chromones in Two Types of Agarwood. Pharmaceuticals 2025, 18, 510. https://doi.org/10.3390/ph18040510
Yang M, Yuan Y, Wei J, Pei Y, Niu Y, Zhao Y, Kong X, Zhang Z. Comparison of the Blood–Brain Barrier Penetration Ability and Anti-Neuroinflammatory Activity of Chromones in Two Types of Agarwood. Pharmaceuticals. 2025; 18(4):510. https://doi.org/10.3390/ph18040510
Chicago/Turabian StyleYang, Mengyuan, Yanan Yuan, Jingfan Wei, Yifei Pei, Yuanfei Niu, Yifan Zhao, Xiangying Kong, and Zhijie Zhang. 2025. "Comparison of the Blood–Brain Barrier Penetration Ability and Anti-Neuroinflammatory Activity of Chromones in Two Types of Agarwood" Pharmaceuticals 18, no. 4: 510. https://doi.org/10.3390/ph18040510
APA StyleYang, M., Yuan, Y., Wei, J., Pei, Y., Niu, Y., Zhao, Y., Kong, X., & Zhang, Z. (2025). Comparison of the Blood–Brain Barrier Penetration Ability and Anti-Neuroinflammatory Activity of Chromones in Two Types of Agarwood. Pharmaceuticals, 18(4), 510. https://doi.org/10.3390/ph18040510