1. Introduction
HCC represents a complex and globally significant malignancy [
1]. Its early-stage clinical symptoms are often subtle, coupled with diverse risk factors, making early diagnosis and management particularly challenging. According to the 2024 global cancer statistics, primary liver cancer is the sixth most commonly diagnosed cancer and the third most common cause of cancer death worldwide [
2]. Among primary liver cancers, HCC constitutes 80–90% of cases, standing as the predominant subtype [
3]. Recent advances in targeted therapies and immunotherapies have provided promising avenues for improving patient survival [
4]. Nevertheless, HCC remains associated with high recurrence rates, metastatic potential, and therapeutic resistance, contributing to persistently poor prognoses [
5]. For instance, a significant number of advanced HCC patients derive limited long-term benefits from systemic therapies because of inherent or acquired drug resistance. Coupled with the increasing global incidence of HCC, this resistance contributes to the persistently high mortality rates associated with the disease [
6]. These persistent obstacles underscore the dual imperative of advancing early diagnostic methods while accelerating the development of breakthrough treatment modalities against this aggressive malignancy.
Apoptotic and other regulated cell death mechanisms play fundamental roles in morphogenesis and tissue homeostasis, with their dysregulation being implicated in diverse pathologies ranging from malignancies to degenerative conditions [
7]. A recent study has revealed that new epigenetic pathways and the 5-methylcytosine methylation of
MALAT1 contributed to sorafenib resistance in HCC, while simultaneously demonstrating the therapeutic potential of ferroptosis activation in overcoming this treatment resistance [
6]. In addition, other studies have also established
YAP/TAZ as critical negative regulators of ferroptosis that promote Sorafenib resistance in HCC [
8]. Therefore, epigenetic modification of cell death can be a promising strategy for HCC therapy.
Recently, researchers investigated the therapeutic potential of pro-oxidant approaches for prostate cancer intervention. Their work identified dietary MSB—a mammalian vitamin K precursor derived from plant-based vitamin K (phylloquinone)—as a promising candidate. MSB functions as an oxidative inhibitor of PI 3-kinase VPS34, the key enzyme responsible for phosphatidylinositol-3-phosphate (PI(3)P) production. In prostate cancer models, MSB-induced oxidative stress significantly reduces PI(3)P levels, triggering a novel form of endosome-mediated cell death termed triaptosis [
9]. This newly characterized cell death mechanism represents a breakthrough in cancer therapeutics, offering substantial potential for developing precision treatments targeting tumor-specific vulnerabilities.
Building on the exciting discovery of the critical role of epigenetic modifications in regulating cell death during HCC therapy, we also aim to investigate the potential involvement of epigenetic regulation in triaptosis in HCC. Among various epigenetic modifications, lncRNAs—defined as RNA transcripts longer than 200 nucleotides—are notable for their inability to encode proteins due to missing or non-functional open reading frames. Initially, this feature caused them to be dismissed as transcriptional noise rather than biologically relevant molecules [
10]. The regulatory functions of long non-coding RNAs in cell death mechanisms represent a subject of intensive investigation within the field of hepatocellular carcinoma research [
11]. For instance, emerging research has identified specific long non-coding RNAs, including
DUXAP8,
URB1-AS1, and
PVT1 as molecular mediators of sorafenib resistance through their regulatory roles in drug-induced ferroptosis pathways [
12,
13,
14]. Previous studies have also shown that lncRNAs are closely associated with some programmed regulatory death mechanisms in HCC, such as cuproptosis and disulfidptosis [
15].
This research utilized both in vitro and in vivo models to elucidate the role of triaptosis in HCC progression. A systematic identification and characterization of a set of triaptosis-related lncRNAs (TRLs) was undertaken utilizing data from the Cancer Genome Atlas (TCGA). Through integrated bioinformatics analysis incorporating both bulk and single-cell RNA sequencing data, we developed a robust 5-TRL prognostic signature that outperformed conventional clinical parameters in predicting patient outcomes. Our studies confirmed the potential of LINC01134 as a therapeutic target, based on a series of in vitro and in vivo experiments. Collectively, these findings significantly advance our understanding of triaptosis-mediated molecular mechanisms in HCC and lay the groundwork for precision oncology strategies targeting triaptosis-regulatory networks.
3. Discussion
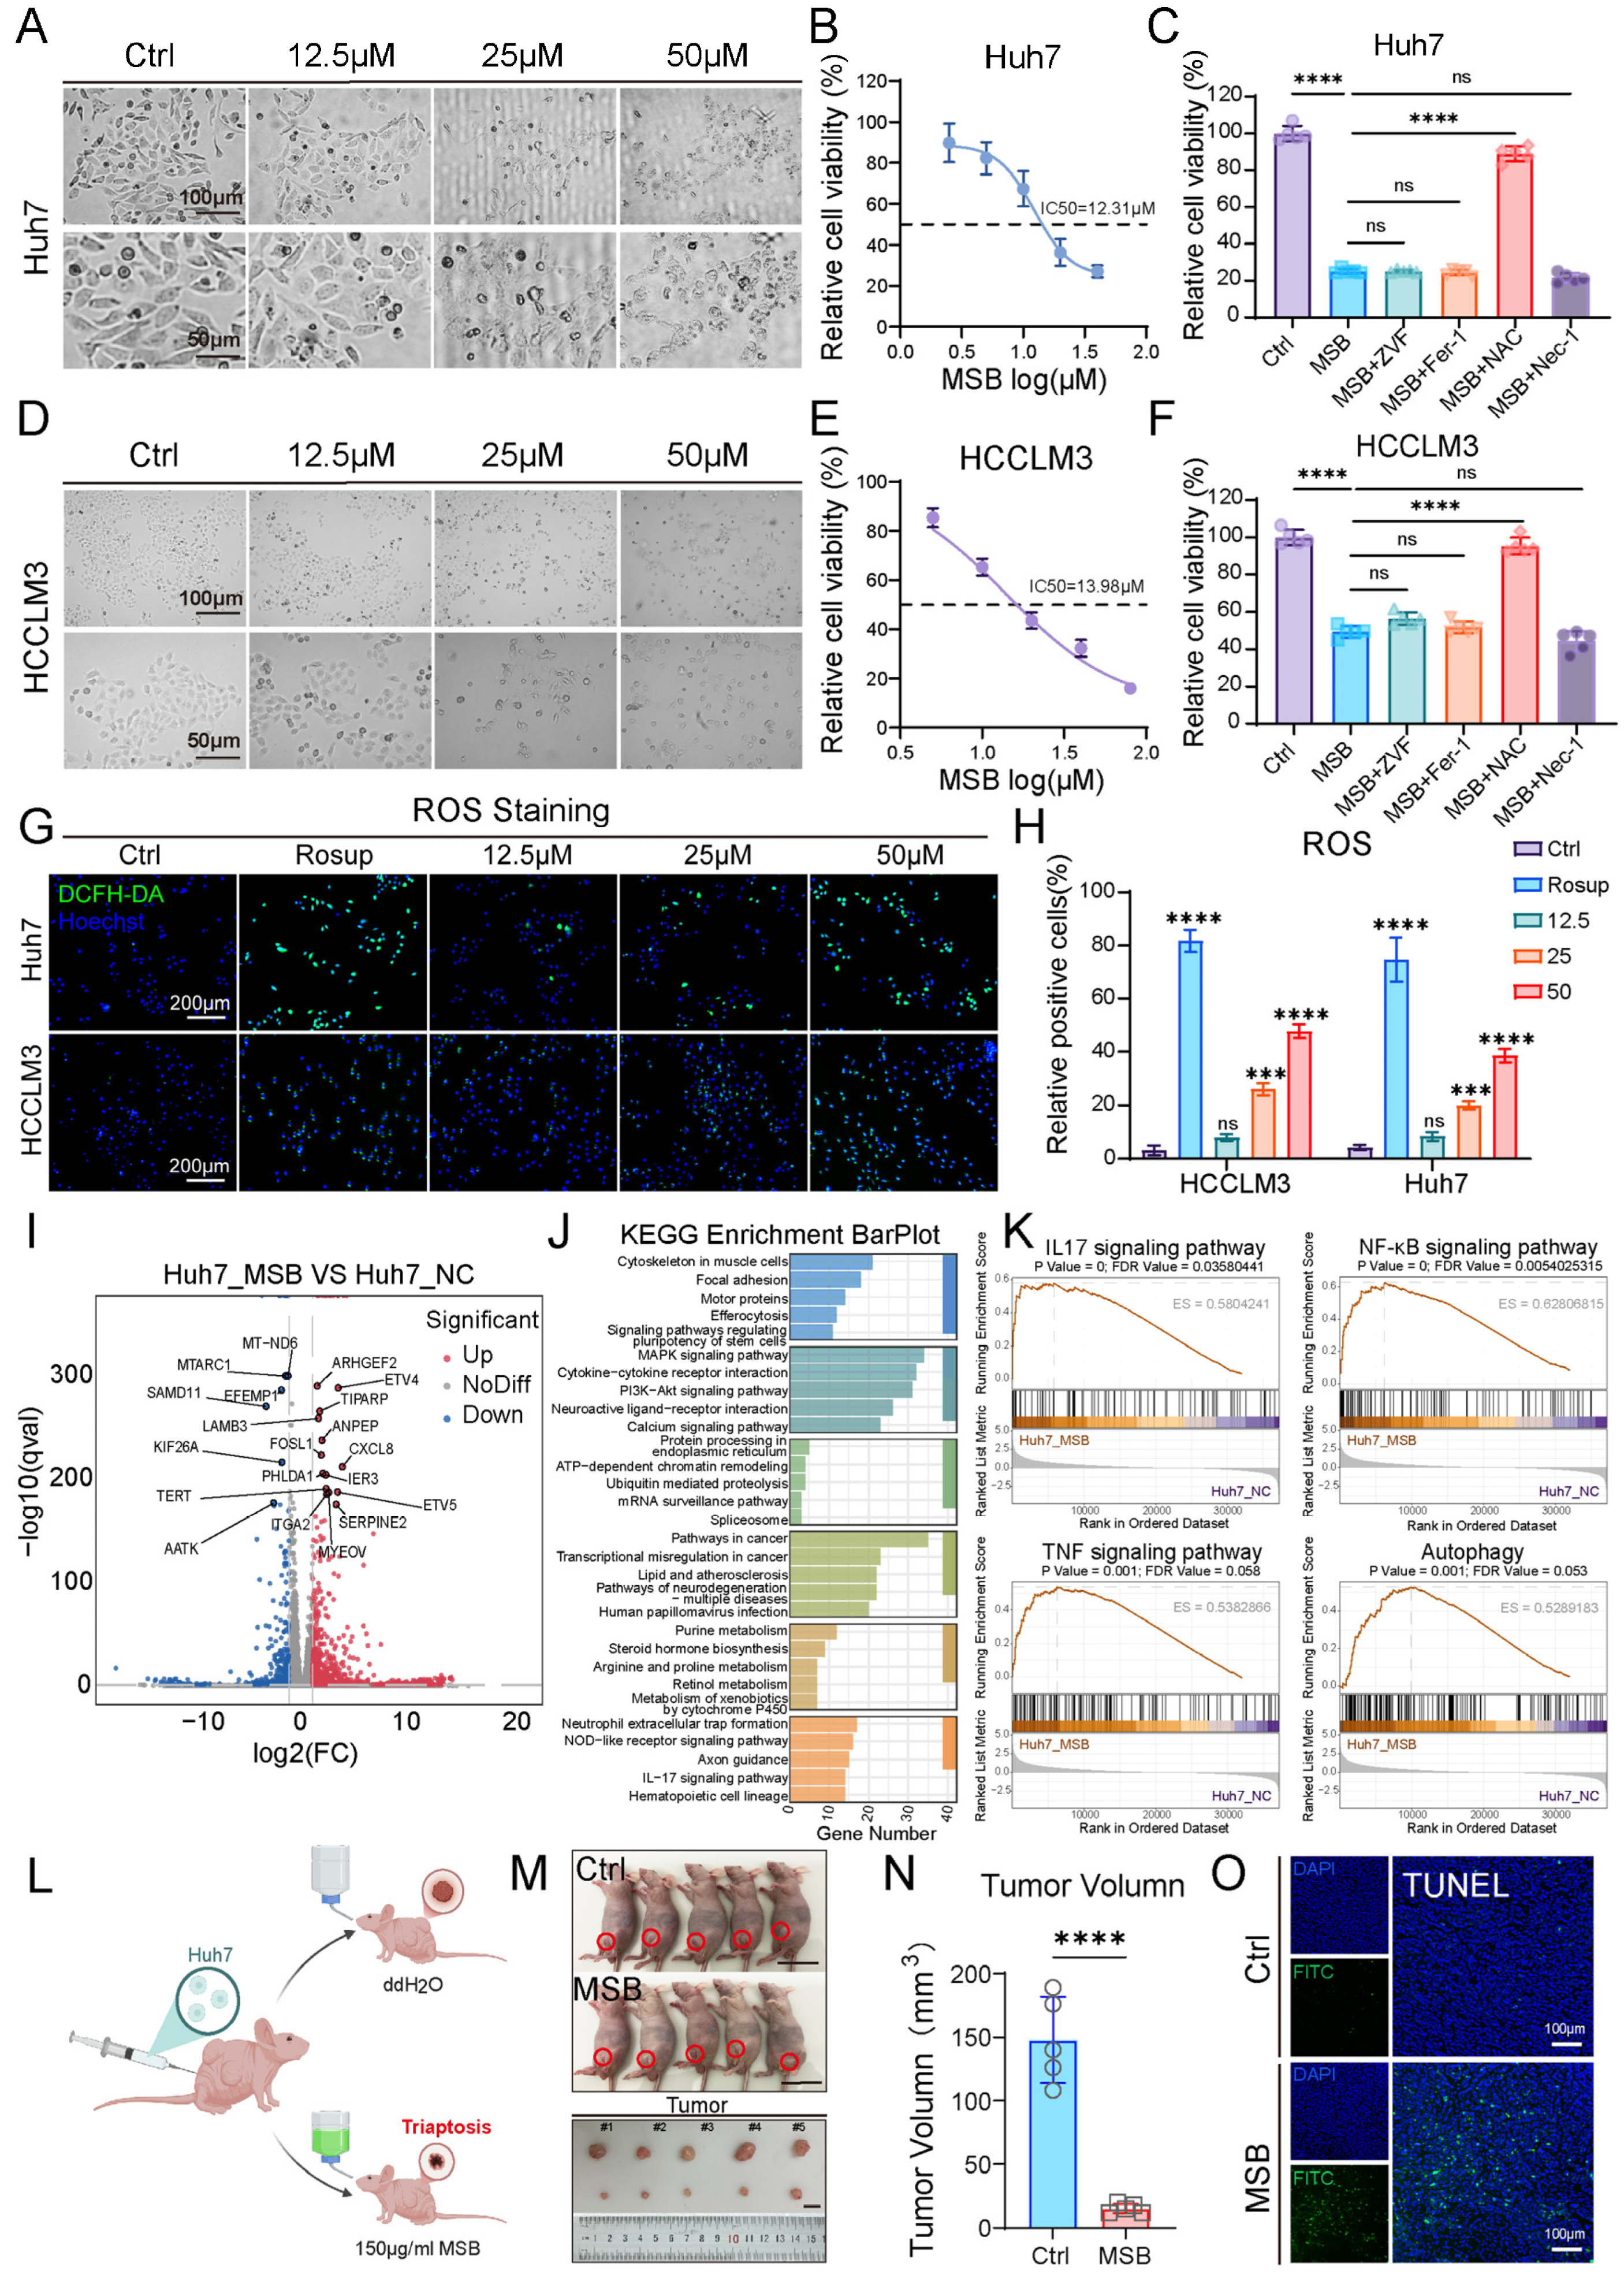
This study provides comprehensive evidence linking triaptosis, a novel form of programmed cell death, to lncRNA-mediated regulatory networks in HCC. Our findings reveal that ROS-driven triaptosis induction effectively suppresses HCC progression, aligning with prior reports of as a vulnerability in HCC [
16]. The integration of single-cell transcriptomics further uncovered
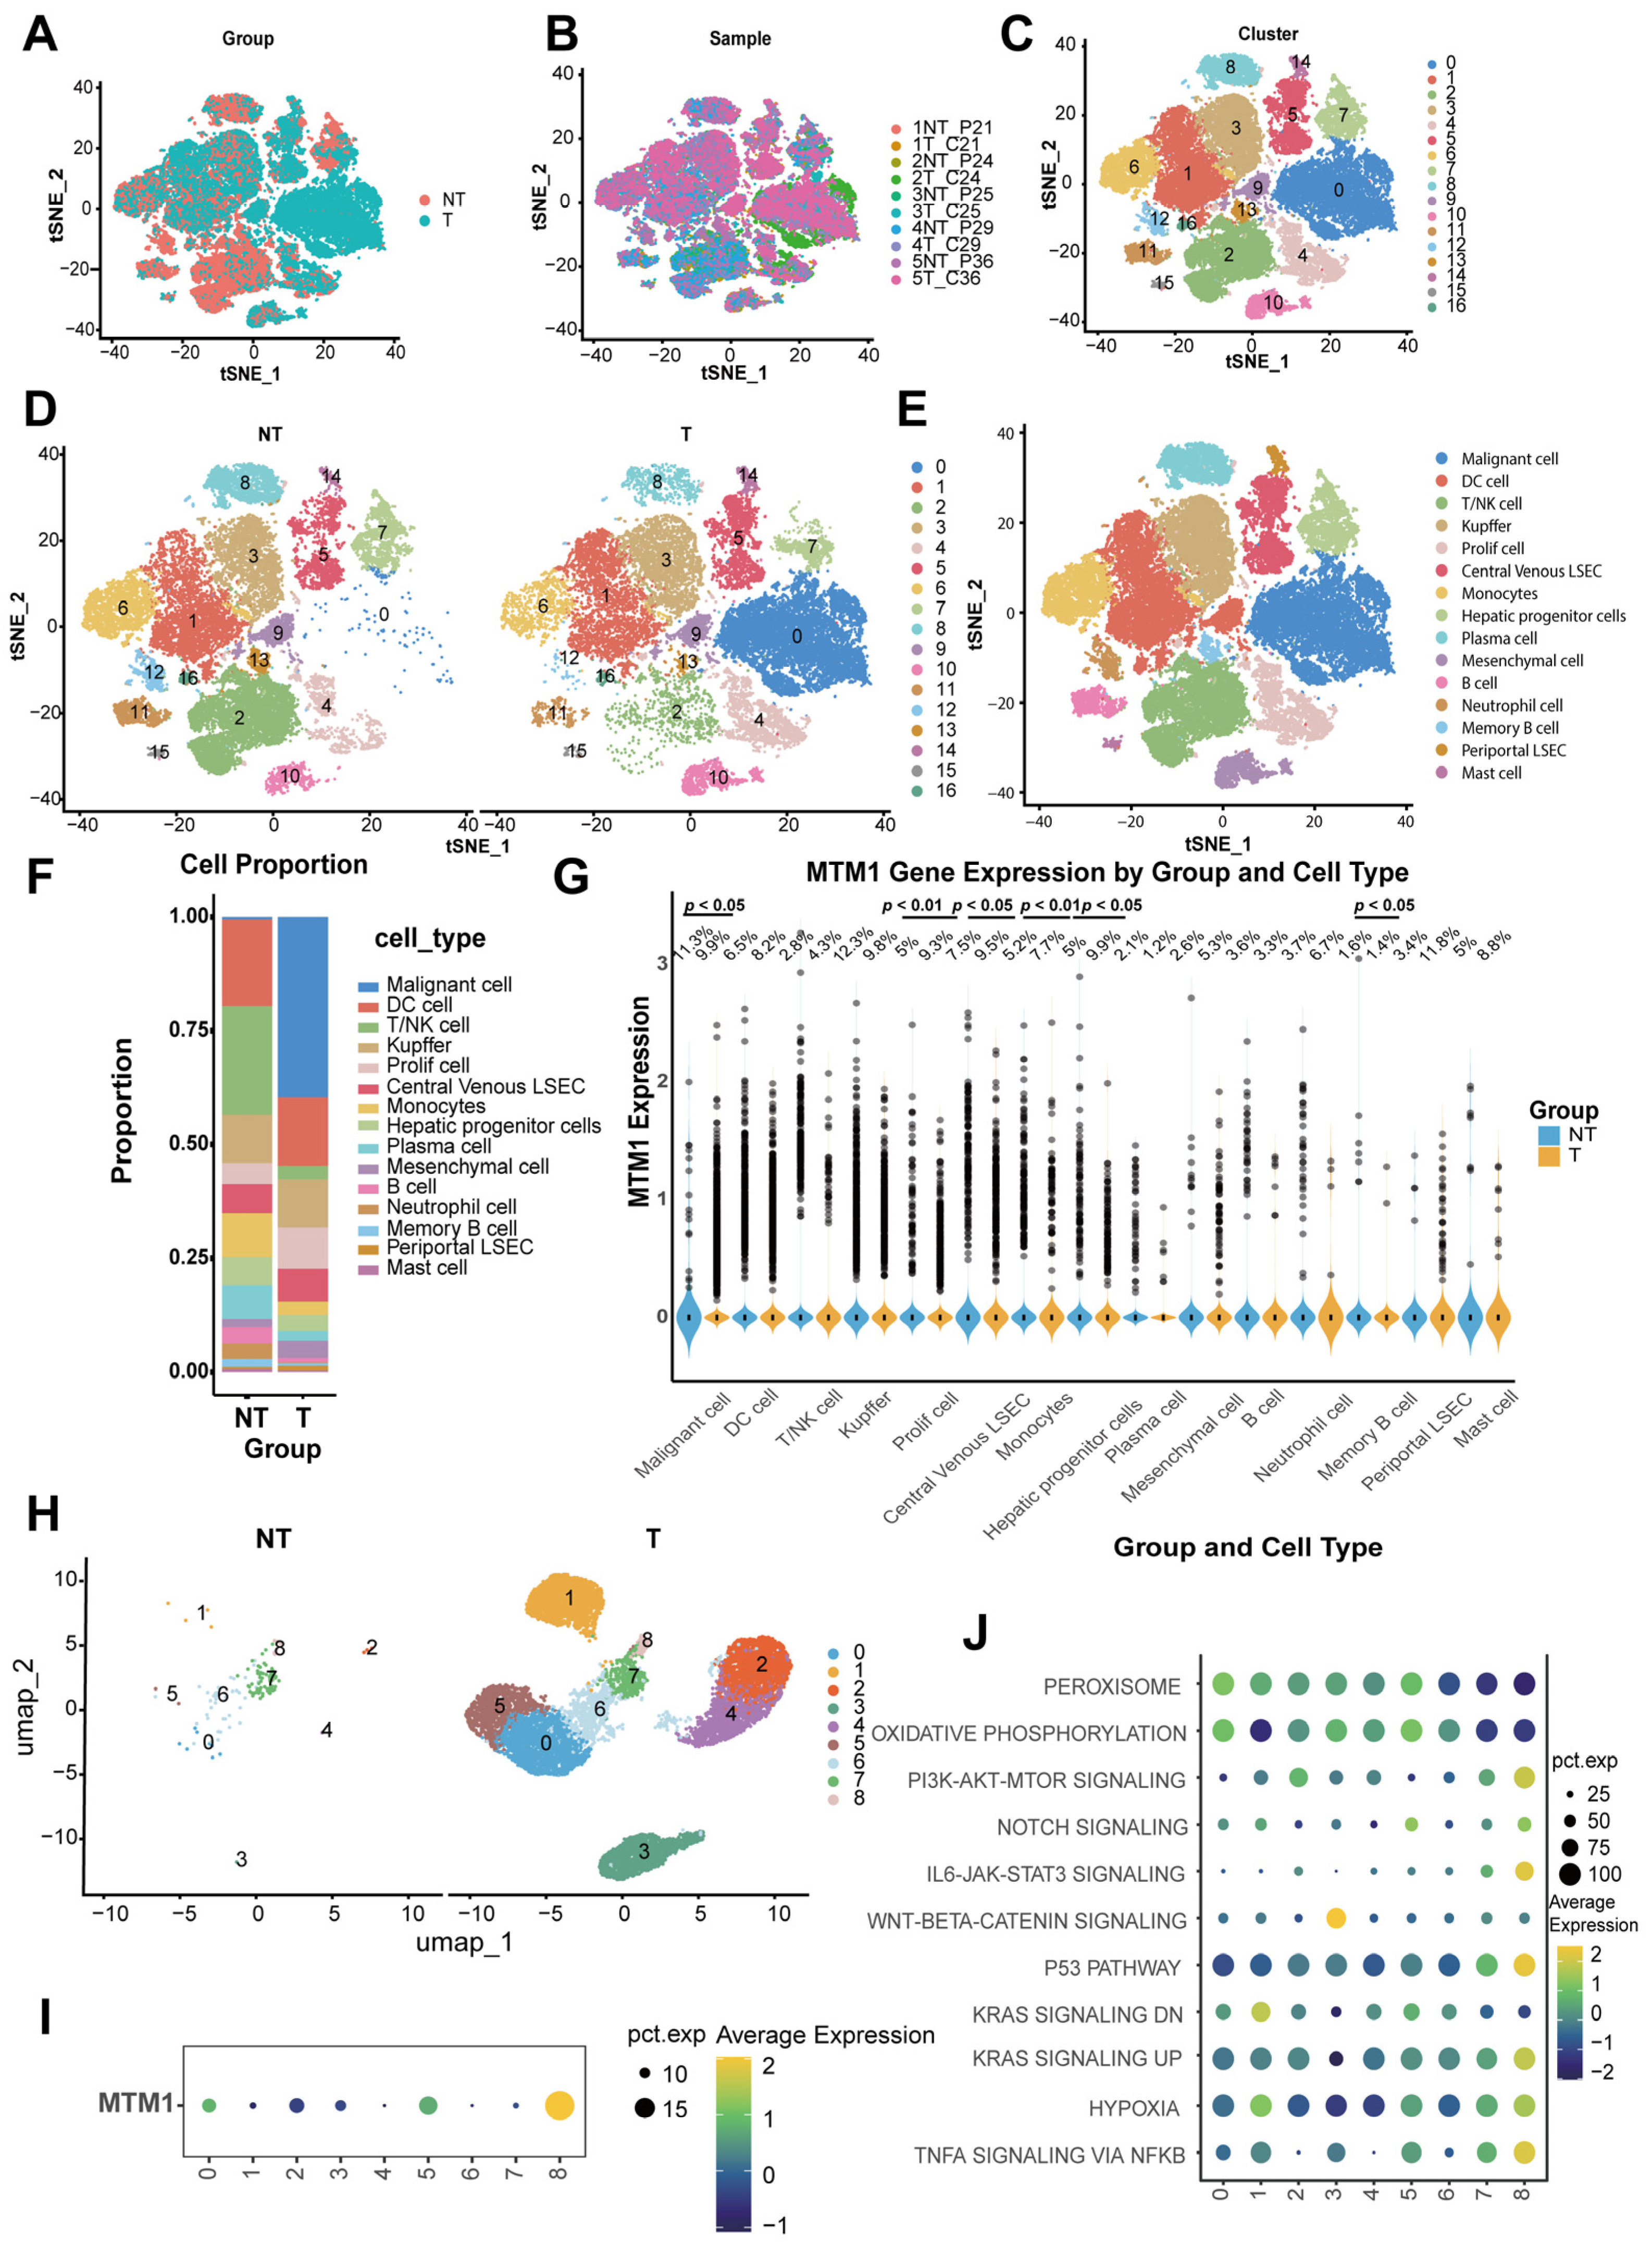
MTM1 upregulation in malignant hepatocytes, suggesting that triaptosis activation could selectively target tumor cells while sparing normal tissues—a critical advantage for therapeutic development. Central to this work is the identification of a 5-lncRNA prognostic signature with superior predictive accuracy over conventional clinical staging. Among these,
LINC01134 emerged as a multifaceted regulator, driving tumor aggressiveness while suppressing triaptosis sensitivity. Mechanistically,
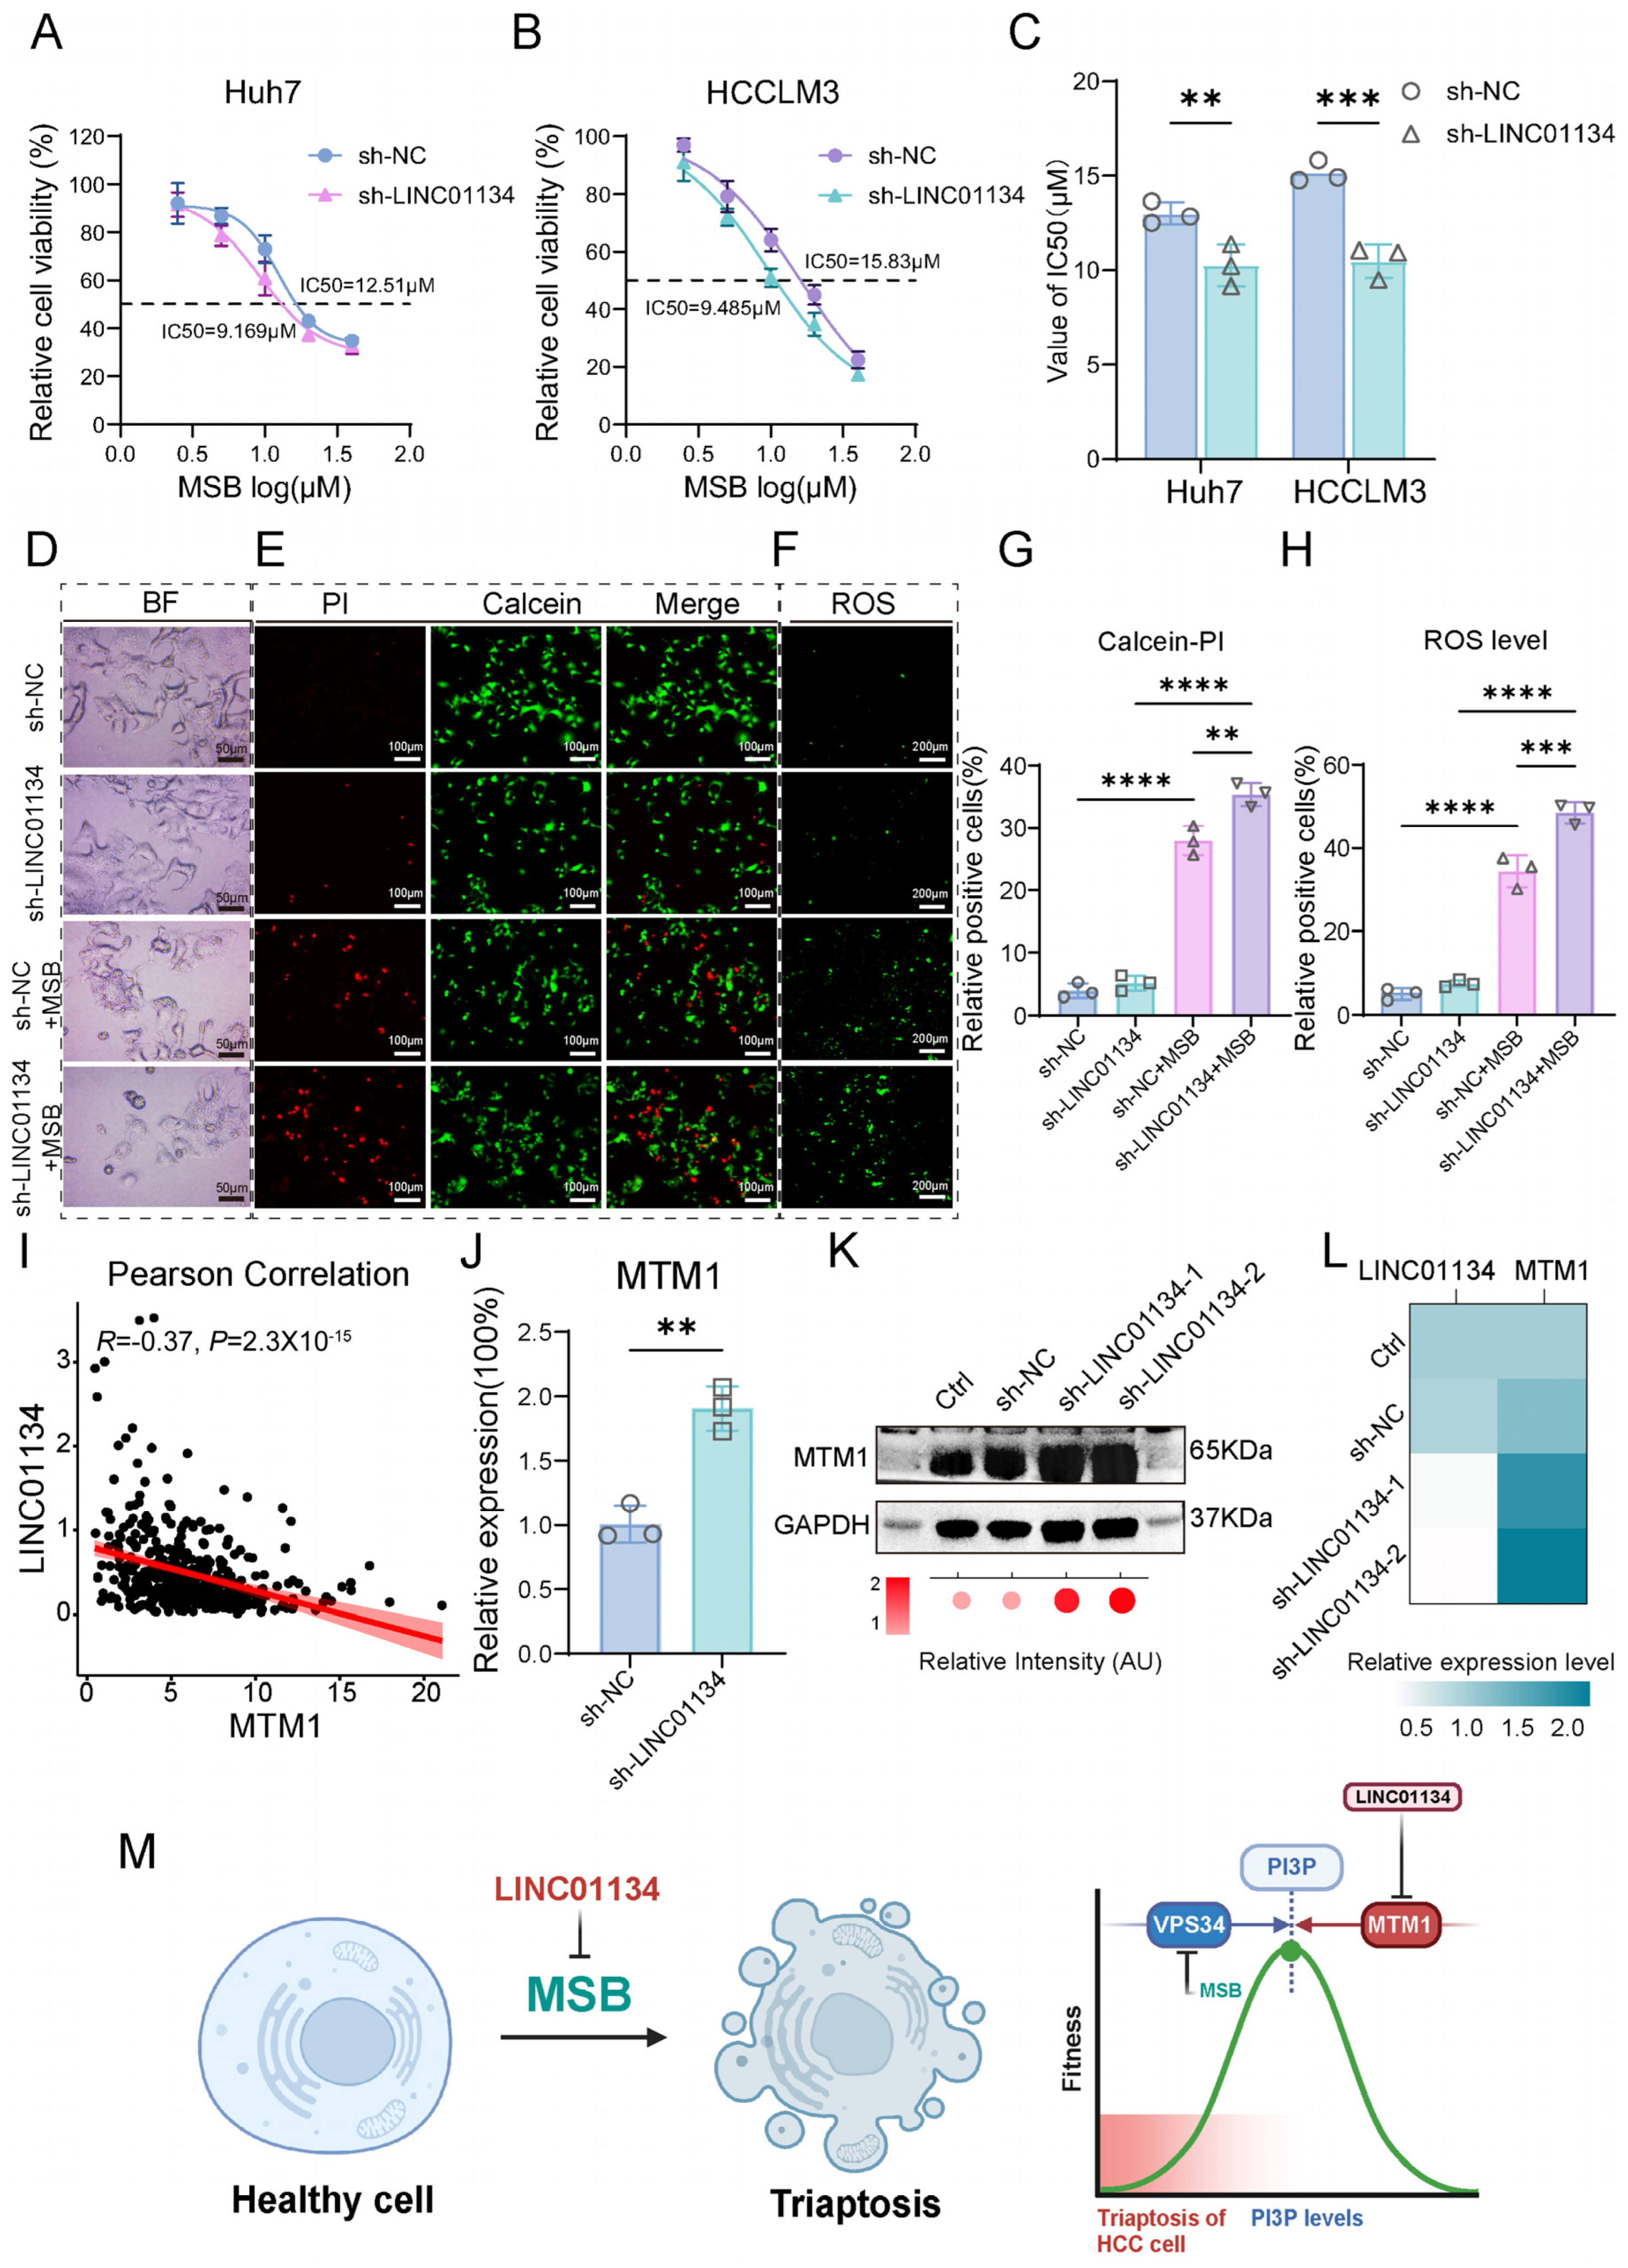
LINC01134 silencing enhanced
MTM1 expression, thereby depleting PI(3)P-inducing triaptosis execution. This dual role positions
LINC01134 as both a prognostic biomarker and a therapeutic target. Notably, our results extend previous studies on lncRNA-mediated drug resistance by introducing a novel axis connecting lncRNAs to cell death regulation.
The five lncRNAs in our prognostic signature—
HPN-AS1,
DDX11-AS1,
LIN01134,
AC009283.1, and
AC009005.1—exhibit potential roles in HCC progression and triaptosis regulation. Previous studies have implicated these lncRNAs in various cancers. For instance,
HPN-AS1 was demonstrated by Jin et al. to suppress HCC proliferation via
GABPA-mediated transcriptional activation and
eIF4A3 degradation [
17]. Our analysis aligns with these findings, as higher
HPN-AS1 expression was correlated with improved prognosis in low-risk HCC patients, suggesting its protective role in specific molecular subtypes. In contrast,
DDX11-AS1 exhibits oncogenic properties across malignancies, including bladder cancer, glioma, and HCC [
18,
19]. Li et al. linked its demethylation-driven overexpression to p53 degradation and impaired tumor suppressor signaling through the
PARP1/p53 axis, underpinning its association with aggressive disease [
20]. Additionally, Miranda et al. suggested a causal link between
AC009283.1 and carcinogenesis, reporting that this lncRNA enhances tumor cell proliferation and apoptosis resistance in
HER2-positive breast cancer [
21]. Notably,
AC009005.1 emerges as a novel high-risk biomarker, with elevated expression predicting poor survival in HCC, yet its mechanistic contributions remain unexplored, highlighting an urgent need to delineate its regulatory pathways in HCC malignancy and triaptosis. The functional heterogeneity of these lncRNAs across cancer types highlights the critical need for context-specific validation. Future studies integrating multi-omics data (e.g., epigenomic, proteomic, and ubiquitinomic profiling) could elucidate their interplay with triaptosis and HCC and then inform targeted therapies leveraging epigenetic or post-translational modulation.
Emerging research has highlighted the critical role of lncRNAs in modulating tumor cell death mechanisms through multidimensional regulatory networks, underscoring their dynamic plasticity and functional diversity in cancer progression [
22]. For instance, recent investigations by Lin’s group have elucidated distinct lncRNA-mediated paradigms: lncRNA
LncFASA promotes ferroptosis in triple-negative breast cancer via
PRDX1 phase-separation-mediated lipid peroxide accumulation [
23]. Separately, in colorectal cancer, the tumor-suppressive lncRNA
LINC00982 encodes
PRDM16-DT, which interacts with
HNRNPA2B1 to suppress
CHEK2 exon skipping. This generates the L-CHEK2 splice variant, activating fibroblast-derived MMP9 secretion and thereby inhibiting tumor metastasis and chemoresistance [
24]. Concurrently, Liu’s team uncovered a novel mechanism in gastric cancer where the lncRNA
HCP5 regulates ferroptosis. Overexpression of
HCP5 stabilizes ferroptosis-related genes via the
HCP5-132aa/YBX1/ELAVL1 ternary complex, suppressing ferroptosis and accelerating cancer progression. CRISPR/Cas9-mediated
HCP5 knockout enhanced sensitivity to ferroptosis inducers, suggesting therapeutic potential [
25]. These findings collectively revealed lncRNA-mediated regulatory paradigms—including epigenetic modification, phase separation, alternative splicing, post-translational modification, and microprotein encoding—that shape tumor microenvironments and regulate death pathways [
11,
22].
These findings collectively revealed lncRNA-mediated regulatory paradigms—including epigenetic modification, phase separation, alternative splicing, post-translational modification, and microprotein encoding—that shape tumor microenvironments and regulate cell death pathways [
26]. Consistent with our study, we found that
LINC01134 shown to promote HCC progression by suppressing sensitivity to triaptosis, a programmed cell death mechanism. This finding reinforces the role of lncRNAs as key regulators of cancer cell death sensitivity. Together, these insights provide a theoretical foundation for developing lncRNA-targeted nucleic acid therapies and combinatorial strategies using programmed cell death inducers. Future studies should prioritize deciphering the spatiotemporal interaction networks of lncRNAs to expedite their clinical translation.
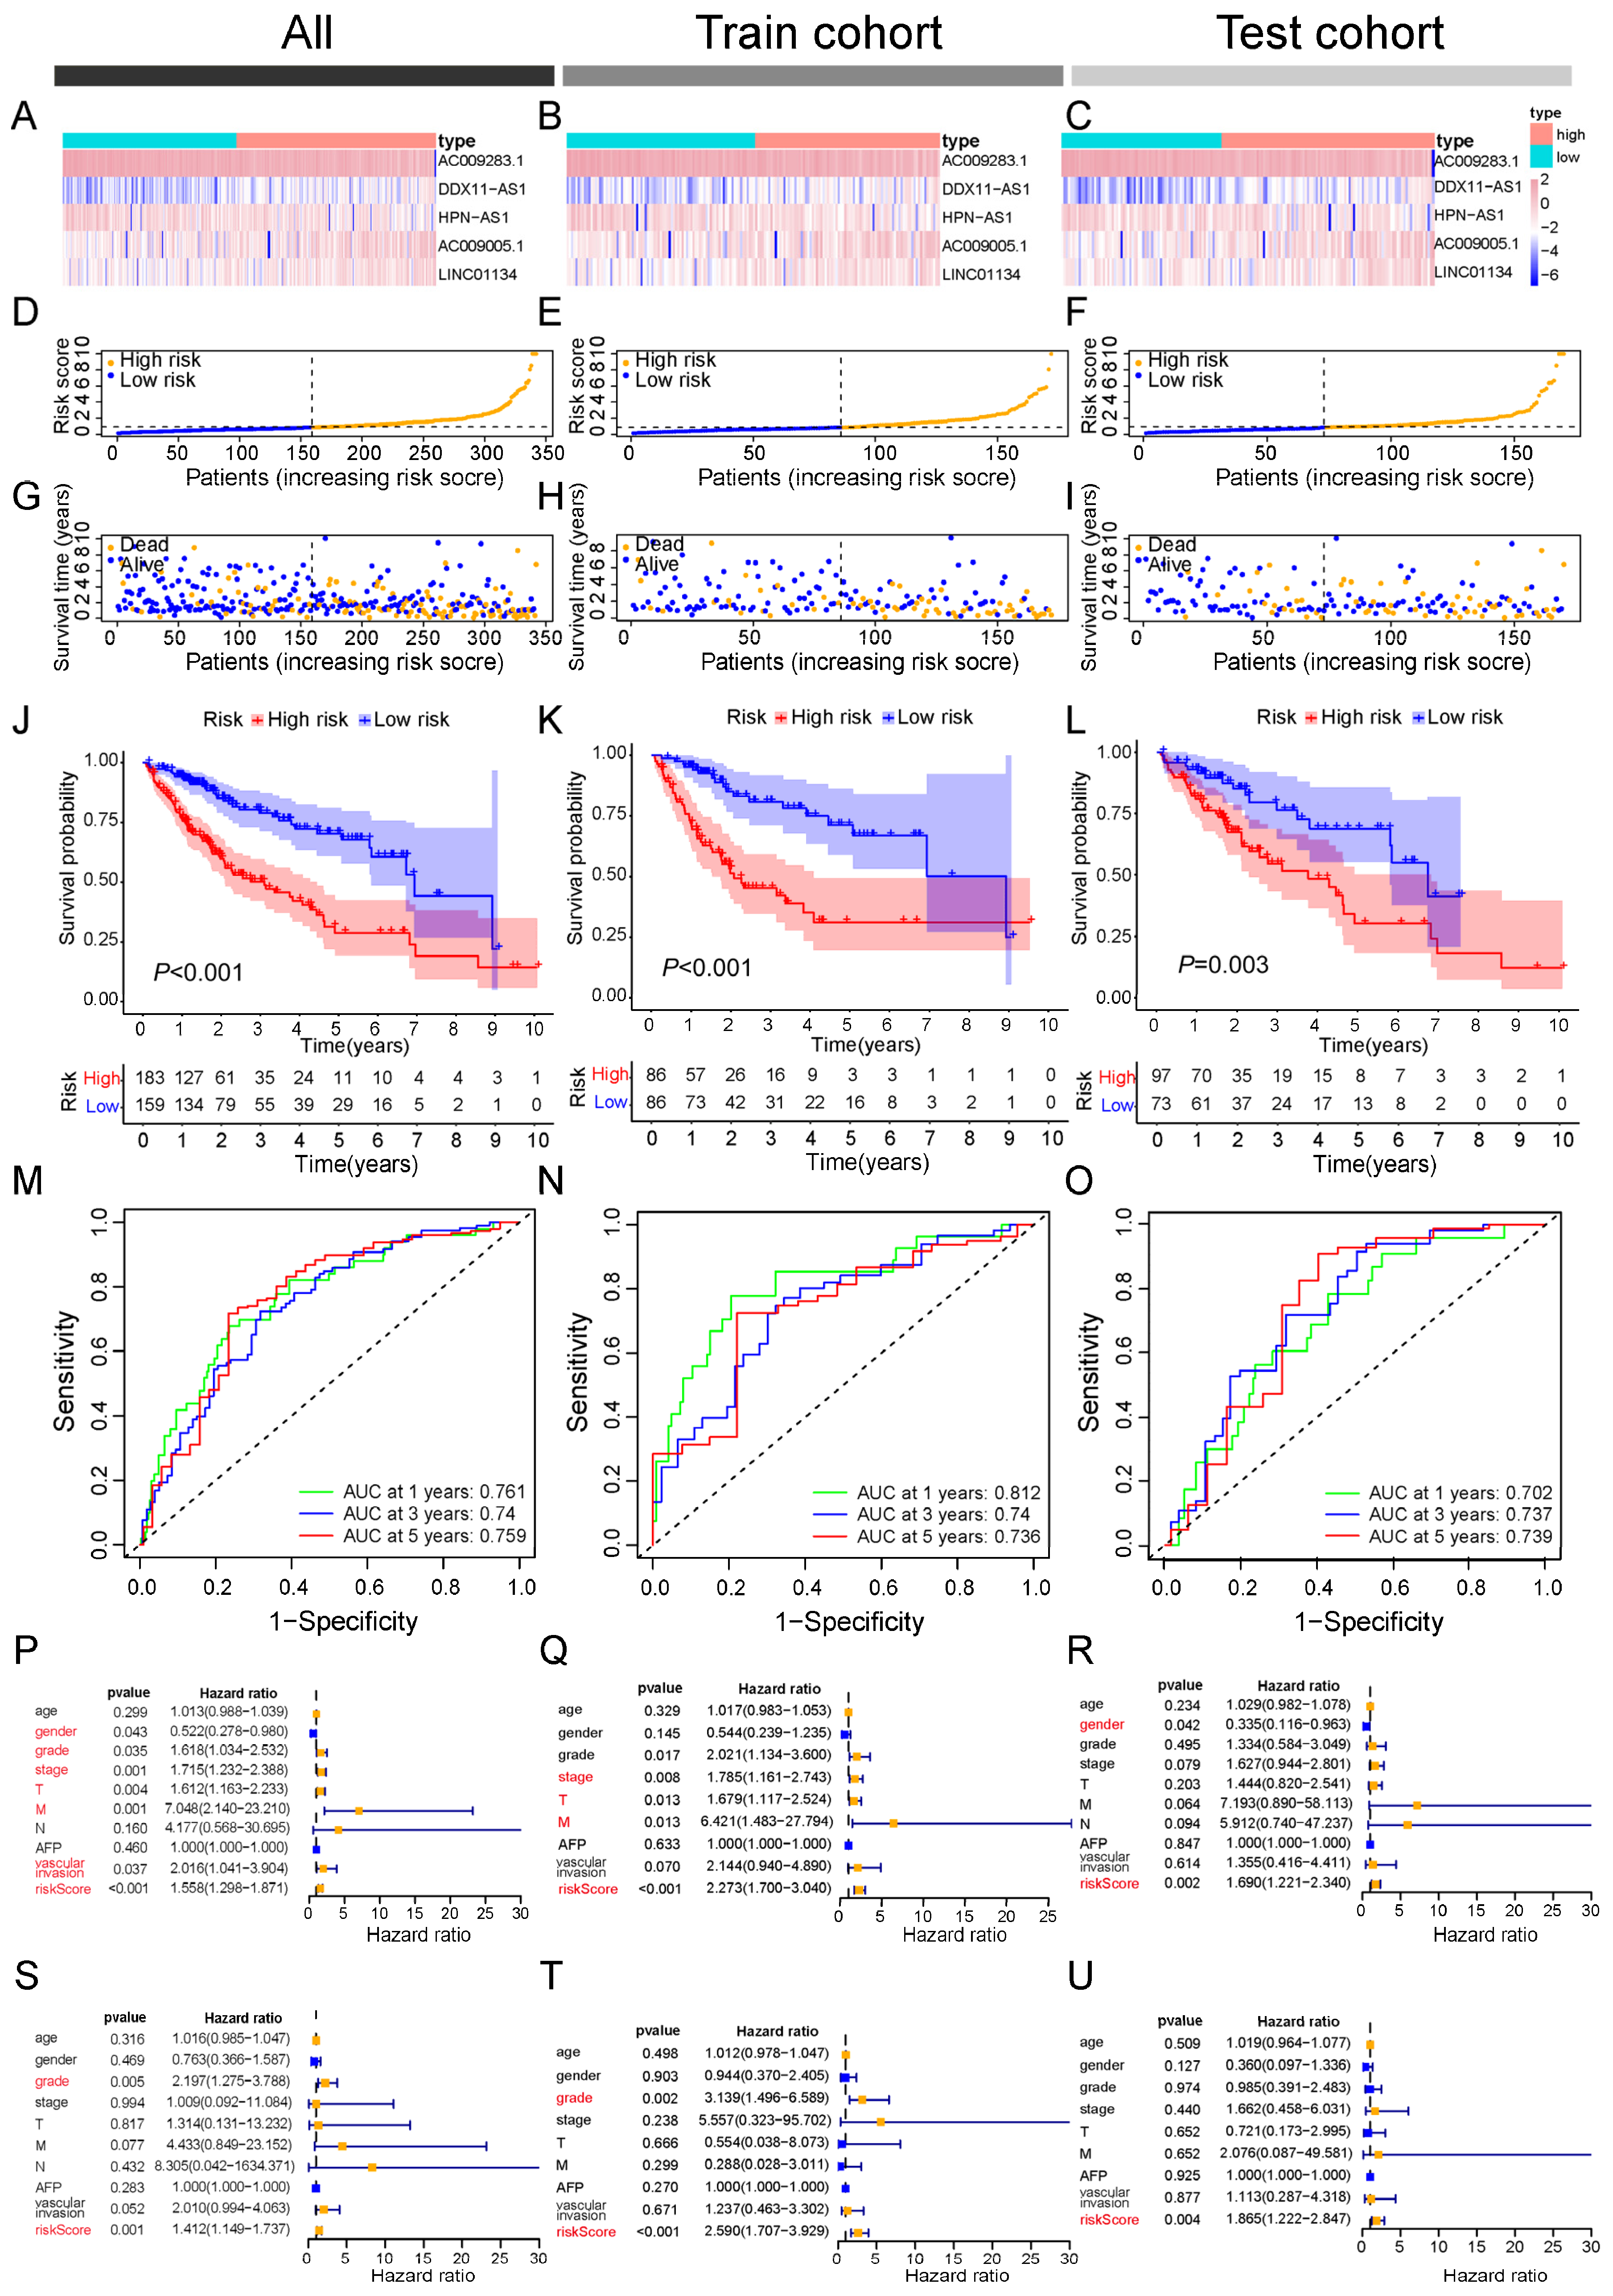
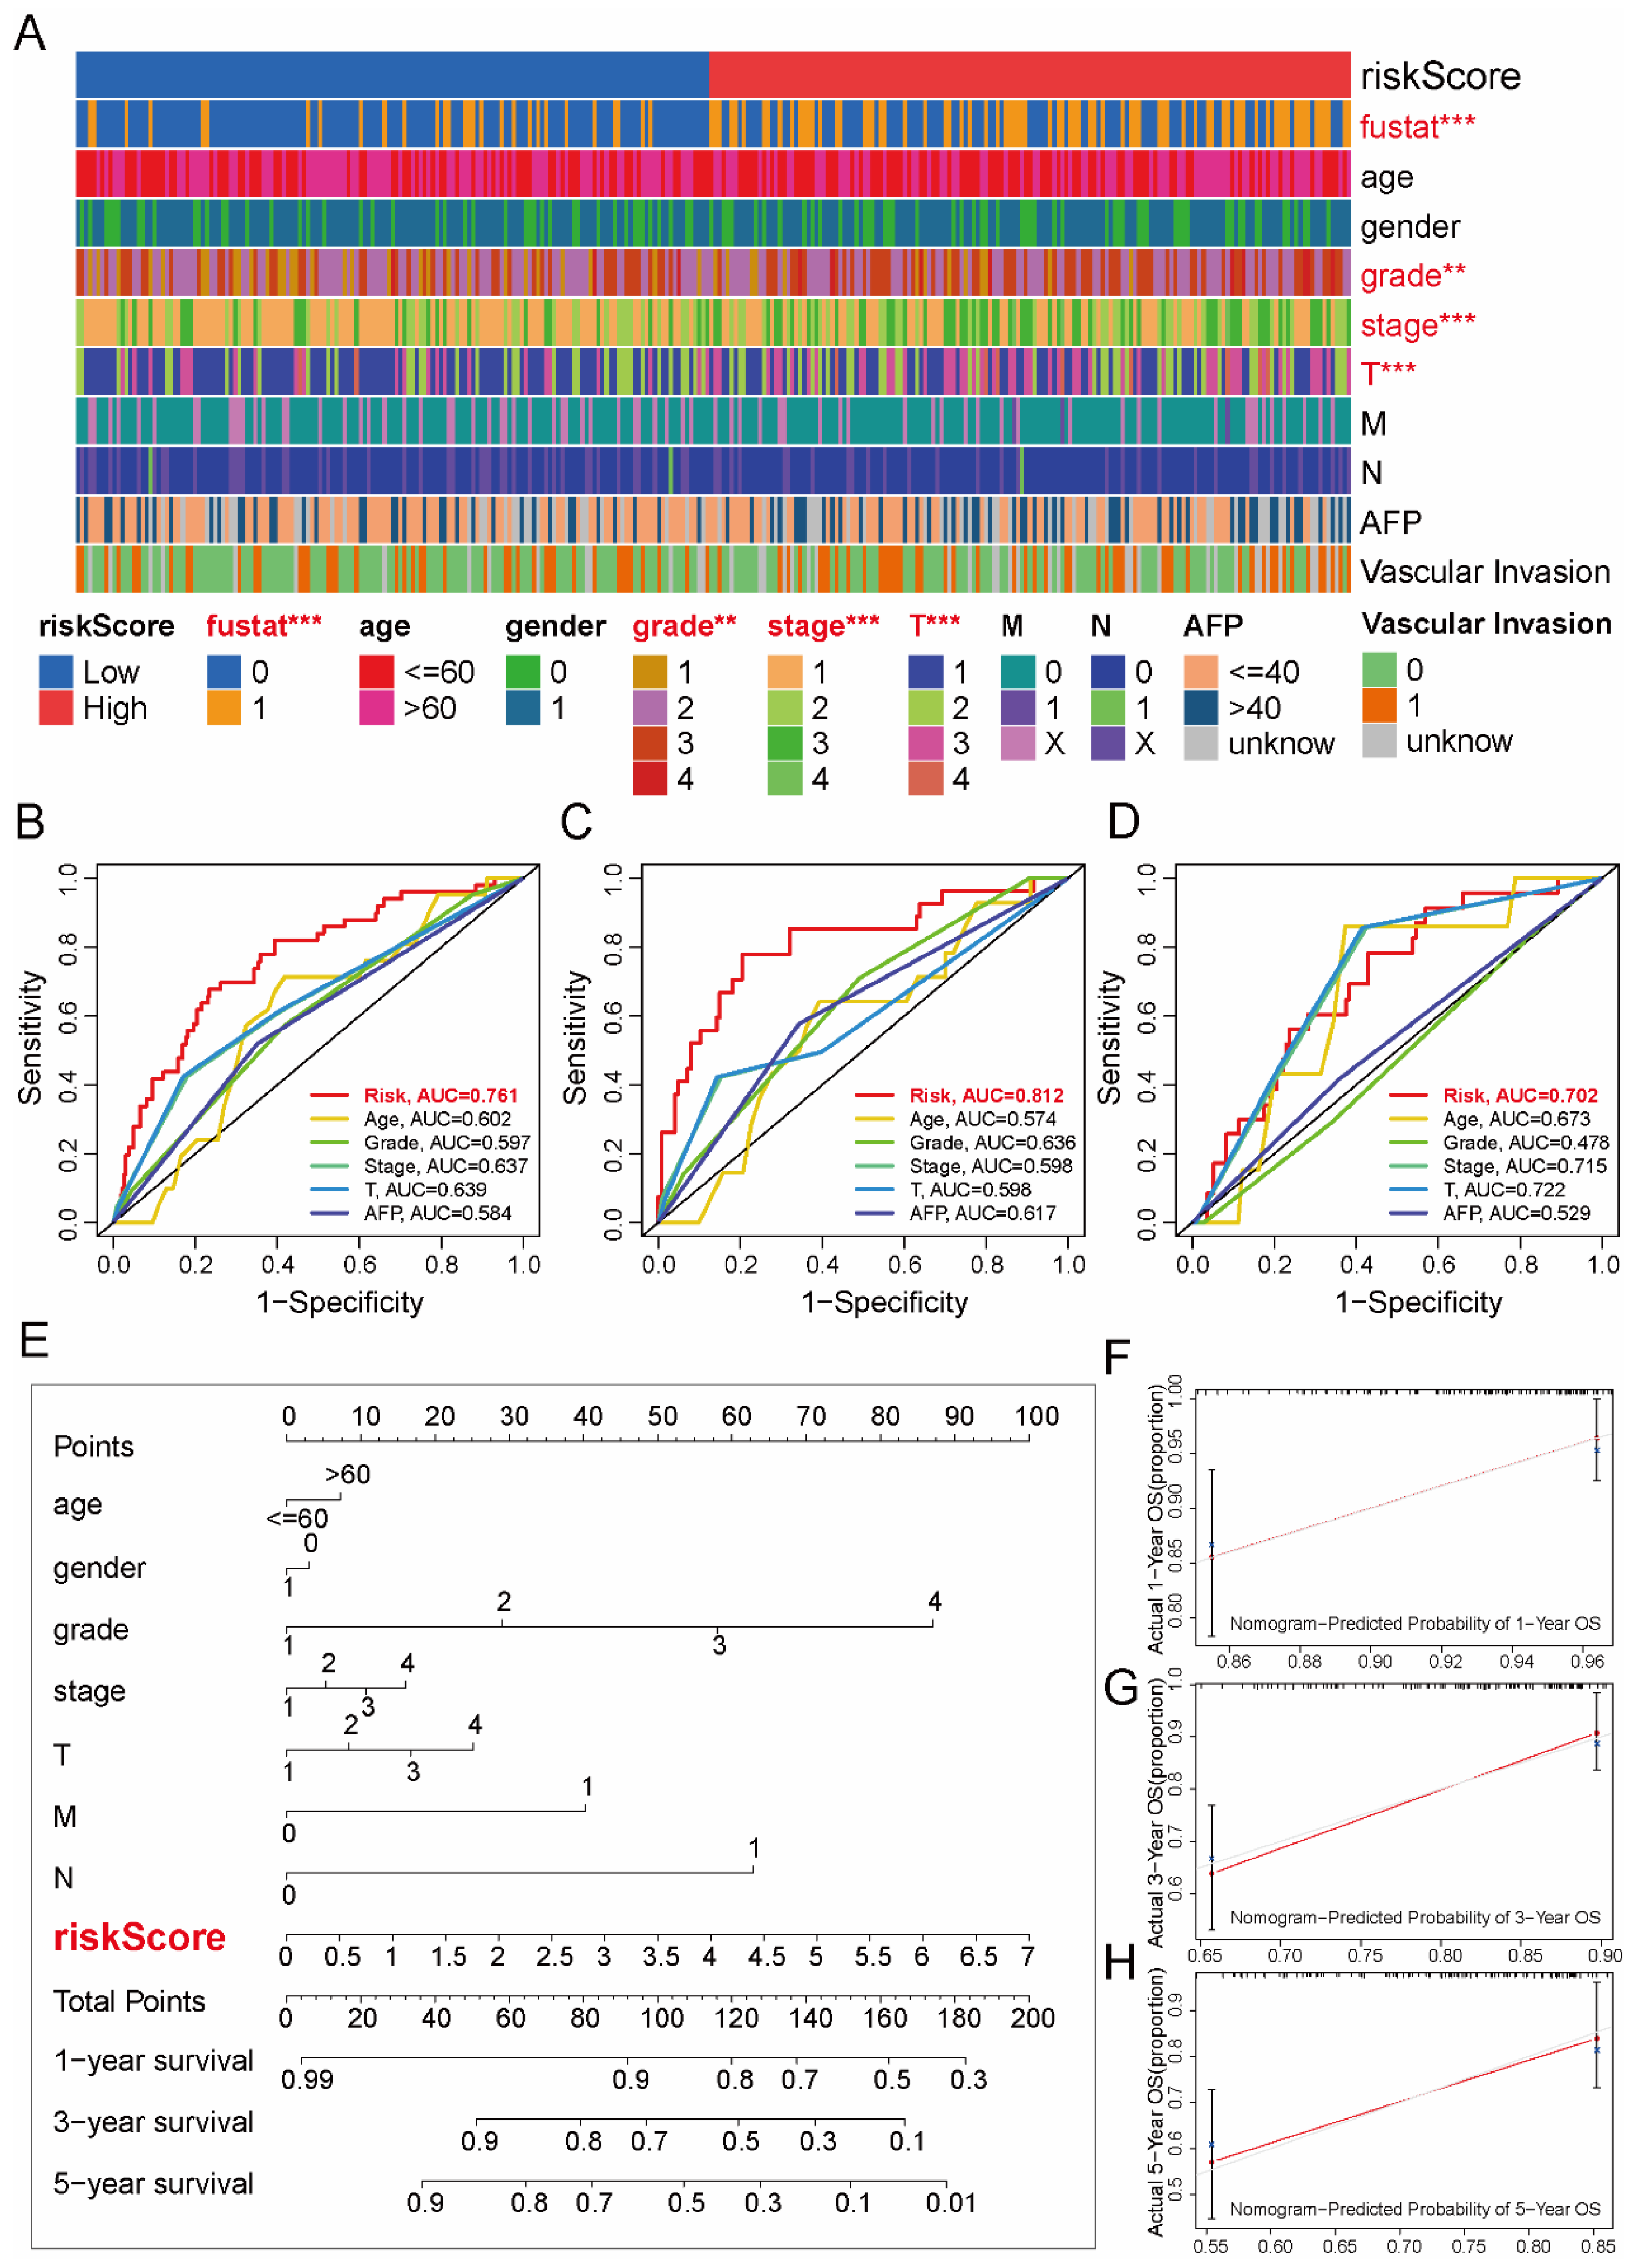
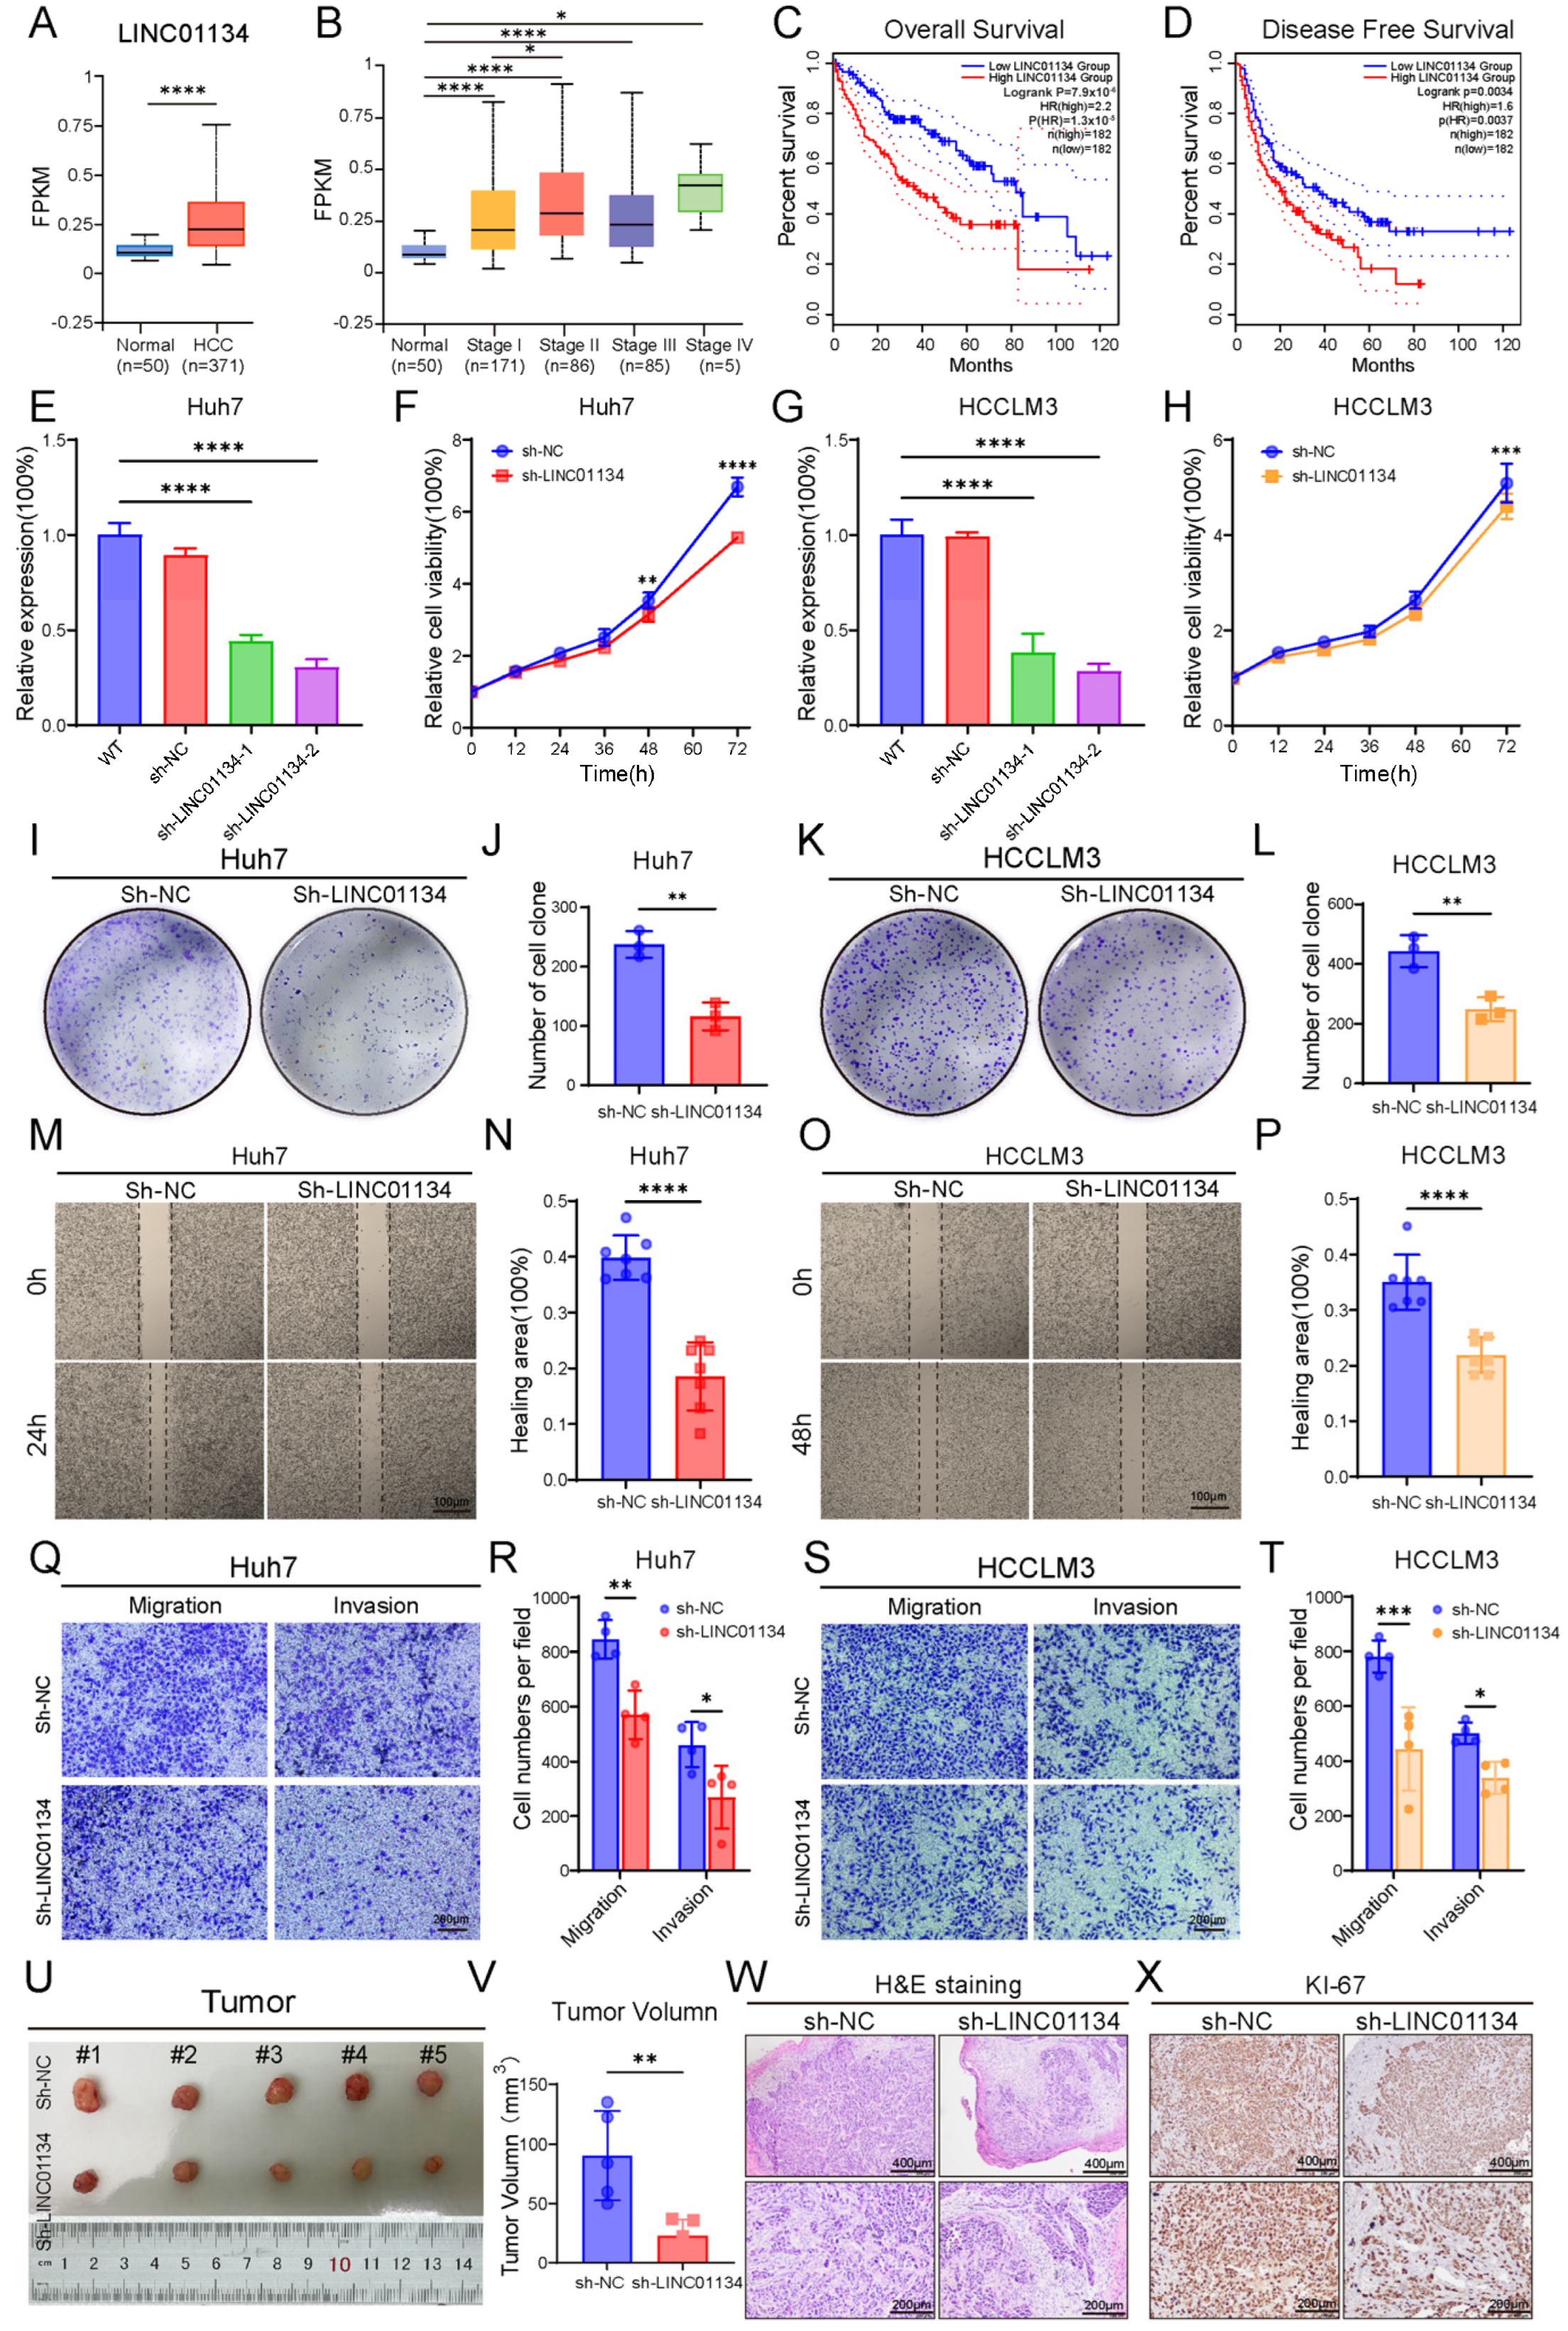
The clinical value of our findings is underscored by several observations: (1) notably, the signature demonstrated stage-independent prognostic value across all TNM subgroups, highlighting its capacity to overcome the limitations of anatomic staging and provide molecular-driven risk assessment for precision oncology applications. (2) LINC01134 expression correlated with advanced AJCC stages, reflecting its functional contribution to disease aggressiveness. (3) By integrating molecular signatures with conventional clinical parameters, the developed nomogram showed strong predictive accuracy and may serve as a practical tool for personalized prognostic assessment and therapeutic decision-making. (4) LINC01134 silencing upregulated MTM1 expression, thereby enhancing the sensitivity of HCC cells to triaptosis. This finding expands the potential for targeted tumor therapies through the induction of programmed cell death pathways.
However, certain limitations warrant consideration. First, while our study demonstrates that genetic ablation of LINC01134 inhibits tumor progression in vivo and suppresses MTM1 expression in vitro, it should be noted that the causal relationship between LINC01134 knockout-mediated tumor suppression and MTM1 downregulation remains to be formally established in animal models. Specifically, we have not yet provided direct evidence that LINC01134 deletion reduces MTM1 expression in vivo, and such reduction functionally contributes to the observed antitumor effects. Thirdly, while murine xenograft models validated LINC01134’s oncogenic role, orthotopic models better recapitulating the liver microenvironment are needed. Fourthly, another important limitation is the unexplored functional contribution of VPS34, a key modulator of triaptosis that directly antagonizes MTM1 activity, in our experimental system.
For clinical translation, future studies should include the following: first, developing combination regimens integrating novel triaptosis activators (e.g., MSB derivatives) with LINC01134 silencing approaches. Second, conducting phase II biomarker-driven trials to validate the signature’s predictive value. Third, systematically mapping death pathway among triaptosis and other cell death pathways interactions through CRISPR screens to design rational polytherapy regimens against resistant clones.
4. Material and Methods
4.1. External Data Collection
RNA-seq data (FPKM-standardized) from 374 HCC samples and 50 adjacent normal liver tissues were obtained from TCGA-LIHC (
https://portal.gdc.cancer.gov/projects/TCGA-LIHC, accessed on 20 December 2024). We retrieved clinical data for HCC patients from TCGA, excluding those with missing survival data or an OS of <30 days. Ensembl IDs for lncRNAs, protein-coding genes, and miRNAs were mapped to their official gene symbols. The triaptosis-related gene set, comprising 14 genes, was adopted from a previous study (
Table 1) [
9]. scRNA-seq datasets of HCC and matched normal liver samples were collected from the Gene Expression Omnibus (GEO; GSE242889:
http://www.ncbi.nlm.nih.gov/geo/, accessed on 24 December 2024) [
27].
4.2. Cell Culture and Reagents
The human hepatocellular carcinoma (HCC) cell lines Huh7 and HCCLM3 were acquired from the Cell Bank of the Chinese Academy of Sciences (Shanghai, China). These cells were routinely cultured in Dulbecco’s Modified Eagle Medium (DMEM; Gibco, Waltham, MA, USA), which was supplemented with 10% fetal bovine serum (FBS; Gibco, USA). The cells were kept in a humidified incubator at 37 °C with 5% CO2.
The inhibitors used in this study, including Z-VAD-FMK (ZVF, S7023), ferrostatin-1 (Fer-1, S7243), necrostatin-1 (Nec-1, S8037), and N-acetyl cysteine (NAC, S5804), were procured from Selleck. Their respective working concentrations were as follows: 30 μM for ZVF, 10 μM for Fer-1, 20 μM for Nec-1, and 1 mM for NAC. Menadione sodium bisulfite (MSB; M2518, Sigma-Aldrich, St. Louis, MO, USA) was dissolved in sterile water and used at final concentrations of 0, 12.5, 25, and 50 μM for 12 h unless otherwise specified.
4.3. Cell Viability Assay
Following adhesion for 24 h in 96-well plates (3000 Huh7 cells/well), the cells were treated with increasing doses of MSB (0, 12.5, 25, 50 μM). Subsequently, 100 μL of fresh medium with 10% CCK-8 reagent (MA0218; Meilunbio, Dalian, China) was introduced into each well. After a 2 h incubation at 37 °C, absorbance was quantified at 450 nm using a Multiskan Spectrum 1500 spectrophotometer (Thermo Fisher Scientific, Waltham, MA, USA).
4.4. Establishment of Hepatoma Xenograft Model
Hepatoma xenograft models were established in male BALB/c nude mice (n = 5; 4 weeks old, ~20 g, purchased from Shanghai SLAC Laboratory Animal Co., Ltd., Shanghai, China). All animal experiments were performed in accordance with the guidelines approved by the Institutional Animal Care and Use Committee of Sir Run Run Shaw Hospital (SRRSH), with mice maintained in the pathogen-free facility of the hospital’s Laboratory Animal Research Center. To initiate tumor growth, 1 × 10⁷ Huh7 cells suspended in 200 μL PBS were injected subcutaneously into the right flank of each mouse. Tumor volume was monitored every 48 h and calculated using the following formula: V = (L × W2)/2, where L and W denote the longest and shortest diameters, respectively. Mice (n = 5 per group) received MSB (150 μg/mL) in drinking water for two weeks beginning 24 h after tumor cell inoculation; control mice received vehicle only. Mice were euthanized two weeks post-injection, and tumors were harvested, weighed, and imaged.
4.5. ROS and TUNEL Staining
To assess intracellular ROS levels, cells were loaded with 10 μM DCFH-DA (DCFH-DA; #S0035S, Beyotime, Shanghai, China) in serum-free medium for 30 min at 37 °C in darkness. Rosup (#S0035S-2, Beyotime, China), a proprietary compound mixture used as a positive control inducer of intracellular ROS, was applied at a concentration of 50 μg/mL for 30 min. Following three washes with PBS, the fluorescent signals were visualized under a Leica DM2500 fluorescence microscope (Germany), and the proportion of ROS-positive cells was quantified using ImageJ software (v1.53).
For the detection of apoptosis in tumor tissues, 5 μm paraffin-embedded sections were processed through deparaffinization, rehydration, and permeabilization with 20 μg/mL Proteinase K for 15 min at room temperature. Apoptotic cells were subsequently labeled employing the TUNEL assay kit (C1089, Beyotime, China). After counterstaining cell nuclei with DAPI (1 μg/mL; D9542, Sigma-Aldrich), images were acquired with the same Leica DM2500 fluorescence microscope.
4.6. Data Pre-Processing, Filtering and Normalization
The scRNA-seq dataset was processed with Seurat (v4). Following the creation of a Seurat object, quality control was performed by excluding cells that contained fewer than 500 genes or where mitochondrial genes constituted over 30% of the total transcript count (
Figure S2A–F) [
27]. Gene expression was then log-normalized and scaled. We subsequently identified the top 2000 highly variable genes for downstream analysis. To integrate data and mitigate batch effects, we applied the Harmony algorithm (v1.2.1), which preserves biological heterogeneity while correcting for technical variance.
4.7. Clustering Division and Cell Type Annotation
Dimensionality reduction was performed by applying principal component analysis (PCA) to the highly variable genes (HVGs). The first 30 principal components were then utilized to construct a shared nearest neighbor (SNN) graph, which was subsequently clustered using the Louvain algorithm. Finally, the resulting cell clusters were visualized in two dimensions with t-distributed stochastic neighbor embedding (t-SNE) (
Figure S2G). For subcluster analysis, the clustree package was used to select the resolution and 0.3 was chosen. FindAllMarkers function was utilized to find genes with differential expressions. The major cell types were identified based on typical cell type markers. Eventually, malignant cells, DCs, T/NK cells, Kupffer cells, proliferation cells, central venous LSECs, monocytes, hepatic progenitor cells, plasma cells, B cells, neutrophil cells, memory B cells, periportal LSECs, and mast cells were labeled (
Figure S2H). Following the same processing pipeline with a resolution of 0.4, we identified 9 malignant cell subclusters and evaluated their tumor-related pathway activities using the AddModuleScore package.
4.8. Identification of Differentially Expressed lncRNAs (DELs) and Triaptosis Co-Expressed lncRNAs (TCLs)
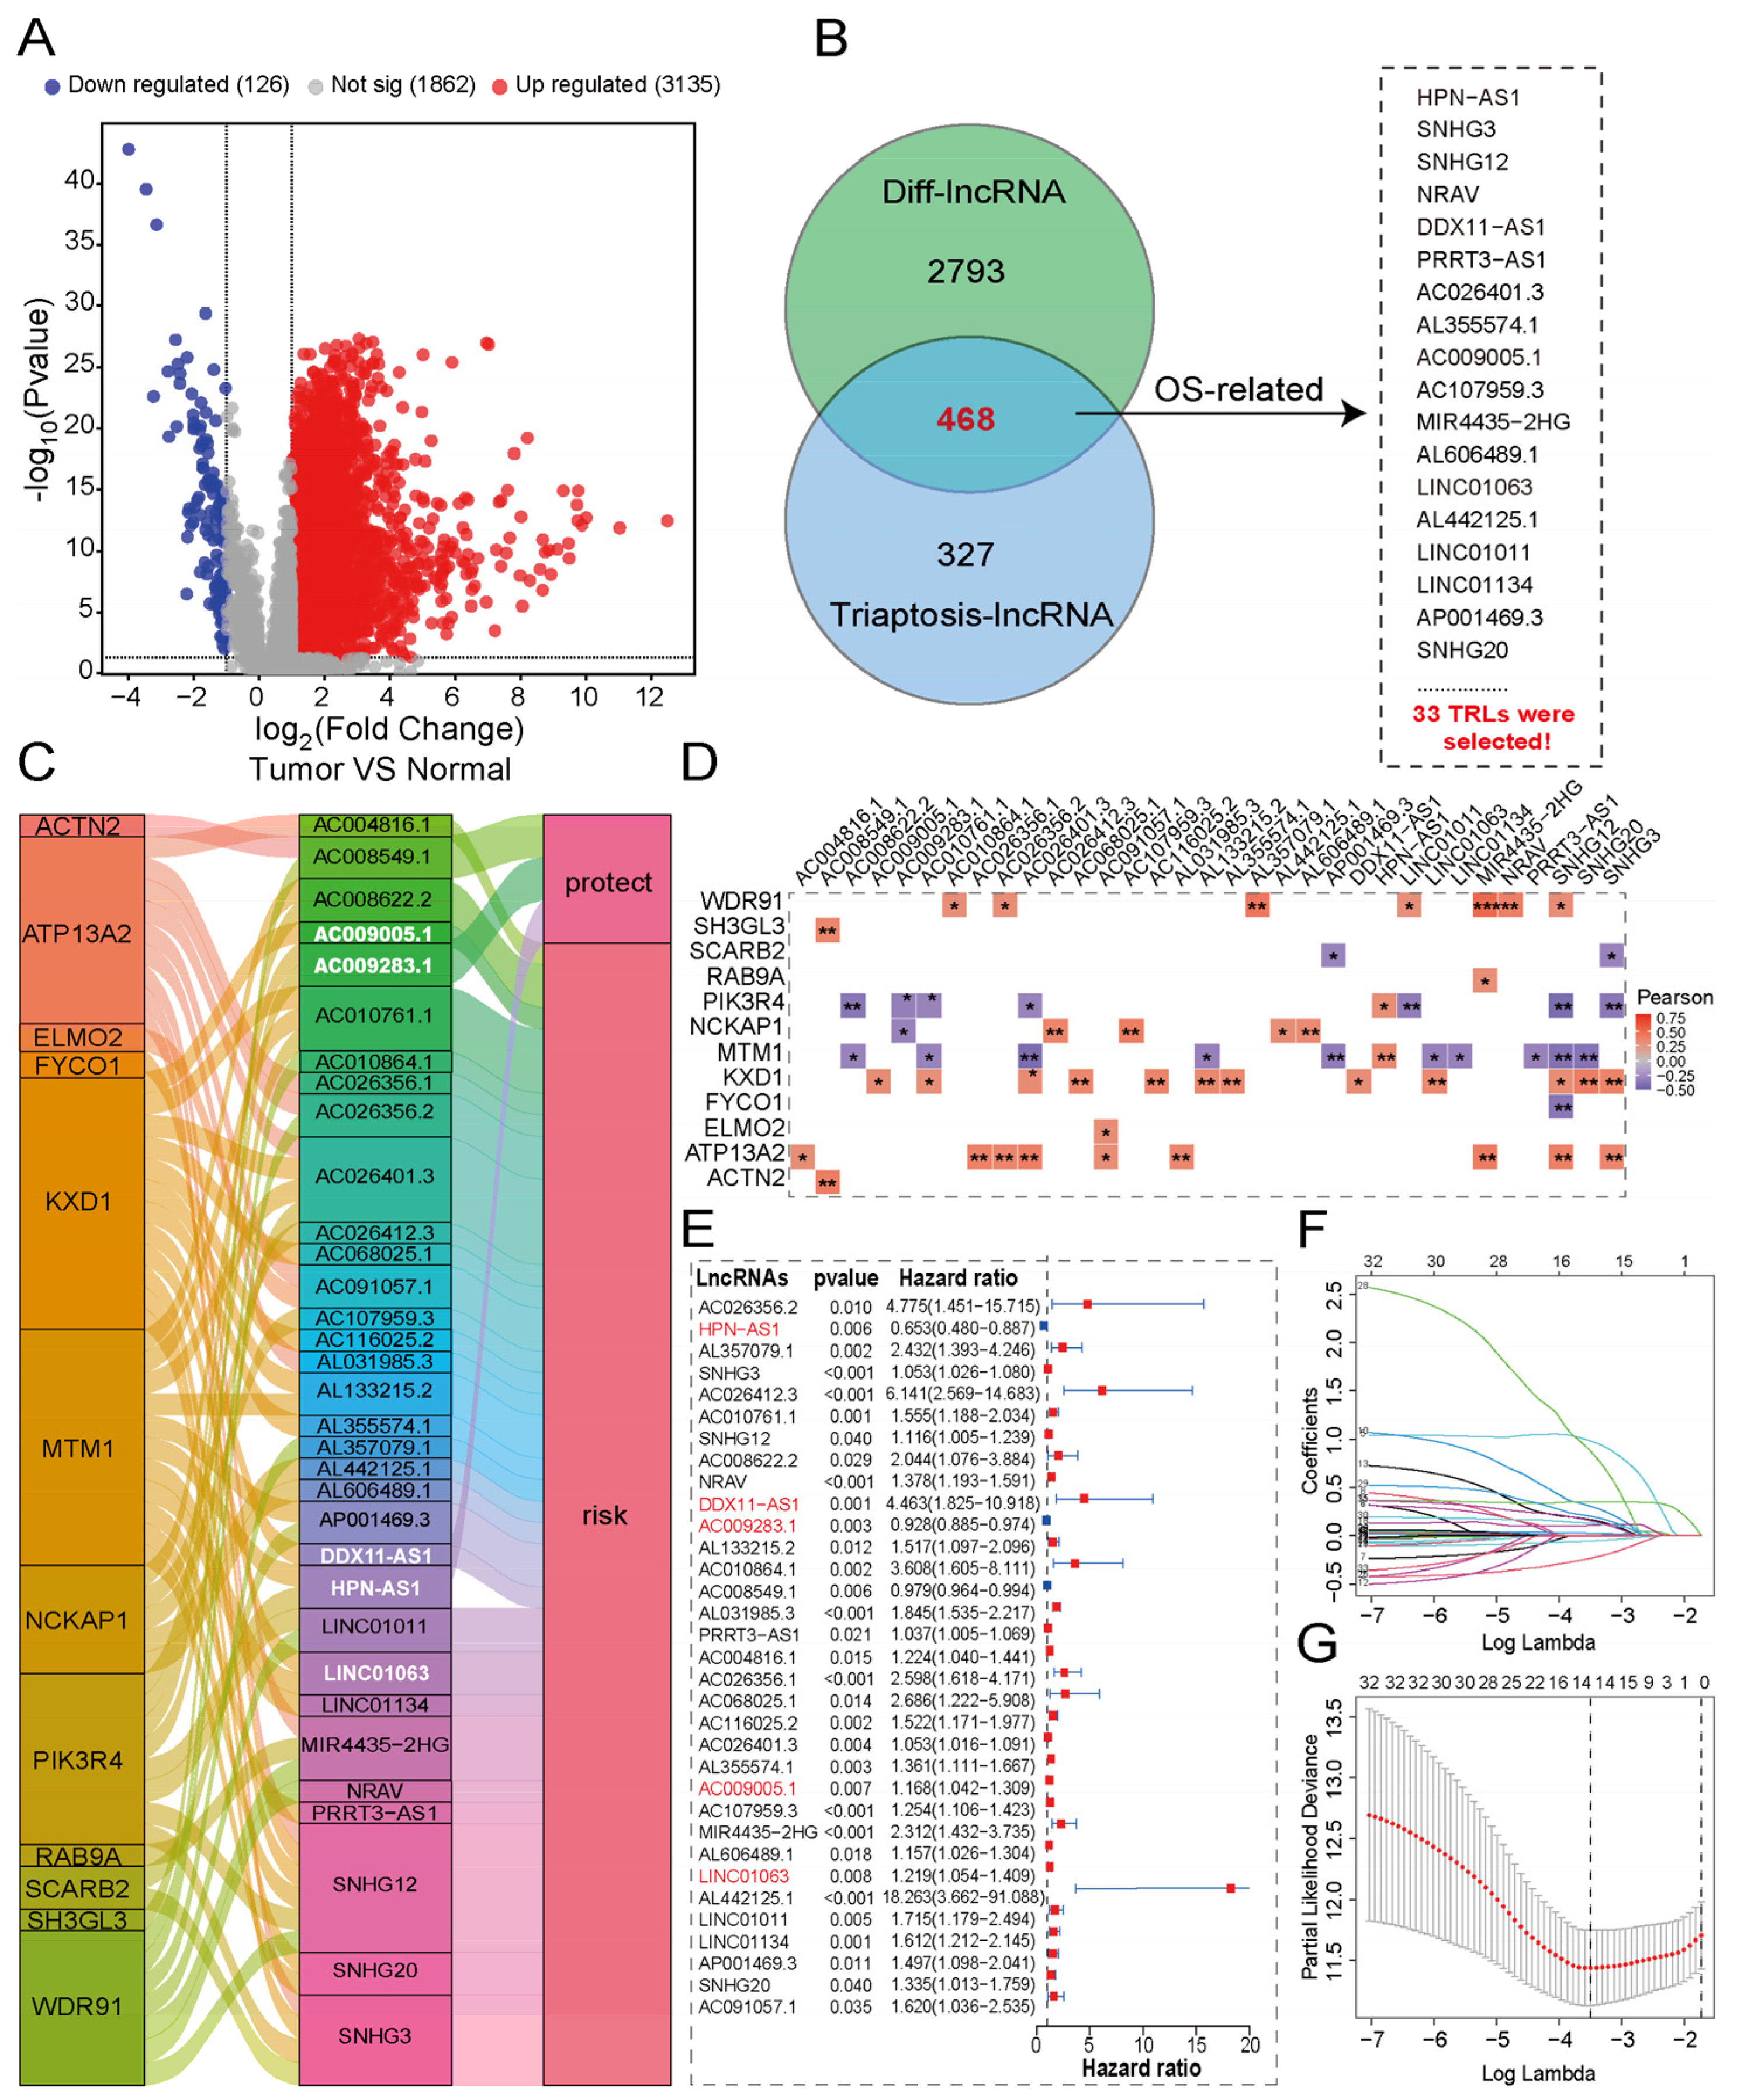
Differentially expressed lncRNAs (DELs) between HCC and normal liver tissues were screened using the ‘limma’ R package (Version: limma_3.65.3), with stringent thresholds set at |log2(fold change)| > 1 and an adjusted p < 0.001. Subsequently, we constructed mRNA-lncRNA co-expression networks by performing Pearson correlation analysis on TCGA HCC RNA-seq data, focusing on the 12 triaptosis-related genes (TRGs). Transcript correlation links (TCLs) were identified based on a correlation coefficient (R) > 0.3 and a statistical significance of p < 0.001.
4.9. Prognostic lncRNA Screening via Univariate Cox Analysis
The overlapping lncRNAs derived from the DELs and TCLs were further screened for prognostic significance. This was accomplished through univariate Cox regression analysis, implemented with the ‘survival’ R package. LncRNAs significantly associated with overall survival (p < 0.05) were ultimately defined as triaptosis-related prognostic lncRNAs (TRLs) in HCC.
4.10. Triaptosis-Related Prognostic Signature Construction and Validation
A prognostic signature was developed using LASSO Cox regression (Via the glmnet R package) to identify the most predictive TRLs and compute their respective regression coefficients [
28]. Employing tenfold cross-validation (minimum λ criteria) yielded a final set of five TRLs for model construction. Each patient’s risk score was computed as the sum of the product of each TRL’s coefficient and its expression level. Using the median score as the cutoff, patients were classified into low- and high-risk cohorts. The model’s performance was rigorously validated by time-dependent ROC analysis, Kaplan–Meier survival curves, and univariate and multivariate Cox regression.
4.11. Nomogram Development
A predictive nomogram incorporating the risk score and relevant clinicopathological variables was constructed with the R rms package to estimate the probability of OS at 1, 3, and 5 years. Calibration curves were then plotted to evaluate the agreement between the nomogram’s predictions and the actual observed survival outcomes [
29].
4.12. Lentiviral Knockdown and Transfection
LINC01134-targeting shRNAs (shLINC01134-1: 5′-GCTCCAGAACTACATCAAAT-3′; shLINC01134-2: 5′-GCAAGACCTGAAGTGCTATAA-3′) and scrambled control shRNA were cloned into the pLKO.1 plasmid. Production of lentiviral particles involved co-transfection of HEK293T cells with psPAX2/pMD2.G packaging plasmids using Lipofectamine™ 3000 (L3000015; Thermo Fisher, Waltham, MA, USA). Following collection and 0.22 μm filtration of the supernatant at 48 h, the virus was concentrated via ultracentrifugation for subsequent transduction of HCC cells. Stable clones were then obtained under 1 μg/mL puromycin selection for 48 h.
4.13. Human Samples Acquisition
Freshly paired samples of tumor and adjacent normal liver tissues (n = 16) were acquired from HCC patients who underwent surgical resection at Sir Run Run Shaw Hospital, Zhejiang University School of Medicine (Hangzhou, China). The Ethics Committee of the hospital granted approval for this study (ethical code: 20210729-282), which was conducted in strict accordance with the ethical principles of the Declaration of Helsinki.
4.14. RNA Extraction and Quantitative Real-Time PCR
Total RNA was isolated from cultured cells with the RNA-Quick Purification Kit (AG21023, Accurate Biology, Wuhan, China). The purified RNA was then reverse-transcribed into cDNA using the Eco M-MLV RT Premix (AG11706, Accurate Biology). Quantitative real-time PCR was carried out on a QuantStudio 1 system (Thermo Fisher Scientific, Waltham, MA, USA) with SYBR Green master mix (AG11701, Accurate Biology). The thermal cycling protocol included an initial denaturation at 95 °C for 5 min, followed by 40 cycles of 95 °C for 10 s and 60 °C for 30 s. Gene expression was quantified using the 2
−ΔΔCt method, with
GAPDH serving as the internal reference control. All primer sequences are listed in
Table 2.
4.15. Cell Colony Formation Assay
To assess the clonogenic survival and proliferative capacity of single cells, a colony formation assay was performed. Briefly, Huh7 and HCCLM3 cells in the logarithmic growth phase were harvested by trypsinization to generate a single-cell suspension. After cell counting, the suspension was seeded at a low density (500 cells per dish) into 60 mm culture dishes containing complete medium and gently swirled to ensure uniform distribution. The cells were cultured at 37 °C under 5% CO2 for 14 days, with the medium replaced every 3 days. When visible colonies had formed, the culture medium was aspirated, and the cells were carefully rinsed twice with PBS. Colonies were fixed with 4% paraformaldehyde for 15 min and then stained with 0.1% crystal violet for 30 min. Excess stain was removed by gentle rinsing under running water. After air-drying, colonies were counted manually. All experiments were independently repeated three times. Statistical significance between groups was analyzed using Student’s t-test, with p < 0.05 considered statistically significant.
4.16. Wound Healing Assay
To assess cell migration, a wound healing assay was conducted. Cells were seeded into a 12-well plate and cultured until they formed a 100% confluent monolayer. A sterile 200 μL pipette tip was used to create a straight scratch through the cell layer, perpendicular to a reference line on the back of the plate. The detached cells were removed by gently washing three times with PBS, and the medium was replaced with a serum-free one. Images of the scratch were captured at 0 h and at specific time points thereafter (e.g., 24, 48 h) using an inverted microscope at the same location. The width of the scratch was measured using ImageJ software, and the cell migration rate was calculated by comparing the wound area at different time points (n = 3).
4.17. Transwell Migration and Invasion Assay
Huh7 and HCCLM3 cells (3 × 10⁴/well) in 100 μL serum-free DMEM were seeded into the upper compartments of 24-well transwell plates. For invasion assays, inserts were pre-coated with 50 μL 10% Matrigel (40183ES08, Yeasen, Shanghai, China). The lower compartment of the transwell chamber was filled with DMEM supplemented with 10% FBS to serve as a chemoattractant. Following a 24 h incubation period under standard conditions (37 °C, 5% CO2), the cells that had migrated or invaded to the underside of the membrane were fixed with 4% paraformaldehyde for 30 min and then stained with a 1% crystal violet solution for 20 min. The stained cells were finally visualized and quantified under a bright-field microscope. The number of cells in three random fields per membrane was counted using ImageJ software (v1.53).
4.18. Hematoxylin-Eosin (H&E) Staining and Immunohistochemistry (IHC)
Paraffin-embedded tumor tissues were sectioned into 5 μm slices for both H&E and IHC staining. Following deparaffinization and rehydration, H&E staining was performed to evaluate general histology.
For IHC, tissue sections were subjected to heat-induced antigen retrieval in citrate buffer (pH 6.0). After blocking endogenous peroxidases and non-specific sites, the sections were incubated overnight at 4 °C with an anti-Ki-67 antibody (1:500; A20018, Abclonal, Wuhan, China). This was followed by signal development with a secondary antibody and DAB substrate, with expression levels being quantified microscopically.
4.19. Western-Blot Analysis
Proteins were isolated from Huh7 cells using RIPA lysis buffer containing phosphatase inhibitors, and protein concentrations were quantified with a BCA assay kit (P0012, Beyotime, Shanghai, China). Equal amounts of protein (20 µg per lane) were separated by SDS-PAGE on 12% gels at 120 V for 60 min and subsequently transferred to a PVDF membrane at 300 mA for 120 min. The membrane was blocked with 5% non-fat milk in TBST for 1 h at room temperature, followed by incubation with primary antibodies against MTM1 (1:1000, #13924-1-AP, Proteintech, Wuhan, China) and GAPDH (1:1000, #60004-1-Ig, Proteintech, Wuhan, China) overnight at 4 °C. After washing, the membrane was incubated with an HRP-conjugated secondary antibody (1:10000, #SA00001-2, Proteintech, Wuhan, China) for 1 h at room temperature. Protein bands were visualized using an enhanced chemiluminescence (ECL) detection system (Thermo Fisher, Waltham, MA, USA), and band intensities were analyzed using Image Lab software (version 6.1).
4.20. Statistical Analysis
All statistical analyses were performed using R software (version 4.1.2) or GraphPad Prism (Version 9.0.0), with a two-sided p-value < 0.05 considered statistically significant. Specific statistical methods applied in this study are detailed as follows:
4.20.1. Differential Expression and Clinical Feature Analysis
The Mann–Whitney U test was used to compare lncRNA and gene expression levels between unpaired HCC and normal liver tissues from the TCGA-LIHC cohort. The paired t-test was applied for comparisons of gene expression in our in-house cohort of matched tumor and adjacent normal tissues (n = 16). The chi-square test was employed to analyze the associations between the TRL risk signature and categorical clinicopathological variables (e.g., gender, tumor grade, stage).
4.20.2. Group Comparisons in Functional Experiments
For comparisons between two groups of continuous data (e.g., CCK-8 assays, transwell cell counts, tumor volume/weight in vivo, ROS fluorescence intensity, qRT-PCR, and Western blot quantification), the unpaired two-tailed Student’s t-test was used. For comparisons among three or more groups (e.g., dose–response curves to MSB, rescue experiments with cell death inhibitors), one-way analysis of variance (ANOVA) followed by an appropriate post hoc test (e.g., Tukey’s test) was applied. Data are presented as mean ± standard deviation (SD) from at least three independent experiments.
