

Neurogenesis-Associated Protein, a Potential Prognostic Biomarker in Anti-PD-1 Based Kidney Renal Clear Cell Carcinoma Patient Therapeutics
Abstract
1. Introduction
2. Results
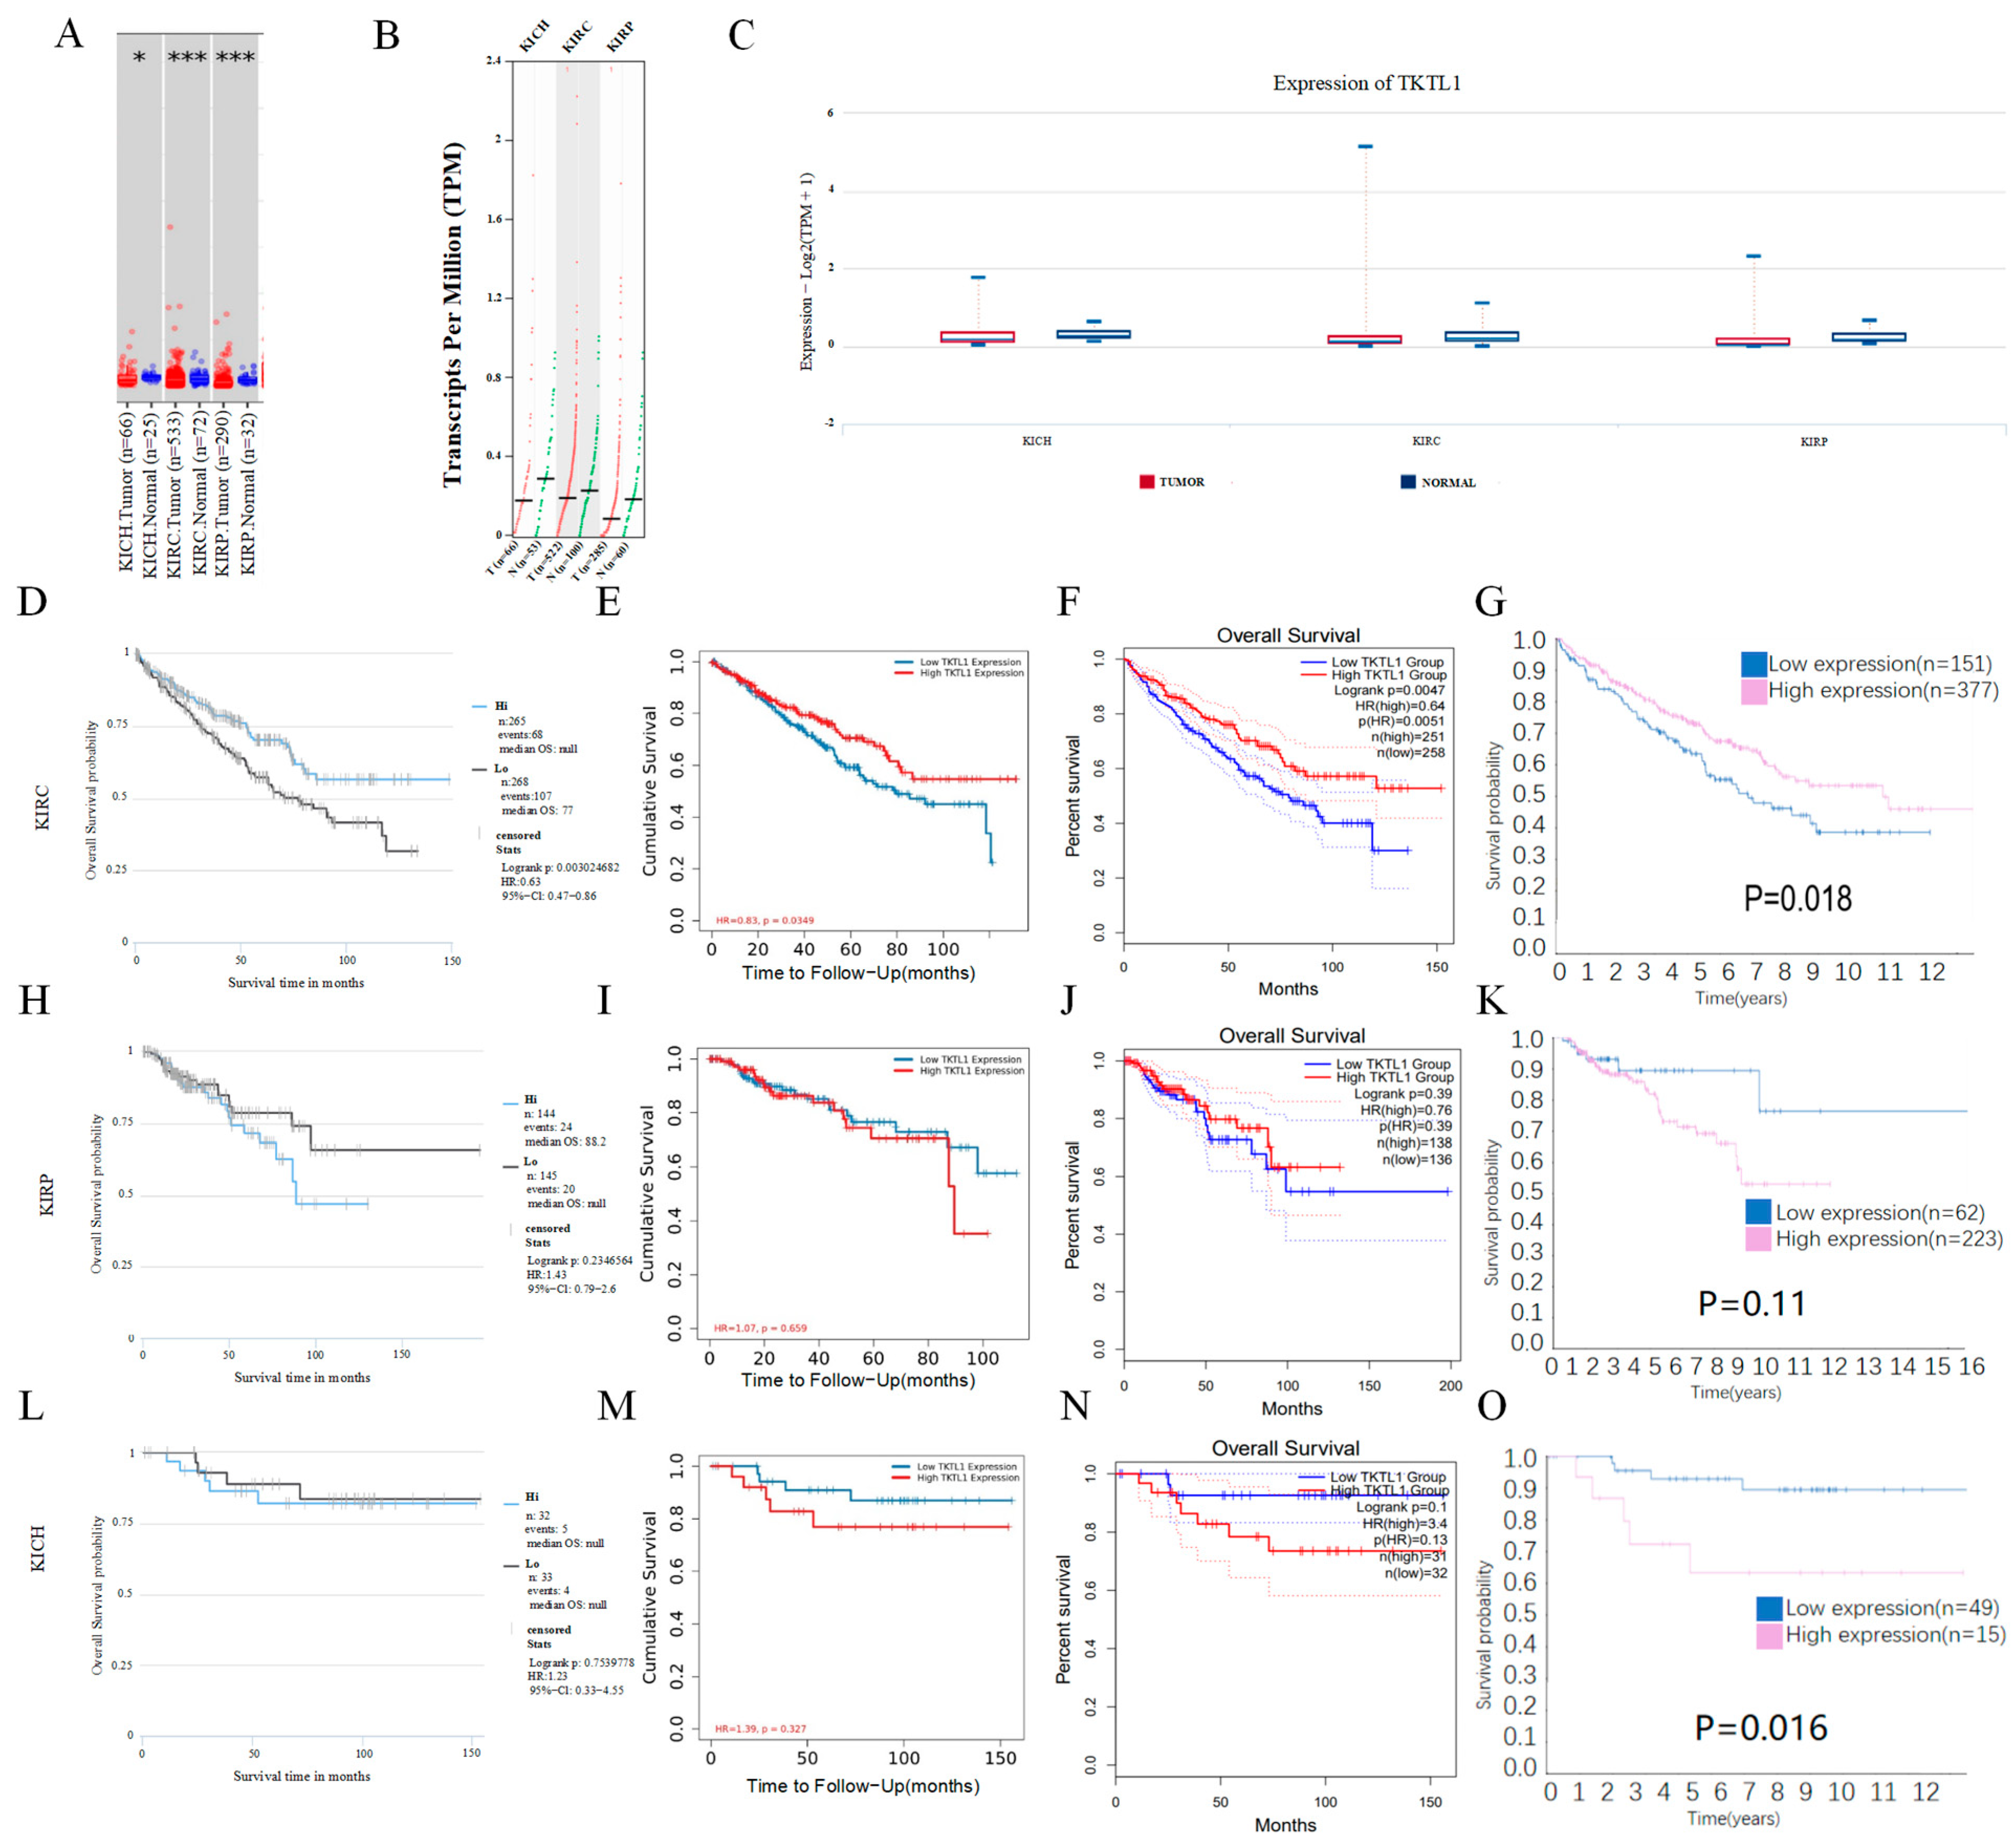
2.1. TKTL1 mRNA Expression and the Prognosis Analysis
2.2. TKTL1 Expression Levels Have an Impact on Various Clinical Features of Kidney Cancer
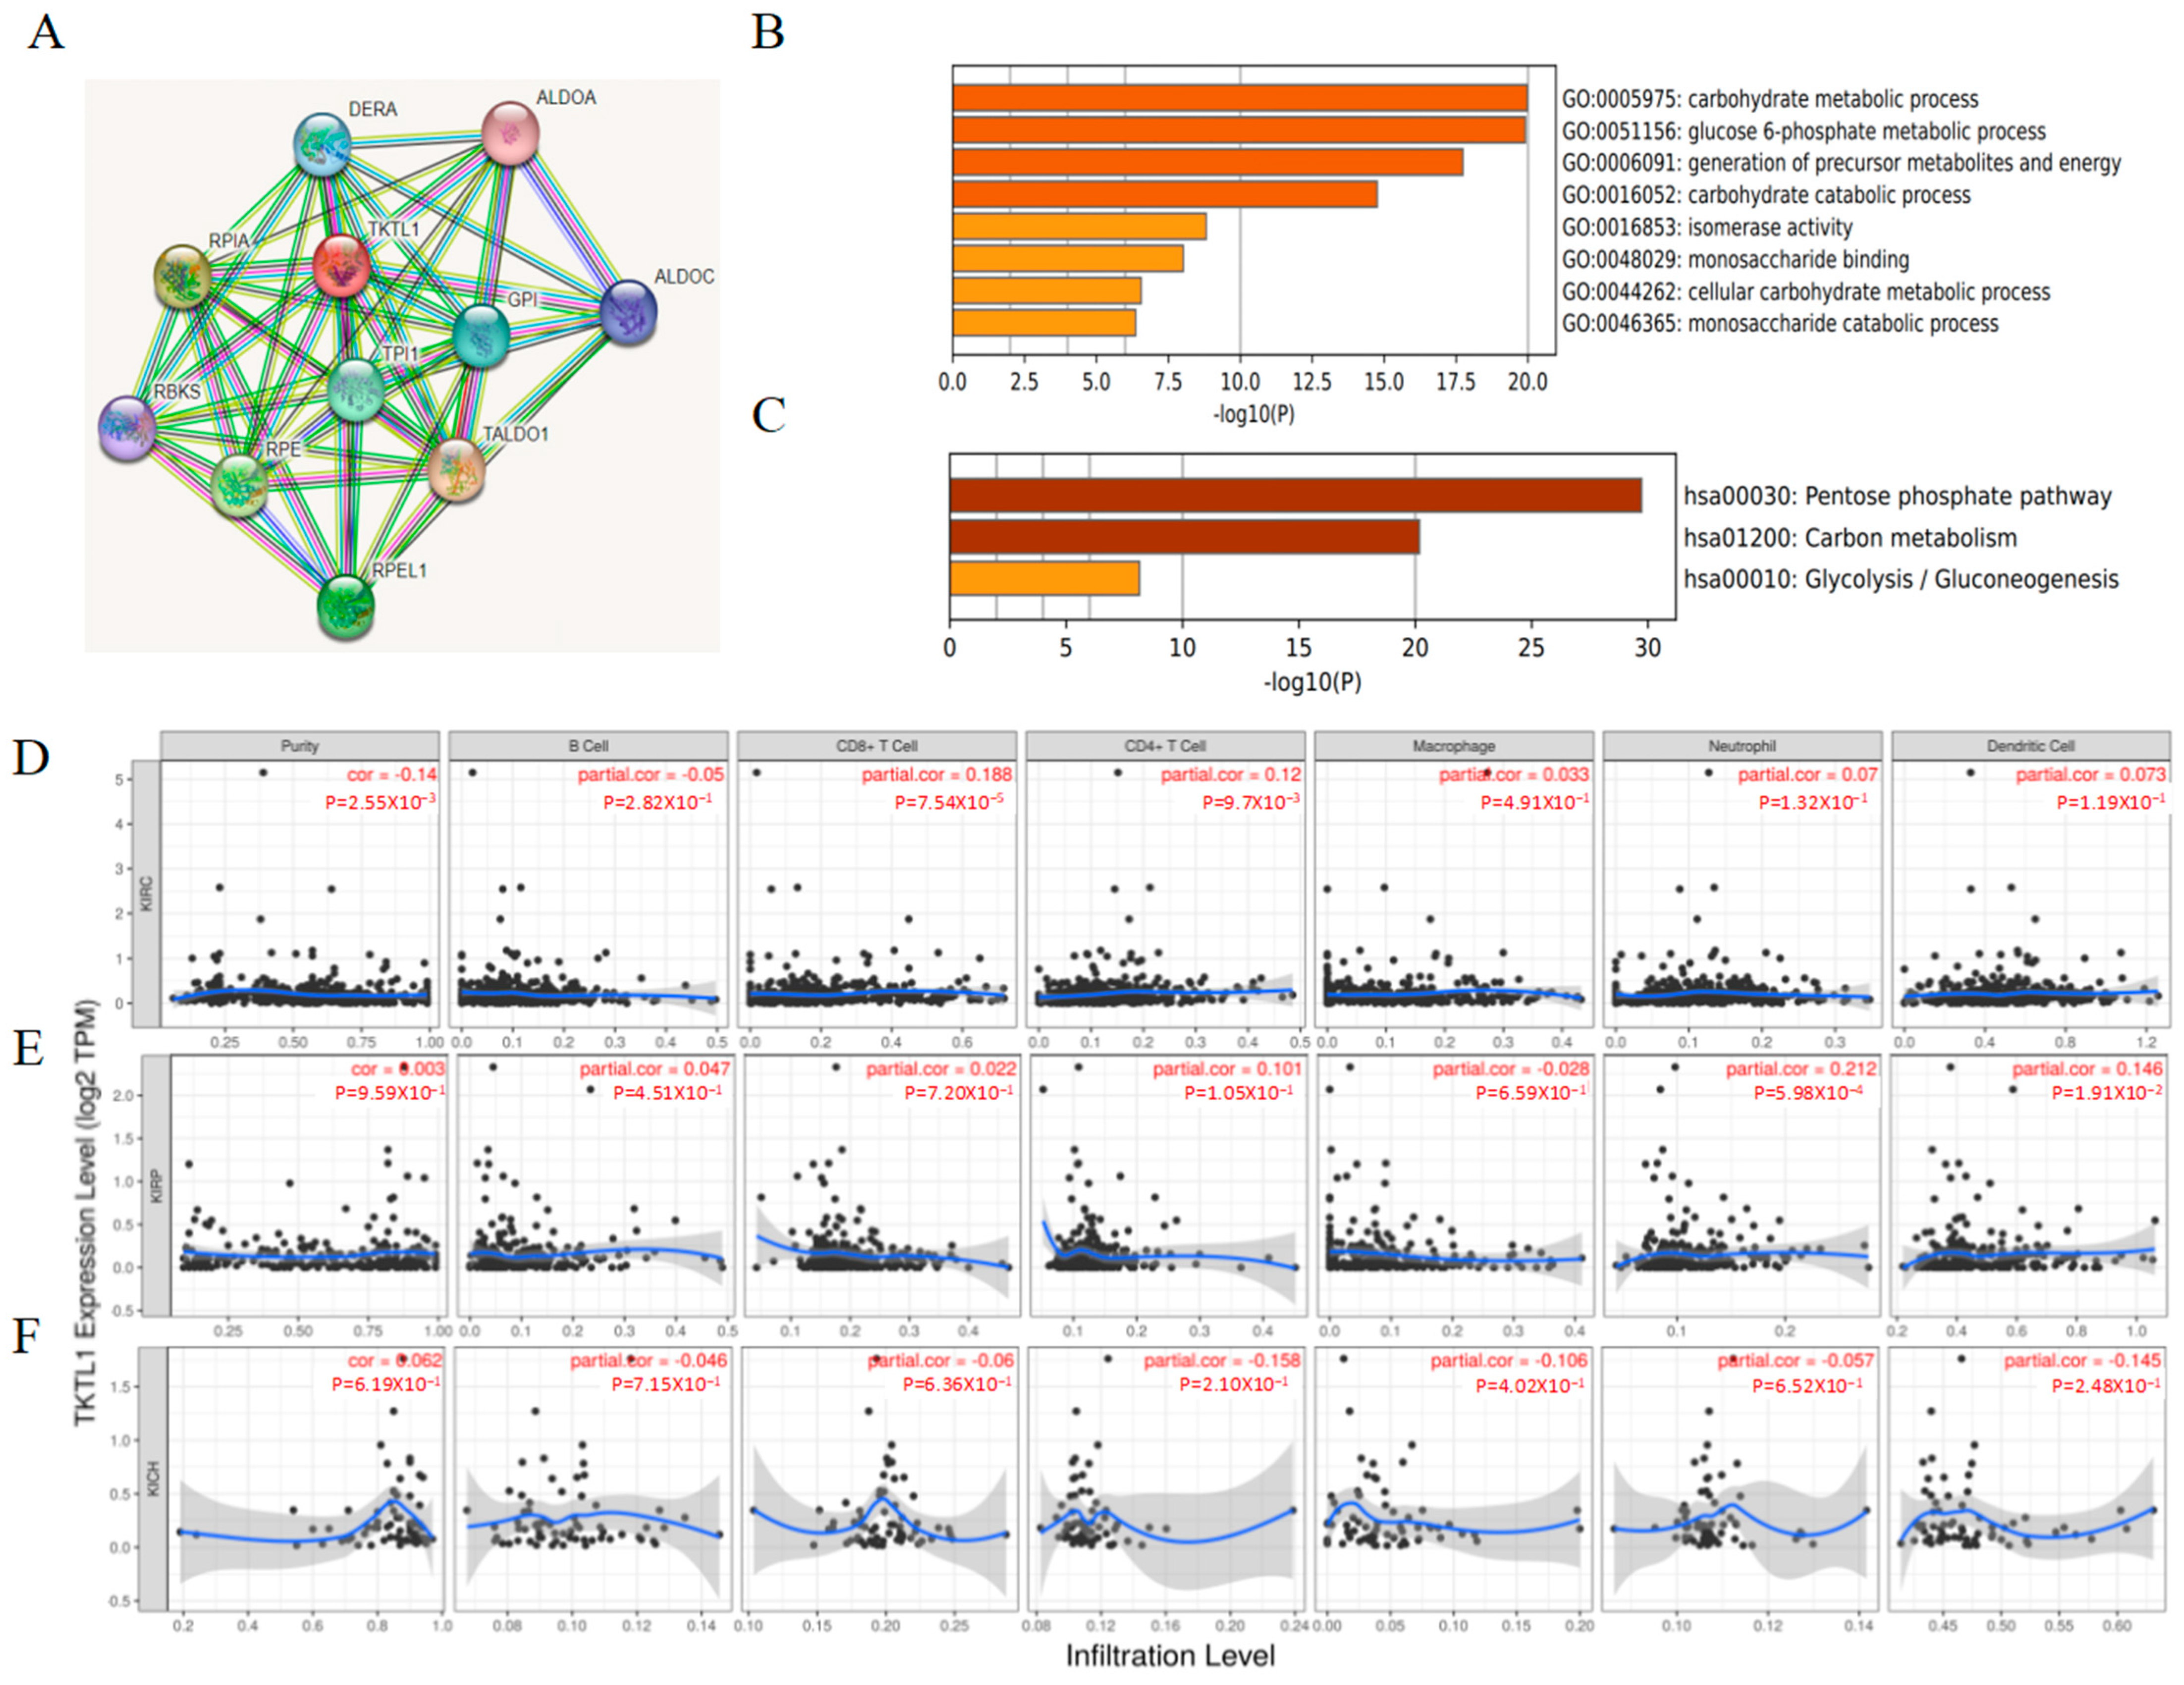
2.3. Functional Enrichment Analyses of TKTL1
2.4. The Immune Infiltration Level in Renal Cancers Is Associated with the Expression Level of TKTL1
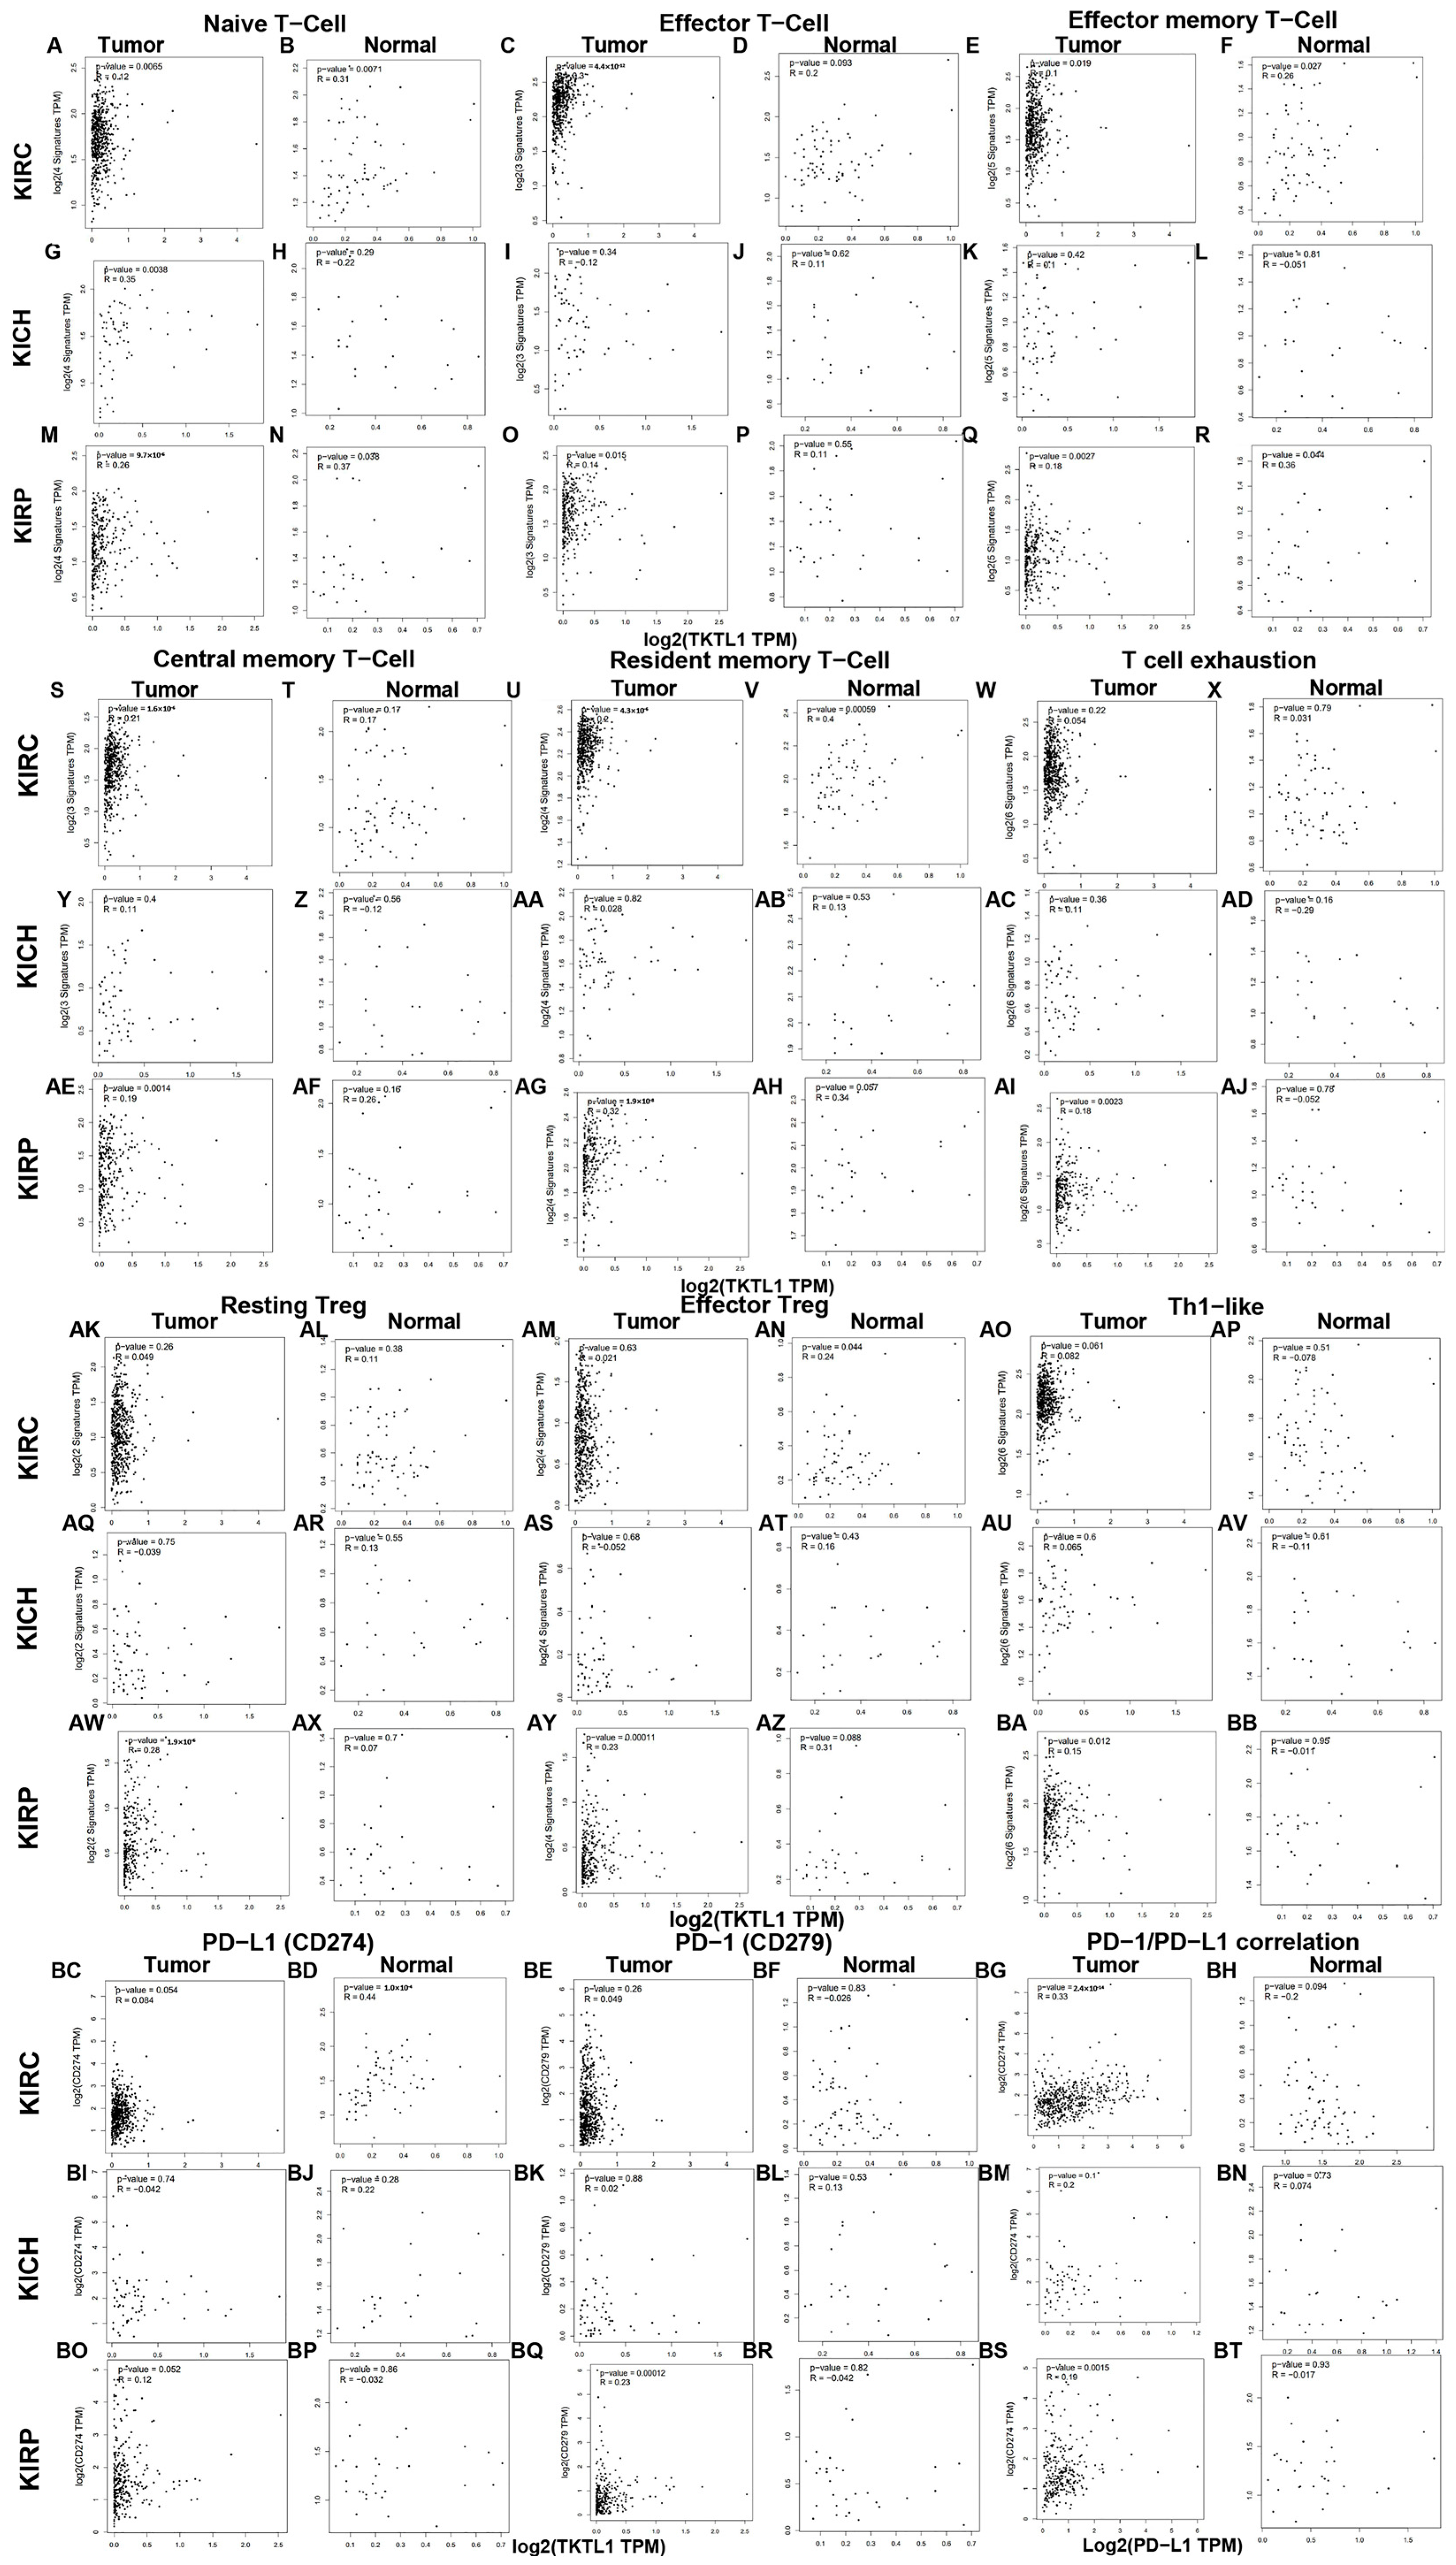
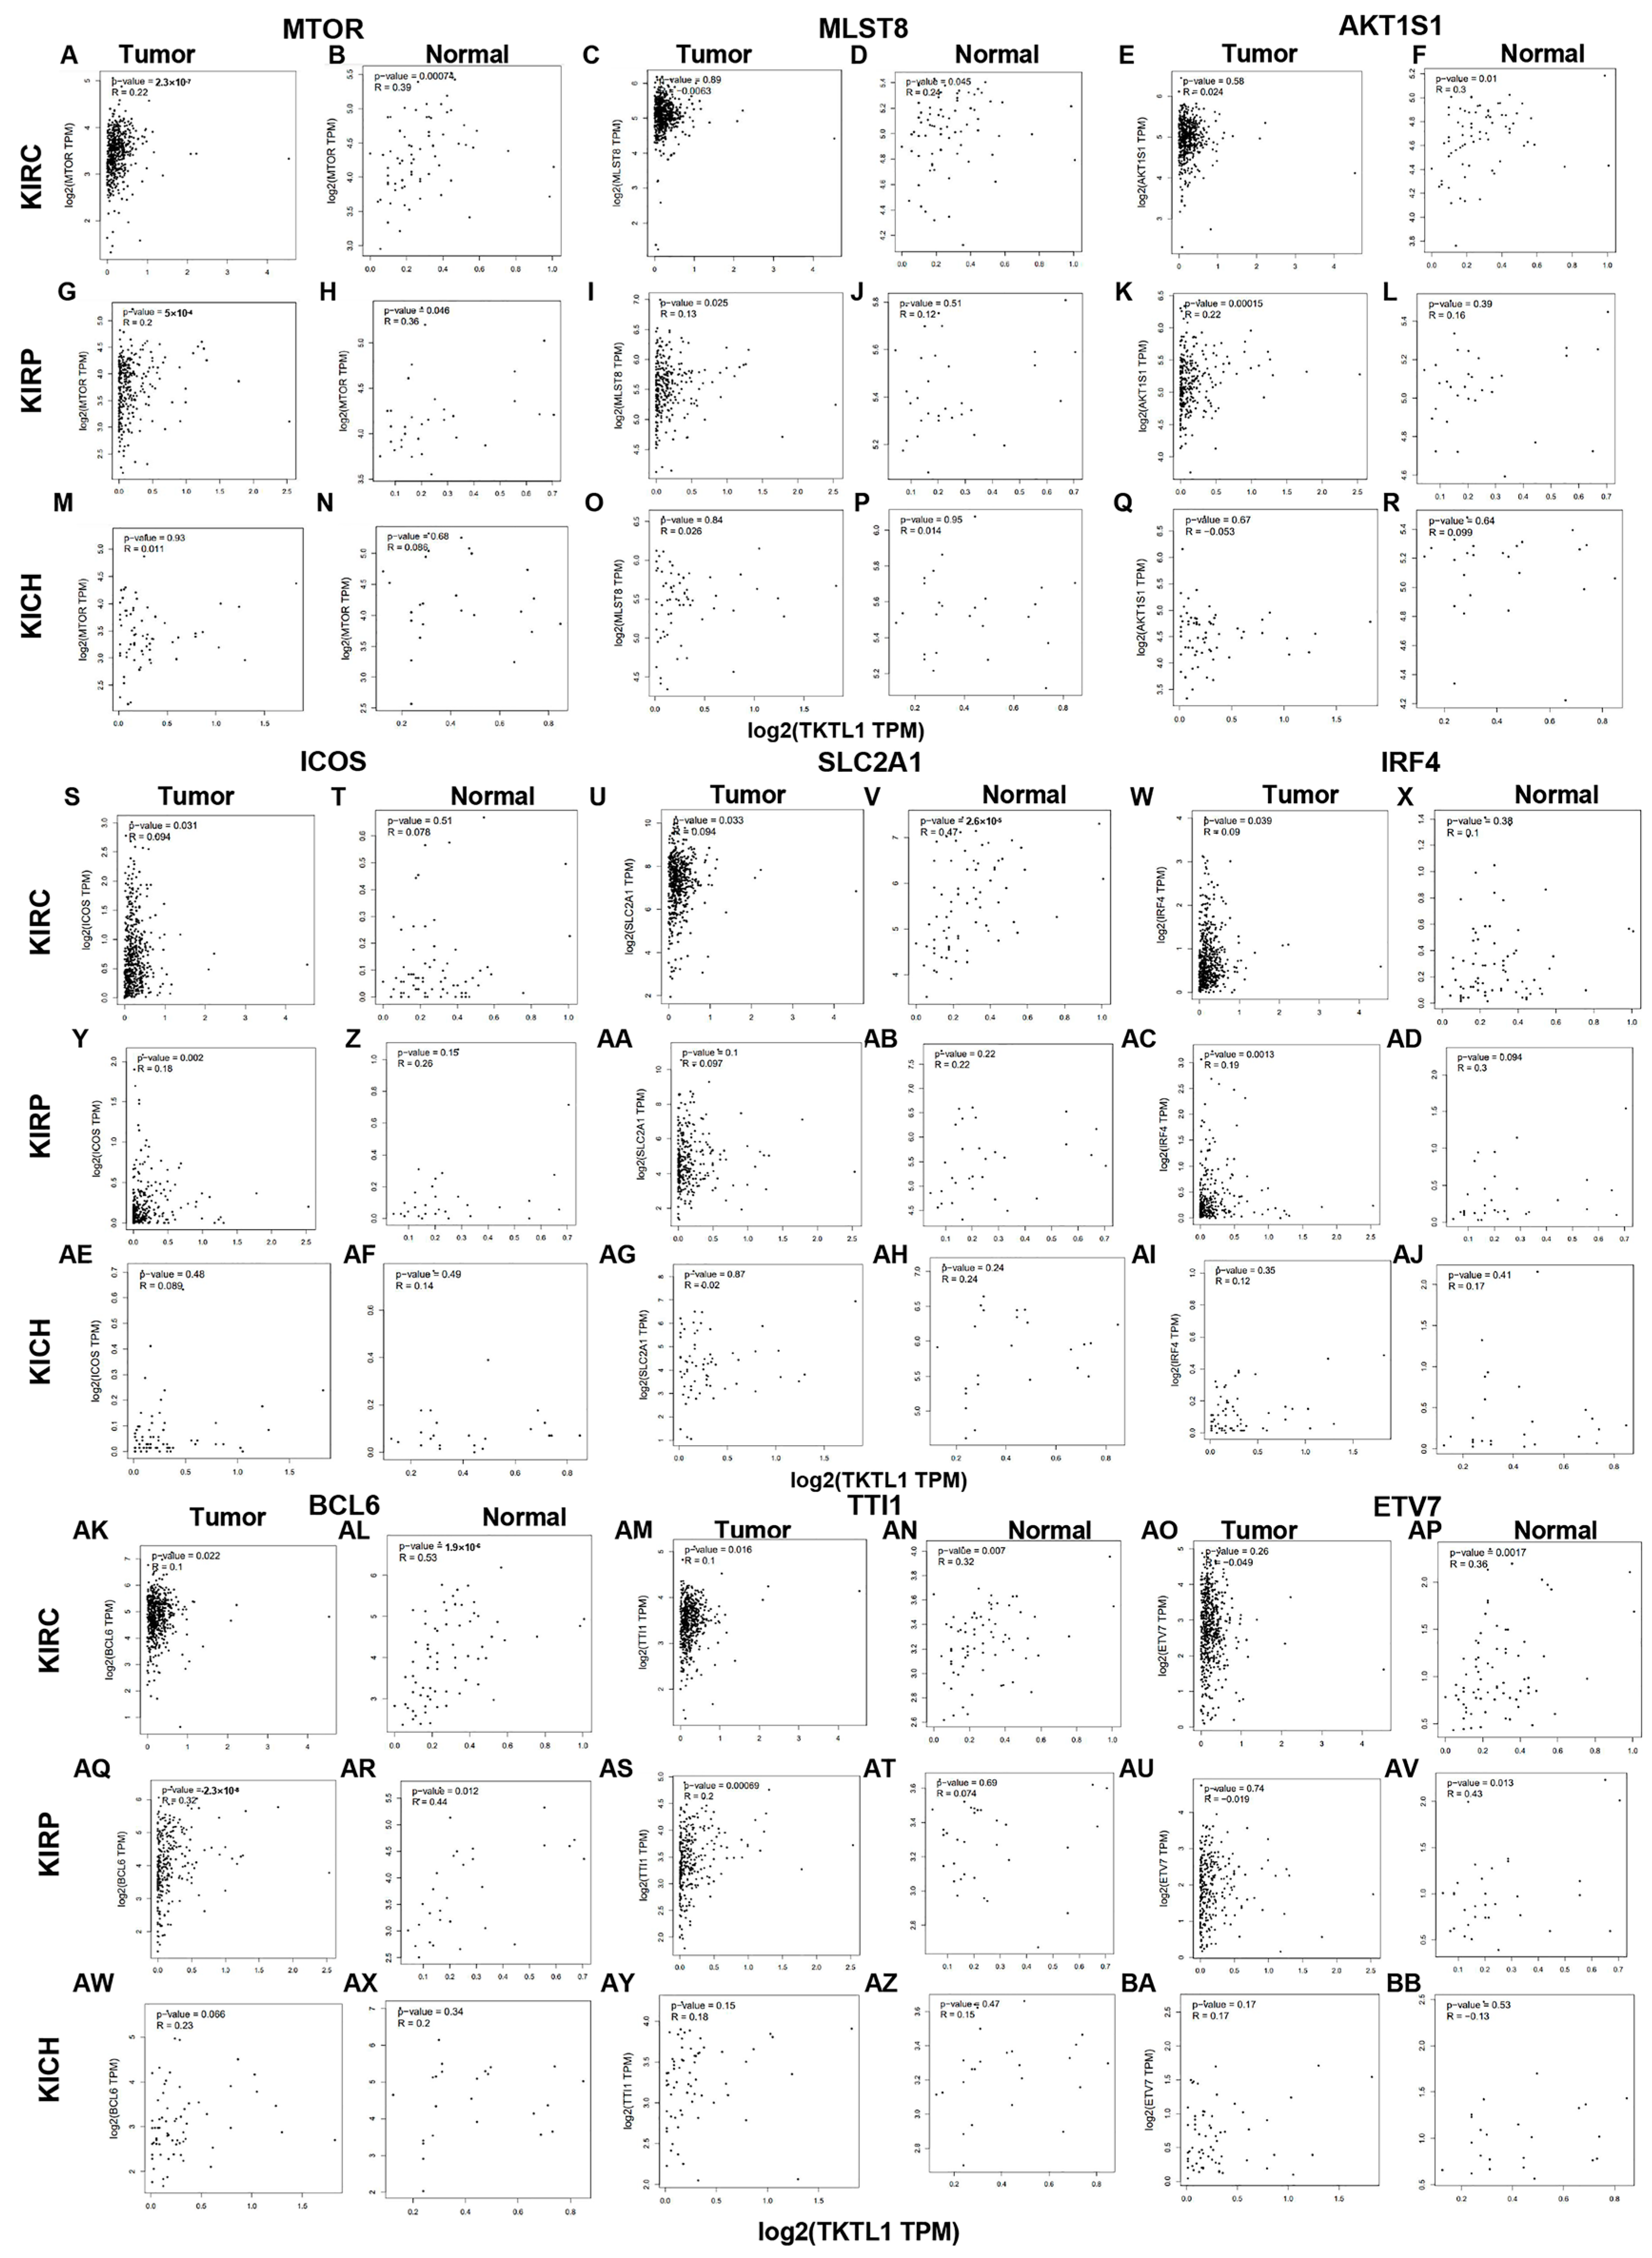
2.5. TKTL1 Is Involved in T Cell Energy Metabolism in KIRC and KIRP
2.6. KIRC Patients Exhibit Distinct Correlation Patterns between Tumor and Normal Tissue
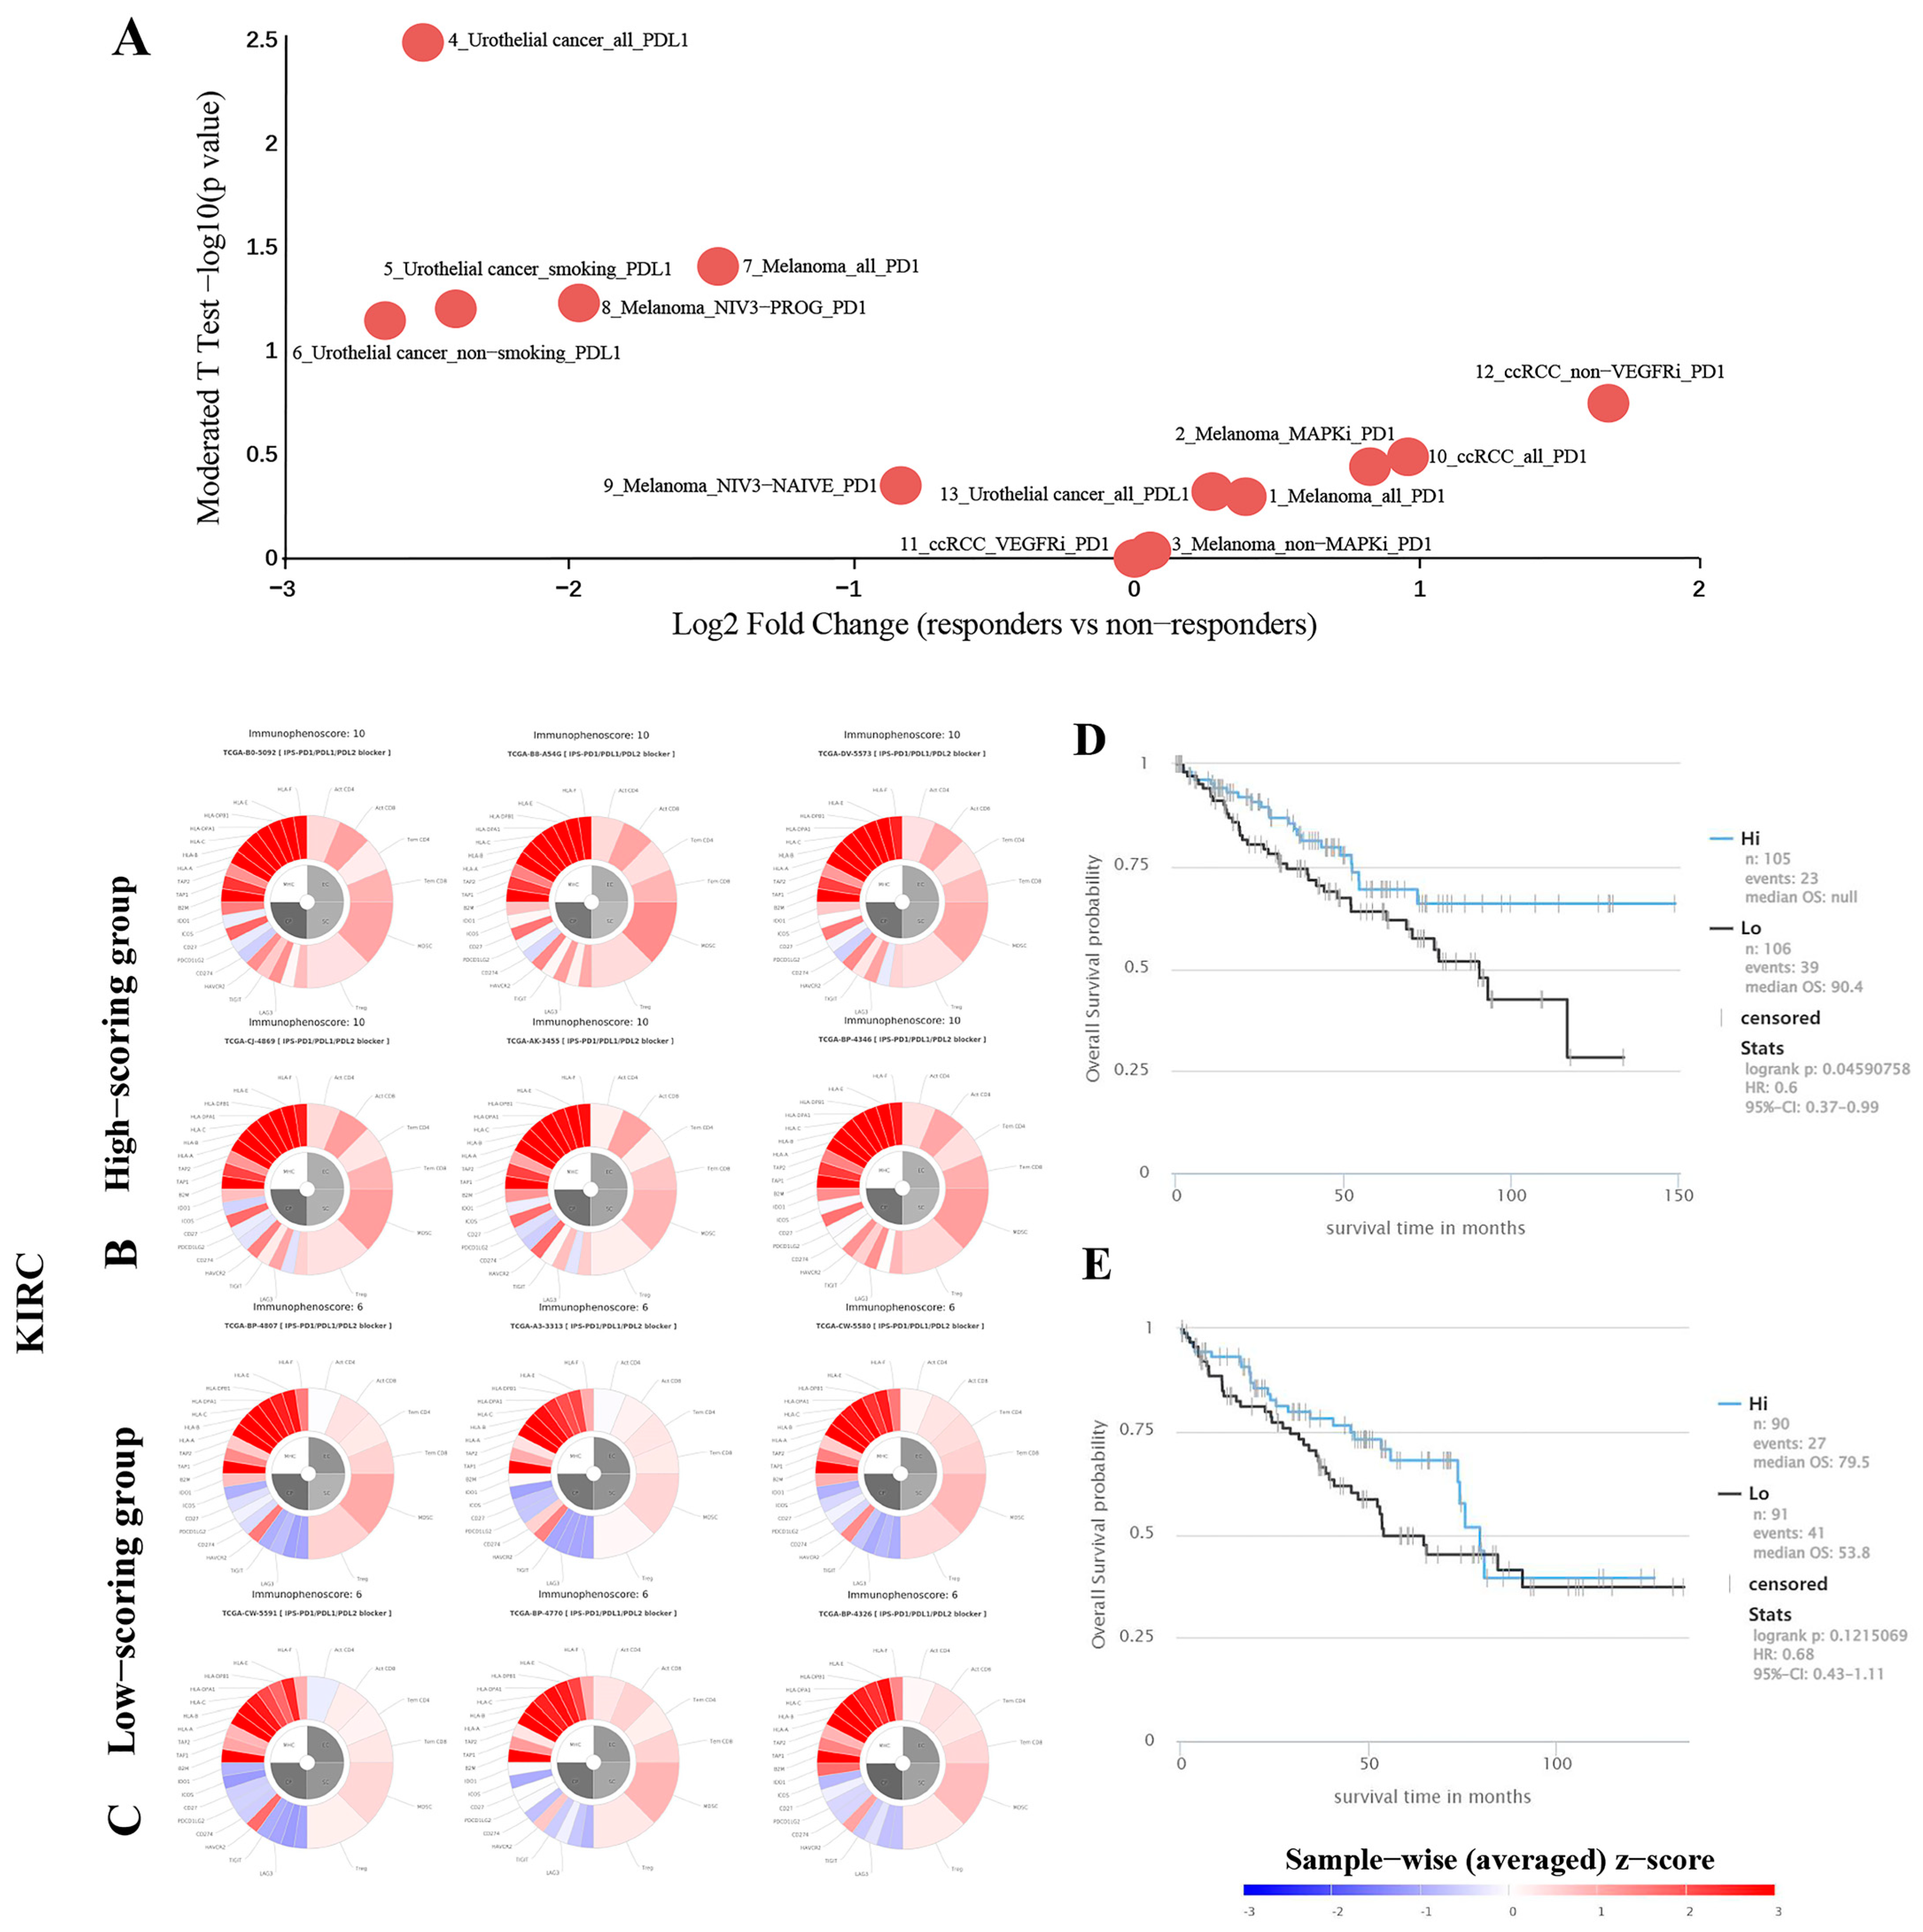
2.7. Predicting the Correlation between TKTL1 Expression and the Effectiveness of PD-1 Blockade Immunotherapy in Individuals Diagnosed with Kidney Cancer
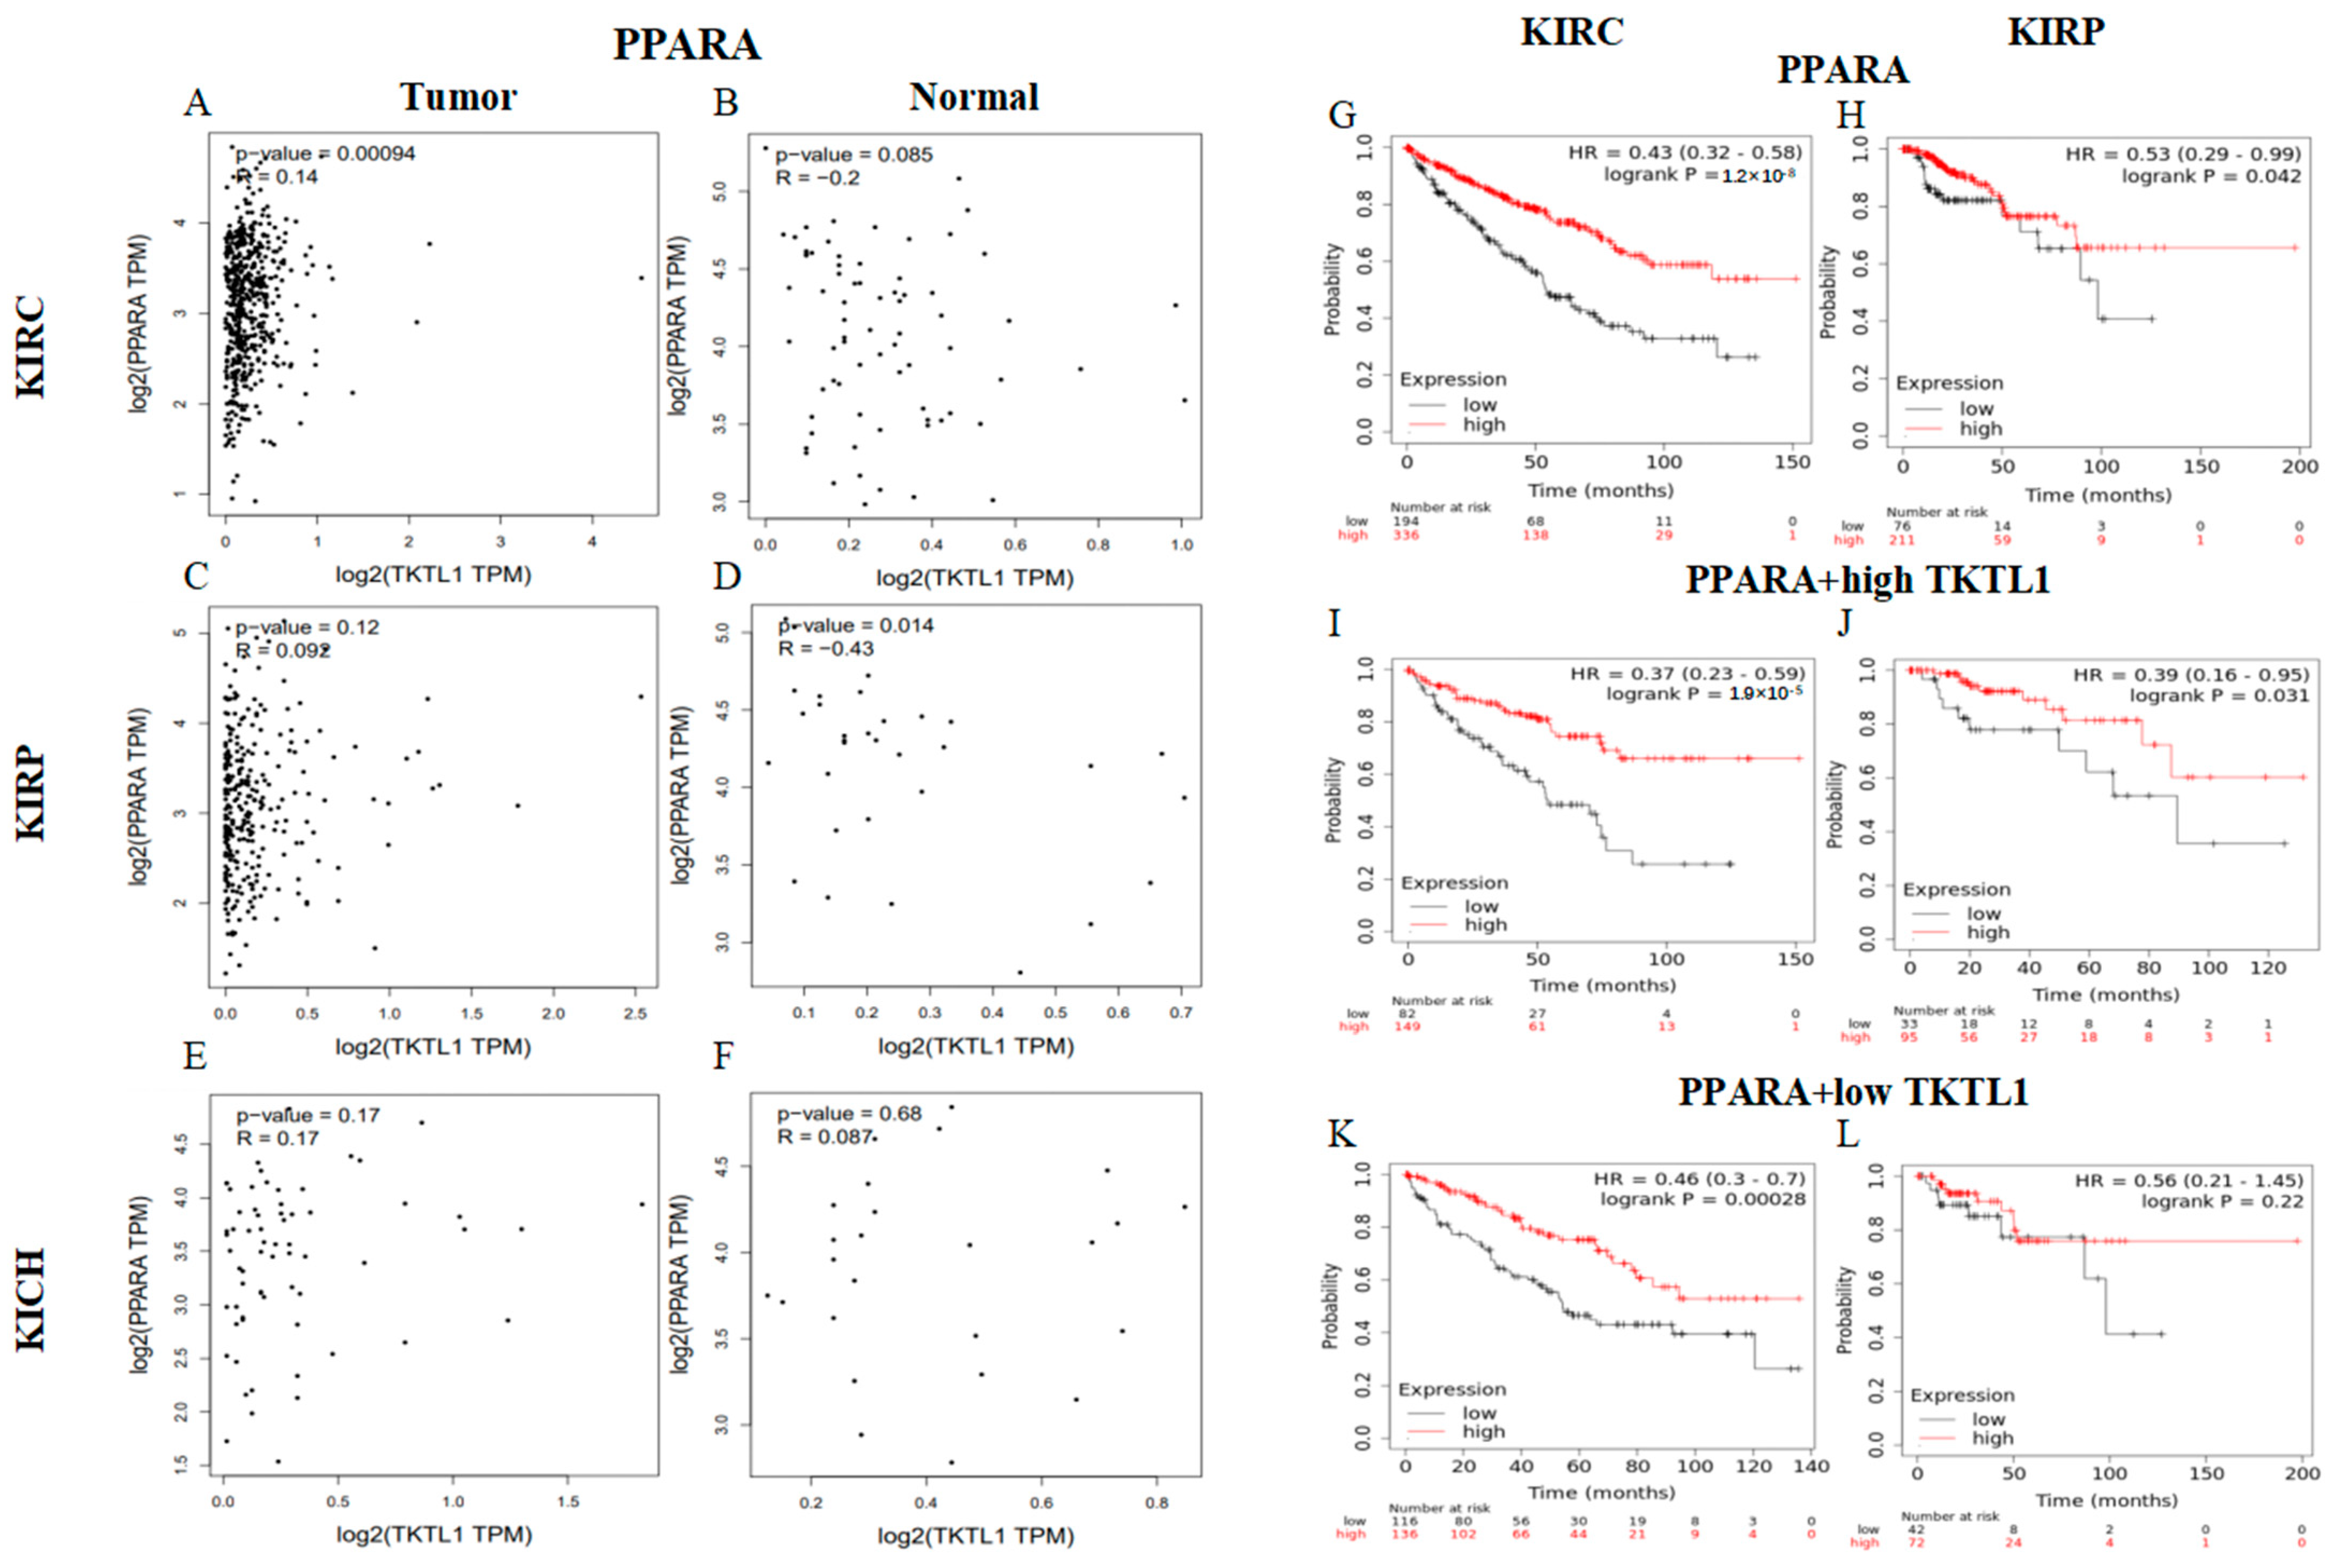
2.8. TKTL1 Augments the Benefits of PPARA in KIRC
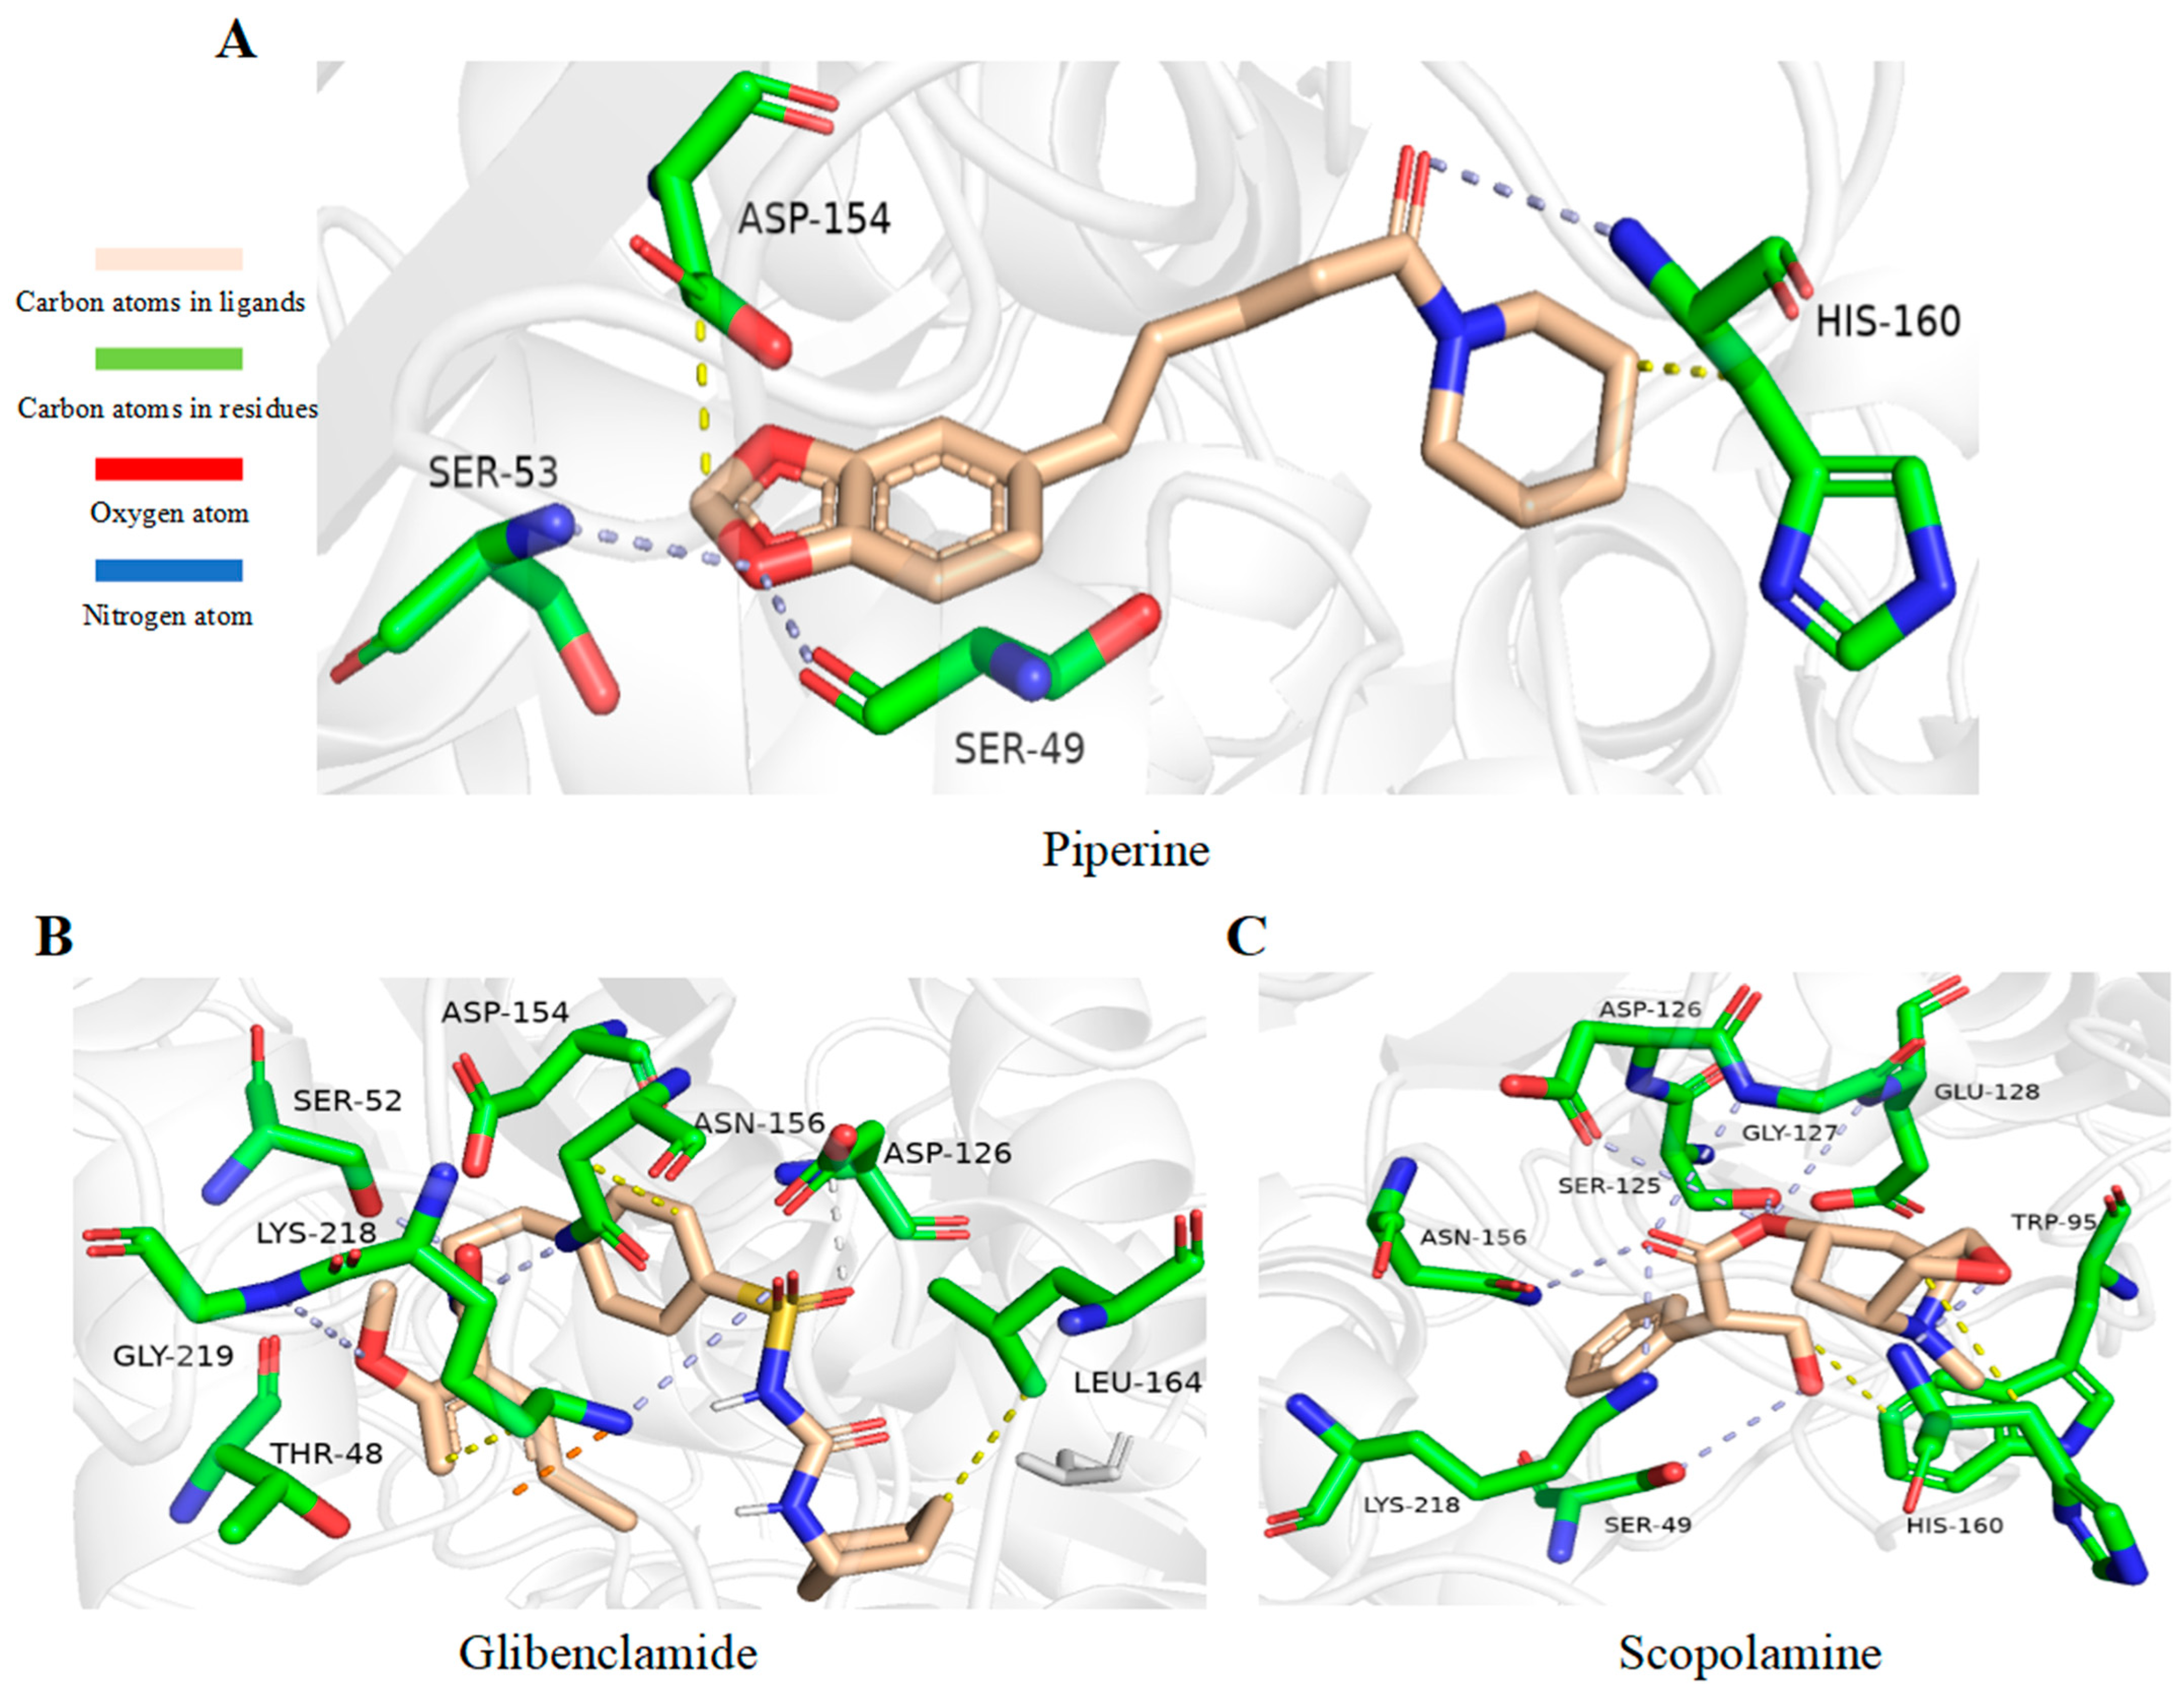
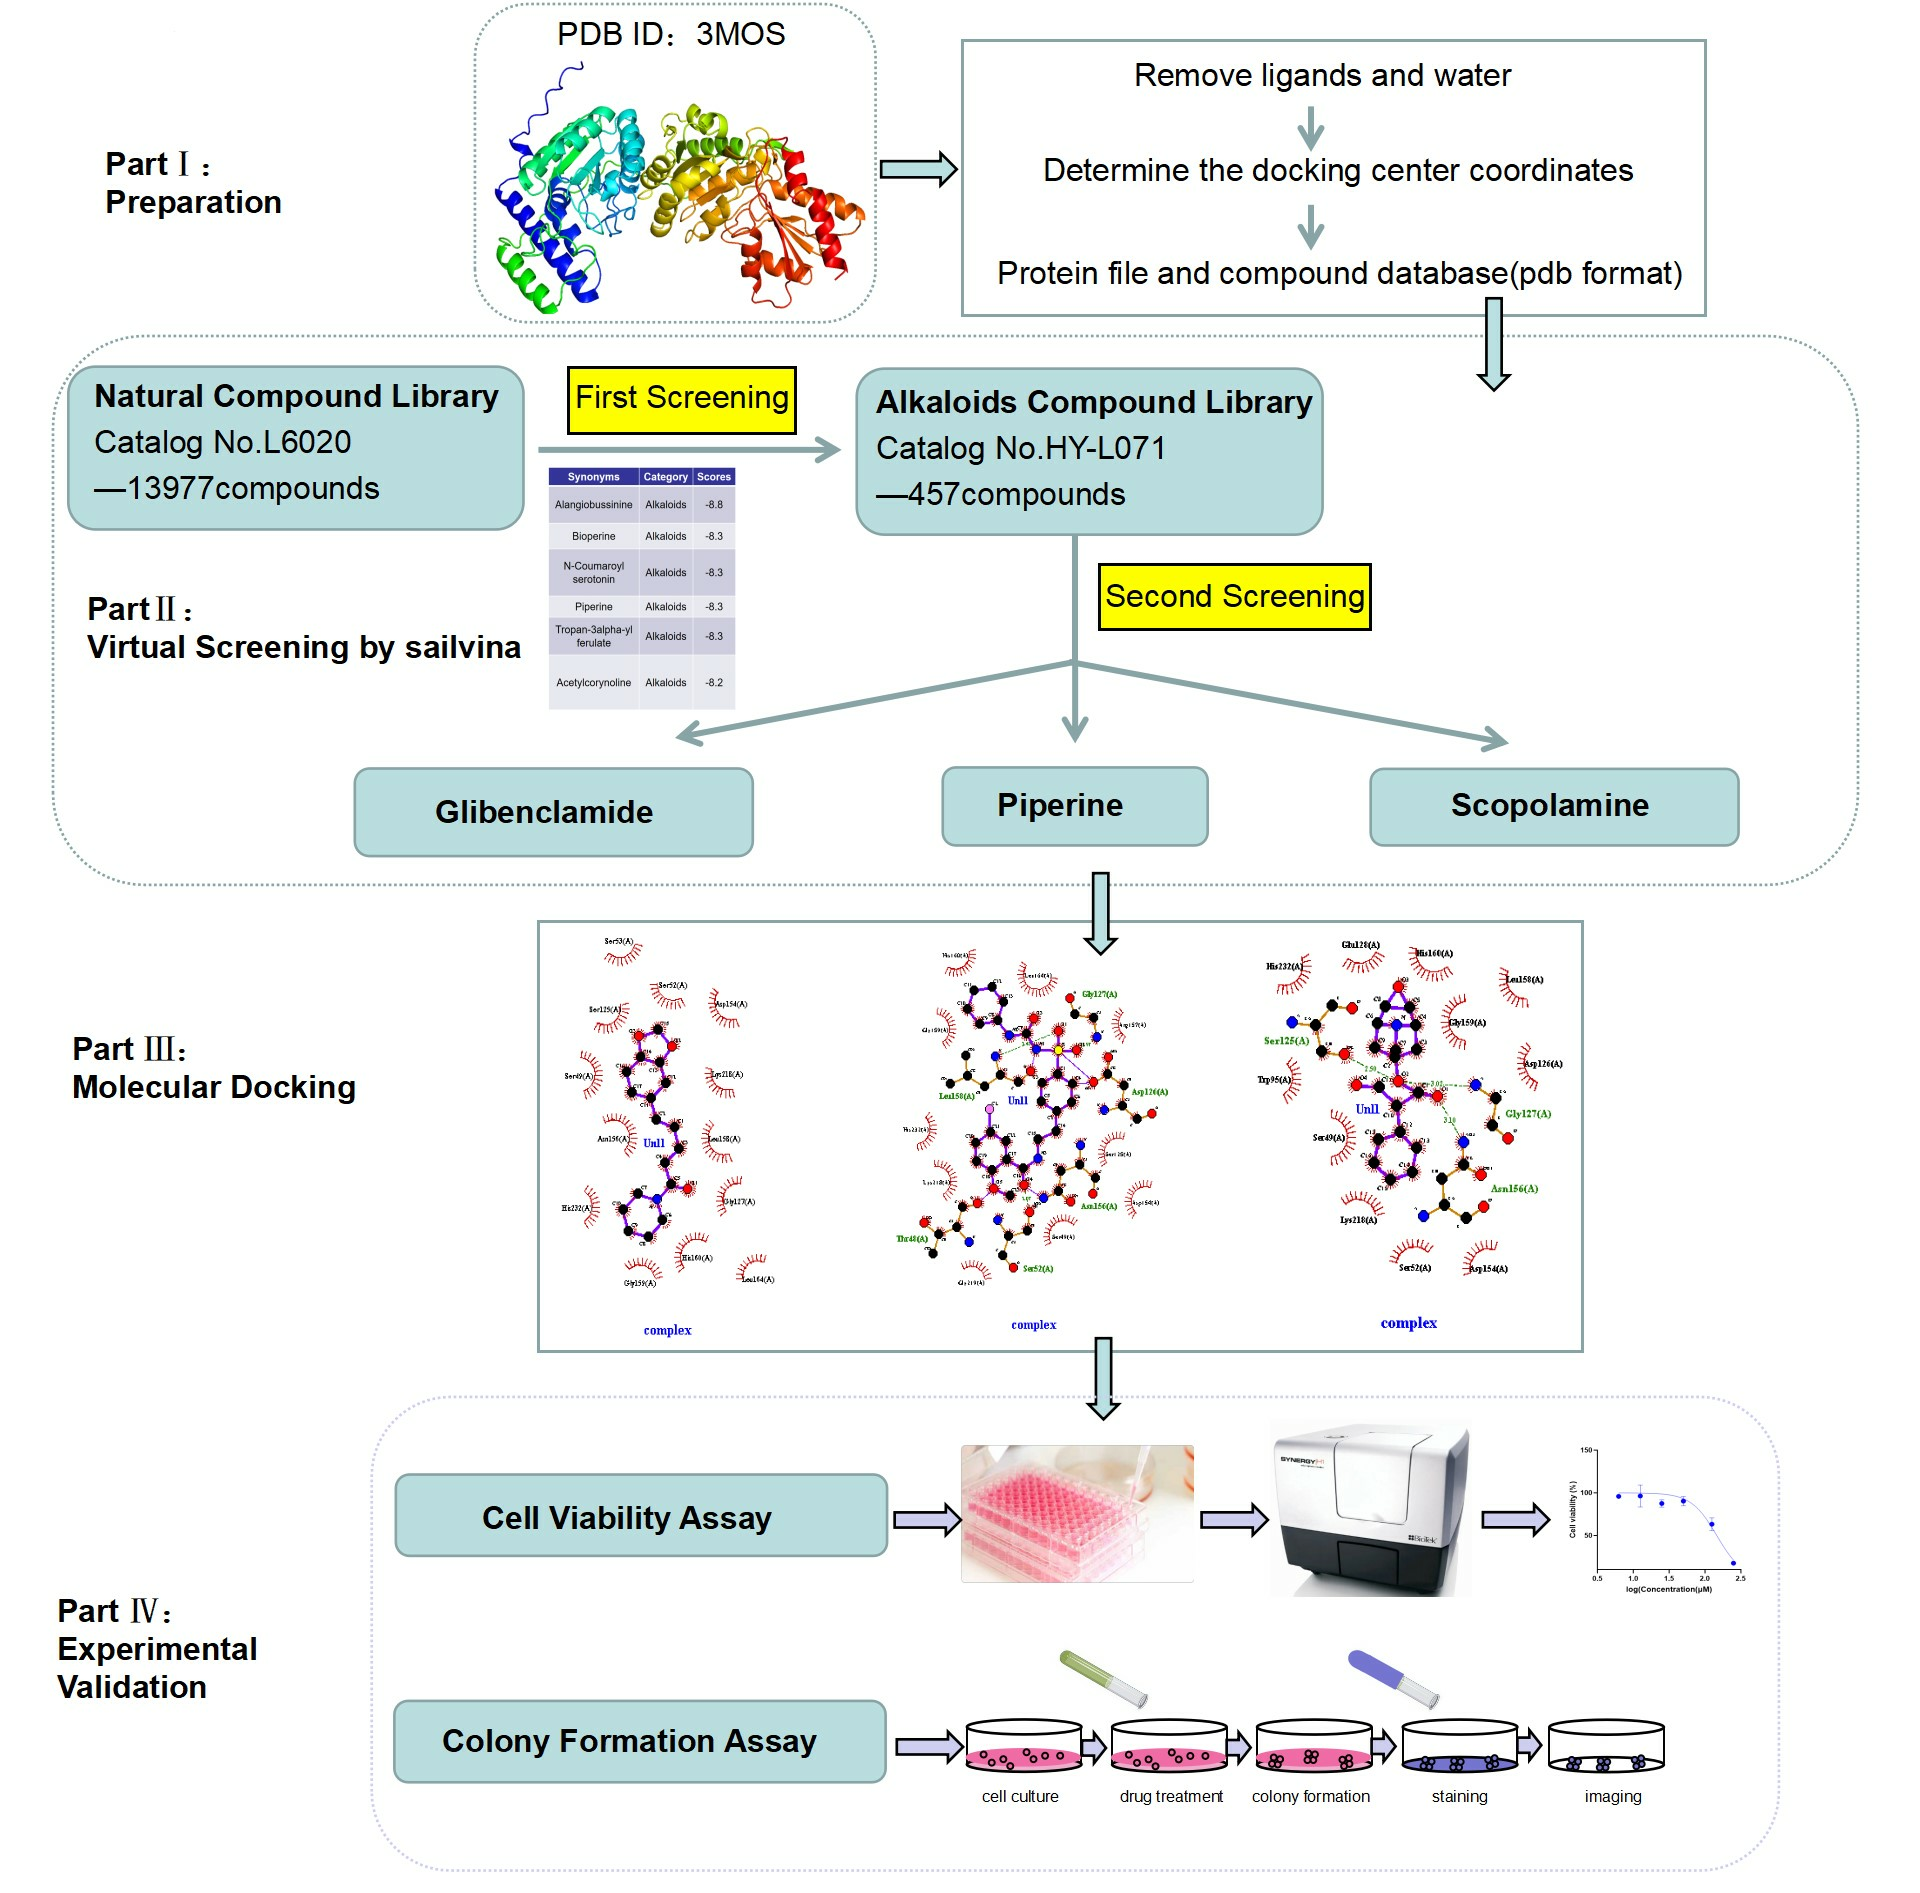
2.9. Alkaloids Demonstrate Effective Docking Effect with TKTL1
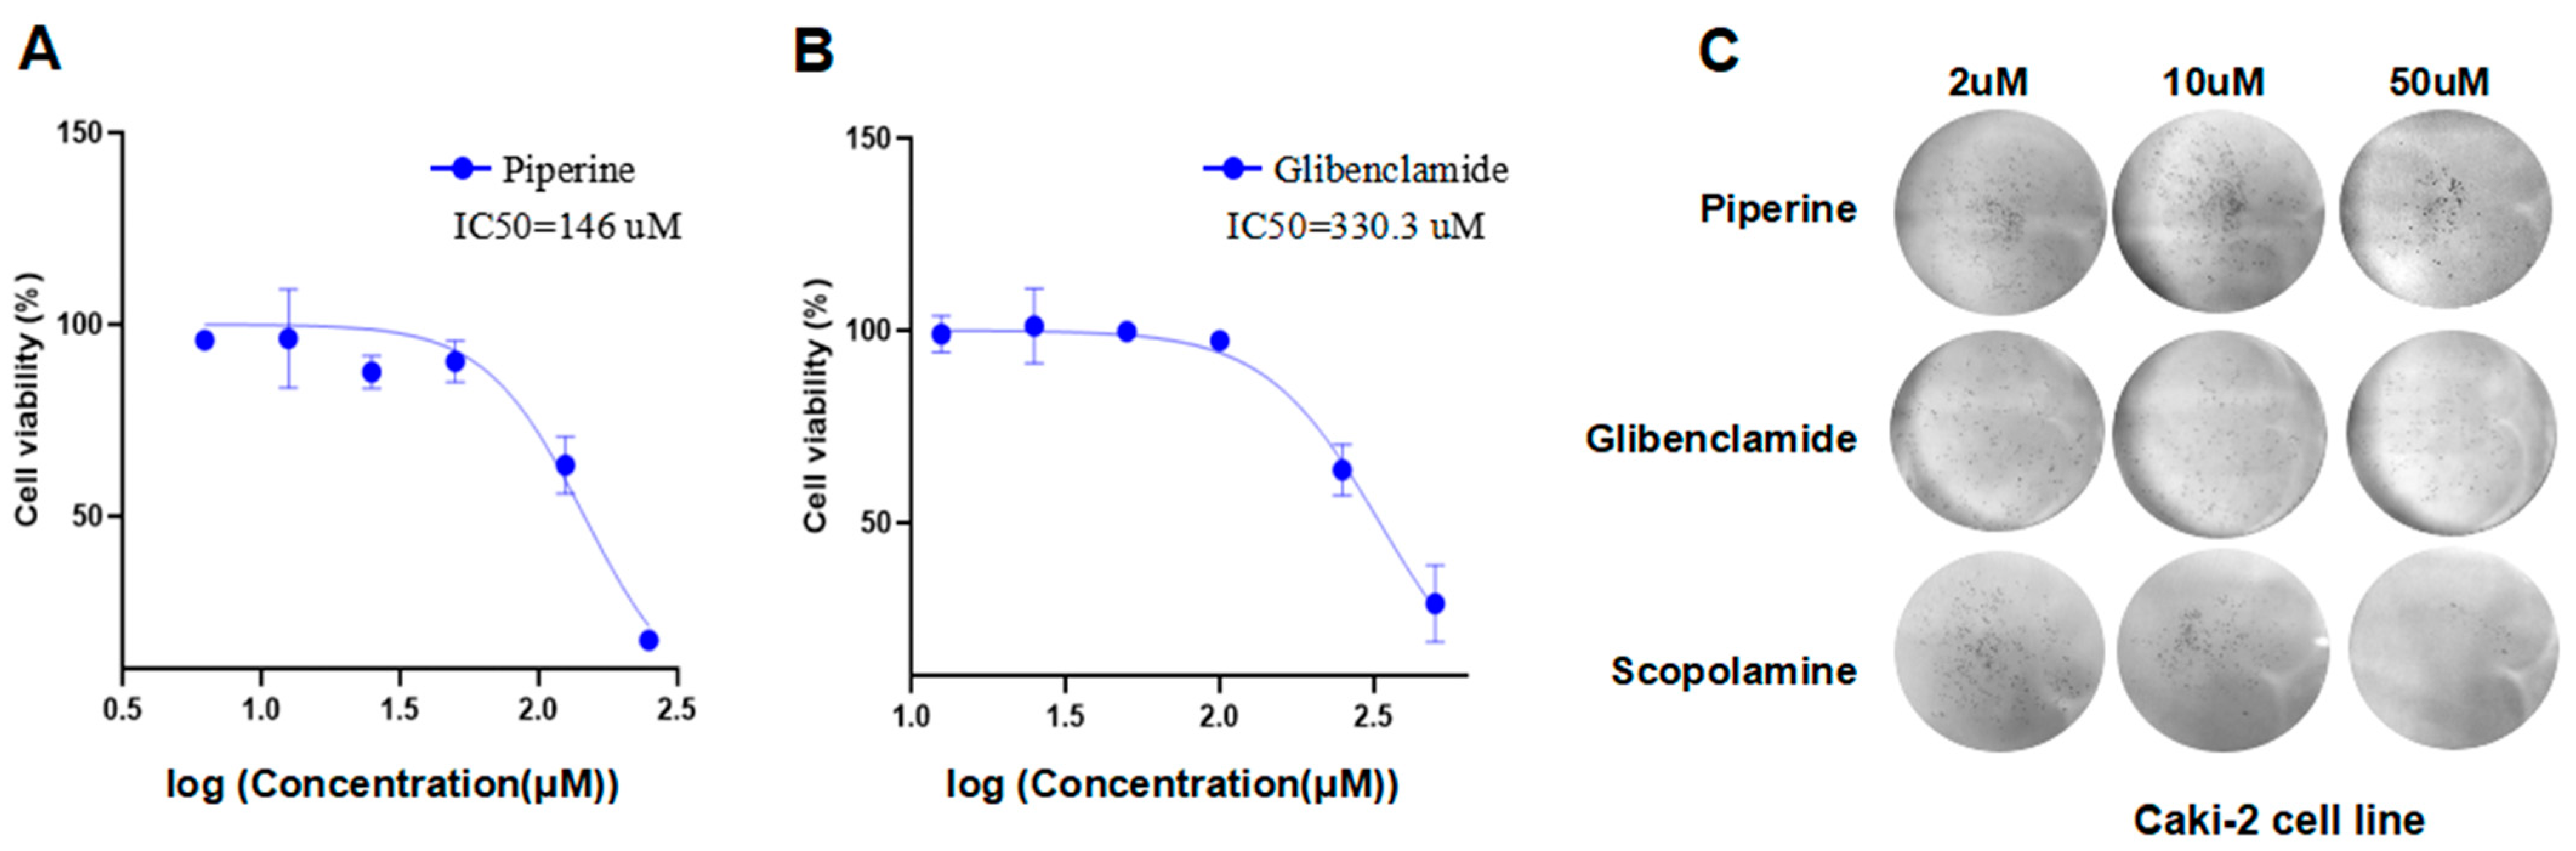
2.10. Glibenclamide and Piperine can Effectively Agonize the Activity of TKTL1
3. Discussion
4. Materials and Methods
4.1. Different mRNA Expression in Various Cancer Types and the Prognosis Analysis
4.2. Enrichment Analysis
4.3. Immune Infiltrates Level and Gene Correlation Analysis
4.4. TISIDB Database Analysis
4.5. Immunophenotyping of Renal Cancer Patients
4.6. PPARA Gene Correlation Analysis and Prognosis Analysis
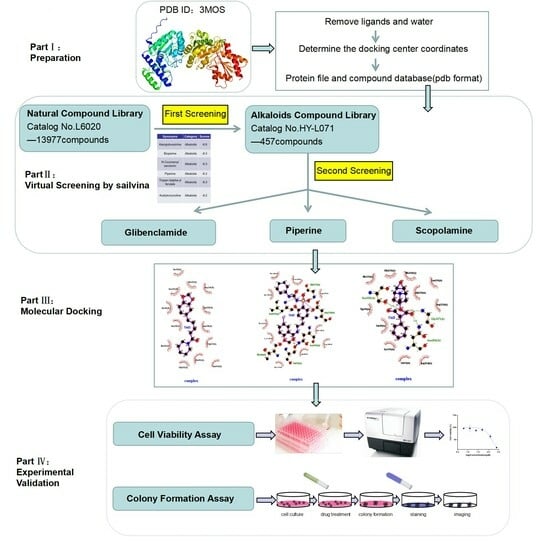
4.7. Virtual Screening Study
4.8. Cell Viability Assay
4.9. Colony Formation Assay
5. Conclusions
Supplementary Materials
Author Contributions
Funding
Institutional Review Board Statement
Informed Consent Statement
Data Availability Statement
Conflicts of Interest
References
- Ljungberg, B.; Bensalah, K.; Canfield, S.; Dabestani, S.; Hofmann, F.; Hora, M.; Kuczyk, M.A.; Lam, T.; Marconi, L.; Merseburger, A.S.; et al. EAU guidelines on renal cell carcinoma: 2014 update. Eur. Urol. 2015, 67, 913–924. [Google Scholar] [CrossRef] [PubMed]
- Hsieh, J.J.; Purdue, M.P.; Signoretti, S.; Swanton, C.; Albiges, L.; Schmidinger, M.; Heng, D.Y.; Larkin, J.; Ficarra, V. Renal cell carcinoma. Nat. Rev. Dis. Primers 2017, 3, 17009. [Google Scholar] [CrossRef] [PubMed]
- Srigley, J.R.; Delahunt, B.; Eble, J.N.; Egevad, L.; Epstein, J.I.; Grignon, D.; Hes, O.; Moch, H.; Montironi, R.; Tickoo, S.K.; et al. The International Society of Urological Pathology (ISUP) Vancouver Classification of Renal Neoplasia. Am. J. Surg. Pathol. 2013, 37, 1469–1489. [Google Scholar] [CrossRef] [PubMed]
- Shuch, B.; Amin, A.; Armstrong, A.J.; Eble, J.N.; Ficarra, V.; Lopez-Beltran, A.; Martignoni, G.; Rini, B.I.; Kutikov, A. Understanding pathologic variants of renal cell carcinoma: Distilling therapeutic opportunities from biologic complexity. Eur Urol. 2015, 67, 85–97. [Google Scholar] [CrossRef]
- Cohen, H.T.; McGovern, F.J. Renal-cell carcinoma. N. Engl. J. Med. 2005, 353, 2477–2490. [Google Scholar] [CrossRef]
- Gupta, K.; Miller, J.D.; Li, J.Z.; Russell, M.W.; Charbonneau, C. Epidemiologic and socioeconomic burden of metastatic renal cell carcinoma (mRCC): A literature review. Cancer Treat. Rev. 2008, 34, 193–205. [Google Scholar] [CrossRef]
- Sanchez-Gastaldo, A.; Kempf, E.; Gonzalez Del Alba, A.; Duran, I. Systemic treatment of renal cell cancer: A comprehensive review. Cancer Treat. Rev. 2017, 60, 77–89. [Google Scholar] [CrossRef]
- Reck, M.; Rodriguez-Abreu, D.; Robinson, A.G.; Hui, R.; Csőszi, T.; Fülöp, A.; Gottfried, M.; Peled, N.; Tafreshi, A.; Cuffe, S.; et al. Pembrolizumab versus Chemotherapy for PD-L1-Positive Non-Small-Cell Lung Cancer. N. Engl. J. Med. 2016, 375, 1823–1833. [Google Scholar] [CrossRef]
- Rosellini, M.; Marchetti, A.; Mollica, V.; Rizzo, A.; Santoni, M.; Massari, F. Prognostic and predictive biomarkers for immunotherapyin advanced renal cell carcinoma. Nat. Rev. Urol. 2023, 20, 133–157. [Google Scholar] [CrossRef]
- Santoni, M.; Rizzo, A.; Kucharz, J.; Mollica, V.; Rosellini, M.; Marchetti, A.; Tassinari, E.; Monteiro, F.S.M.; Soares, A.; Molina-Cerrillo, J.; et al. Complete remissions following immunotherapy or immuno-oncology combinations in cancer patients: The MOUSEION-03 meta-analysis. Cancer Immunol. Immun. 2023, 72, 1365–1379. [Google Scholar] [CrossRef]
- Santoni, M.; Rizzo, A.; Mollica, V.; Matrana, M.R.; Rosellini, M.; Faloppi, L.; Marchetti, A.; Battelli, N.; Massari, F. The impact of gender on The efficacy of immune checkpoint inhibitors in cancer patients: The MOUSEION-01 study. Crit Rev Oncol Hemat. 2022, 170, 1365–1379. [Google Scholar] [CrossRef] [PubMed]
- Gao, R.; Meng, M.; Zhou, X.C.; Yu, M.; Li, Z.; Li, J.; Wang, X.; Song, Y.; Wang, H.; He, J. TRPV1, a novel biomarker associated with lung cancer via excluding immune infiltration. Medcomm 2022, 3, e139. [Google Scholar] [CrossRef] [PubMed]
- Ravelli, A.; Roviello, G.; Cretella, D.; Cavazzoni, A.; Biondi, A.; Cappelletti, M.R.; Zanotti, L.; Ferrero, G.; Ungari, M.; Zanconati, F.; et al. Tumor-infiltrating lymphocytes and breast cancer: Beyond the prognostic and predictive utility. Tumour Biol. 2017, 39, 1010428317695023. [Google Scholar] [CrossRef] [PubMed]
- He, J. Bioactivity-Guided Fractionation of Pine Needle Reveals Catechin as an Anti-hypertension Agent via Inhibiting Angiotensin-Converting Enzyme. Sci. Rep. 2017, 7, 8867. [Google Scholar] [CrossRef] [PubMed]
- Meng, M.; Gao, R.; Liu, Z.; Liu, F.; Du, S.; Song, Y.; He, J. Ginsenosides, potential TMPRSS2 inhibitors, a trade-off between the therapeutic combination for anti-PD-1 immunotherapy and the treatment of COVID-19 infection of LUAD patients. Front. Pharmacol. 2023, 14, 1085509. [Google Scholar] [CrossRef]
- Choi, J.; Gyamfi, J.; Jang, H.; Koo, J.S. The role of tumor-associated macrophage in breast cancer biology. Histol Histopathol. 2018, 33, 133–145. [Google Scholar] [PubMed]
- Santoni, M.; Romagnoli, E.; Saladino, T.; Foghini, L.; Guarino, S.; Capponi, M.; Giannini, M.; Cognigni, P.D.; Ferrara, G.; Battelli, N. Triple negative breast cancer: Key role of Tumor-Associated Macrophages in regulating the activity of anti-PD-1/PD-L1 agents. Biochim. Biophys. Acta Rev. Cancer 2018, 1869, 78–84. [Google Scholar] [CrossRef] [PubMed]
- He, J.; Qiu, N.; Zhou, X.; Meng, M.; Liu, Z.; Li, J.; Du, S.; Sun, Z.; Wang, H. Resveratrol analog, triacetylresveratrol, a potential immunomodulator of lung adenocarcinoma immunotherapy combination therapies. Front. Oncol. 2023, 12, 1007653. [Google Scholar] [CrossRef]
- Ban, Y.; Mai, J.; Li, X.; Mitchell-Flack, M.; Zhang, T.; Zhang, L.; Chouchane, L.; Ferrari, M.; Shen, H.; Ma, X. Targeting Autocrine CCL5-CCR5 Axis Reprograms Immunosuppressive Myeloid Cells and Reinvigorates Antitumor Immunity. Cancer Res. 2017, 77, 2857–2868. [Google Scholar] [CrossRef]
- Waniczek, D.; Lorenc, Z.; Snietura, M.; Wesecki, M.; Kopec, A.; Muc-Wierzgon, M. Tumor-Associated Macrophages and Regulatory T Cells Infiltration and the Clinical Outcome in Colorectal Cancer. Arch. Immunol. Ther. Exp. 2017, 65, 445–454. [Google Scholar] [CrossRef]
- Su, X.; Zhao, L.; Shi, Y.; Zhang, R.; Long, Q.; Bai, S.; Luo, Q.; Lin, Y.; Zou, X.; Ghazanfar, S.; et al. Single-cell and single-variant resolution analysis of clonal evolution in human liver cancer. J. Hematol Oncol. 2021, 14, 22. [Google Scholar] [CrossRef] [PubMed]
- He, J.; Lin, F.; Yang, X.; Wang, D.; Tan, X.; Zhang, S. Sustainable Synthesis of 2-Arylbenzoxazoles over a Cobalt-Based Nanocomposite Catalyst. Org. Process Res. Dev. 2016, 20, 1093–1096. [Google Scholar] [CrossRef]
- Bentz, S.; Cee, A.; Endlicher, E.; Wojtal, K.A.; Naami, A.; Pesch, T.; Lang, S.; Schubert, P.; Fried, M.; Weber, A.; et al. Hypoxia induces the expression of transketolase-like 1 in human colorectal cancer. Digestion 2013, 88, 182–192. [Google Scholar] [CrossRef] [PubMed]
- Tian, N.; Liu, Q.; Li, Y.; Tong, L.; Lu, Y.; Zhu, Y.; Zhang, P.; Chen, H.; Hu, L.; Meng, J.; et al. Transketolase Deficiency in Adipose Tissues Protects Mice from Diet-Induced Obesity by Promoting Lipolysis. Diabetes 2020, 69, 1355–1367. [Google Scholar] [CrossRef] [PubMed]
- Li, M.; Lu, Y.; Li, Y.; Tong, L.; Gu, X.C.; Meng, J.; Zhu, Y.; Wu, L.; Feng, M.; Tian, N.; et al. Transketolase Deficiency Protects the Liver from DNA Damage by Increasing Levels of Ribose 5-Phosphate and Nucleotides. Cancer Res. 2019, 79, 3689–3701. [Google Scholar] [CrossRef] [PubMed]
- Wang, T.; Gnanaprakasam, J.N.R.; Chen, X.; Kang, S.; Xu, X.; Sun, H.; Liu, L.; Rodgers, H.; Miller, E.; Cassel, T.A.; et al. Inosine is an alternative carbon source for CD8(+)-T-cell function under glucose restriction. Nat. Metab. 2020, 2, 635–647. [Google Scholar] [CrossRef]
- He, J.; Li, Y.J. Ginsenoside Rg1 Downregulates the Shear Stress Induced MCP-1 Expression by Inhibiting MAPK Signaling Pathway. Am. J. Chin. Med. 2015, 43, 305–317. [Google Scholar] [CrossRef] [PubMed]
- Diaz-Moralli, S.; Aguilar, E.; Marin, S.; Coy, J.F.; Dewerchin, M.; Antoniewicz, M.R.; Meca-Cortés, O.; Notebaert, L.; Ghesquière, B.; Eelen, G.; et al. A key role for transketolase-like 1 in tumor metabolic reprogramming. Oncotarget 2016, 7, 51875–51897. [Google Scholar] [CrossRef]
- Gao, R.; Yang, T.; Xu, W. Enemies or weapons in hands: Investigational anti-diabetic drug glibenclamide and cancer risk. Expert Opin. Investig. Drugs 2017, 26, 853–864. [Google Scholar] [CrossRef]
- Nishikawa, H.; Koyama, S. Mechanisms of regulatory T cell infiltration in tumors: Implications for innovative immune precision therapies. J. Immunother. Cancer 2021, 9, e002591. [Google Scholar]
- Yuan, W.; Wu, S.; Guo, J.; Chen, Z.; Ge, J.; Yang, P.; Hu, B.; Chen, Z. Silencing of TKTL1 by siRNA inhibits proliferation of human gastric cancer cells in vitro and in vivo. Cancer Biol. Ther. 2010, 9, 710–716. [Google Scholar] [CrossRef] [PubMed]
- Hu, L.H.; Yang, J.H.; Zhang, D.T.; Zhang, S.; Wang, L.; Cai, P.C.; Zheng, J.F.; Huang, J.S. The TKTL1 gene influences total transketolase activity and cell proliferation in human colon cancer LoVo cells. Anticancer. Drugs 2007, 18, 427–433. [Google Scholar] [CrossRef] [PubMed]
- Langbein, S.; Zerilli, M.; Zur Hausen, A.; Staiger, W.; Rensch-Boschert, K.; Lukan, N.; Popa, J.; Ternullo, M.P.; Steidler, A.; Weiss, C.; et al. Expression of transketolase TKTL1 predicts colon and urothelial cancer patient survival: Warburg effect reinterpreted. Br. J. Cancer. 2006, 94, 578–585. [Google Scholar] [CrossRef] [PubMed]
- Fritz, P.; Coy, J.F.; Murdter, T.E.; Ott, G.; Alscher, M.D.; Friedel, G. TKTL-1 expression in lung cancer. Pathol Res Pract. 2012, 208, 203–209. [Google Scholar] [CrossRef] [PubMed]
- Kayser, G.; Sienel, W.; Kubitz, B.; Mattern, D.; Stickeler, E.; Passlick, B.; Werner, M.; Zur Hausen, A. Poor outcome in primary non-small cell lung cancers is predicted by transketolase TKTL1 expression. Pathology 2011, 43, 719–724. [Google Scholar] [CrossRef] [PubMed]
- Kohrenhagen, N.; Voelker, H.U.; Schmidt, M.; Kapp, M.; Krockenberger, M.; Frambach, T.; Dietl, J.; Kammerer, U. Expression of transketolase-like 1 (TKTL1) and p-Akt correlates with the progression of cervical neoplasia. J. Obstet. Gynaecol. Res. 2008, 34, 293–300. [Google Scholar] [CrossRef] [PubMed]
- Song, Y.; Liu, D.; He, G.P. TKTL1 and p63 are biomarkers for the poor prognosis of gastric cancer patients. Cancer Biomark. 2015, 15, 591–597. [Google Scholar] [CrossRef] [PubMed]
- Kammerer, U.; Gires, O.; Pfetzer, N.; Wiegering, A.; Klement, R.J.; Otto, C. TKTL1 expression in human malign and benign cell lines. BMC Cancer 2015, 15, 1–16. [Google Scholar] [CrossRef] [PubMed]
- Lee, G.; Zheng, Y.; Cho, S.; Jang, C.; England, C.; Dempsey, J.M.; Yu, Y.; Liu, X.; He, L.; Cavaliere, P.M.; et al. Post-transcriptional Regulation of De Novo Lipogenesis by mTORC1-S6K1-SRPK2 Signaling. Cell 2017, 171, 1545–1558.e18. [Google Scholar] [CrossRef]
- Lamouille, S.; Xu, J.; Derynck, R. Molecular mechanisms of epithelial-mesenchymal transition. Nat. Rev. Mol. Cell Biol. 2014, 15, 178–196. [Google Scholar] [CrossRef]
- Hu, Q.P.; Kuang, J.Y.; Yang, Q.K.; Bian, X.W.; Yu, S.C. Beyond a tumor suppressor: Soluble E-cadherin promotes the progression of cancer. Int. J. Cancer 2016, 138, 2804–2812. [Google Scholar] [CrossRef] [PubMed]
- David, J.M.; Rajasekaran, A.K. Dishonorable discharge: The oncogenic roles of cleaved E-cadherin fragments. Cancer Res. 2012, 72, 2917–2923. [Google Scholar] [CrossRef] [PubMed]
- Xie, J.; Zhu, C.; Wu, J.; Li, C.; Luo, L.; Xia, L.; Li, X.; Gui, Y.; Cai, Z.; Li, Z. Down-regulation of C12orf59 is associated with a poor prognosis and VHL mutations in renal cell carcinoma. Oncotarget 2016, 7, 6824–6834. [Google Scholar] [CrossRef] [PubMed]
- Tharmalingam, N.; Park, M.; Lee, M.H.; Woo, H.J.; Kim, H.W.; Yang, J.Y.; Rhee, K.J.; Kim, J.B. Piperine 712 treatment suppresses Helicobacter pylori toxin entry in to gastric epithelium and minimizes β-catenin mediated oncogenesis and 713 IL-8 secretion in vitro. Am. J. Transl. Res. 2016, 8, 885–898. [Google Scholar] [PubMed]
- Uhlen, M.; Karlsson, M.J.; Zhong, W.; Tebani, A.; Pou, C.; Mikes, J.; Lakshmikanth, T.; Forsström, B.; Edfors, F.; Odeberg, J.; et al. A genome-wide transcriptomic analysis of protein-coding genes in human blood cells. Science 2019, 366, eaax9198. [Google Scholar] [CrossRef] [PubMed]
- Zhou, Y.; Zhou, B.; Pache, L.; Chang, M.; Khodabakhshi, A.H.; Tanaseichuk, O.; Benner, C.; Chanda, S.K. Metascape provides a biologist-oriented resource for the analysis of systems-level datasets. Nat. Commun. 2019, 10, 1523. [Google Scholar] [CrossRef] [PubMed]
- Szklarczyk, D.; Gable, A.L.; Lyon, D.; Junge, A.; Wyder, S.; Huerta-Cepas, J.; Simonovic, M.; Doncheva, N.T.; Morris, J.H.; Bork, P.; et al. STRING v11: Protein-protein association networks with increased coverage, supporting functional discovery in genome-wide experimental datasets. Nucleic Acids Res. 2019, 47, D607–D613. [Google Scholar] [CrossRef] [PubMed]
- Vasaikar, S.; Straub, P.; Wang, J.; Zhang, B. LinkedOmics: Analyzing multi-omics data within and across 32 cancer types. Cancer Res. 2019, 79, D956–D963. [Google Scholar] [CrossRef]
- Wang, J.; Vasaikar, S.; Shi, Z.; Greer, M.; Zhang, B. WebGestalt 2017: A more comprehensive, powerful, flexible and interactive gene set enrichment analysis toolkit. Nucleic Acids Res. 2017, 45, W130–W137. [Google Scholar] [CrossRef]
- Ru, B.; Wong, C.N.; Tong, Y.; Zhong, J.Y.; Zhong, S.S.W.; Wu, W.C.; Chu, K.C.; Wong, C.Y.; Lau, C.Y.; Chen, I.; et al. TISIDB: An integrated repository portal for tumor-immune system interactions. Bioinformatics 2019, 35, 4200–4202. [Google Scholar] [CrossRef]
- Charoentong, P.; Finotello, F.; Angelova, M.; Mayer, C.; Efremova, M.; Rieder, D.; Hackl, H.; Trajanoski, Z. Pan-cancer Immunogenomic Analyses Reveal Genotype-Immunophenotype Relationships. Cell Rep. 2017, 18, 248–262. [Google Scholar] [CrossRef] [PubMed]
- Sussman, J.L.; Lin, D.; Jiang, J.; Manning, N.O.; Prilusky, J.; Ritter, O.; Abola, E.E. Protein Data Bank (PDB): Database of three-dimensional structural information of biological macromolecules. Acta Crystallogr. D Biol. Crystallogr. 1998, 54 Pt 6, 1078–1084. [Google Scholar] [CrossRef] [PubMed]
- Kankariya, R.A.; Chaudhari, A.B.; Dandi, N.D. Inhibitory efficacy of 2, 4-diacetylphloroglucinol against SARS-COV-2 proteins: In silico study. Biologia 2022, 77, 815–828. [Google Scholar] [CrossRef] [PubMed]
- Oprea, T.I.; Davis, A.M.; Teague, S.J.; Leeson, P.D. Is there a difference between leads and drugs? A historical perspective. J. Chem. Inf. Comput. Sci. 2001, 41, 1308–1315. [Google Scholar] [CrossRef] [PubMed]


| Clinicopathological Characteristics | Overall Survival (n = 1925) | |||||
|---|---|---|---|---|---|---|
| KIRC (n = 530) | KIRP (n = 280) | |||||
| N | Hazard Ratio | p Value | N | Hazard Ratio | p Value | |
| Gender | ||||||
| Female | 186 | 0.5 (0.3–0.83) | 0.0058 | 76 | 0.23 (0.03–1.76) | 0.12 |
| Male | 344 | 0.73 (0.5–1.09) | 0.12 | 211 | 1.33 (0.65–2.75) | 0.44 |
| Race | ||||||
| White | 459 | 0.66 (0.47–0.91) | 0.01 | 175 | 0.62 (0.32–1.22) | 0.16 |
| Asian | 8 | --- | --- | 6 | --- | --- |
| Black/African American | 56 | 0.41 (0.12–1.38) | 0.14 | 56 | 0.41 (0.12–1.38) | 0.14 |
| Stage | ||||||
| 1 | 265 | 0.45 (0.25–0.82) | 0.0072 | 171 | 1.86 (0.41–8.48) | 0.42 |
| 2 | 57 | 1.93 (0.59–6.28) | 0.27 | 21 | 1,756,641,030.03 (0-Inf) | 0.16 |
| 3 | 123 | 1.5 (0.86–2.63) | 0.15 | 61 | 0.46 (0.17–1.28) | 0.13 |
| 4 | 82 | 0.68 (0.41–1.14) | 0.14 | --- | --- | |
| Compound | Structural Formula | Binding Energy (kcal/mol) |
|---|---|---|
| Glibenclamide | 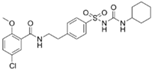 | −8.8 |
| Piperine |  | −8.3 |
| Scopolamine | 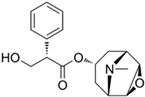 | −7.9 |
| Tropisetron |  | −7.7 |
| Atropine | 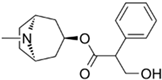 | −7.6 |
Disclaimer/Publisher’s Note: The statements, opinions and data contained in all publications are solely those of the individual author(s) and contributor(s) and not of MDPI and/or the editor(s). MDPI and/or the editor(s) disclaim responsibility for any injury to people or property resulting from any ideas, methods, instructions or products referred to in the content. |
© 2024 by the authors. Licensee MDPI, Basel, Switzerland. This article is an open access article distributed under the terms and conditions of the Creative Commons Attribution (CC BY) license (https://creativecommons.org/licenses/by/4.0/).
Share and Cite
Gao, R.; Liu, Z.; Meng, M.; Song, X.; He, J. Neurogenesis-Associated Protein, a Potential Prognostic Biomarker in Anti-PD-1 Based Kidney Renal Clear Cell Carcinoma Patient Therapeutics. Pharmaceuticals 2024, 17, 451. https://doi.org/10.3390/ph17040451
Gao R, Liu Z, Meng M, Song X, He J. Neurogenesis-Associated Protein, a Potential Prognostic Biomarker in Anti-PD-1 Based Kidney Renal Clear Cell Carcinoma Patient Therapeutics. Pharmaceuticals. 2024; 17(4):451. https://doi.org/10.3390/ph17040451
Chicago/Turabian StyleGao, Rui, Zixue Liu, Mei Meng, Xuefei Song, and Jian He. 2024. "Neurogenesis-Associated Protein, a Potential Prognostic Biomarker in Anti-PD-1 Based Kidney Renal Clear Cell Carcinoma Patient Therapeutics" Pharmaceuticals 17, no. 4: 451. https://doi.org/10.3390/ph17040451
APA StyleGao, R., Liu, Z., Meng, M., Song, X., & He, J. (2024). Neurogenesis-Associated Protein, a Potential Prognostic Biomarker in Anti-PD-1 Based Kidney Renal Clear Cell Carcinoma Patient Therapeutics. Pharmaceuticals, 17(4), 451. https://doi.org/10.3390/ph17040451