Article

Discovery of Guanfacine as a Novel TAAR1 Agonist: A Combination Strategy through Molecular Modeling Studies and Biological Assays

1
Department of Pharmacy, Section of Medicinal Chemistry, School of Medical and Pharmaceutical Sciences, University of Genoa, 16132 Genoa, Italy
2
Section of Chemistry and Food and Pharmaceutical Technologies, University of Genoa, 16148 Genoa, Italy
3
Institute of Translational Biomedicine, St. Petersburg State University, 199034 St. Petersburg, Russia
4
St. Petersburg University Hospital, St. Petersburg State University, 199034 St. Petersburg, Russia
5
Valdman Institute of Pharmacology, Pavlov First St. Petersburg State Medical University, 197022 St. Petersburg, Russia
6
Department of Health Sciences and Research Center on Autoimmune and Allergic Diseases (CAAD), University of Piemonte Orientale (UPO), 28100 Novara, Italy
7
Central RNA Laboratory, Istituto Italiano di Tecnologia (IIT), 16152 Genova, Italy
*
Author to whom correspondence should be addressed.
Pharmaceuticals 2023, 16(11), 1632; https://doi.org/10.3390/ph16111632
Submission received: 16 October 2023 / Revised: 9 November 2023 / Accepted: 17 November 2023 / Published: 20 November 2023

Abstract

:
Trace amine-associated receptor 1 (TAAR1) is an attractive target for the design of innovative drugs to be applied in diverse pharmacological settings. Due to a non-negligible structural similarity with endogenous ligands, most of the agonists developed so far resulted in being affected by a low selectivity for TAAR1 with respect to other monoaminergic G protein-coupled receptors, like the adrenoreceptors. This study utilized comparative molecular docking studies and quantitative–structure activity relationship (QSAR) analyses to unveil key structural differences between TAAR1 and alpha2-adrenoreceptor (α2-ADR), with the aim to design novel TAAR1 agonists characterized by a higher selectivity profile and reduced off-target effects. While the presence of hydrophobic motives is encouraged towards both the two receptors, the introduction of polar/positively charged groups and the ligand conformation deeply affect the TAAR1 or α2-ADR putative selectivity. These computational methods allowed the identification of the α2A-ADR agonist guanfacine as an attractive TAAR1-targeting lead compound, demonstrating nanomolar activity in vitro. In vivo exploration of the efficacy of guanfacine showed that it is able to decrease the locomotor activity of dopamine transporter knockout (DAT-KO) rats. Therefore, guanfacine can be considered as an interesting template molecule worthy of structural optimization. The dual activity of guanfacine on both α2-ADR and TAAR1 signaling and the related crosstalk between the two pathways will deserve more in-depth investigation.

Graphical Abstract

1. Introduction

Trace amine-associated receptor 1 (TAAR1) is a promising target for the development of innovative therapies for many diseases, in virtue of its wide distribution in the brain and in diverse peripheral tissues [1,2,3,4,5]. TAAR1 is responsive to a class of biogenic compounds called trace amines (TAs), such as tyramine (TYR), β-phenylethylamine (β-PEA), and 3-iodothyronamine (T1AM), whose dysregulation was correlated to the etiology of various diseases, like schizophrenia, depression, attention deficit hyperactivity disorder, substance abuse, metabolic syndrome, and Parkinson’s disease [3,6,7,8,9,10,11]. In the brain, TAAR1 proved to be an important modulator of the major monoamine (dopamine and serotonin) and glutamate signaling pathways, directing the attention of researchers on the therapeutic implications of TAAR1 ligands in neuropsychiatric disorders [3,12,13]. The pharmaceutical company Hoffmann-La Roche was an early leader in TAAR1 drug discovery and registered several patents [14] as well as published preclinical studies [15,16,17,18,19] with selective TAAR1 agonists. TAAR1 agonists now give promise to be a new generation of antipsychotic medications, as evidenced by two compounds that have entered clinical trials, SEP-363856 (ulotaront—Sunovion) and RO6889450 (ralmitaront—La Roche) [13,20,21]. While there is limited publicly available information on ralmitaront’s preclinical profile [22], ulotaront is designated as a promiscuous TAAR1 and 5-HT1A agonist [23,24] that is proving able to control the positive, negative, and cognitive symptoms of schizophrenia [25,26]. Notably, ulotaront seems to lack the class-specific adverse events of traditional D2 or 5-HT2A antipsychotics [20,27], such as the weight gain, metabolic issues, and Parkinson-like symptoms.
Since the beginning, the study of TAAR1 ligands chemotype took inspiration from the chemical scaffold of endogenous TAs, leading to the identification of several analogues often endowed with a more promising mTAAR1 affinity, rather than towards the hTAAR1 ortholog [28]. During the last years, the species-specificity issue was explored by our group based on molecular modelling studies of murine (mTAAR1) and human TAAR1 (hTAAR1) receptors. As a result, we developed some novel TAAR1 chemotypes, namely the phenyl(benzyl) biguanides and the piperazine-containing biguanides, which showed varying micromolar activity towards the two receptors [29,30]. Successively, through the combination of a pharmacophore model and a scaffold simplification strategy of the previous biguanide-based TAAR1 agonists, a new series of 1-amidino-4-phenylpiperazine derivatives was developed and provided nanomolar functional activity at hTAAR1 and low cytotoxicity [31]. All these molecules shared the key structural features required for a TAAR1-targeting activity, as a basic core forming a key salt-bridge with a conserved m/hTAAR1 D3.32 aspartic acid (namely Asp102 and Asp103, respectively) and an aromatic moiety forming π-π stacking and van der Waals interactions with a number of aromatic residues (see below) [32].
The discovery of novel TAAR1-targeting ligands also moved through numerous screening campaigns involving known dopaminergic, serotonergic, and adrenergic drugs [33]. This strategy led to several series of TAAR1 agonists, which confirmed their efficacy at the expense of selectivity over other G-protein-coupled receptors (GPCRs) [32]. In this regard, compound S18616 [34] was reported in the literature as a potent alpha2-adrenoreceptor (α2-ADR) agonist and then also evaluated as a TAAR1 agonist. To pursue more selective TAAR1 or α2-ADR ligands, structural variations of the main S18616 tricyclic ring was afforded, leading to different series of imidazoline, imidazole, [35] and amino oxazoline [36] derivatives (Figure 1).
Herein, we collected in silico the reference S18616 and the previously cited dual acting compounds (5a-5e, 6a-6e, 11-54), exhibiting in particular the imidazoline and imidazole chemotype, for the following computational studies. The agonist selectivity profile as TAAR1 and/or α2-ADR ligands was then investigated based on deepening comparative molecular docking studies and quantitative–structure activity relationship (QSAR) analyses. The results pointed out the key structural differences between the two receptors, the most relevant pharmacophore features, and chemical descriptors turning in the agonist selectivity. The derived information is expected to be useful for the design of more selective TAAR1 ligands as a further prosecution of this work.
To preliminary assess the minimum criteria to achieve TAAR1 and/or α2-ADR agonism, as determined by previously mentioned computational studies, we identified guanfacine, a 2,6-dichlorophenylacetyl guanidine derivative, as a novel m/hTAAR1 agonist. A schematic representation of the whole developed study is reported in Figure 2.
Originally approved for the therapy of hypertension, guanfacine is currently indicated for the treatment of attention deficit hyperactivity disorder (ADHD) [37,38,39]. Guanfacine is a highly selective agonist of α2A ADRs with very low affinity for other adrenergic receptors [40]. Guanfacine was proven to be more selective for the α2A ADR subtype than clonidine, which also targets with high affinity to α2B, α2C, and imidazoline receptors [41,42]. Guanfacine preferentially binds to postsynaptic α2A receptors, which mainly mediate its beneficial cognitive effects in the prefrontal cortex (PFC) [41,43]. Guanfacine demonstrated to improve the PFC function by strengthening PFC network connections through the inhibition of the cAMP-potassium channel signaling in postsynaptic spines [44,45]. Compared to clonidine, guanfacine has a weaker presynaptic action at α2A receptors, and therefore it shows a better tolerability, producing hypotensive and sedative effects, but at a lower extent [46]. In fact, in animal studies, low doses (0.5–1 mg/Kg) of guanfacine improved working memory without reducing blood pressure or causing significant sedation, whilst only higher doses (10 mg/Kg) provoked more relevant adverse effects [47].
In light of these considerations, we deemed it interesting to investigate the drug guanfacine as an attractive TAAR1-targeting lead compound and provide it as a template molecule for further chemical improvements. We explored the in vitro functional activity of guanfacine at hTAAR1 receptors, while in vivo follow-up studies showed that guanfacine decreased the locomotor activity of DAT-KO rats.

2. Results and Discussion

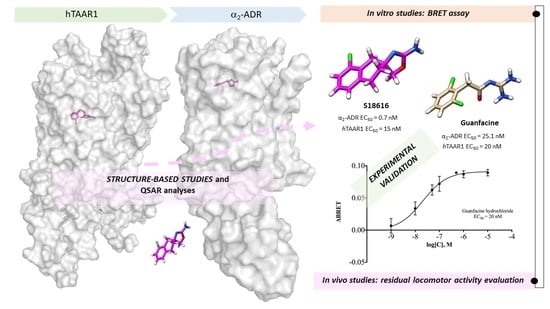
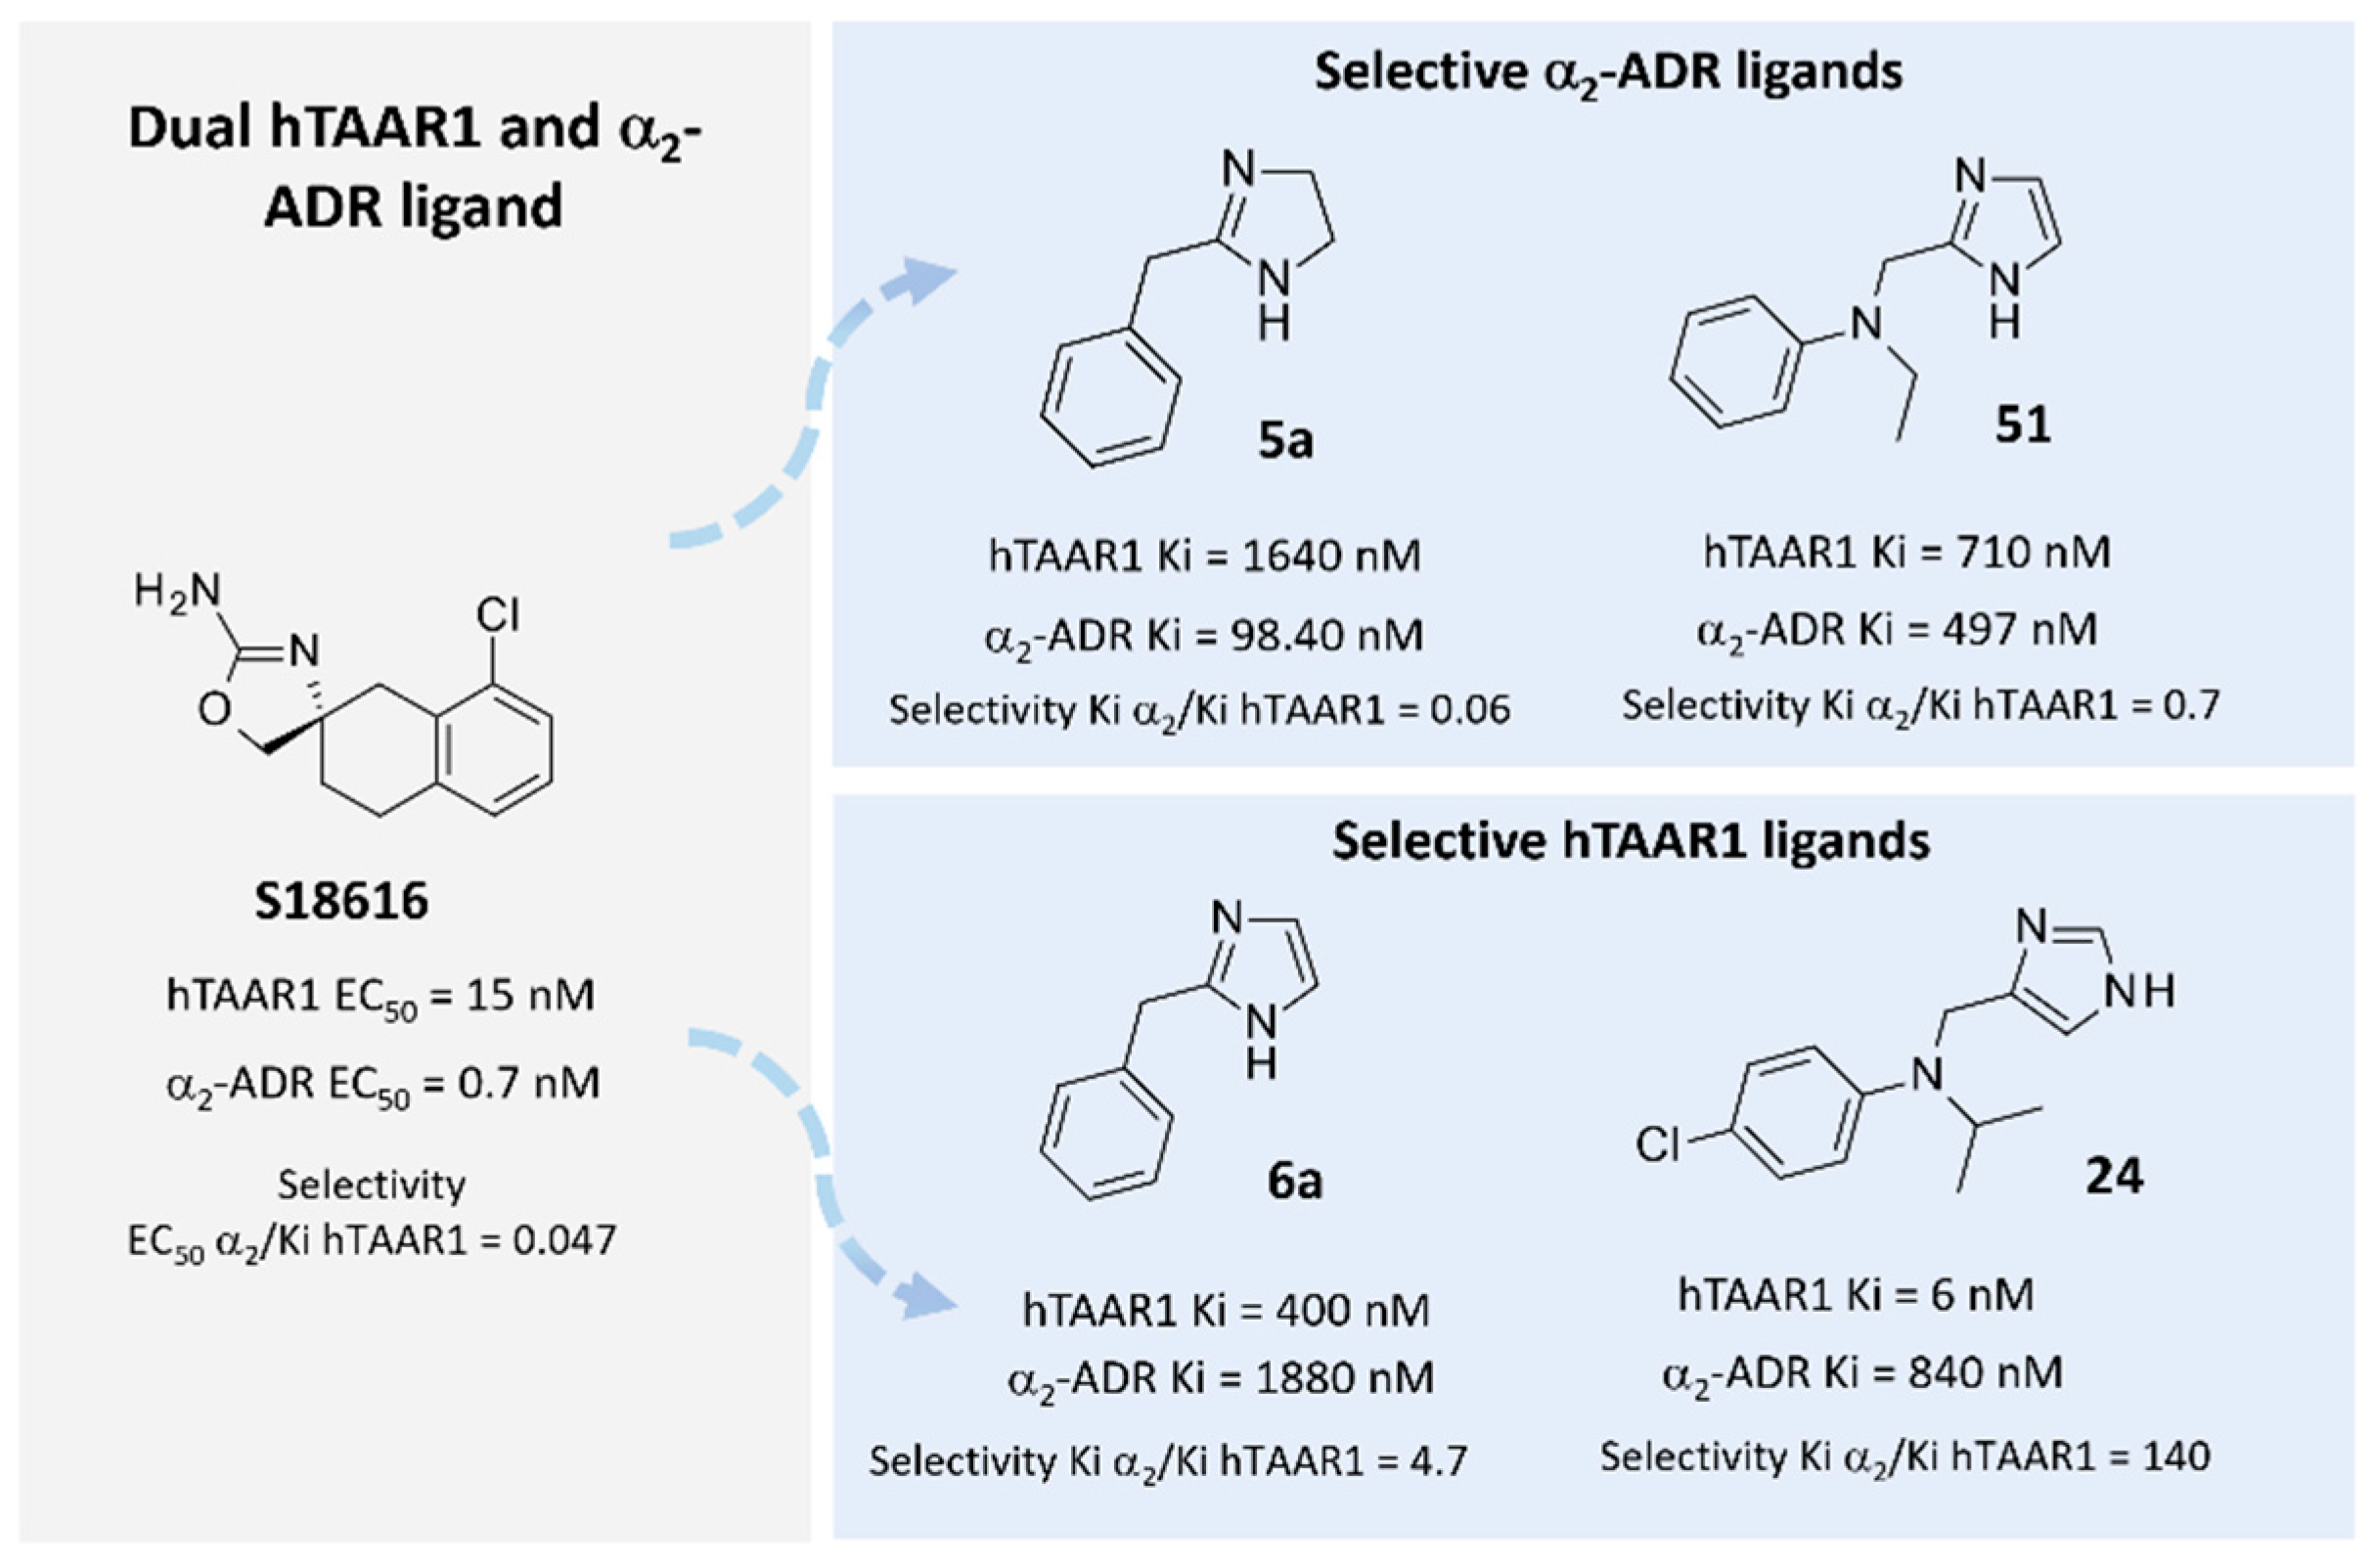
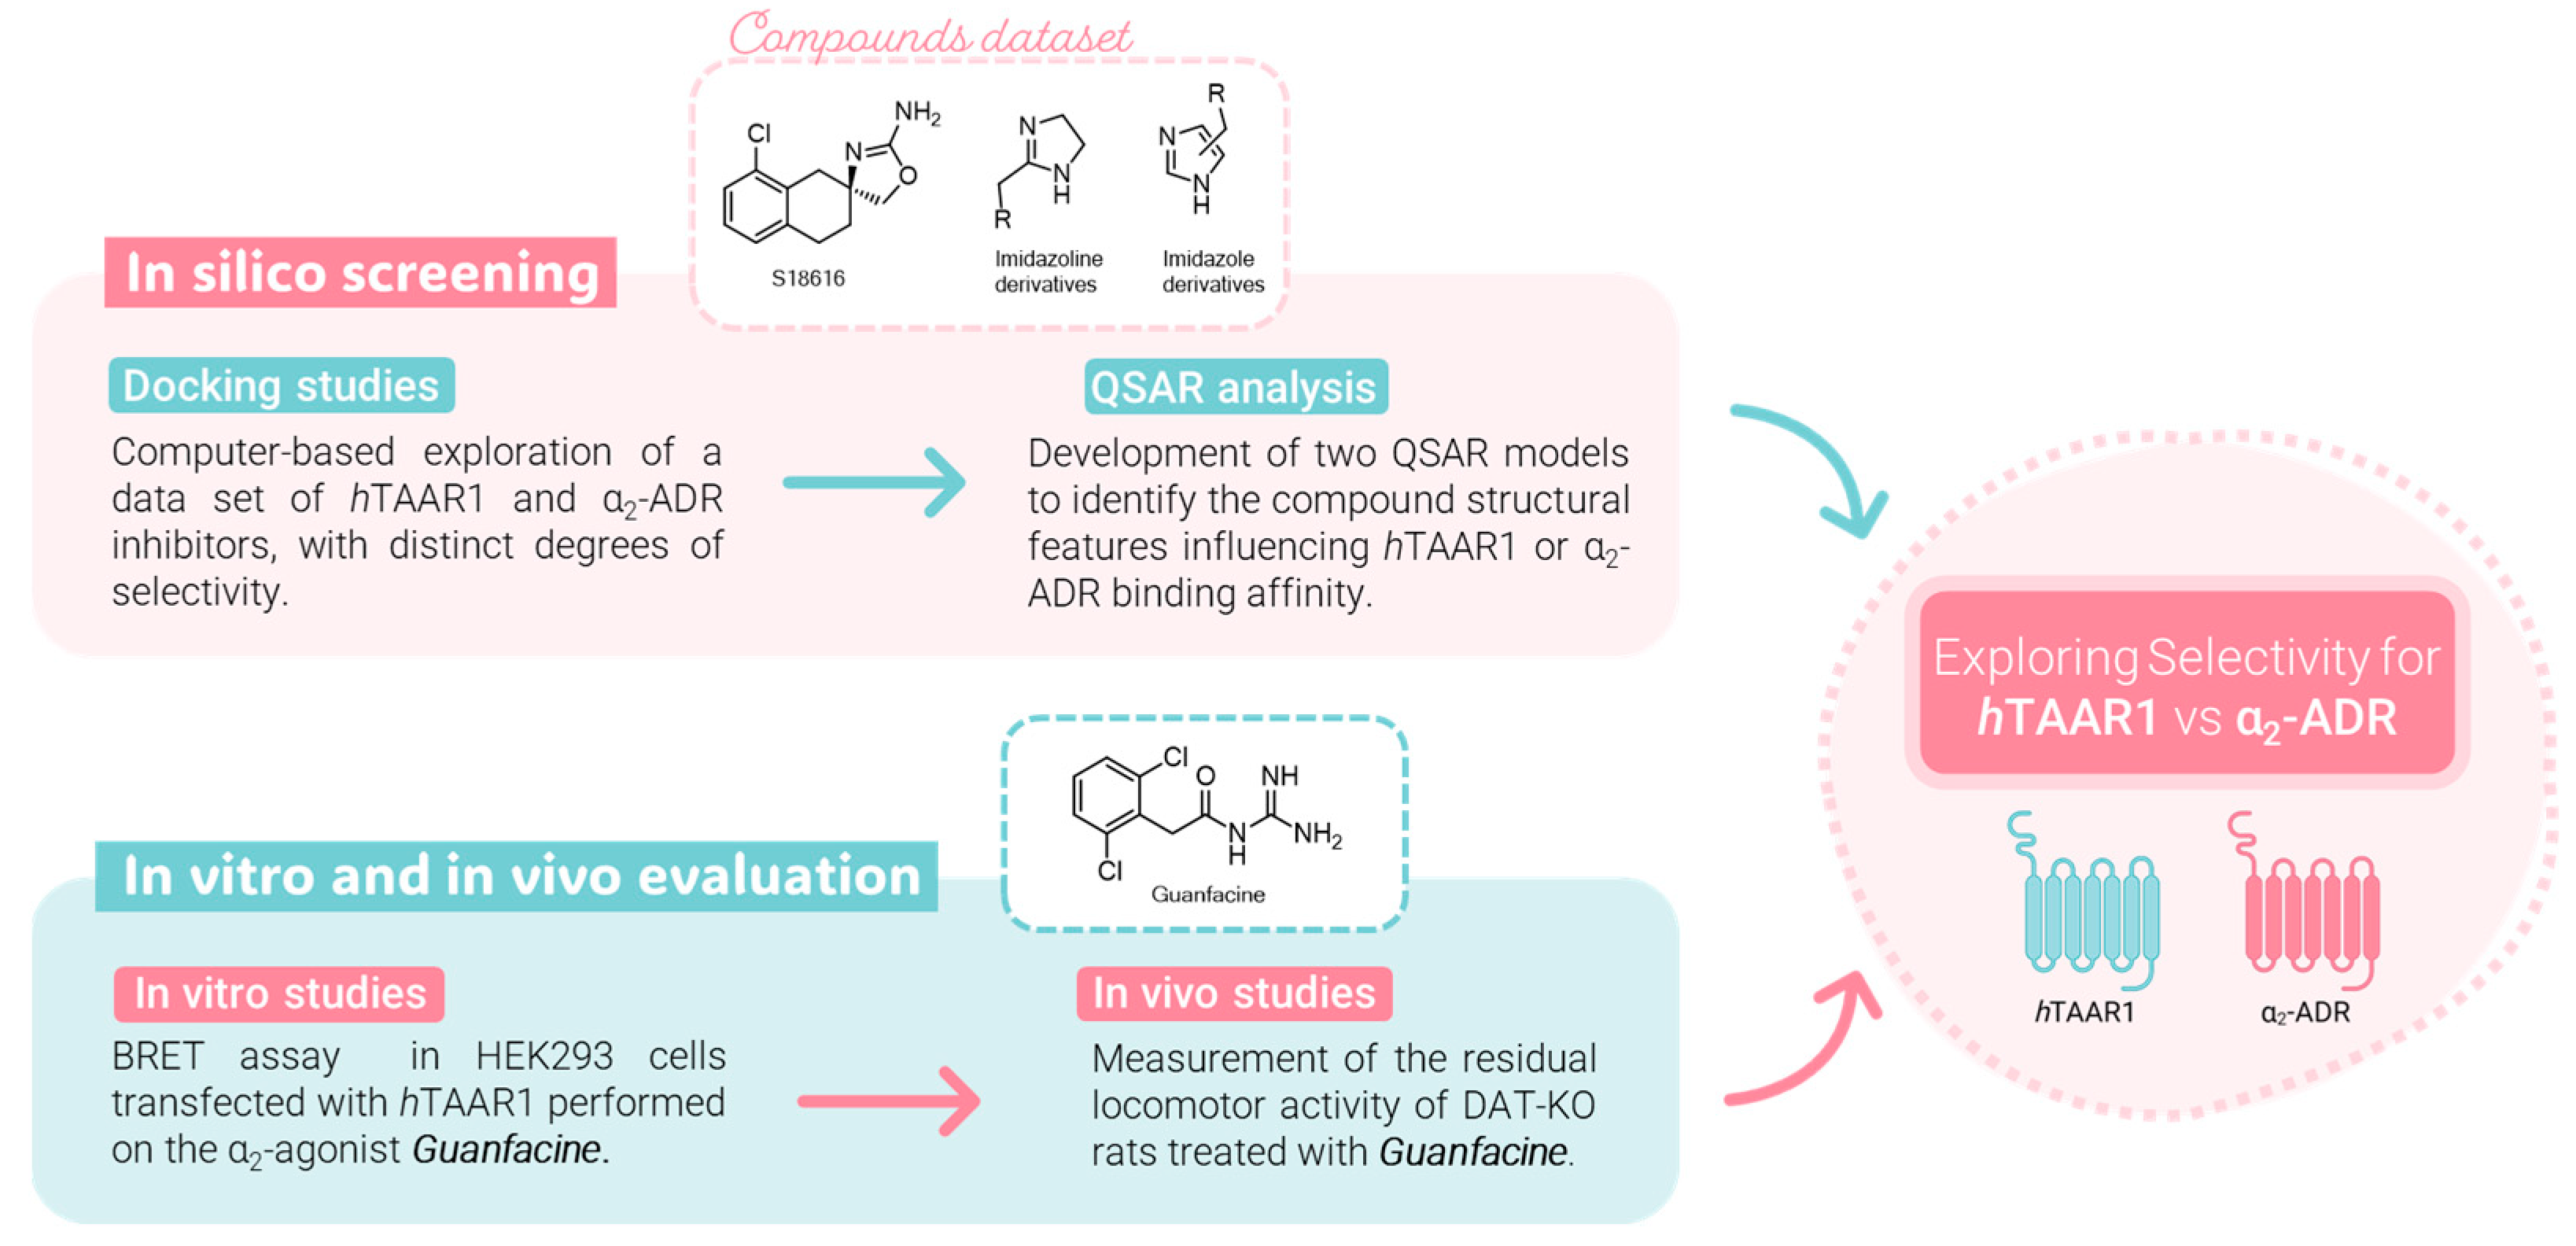
2.1. Probing In Silico S18616 as Dual TAAR1 and α2-ADR Ligands

To pursue useful information for the design and discovery of novel selective hTAAR1 or α2-ADR ligands, it was deemed interesting to explore in silico the previously mentioned dual agonist S18616. Initially, the structural information of the two biological targets was compared by superimposition of their 3D structures. The hTAAR1 model (AF-Q96RJ0-F1) by the AlphaFold protein structure database [48,49] and the α2-ADR X-ray structure (PDB code = 6KUY) [50] were taken into account (see method section for details) and aligned via Blosum62 (MOE software- 2019.01 version). The reliability of the two GPCRs alignment can be assessed by the values of the pairwise percentage residue identity (PPRI; PPRI > 22%) and similarity (PPRS; PPRS > 38%), as shown in Figure S1.
As regards the 6KUY co-crystallized agonist, the experimental positioning suggests key contacts with Asp113 and π-π or cation-π stacking with the surrounding aromatic residues Phe390, Phe391, Trp387, and Phe412 (see Figure S2). This piece of information allows the corresponding protein cavity to be derived at the superposed TAAR1 receptor.
As shown in Table 1, the putative TAAR1 binding site includes Asp103, Ser198, Trp264, Phe267, Phe268, and Tyr294 as conserved residues. On the contrary, the hTAAR1 hydrophobic residues Ile104, Val184, and Ile290 are in place of the α2-ADR Val114, Ile190, and Phe412, while the hTAAR1 Ser107 corresponds to the α2-ADR Cys117.
Accordingly, the choice of the mostly hydrophobic structures is expected to turn in dual acting derivatives while the introduction of polar moieties would allow more selective hTAAR1 ligands to be designed.
On this basis, molecular docking studies involving the prototype S18616 were performed to better clarify: (i) its different positioning as a dual agonist at hTAAR1 and α2-ADR and to (ii) be exploited as a control compound for the following molecular docking simulations of the imidazoline/imidazole (5a-5e, 6a-6e, 11-54), herein investigated. Details of the calculated scoring functions as shown for both S18616 and the compounds 5a-5e, 6a-6e, 11-54 are listed in Tables S1 and S2.
As shown in Figure 3A,C, S18616 featured small dimensions, which allowed the compound to occupy both the hTAAR1 and α2-ADR ligand binding site, respectively. As shown in Figure 3B, S18616 was engaged in H-bonds with Asp103 within the hTAAR1 binding pocket, while the spirocyclic system was projected towards Ile104, Val184, Phe186, Phe195, and Phe267, featuring Van der Waals contacts and π-π stacking.
The docking positioning of the dual acting compound S18616 at the α2-ADR cavity pointed out additional H-bonds, involving the amino group of the agonist and the key residues Asp113 and Tyr109 (see Figure 3D). Notably, this information agreed with the higher potency trend of this compound towards α2-ADR (EC50 = 0.7 nM) with respect to hTAAR1 (EC50 = 15 nM). Furthermore, the spirocyclic system of the ligand experienced π-π stacking and Van der Waals contacts with the surrounding residues Val114, Phe390, Phe391, and Tyr394. A complete view of S18616 at the whole hTAAR1 and α2-ADR (PDB code 6KUY) proteins is shown in Figure S4.

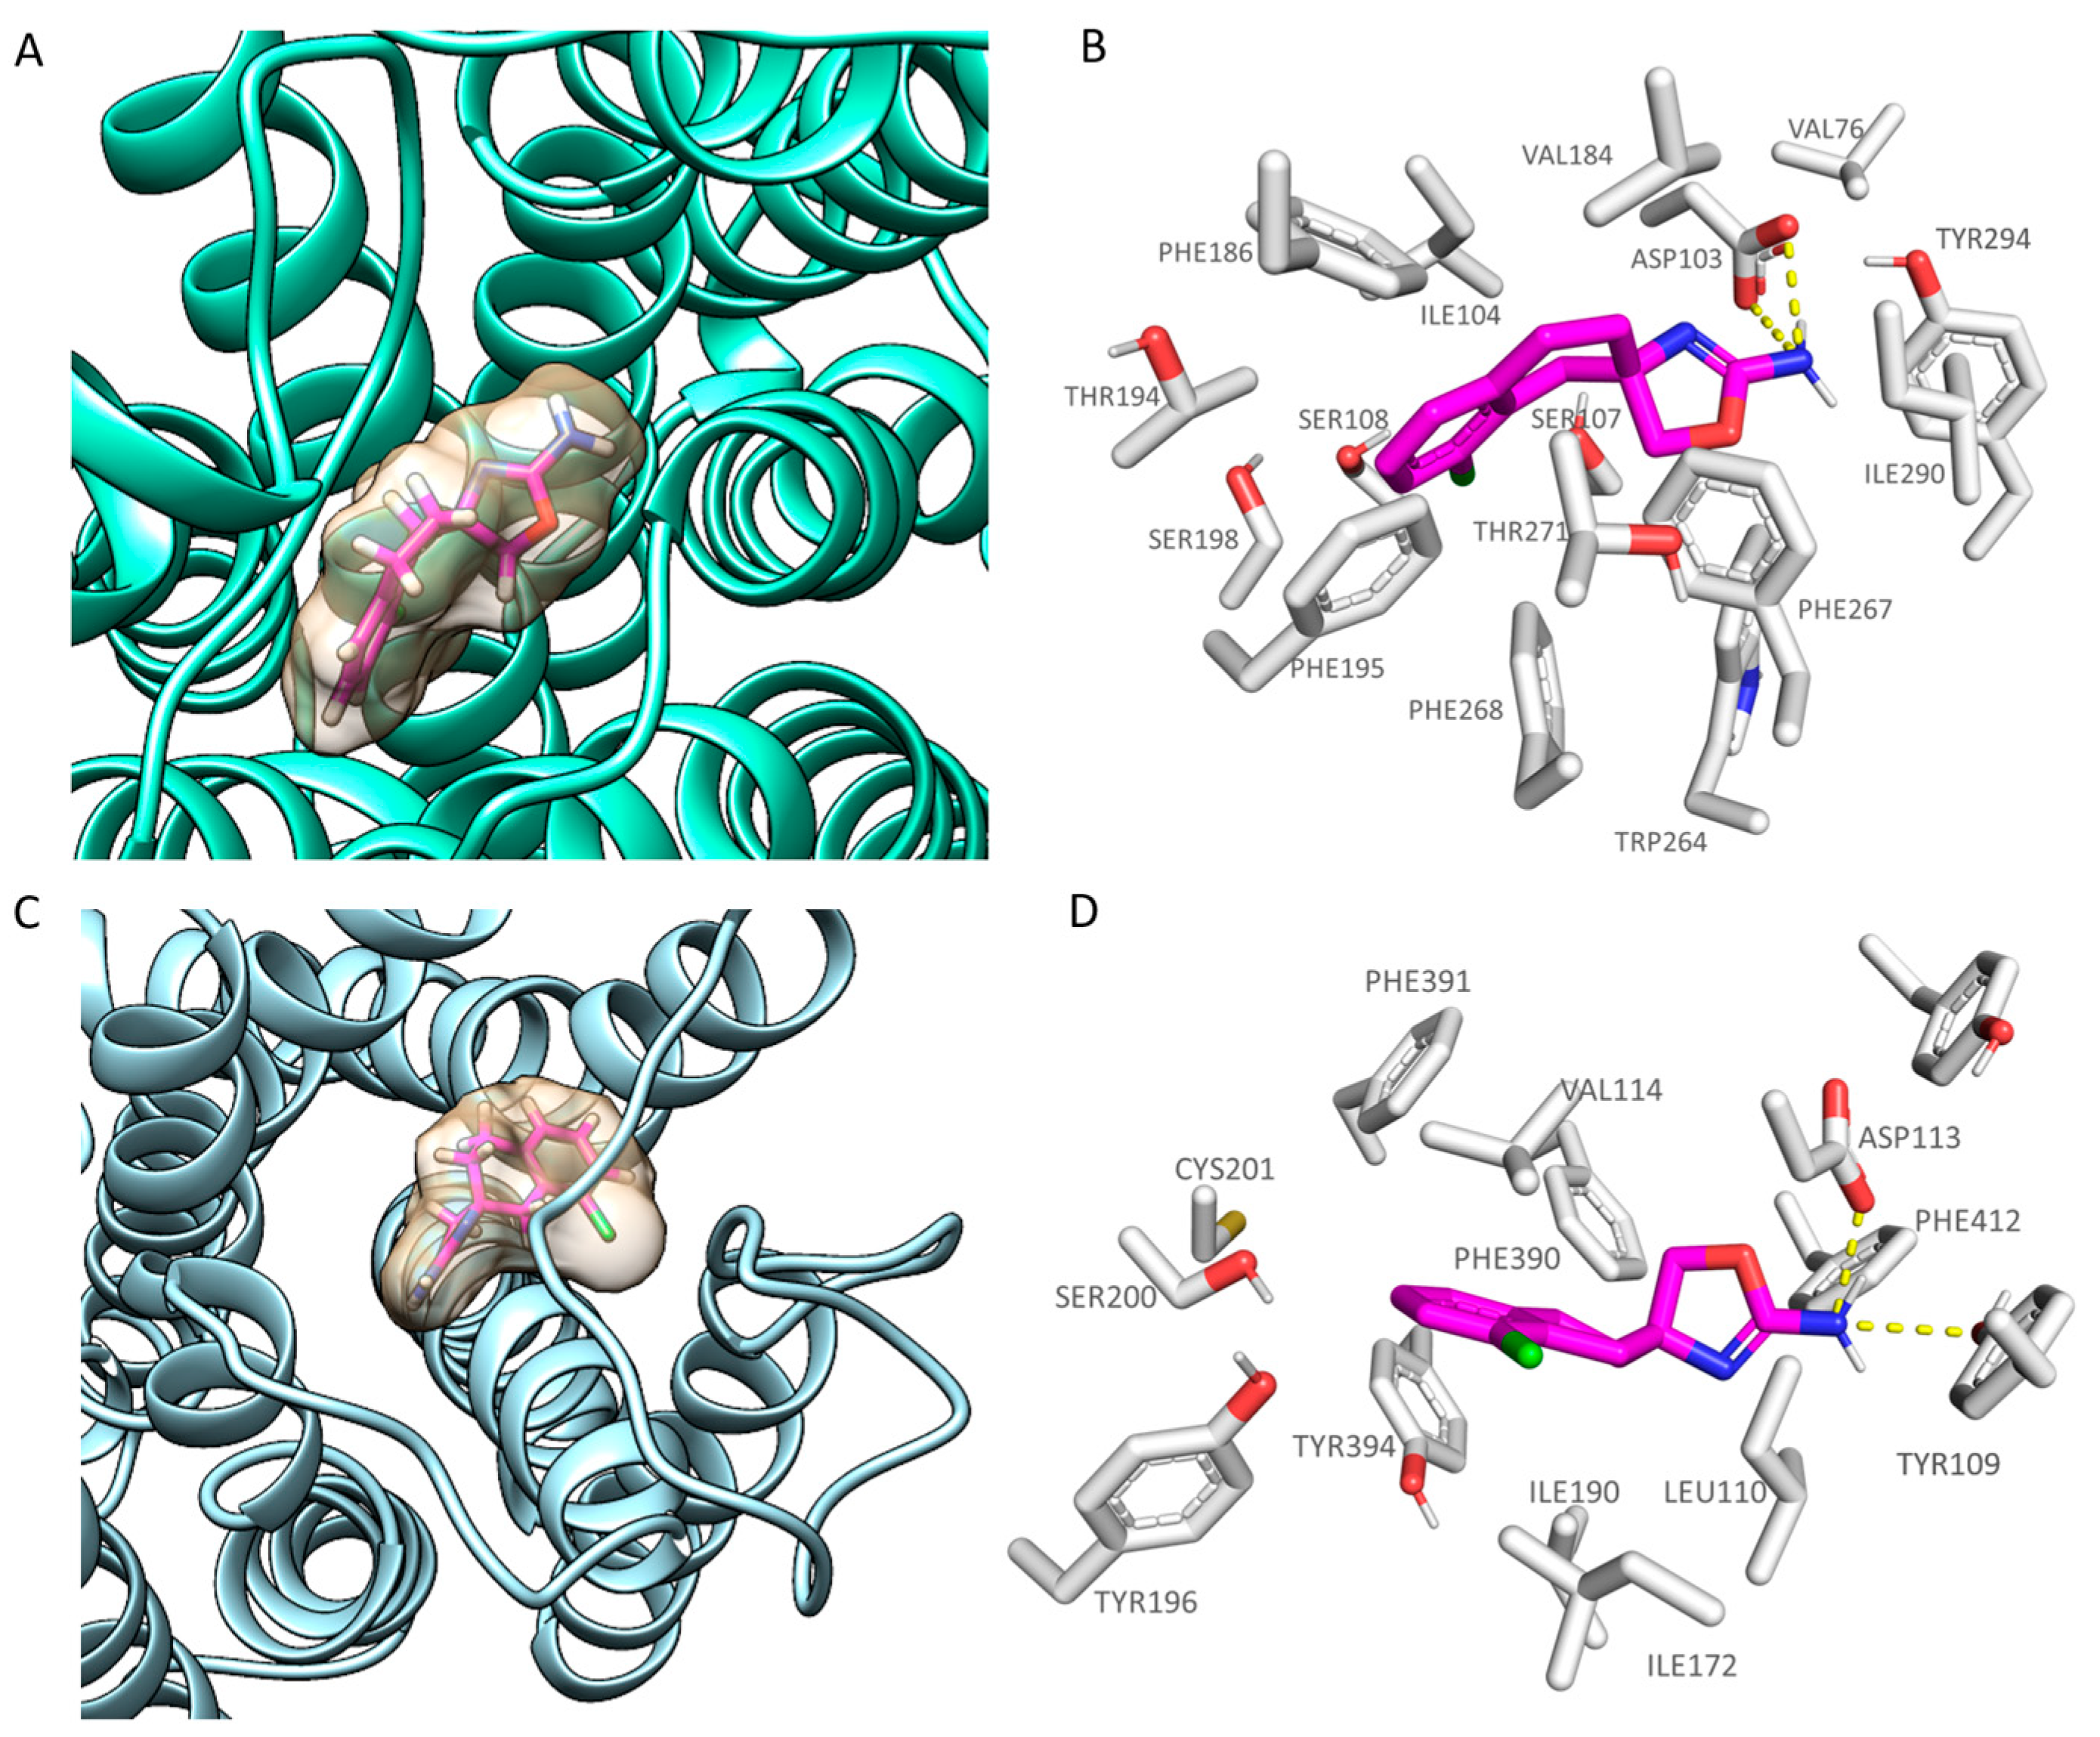
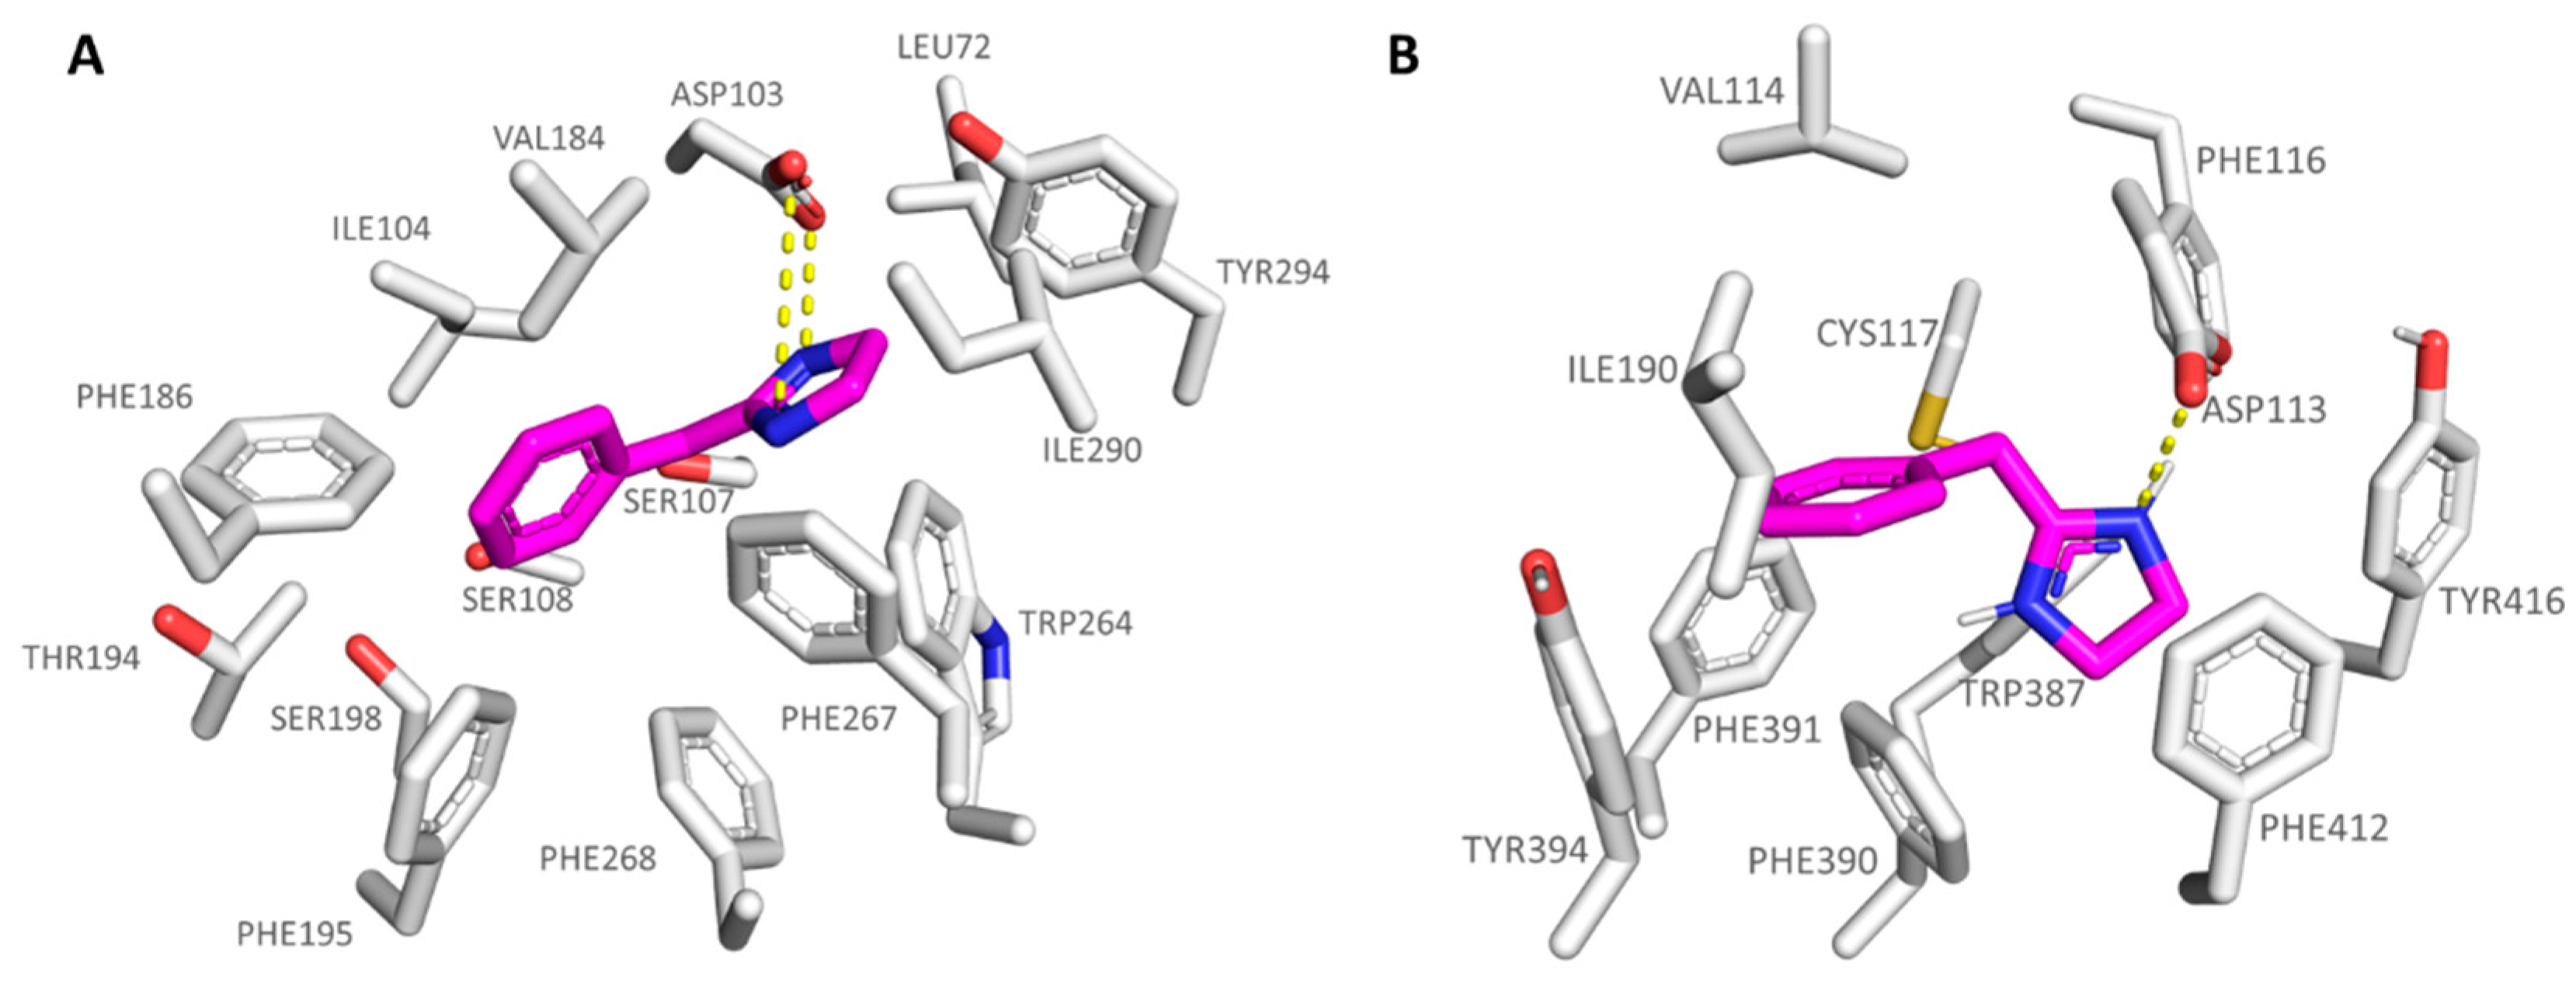
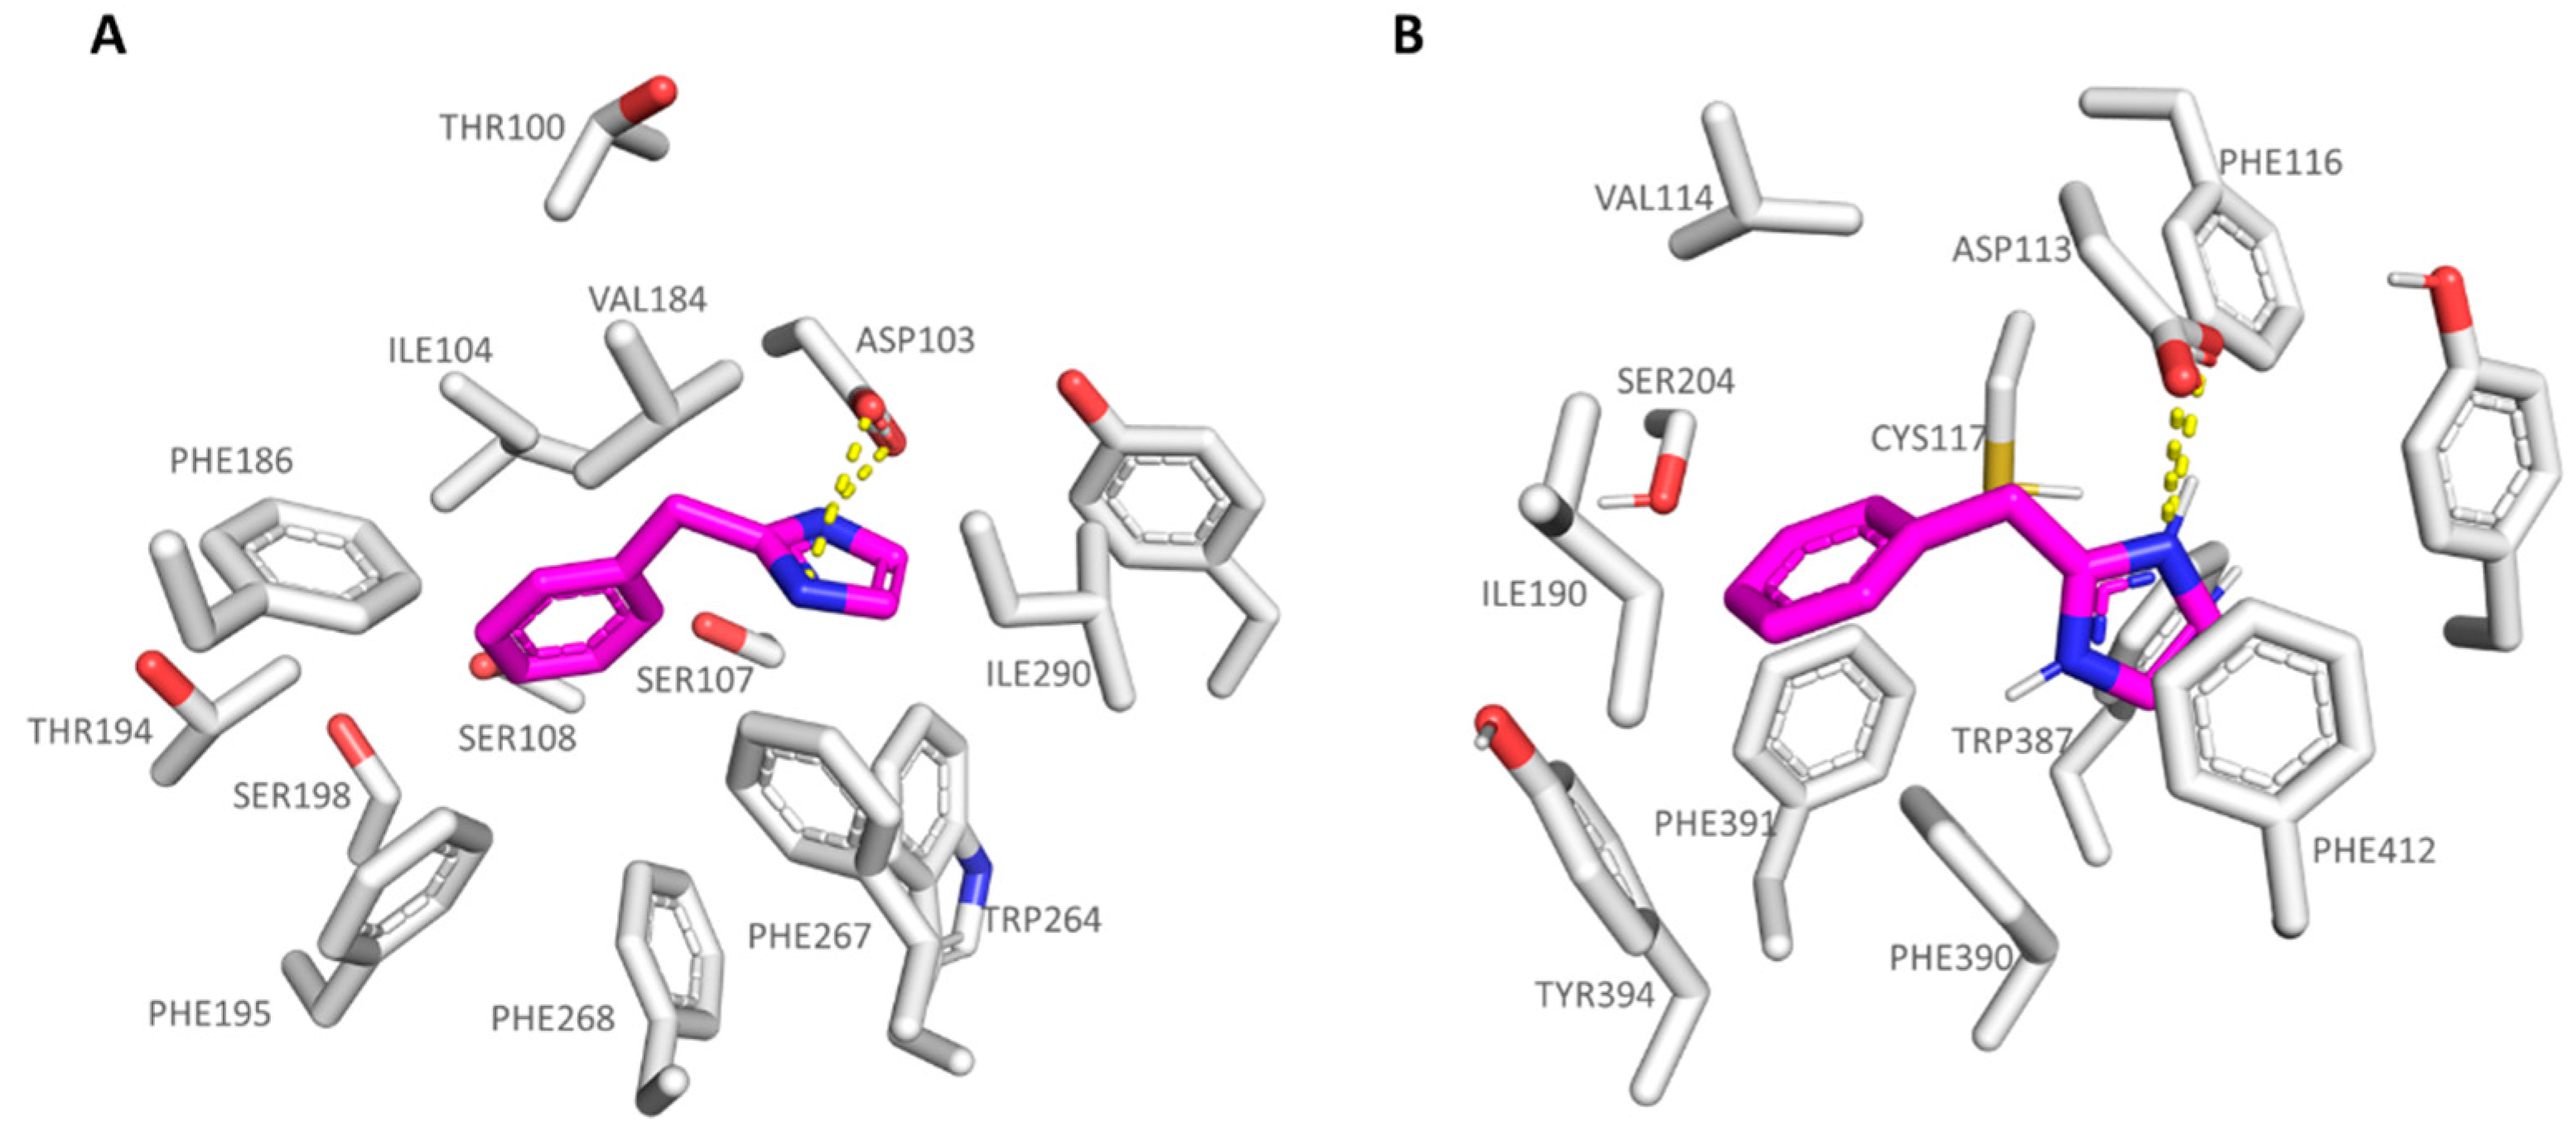
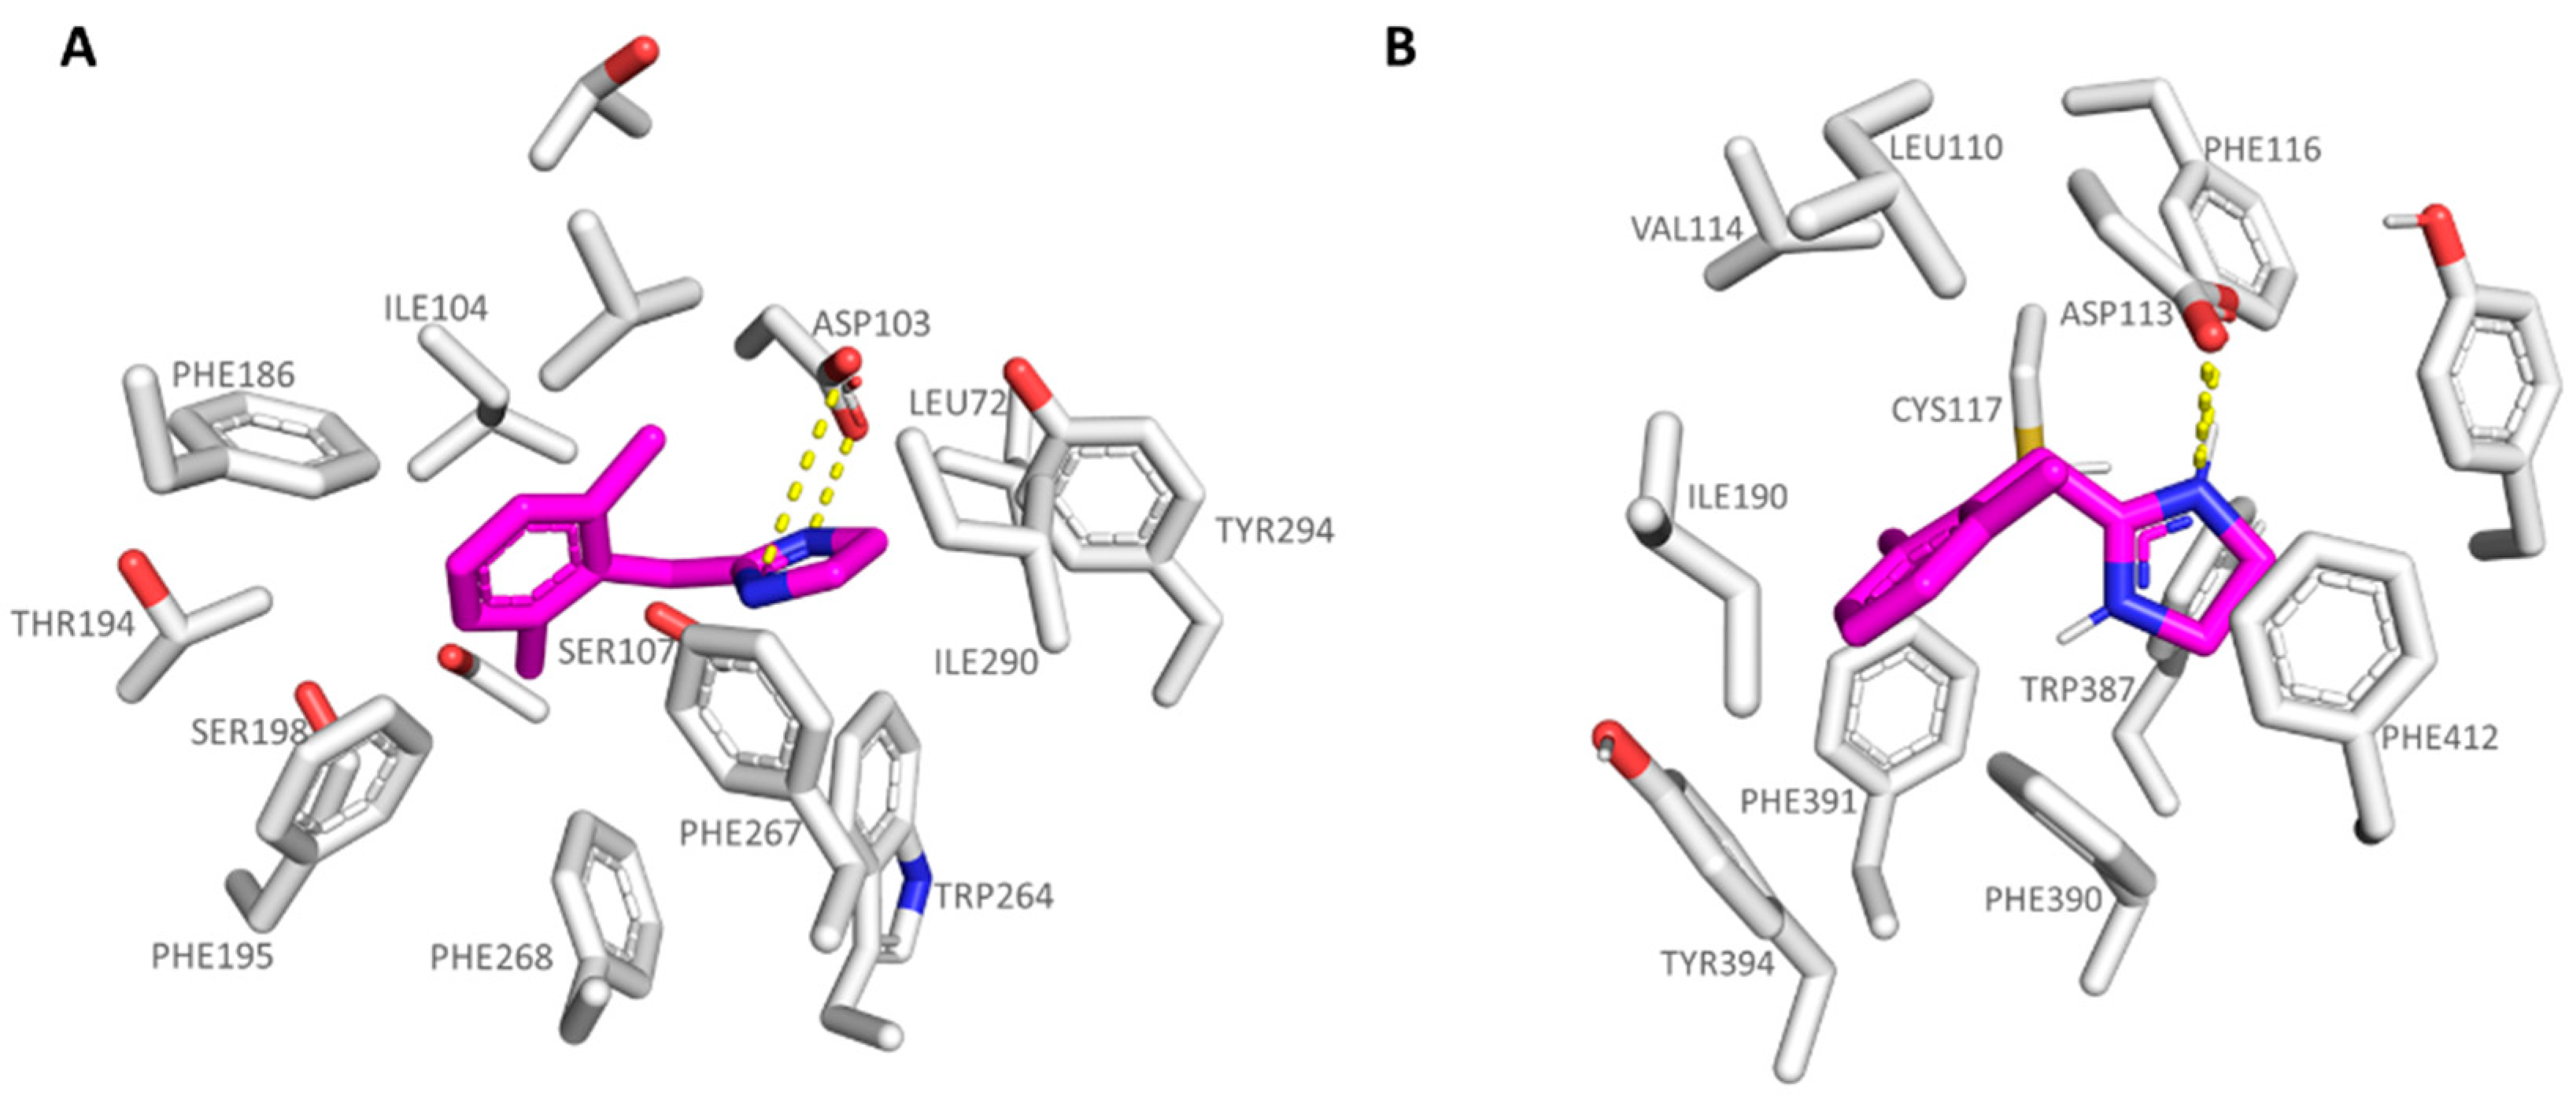
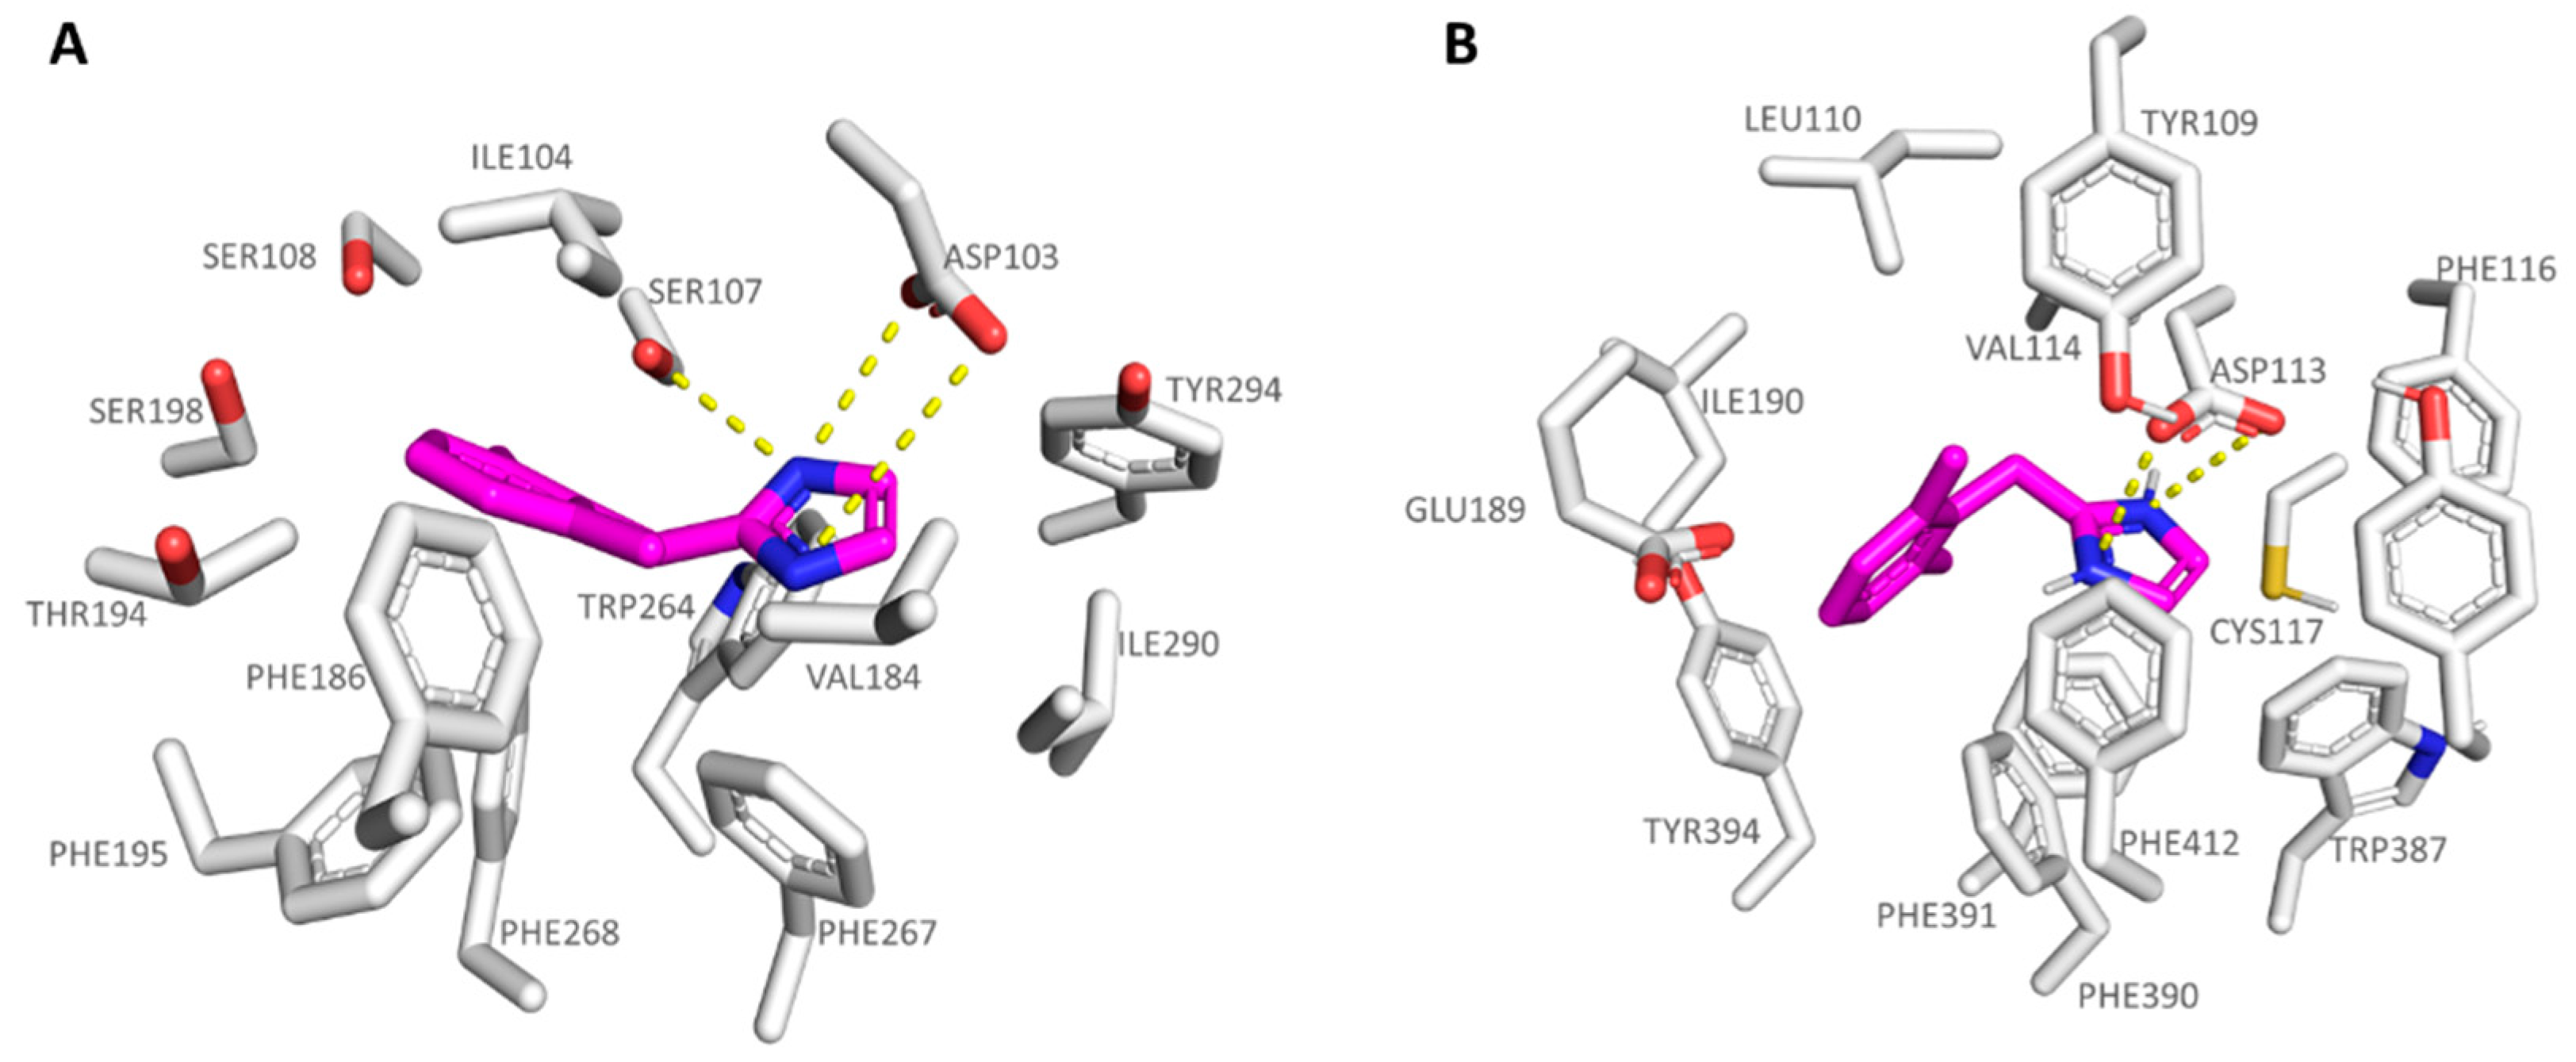
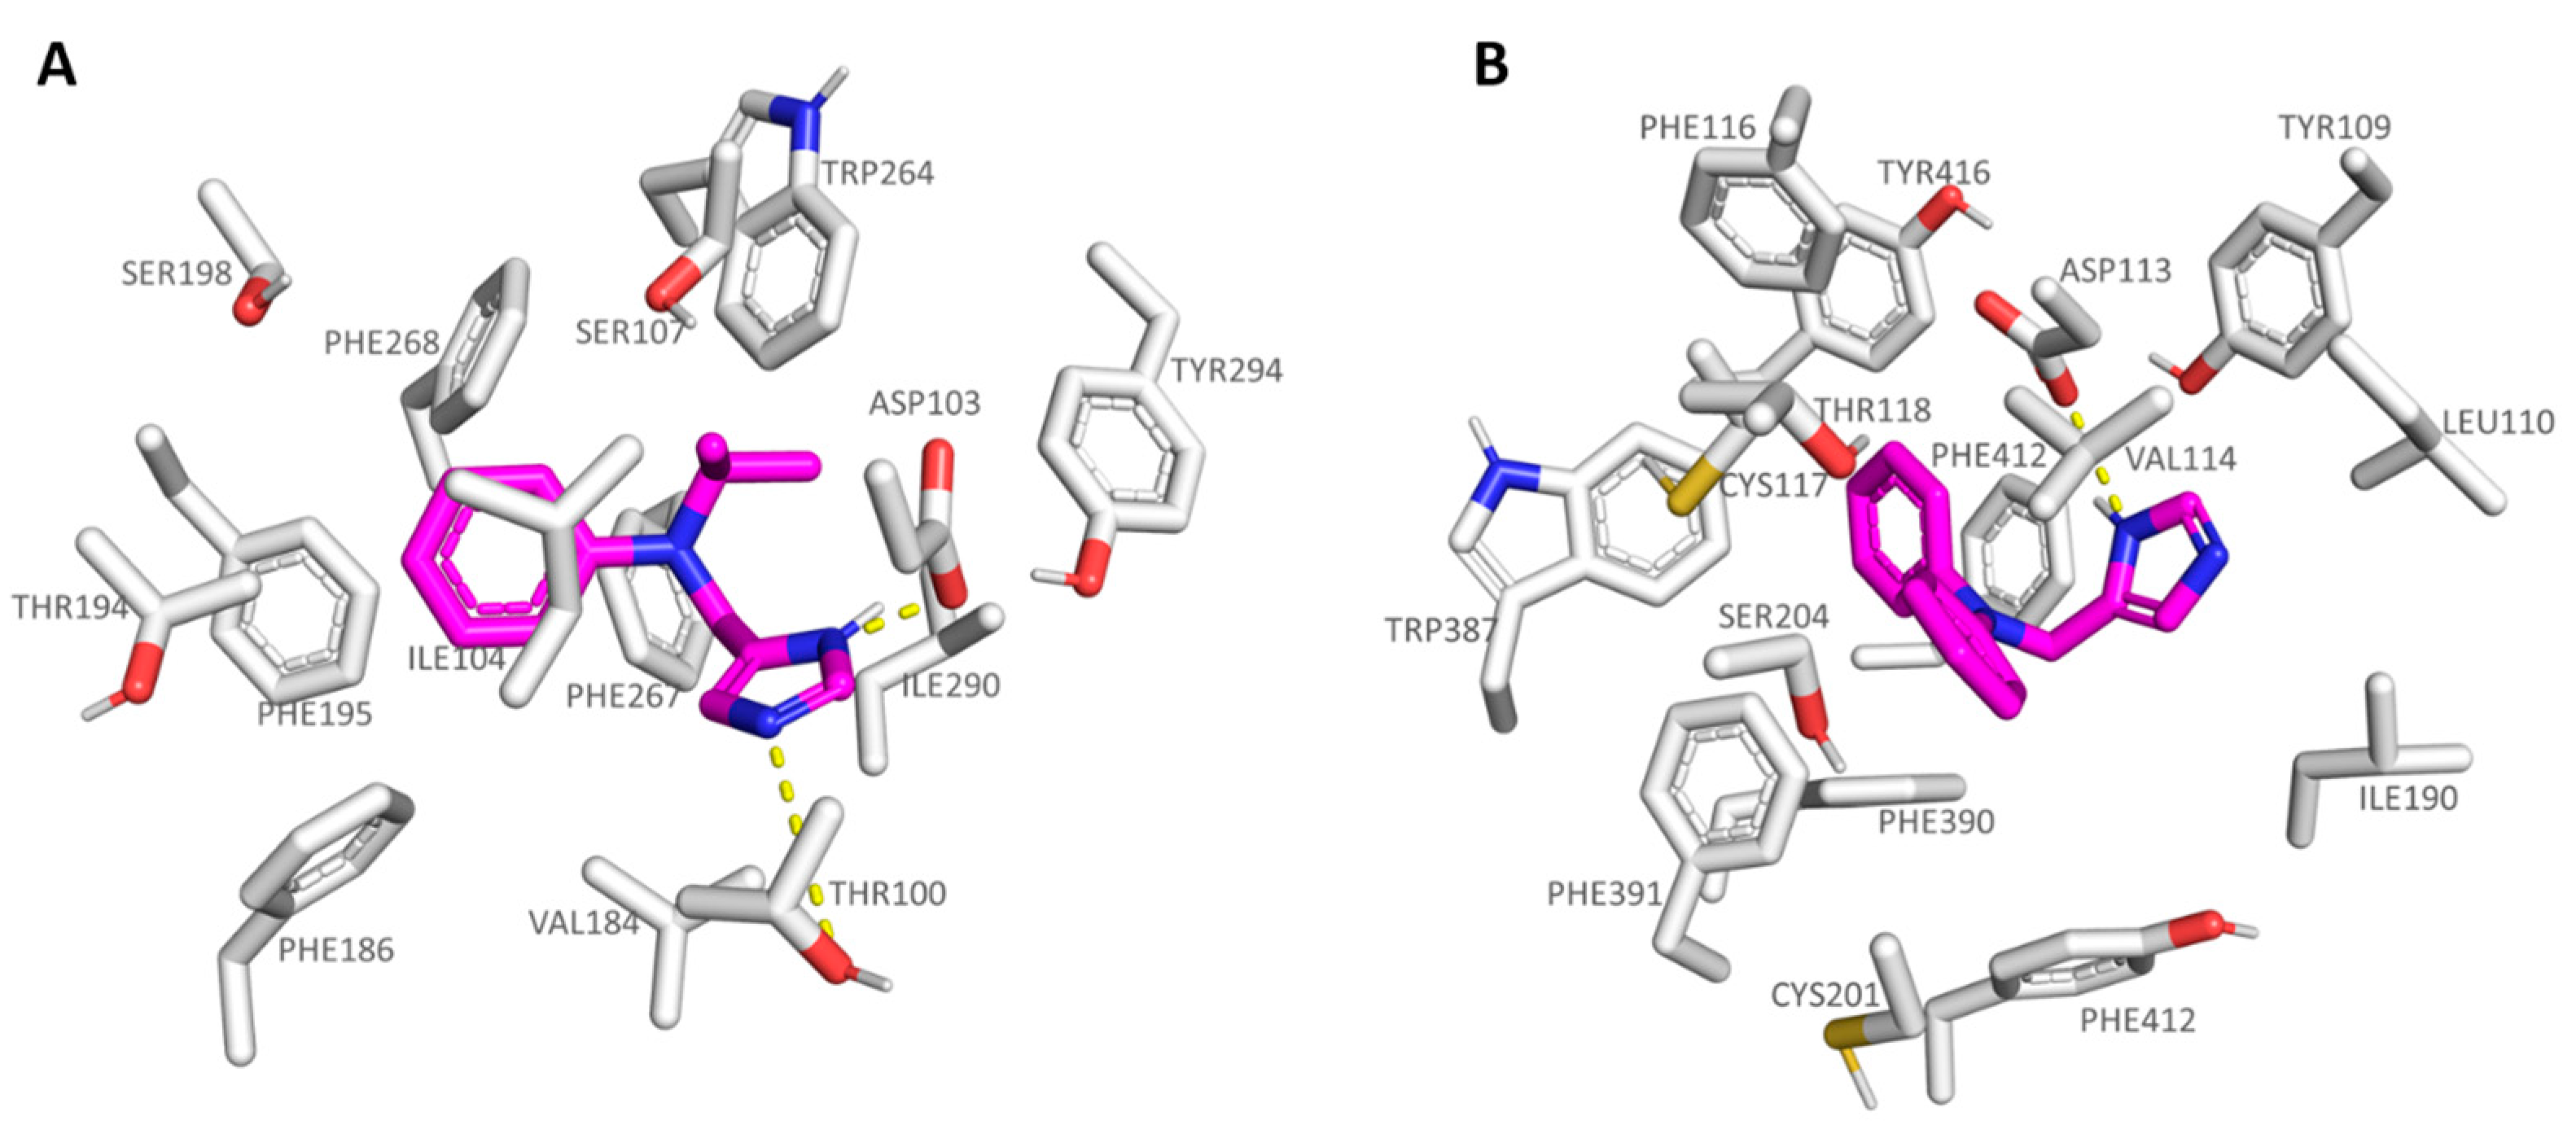
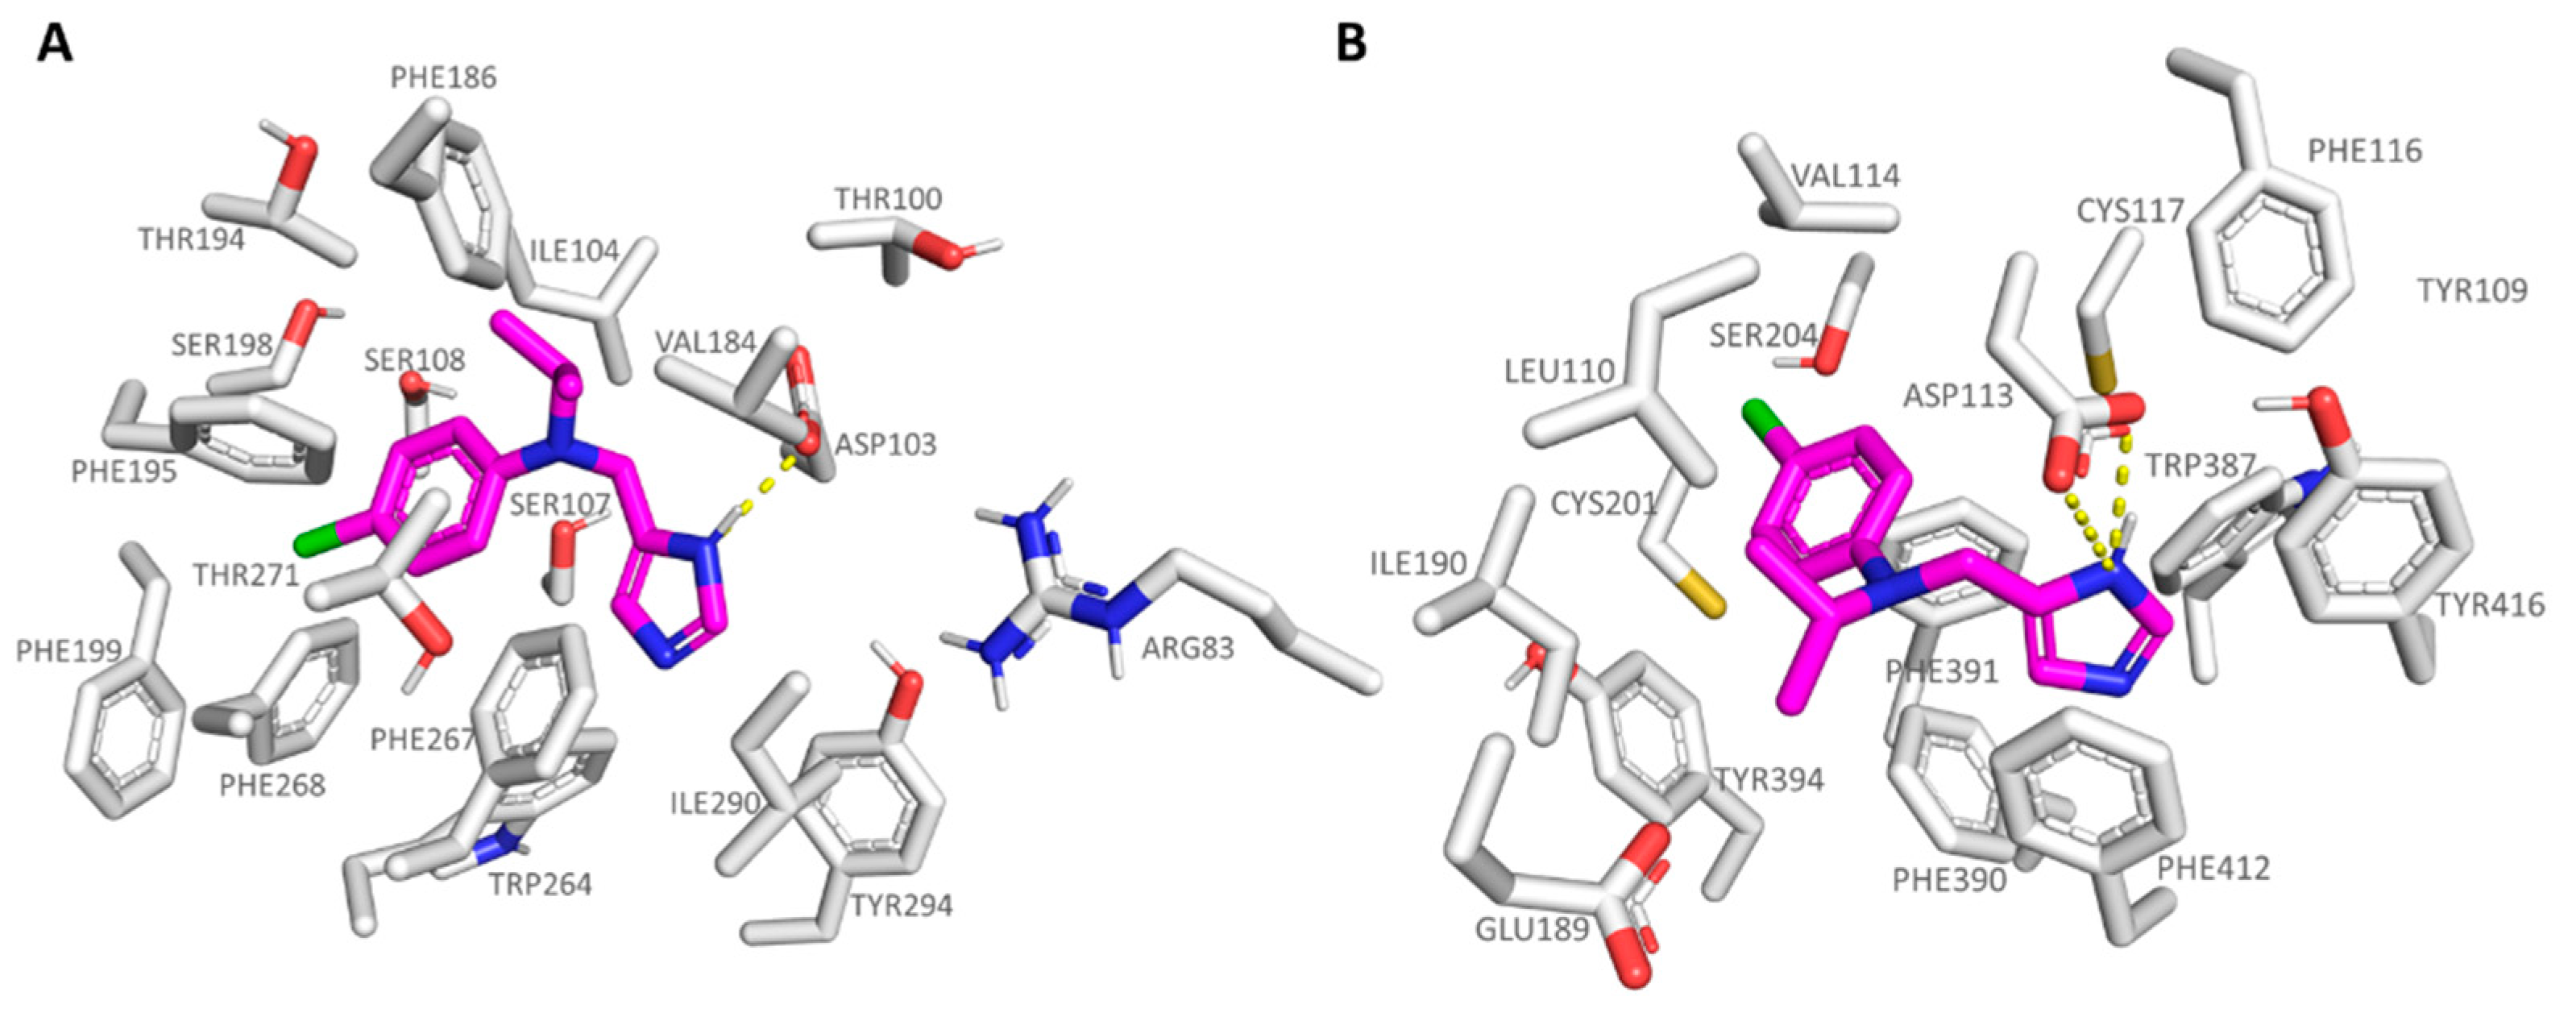
2.2. Comparative Molecular Docking of Dual Acting Compounds

With the aim of exploring the main features turning in hTAAR1 and α2-ADR targeting ability, we explored via molecular docking studies the previously mentioned imidazoline- and imidazole-containing derivatives (5a-5e, 6a-6e, 11-54) [35] at both the two proteins (see details of the calculated scoring functions in Tables S1 and S2). Thus, 45 compounds were considered, including the imidazoline compounds (5a-5e) and the imidazole analogues (6a-6e, 11-54) (see Table S3 for the chemical structure and biological activity).
The imidazoline series, group 5a-5d (hTAAR1 Ki = 82–1640 nM α2-ADR Ki = 25–204 nM) proved to be endowed with higher affinity and selectivity towards α2-ADR over hTAAR1. Conversely, the corresponding congeners 6a-6d showed higher affinity and selectivity for hTAAR1. The unsubstituted derivative 5a was the less potent of this series, featuring hTAAR1 Ki values = 1640 nM, gaining promising affinity towards the α2-ADR (Ki = 98.4 nM).
Docking results at the TAAR1 model reported variable docking poses, probably due to the absence of any substituent at the 5a phenyl ring. As a result, the compound was weakly stabilized at the receptor binding site, featuring the required H-bond with Asp103 by one of the nitrogen atoms of the imidazoline ring (see Figure 4A).
The heterocycle core was also projected towards the Trp264, Phe267, and Tyr294, detecting π-π stacking and cation-π contacts. The benzyl moiety was surrounded by the hydrophobic residues Ile104, Phe186, Phe154, and Phe195. Conversely, the 5a docking positioning at the α2-ADR revealed a maintained H-bond with the conserved Asp113 via the imidazoline ring, while the benzyl core was engaged in π-π stacking and Van der Waals contacts with Phe390, Tyr395, and Val114, Ile 190, respectively (see Figure 4B).
The imidazole-containing analogue 6a (hTAAR1 Ki = 400 nM, α2-ADR Ki = 1880 nM), as a selective TAAR1-targeting compound, was H-bonded to the hTAAR1 Asp103, moving the imidazole ring in proximity of Ser207, Trp264, and Phe267 (see Figure 5A). This kind of positioning was also allowed by the net of Van der Waals contacts stabilizing the benzyl pendant near Ile104.
Interestingly, 6a displayed a comparable docking mode also at the α2-ADR, being on the other hand weakly stabilized at the receptor cavity due to a low number of π-π contacts with the surrounding residues, and lack of polar contacts with the previous Ser207, herein Cys117; thus, 6a experiences lower affinity values for α2-ADR. Conceivably, it can also be explained by the presence of a valine residue (Val114) instead of an isoleucine in hTAAR1 (Ile104) in tandem with the deeper crevice of α2-ADR compared to hTAAR1 (Figure 5B).
The introduction of bulkier substituents onto the benzyl group, such as those featured by 5b-5d2-ADR Ki = 25–204 nM; hTAAR1 Ki = 82–500 nM) and 6b-6d (hTAAR1 Ki = 24–1390 nM; α2-ADR Ki = 162–2400 nM), ameliorated the compound affinity and selectivity towards the α2-ADR and TAAR1 proteins, respectively. In particular, the effective compound 5c was H-bonded to the hTAAR1 and α2-ADR key residue Asp103 and Asp113, respectively, while the dimethyl-benzyl moiety was stabilized at the receptors cavity via Van der Waals contacts with: (i) Ile104, Val184, Phe186, and Phe195 at TAAR1 and (ii) Ile110, Val114, Phe390, and Phe391 at α2-ADR (see Figure 6).
In addition, the 5c five-membered ring projected towards Tyr294 and Phe267 in hTAAR1 and Trp387, Phe390, and Tyr416 in α2-ADR, detecting cation-π contacts with the surrounding aromatic residues.
As shown in Figure 7A, this kind of positioning was also better guaranteed by the analogue 6c as the hTAAR1 agonist (6c hTAAR1 Ki = 36 nM), featuring higher hTAAR1 affinity values if compared to 5c, than as the α2-ADR targeting compound (6c α2-ADR Ki = 162 nM). At the α2-ADR, compound 6c experienced a limited number of π-π and cation-π stacking with the aforementioned Trp387, Phe390, and Tyr416, moving the terminal benzyl group much more in proximity of Ile110, Val114, and Ile190 (see Figure 7B).
Synthetic efforts described in the literature [35] were used to identify more potent TAAR1 targeting ligands, maintaining the aromatic imidazole ring instead of the previous imidazoline core as the main five-membered ring. Different substitutions at the previous benzyl group were also afforded in order to explore in more detail the SAR activity of this series of compounds.
Structural elongation of 4-substituted imidazole-based compounds such as the 13-39 derivatives (hTAAR1 Ki = 2–195 nM; α2-ADR Ki = 14.30–3040 nM) led to more potent and selective hTAAR1 agonists over α2-ADR. Conversely, most of the investigated 2-substituted imidazoles (49-54; hTAAR1 Ki = 68–4250 nM; α2-ADR Ki = 254–3760 nM) were endowed with higher selectivity towards the α2-ADR protein.
As regards the agonists 13-19 series, bearing the N,N-disubstituted aniline group, all of them were potent TAAR1 agonists, with 16 (hTAAR1 Ki = 22 nM; Ki α2-ADR Ki = 521 nM) being the most promising and selective derivative within the whole series. On the contrary, compound 18 (hTAAR1 Ki = 69 nM; Ki α2-ADR Ki = 62 nM) experienced comparable affinity towards the two biological targets. Based on our docking studies, 16 was engaged in H-bonds with Thr100 and Asp103 thanks to the imidazole nitrogen atoms, while the branched and hydrophobic isopropyl group was surrounded by the narrow pocket including Ile104 and Trp264. As a consequence, the aniline aromatic ring efficiently displayed π-π stacking with Phe186, Phe195, and Phe268 (see Figure 8A).
Conversely, compound 18, bearing a flat rigid phenyl group onto the aniline moiety, was H-bonded to Asp113 in α2-ADR, moving the previously mentioned aromatic ring towards the deep receptor cavity delimited by Val114, Val197, and Phe391 (see Figure 8B). On this basis, it is thought that the introduction of small, folded groups (such as the 16 isopropyl group) as pendants at the aniline nitrogen atom would be better arranged within the hTAAR1 cavity than at α2-ADR. On the contrary, bulkier and rigid groups such as the phenyl ring of 18 would be better stabilized within the deeper α2-ADR binding site.
Accordingly, the branched 16 and 17 analogues (hTAAR1 Ki = 22–32 nM; Ki α2-ADR Ki = 128–521 nM) displayed higher selectivity for hTAAR1 than the agonists 18 and 19 (hTAAR1 Ki = 69–110 nM; Ki α2-ADR Ki = 62–330 nM).
In accordance with this information, ring cyclization on the previous aniline nitrogen atom led to effective TAAR1 and α2-ADR ligands, such as 20-21 (hTAAR1 Ki = 12–35 nM; α2-ADR Ki = 4.90–48 nM) endowed with a proper hydrophobic core as the bicyclic ring. To pursue the design of selective hTAAR1 targeting compounds, a new series of imidazoles was reported by focusing on the previously described effective isopropyl group in presence of further moieties at the aniline aromatic portion. The 22-35 series (hTAAR1 Ki = 2–128 nM; α2-ADR Ki = 14.30–3040 nM) included a halogenated aniline ring in the presence of the isopropyl group or tert-butyl substituent, leading in any case to effective and selective hTAAR1 ligands. As shown in Figure 9A, compound 24 (hTAAR1 Ki = 6 nM; α2-ADR Ki = 840 nM) properly moved the imidazole core near Asp103, while the branched aliphatic substituent was surrounded by Ile104 and Phe186. On the other hand, the terminal halogenated phenyl ring was engaged in π-π stacking and polar contacts with the aromatic Phe199, Trp264, and Phe268.
In the case of the α2-ADR protein, compound 24 maintained the mandatory key contact with Asp113, while the p-Cl-phenyl ring proved to be lacking the π-π stacking with aromatic residues, being oriented towards Ser204 and Val114 (Figure 9B). Conversely, the m-Cl substituted analogue 232-ADR Ki = 288 nM) efficiently placed the aromatic ring near Trp387 and Phe412, gaining π-π contacts.
The introduction of the heterocyclic ring instead of the aniline moiety, as shown by the 36-39 series (hTAAR1 Ki = 12–195 nM; α2-ADR Ki = 252–3300 nM), proved to be beneficial, leading to the discovery of very selective TAAR1 ligands endowed with high affinity values for the desired receptor. Indeed, compound 37 (hTAAR1 Ki = 12 nM; α2-ADR Ki = 74 nM) displayed additional H-bonds with Thr100 and Ser107, thanks to the imidazole ring and the nitrogen atom of the pyridine substituent Figure S5.
Beyond the reported SAR data, most of the investigated 2-substituted imidazoles (49-54; hTAAR1 Ki = 68–4252 nM; α2-ADR Ki = 254–4352 nM) were more selective for the α2-ADR protein than hTAAR1, except for compound 53 (hTAAR1 Ki = 68 nM; α2-ADR Ki = 4352 nM). As shown in Figure S6A, this compound maintained the required key contact with Asp103, while the imidazole ring and the terminal phenyl core detected π-π stacking with Trp264, Tyr294, Phe186, and Phe195, respectively.
On the other hand, the analogues 50 and 51 (hTAAR1 Ki = 710–1270 nM; α2-ADR Ki = 254–497 nM) were better stabilized at the α2-ADR protein via Van der Waals contacts, involving the aliphatic substituent onto the aniline nitrogen atom and Val114 and Cys117 being the imidazole ring H-bonded to Asp113 (Figure S6B).

2.3. QSAR Analyses and Pharmacophore Modeling

In the search for new bioactive compounds, the computational methods, including quantitative structure–activity relationship (QSAR) analyses, represent a useful tool to predict the potency, the selectivity, and also the cytotoxicity profile of known and novel compounds [30,53].
In this context, we proceeded with the development of two QSAR models to identify the compound structural features influencing hTAAR1 (model A) or α2-ADR (model B) binding affinity as experienced by dual acting compounds. These derivatives were collected by the literature [35,36] and referred to the previously mentioned imidazole- and imidazoline-containing derivatives shown in Table S3.
The two QSAR models were built considering the compound positioning observed by docking calculations. The results are expected to be a useful tool for the preliminary evaluation of further novel analogues and to guide the development of a new series of derivatives.
In detail, about 300 molecular descriptors (2D and 3D parameters) were calculated by means of MOE2019.01 software [54].
The bidimensional (2D) descriptors include seven groups, regarding physical properties (2D-I), subdivided surface areas (2D-II), atom and bond counts (2D-III), connectivity-based descriptors (2D-IV), partial charges descriptors (2D-V), pharmacophore features descriptors (2D-VI), and the so-called adjacency and distance matrix descriptors (2D-VII). Concerning 3D-descriptors, these are divided into five groups, including the potential energy (3D-I), MOPAC (3D-II), surface area (3D-III), volume and shape (3D-IV), and conformation-dependent charge descriptors (3D-V). In this study, the choice of the most relevant descriptors to explain the bioactive behavior (within model A and B) was pursued, applying a statistical approach previously described [55].
For each model, the corresponding final equation was derived by splitting the compounds into a training and a test set using the Kennard–Stone design [56], one of the most exploited algorithms for guiding the choice of a subset of samples with a distribution as close as possible to the uniform distribution. In particular, the Kennard–Stone algorithm was applied, adding the response vector (hTAAR1 pKi in model A and α2-ADR pKi in model B) as a further column to the matrix of the collected descriptors in order to guarantee that the training set compounds were distributed evenly within not only in the space described by the descriptors, but also by the response values [55].
Among the 333 molecular descriptors, the most informative ones were identified using a multivariate variable selection method. In particular, iterative stepwise elimination PLS (ISEPLS) [57] was applied to evaluate the relevance of the predictors with regard to the possibility of predicting the response variable y (pKi; hTAAR1 in model A and α2-ADR in model B). Following this approach, 10 and 11 descriptors were retained for model A and model B, respectively, as described in the following section.

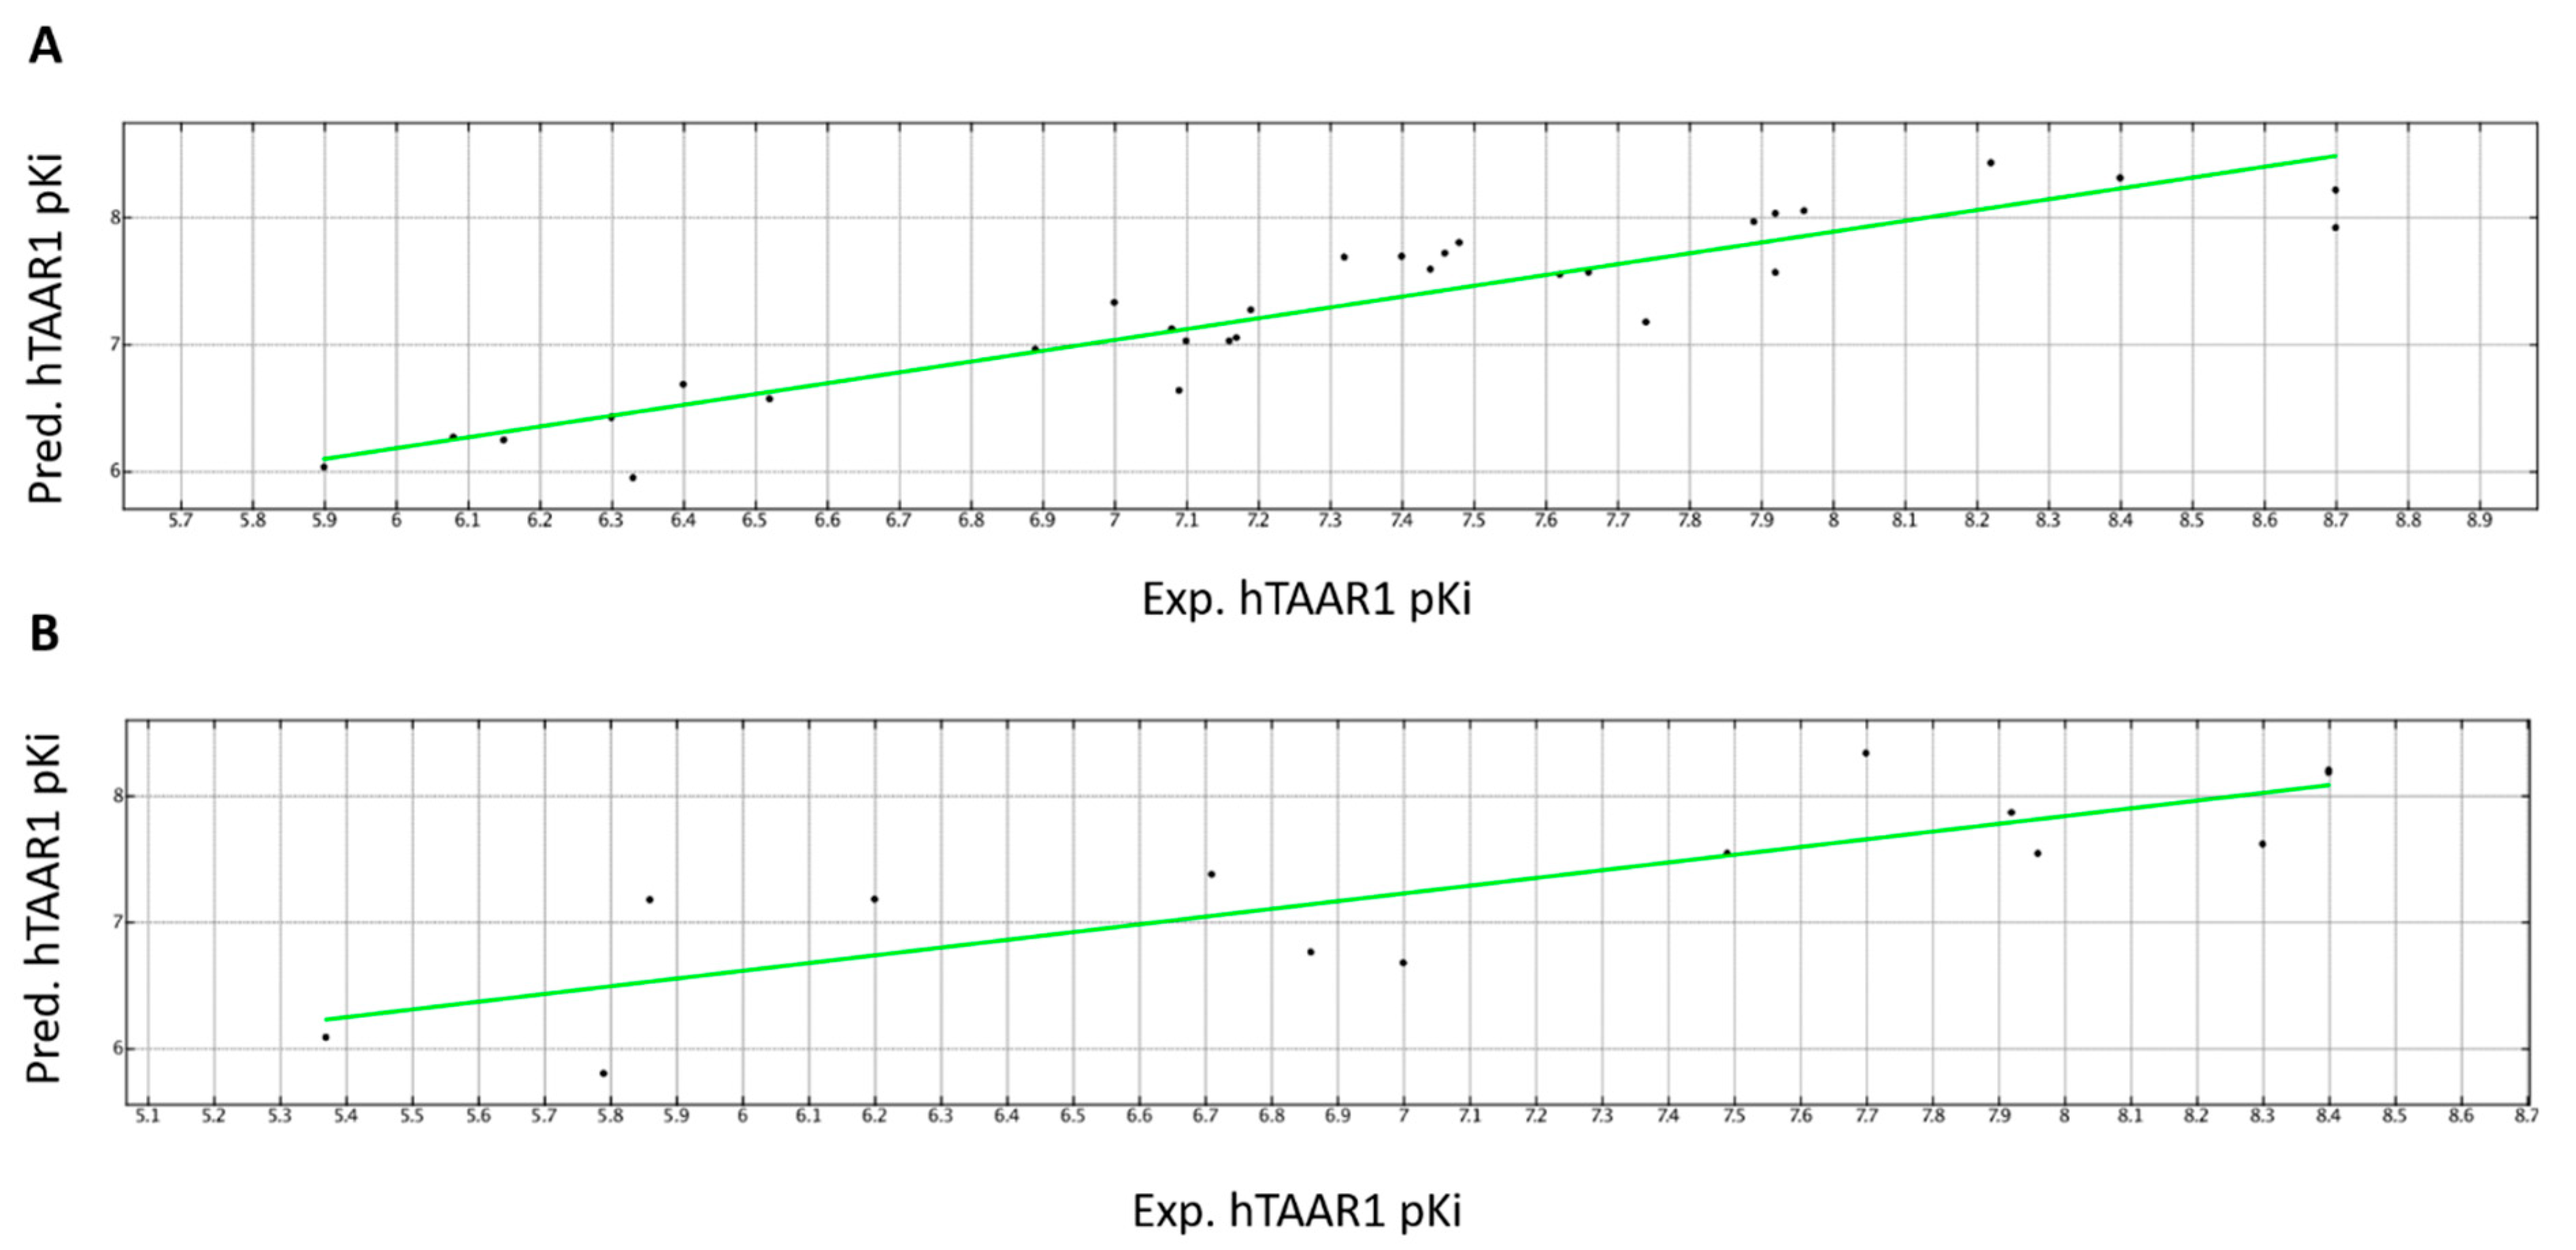
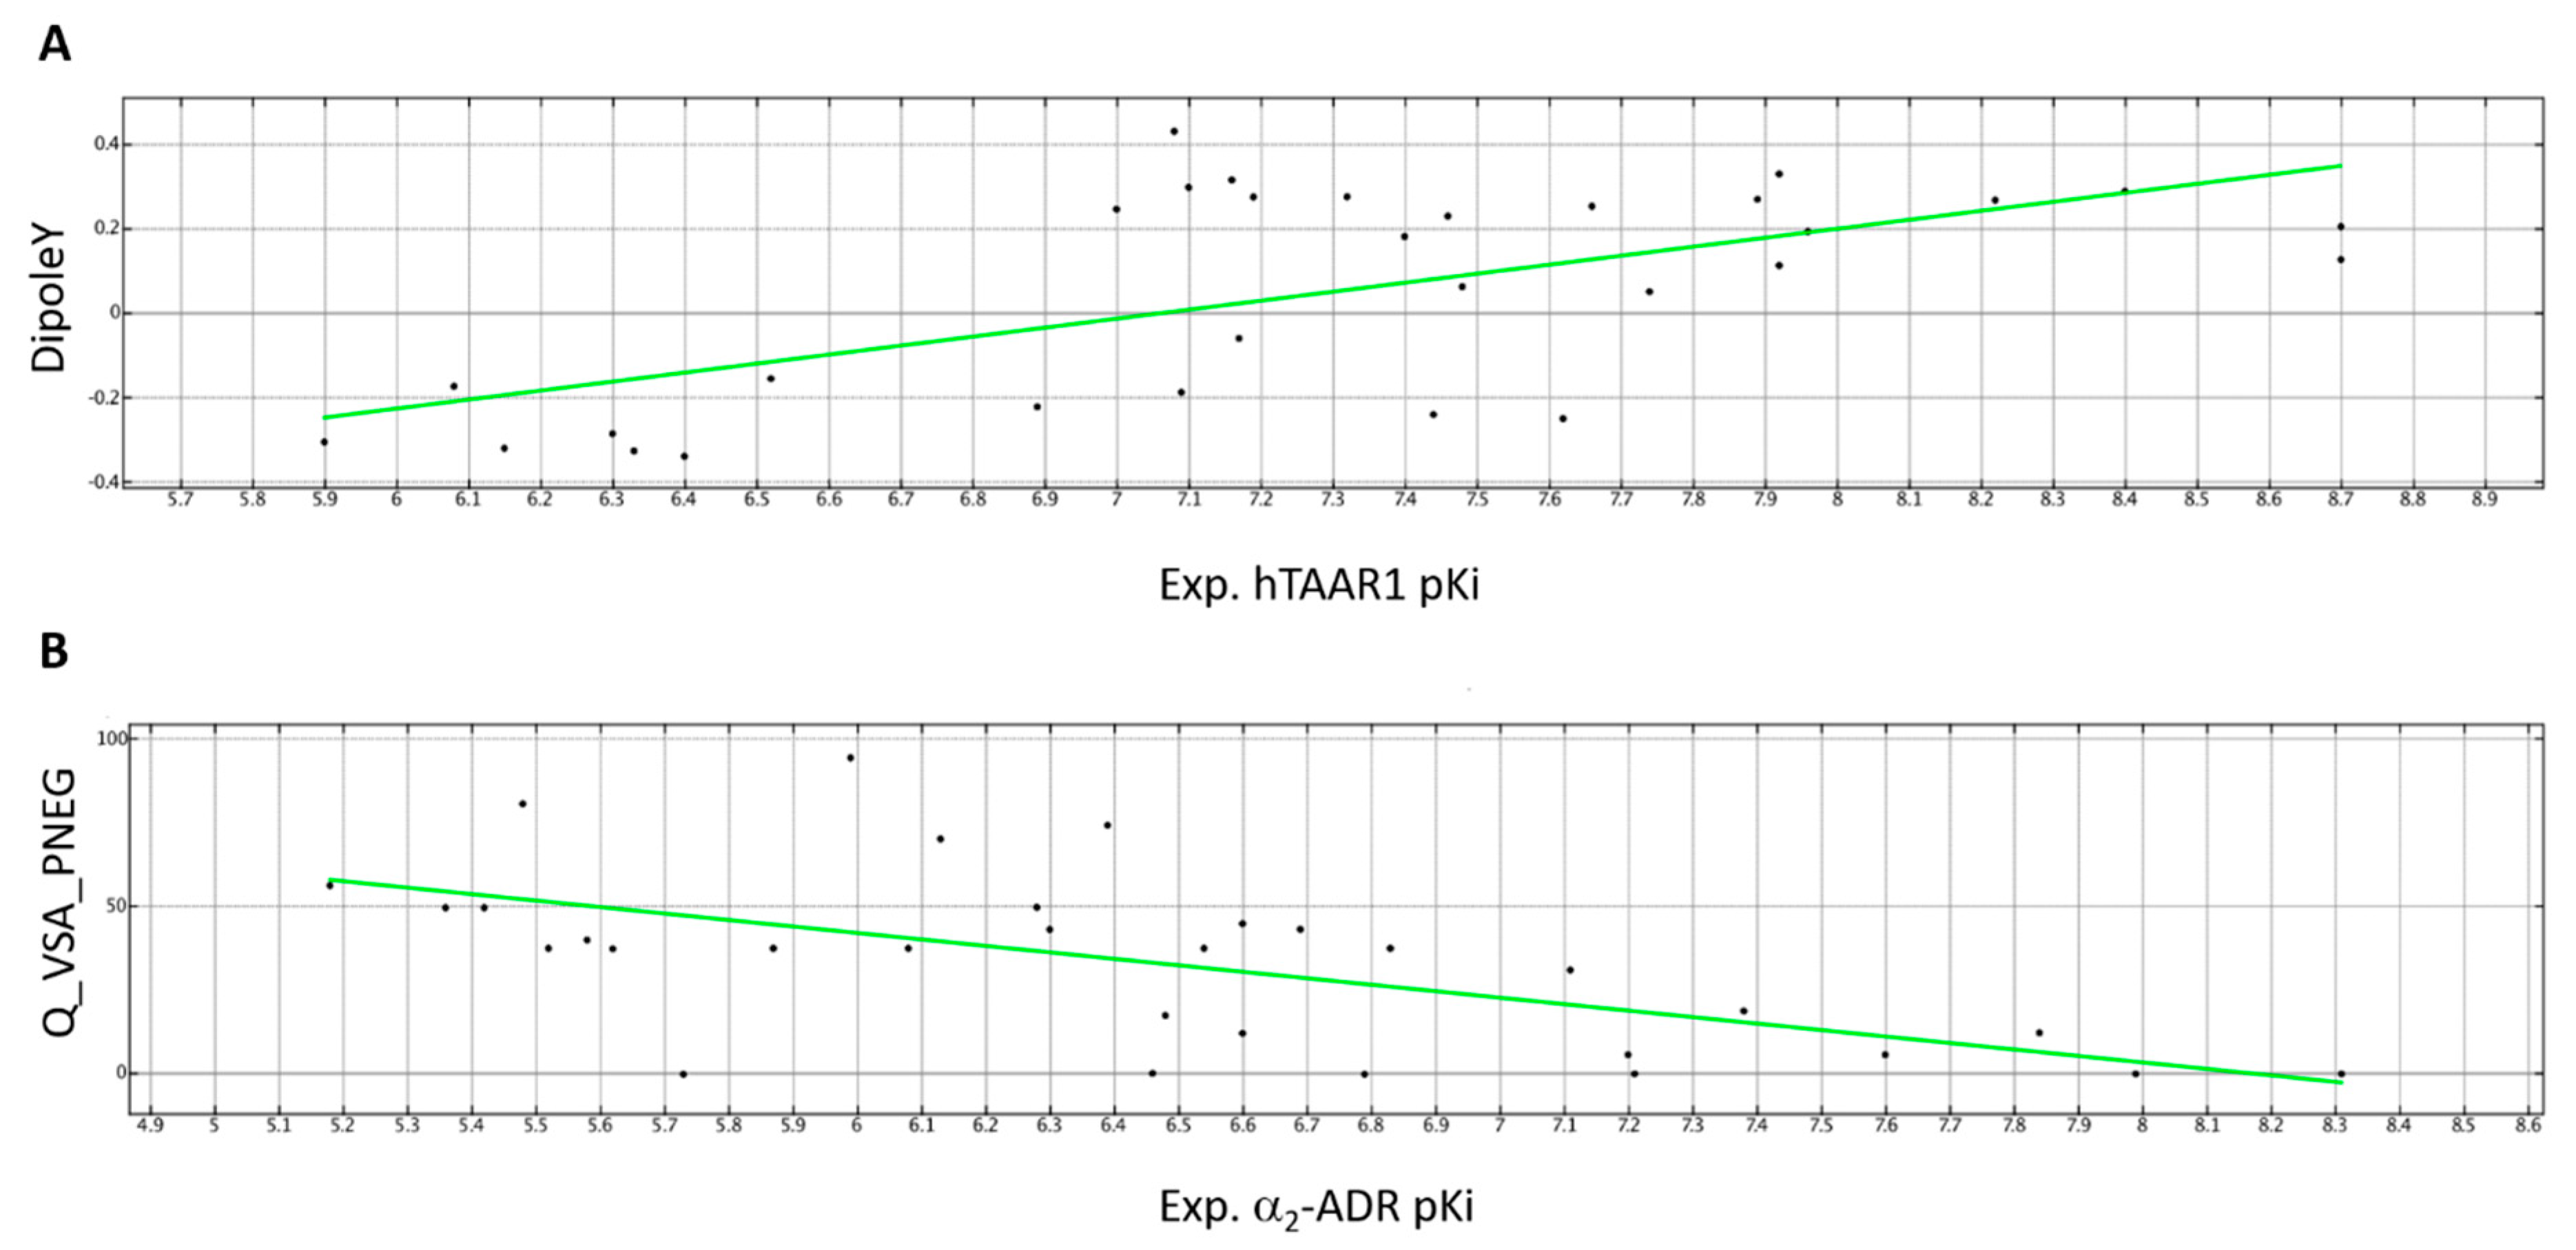
2.3.1. QSAR Model A—hTAAR1 Binding Affinity

Based on the procedure described above, model A was derived taking into account 10 descriptors selected by using ISEPLS as a multivariate variable selection method, including most of them with 3D parameters. Indeed, six of the selected molecular descriptors fall in the 3D cluster, while the other ones in the 2D. Details of the selected descriptors as well as their relevance in the developed QSAR model discussed as follows, are shown in Table 2.
The regression model was calculated using PLS analysis and dividing the whole dataset of 45 compounds into a training set of 31 molecules (5b-5e, 6a, 6c, 6d, 12, 13, 15, 16, 18-20, 22, 24, 26-29, 31-35, 37, 39, 50-53) used to develop the QSAR model and into a test set, including 14 derivatives (5a, 6b, 6e, 11, 14, 17, 21, 23, 25, 30, 36, 38, 49, 54) to evaluate the reliability of the regression model. The final PLS model gave a cross validated r2 (r2cv) = 0.74, a non-cross validated r2 (r2ncv) = 0.85, root mean square error (RMSE) = 0.282, and a test set r2 (r2pred) = 0.65. The predicted and experimental hTAAR1 Ki for all the compounds is reported as tables, along with the collected descriptors, as shown in Table S4.
A perspective of the performance featured by this model is reported in Figure 10, as distribution of the predicted hTAAR1 affinity values (Pred.pKi), with respect to the experimental ones (Exp.pKi), of the training set and test set compounds.
Quantitatively, the role played by the selected descriptors with respect to the TAAR1 targeting ability is explained by the following equation (Equation (1)).
Predicted hTAAR1 Ki = 5.88651 −0.78177 * GCUT_SMR_0 −0.02455 * E +2.02712 * DipoleY +0.80749 * DipoleZ −0.00279 * DCASA −0.96171 * Q_RPC −1.76365 * Q_VSA_FHYD +0.13838 * SlogP_VSA4 −0.69487 * vsurf_EDmin1 +0.30105 * vsurf_IW5.

2.3.2. QSAR Model B—α2-ADR Binding Affinity

Regarding the α2-ADR regression model, the model B was developed using 11 descriptors, selected by ISEPLS; these descriptors include most of the 2D parameters. Indeed, seven of the selected molecular descriptors were in the 2D cluster, while the other ones in the 3D. Details of the selected descriptors in tandem with their importance in the developed QSAR model are discussed as follows and shown in Table 3.
The regression model B was developed using PLS analysis on the 31 compounds assigned to the training set (5b-5e, 6a, 6c, 6d, 12, 13, 15, 16, 18-20, 22, 24, 26-29, 31-35, 37, 39, 50-53) in order to develop the QSAR model, while the other 14 included in the test set (5a, 6b, 6e, 11, 14, 17, 21, 23, 25, 30, 36, 38, 49, 54) were used to assess the reliability of the regression model. The final PLS model provided a cross validated r2 (r2cv) = 0.43, a non-cross validated r2 (r2ncv) = 0.80, root mean square error (RMSE) = 0.358, and a test set r2 (r2pred) = 0.55. The predicted and experimental α2-ADR Ki for all the compounds is reported as tables, along with the collected descriptors, as shown in Table S5.
A perspective of the performance featured by this model is reported in Figure 11, as distribution of the predicted α2-ADR affinity values (Pred.pKi), with respect to the experimental ones (Exp.pKi), of the training set and test set compounds.
Quantitatively, the role played by the selected descriptors to affect the α2-ADR targeting ability is explained by the following equation (Equation (2)).
Predicted α2-ADR pKi = 7.00986 +0.56459 * GCUT_SMR_1 −1.49103 * balabanJ −0.02896 * E_tor +0.04376 * Q_VSA_FHYD −0.08643 * Q_VSA_PNEG +0.06695 * Q_VSA_POL +0.02122 * vsa_other +0.03314 * SlogP_VSA3 +0.32188 * vsurf_ID1 +1.04420 * vsurf_ID7 +0.29374 * vsurf_IW4
By a comparison of the two models, hTAAR1 binding affinity values increase in the presence of polar ligands (via DipoleY parameter) and of a limited number of positively charged groups in order to build a chemical structure characterized by a similar charge delocalization onto the whole molecule (see DCASA descriptor). This could be achieved by the choice of p-substituted phenyl rings instead of o-substituted analogues. Accordingly, compounds 24 (hTAAR1 Ki = 8.22 M, DipoleY = 0.2702; DCASA =23.7212) and 29 (hTAAR1 Ki = 7.89 M, DipoleY= 0.2724; DCASA= 155.0814) show higher Ki values than the corresponding congener 22 (hTAAR1 Ki = 7.40 M, DipoleY = 0.1838; DCASA = 57.1006) and 27 (hTAAR1 Ki = 7.74 M, DipoleY = 0.0533; DCASA = 160.3320).
This kind of substitution should be accompanied by hydrophobic properties, as featured by branched substituents rather than by flexible groups, which should be discouraged (as suggested by the Q_VSA_FHYD descriptor).
Conversely, the α2-ADR targeting ability could be improved by the introduction of polar and positively charged moieties or electron-donor features, as suggested by the Q_VSA_PNEG descriptor and Q_VSA_POL. Thus, the introduction of electron-rich atoms is discouraged. Accordingly, the α2-ADR agonist 12 (a2-ADR Ki = 7.49 M; Q_VSA_PNEG = 0.1369) featuring an alkyl-based spacer between the two terminal rings is endowed with higher Ki values than the corresponding amino-containing 132-ADR Ki = 6.46 M; Q_VSA_PNEG = 0.2738). The presence of an overall hydrophobic structure is in any case encouraged (Q_VSA_FHYD); the choice of flexible or extended substituents is preferred to branched groups, as suggested by the balabanJ and E_tor descriptors. On this basis, the choice of the ethyl-based spacer as experienced by 122-ADR Ki = 7.49 M; balabanJ = 1.6145; Q_VSA_FHYD = 0.9532; E_tor = 0.0625) rather than the methyl one as featured by 112-ADR Ki = 7.30 M; balabanJ = 1.7164; Q_VSA_FHYD = 0.9484; E_tor = 3.3058), seems to be encouraged, allowing for an extended ligand positioning. Notably, all this information proved to agree with those previously observed through docking studies, supporting the development of imidazoline and imidazole derivatives as more suited to α2-ADR and hTAAR1 ligands with respect to other heterocycles.
A schematic representation of the role played by the most relevant descriptors affecting hTAAR1 (DipoleY, RI = 1.0000) and α2-ADR (Q_VSA_PNEG, RI = 1.0000) binding affinity, respectively, is reported in Figure 12.
A comparison of the opposite role played by the only common descriptor herein described in both the two models A and B (Q_VSA_FHYD) is shown in Figure S7.

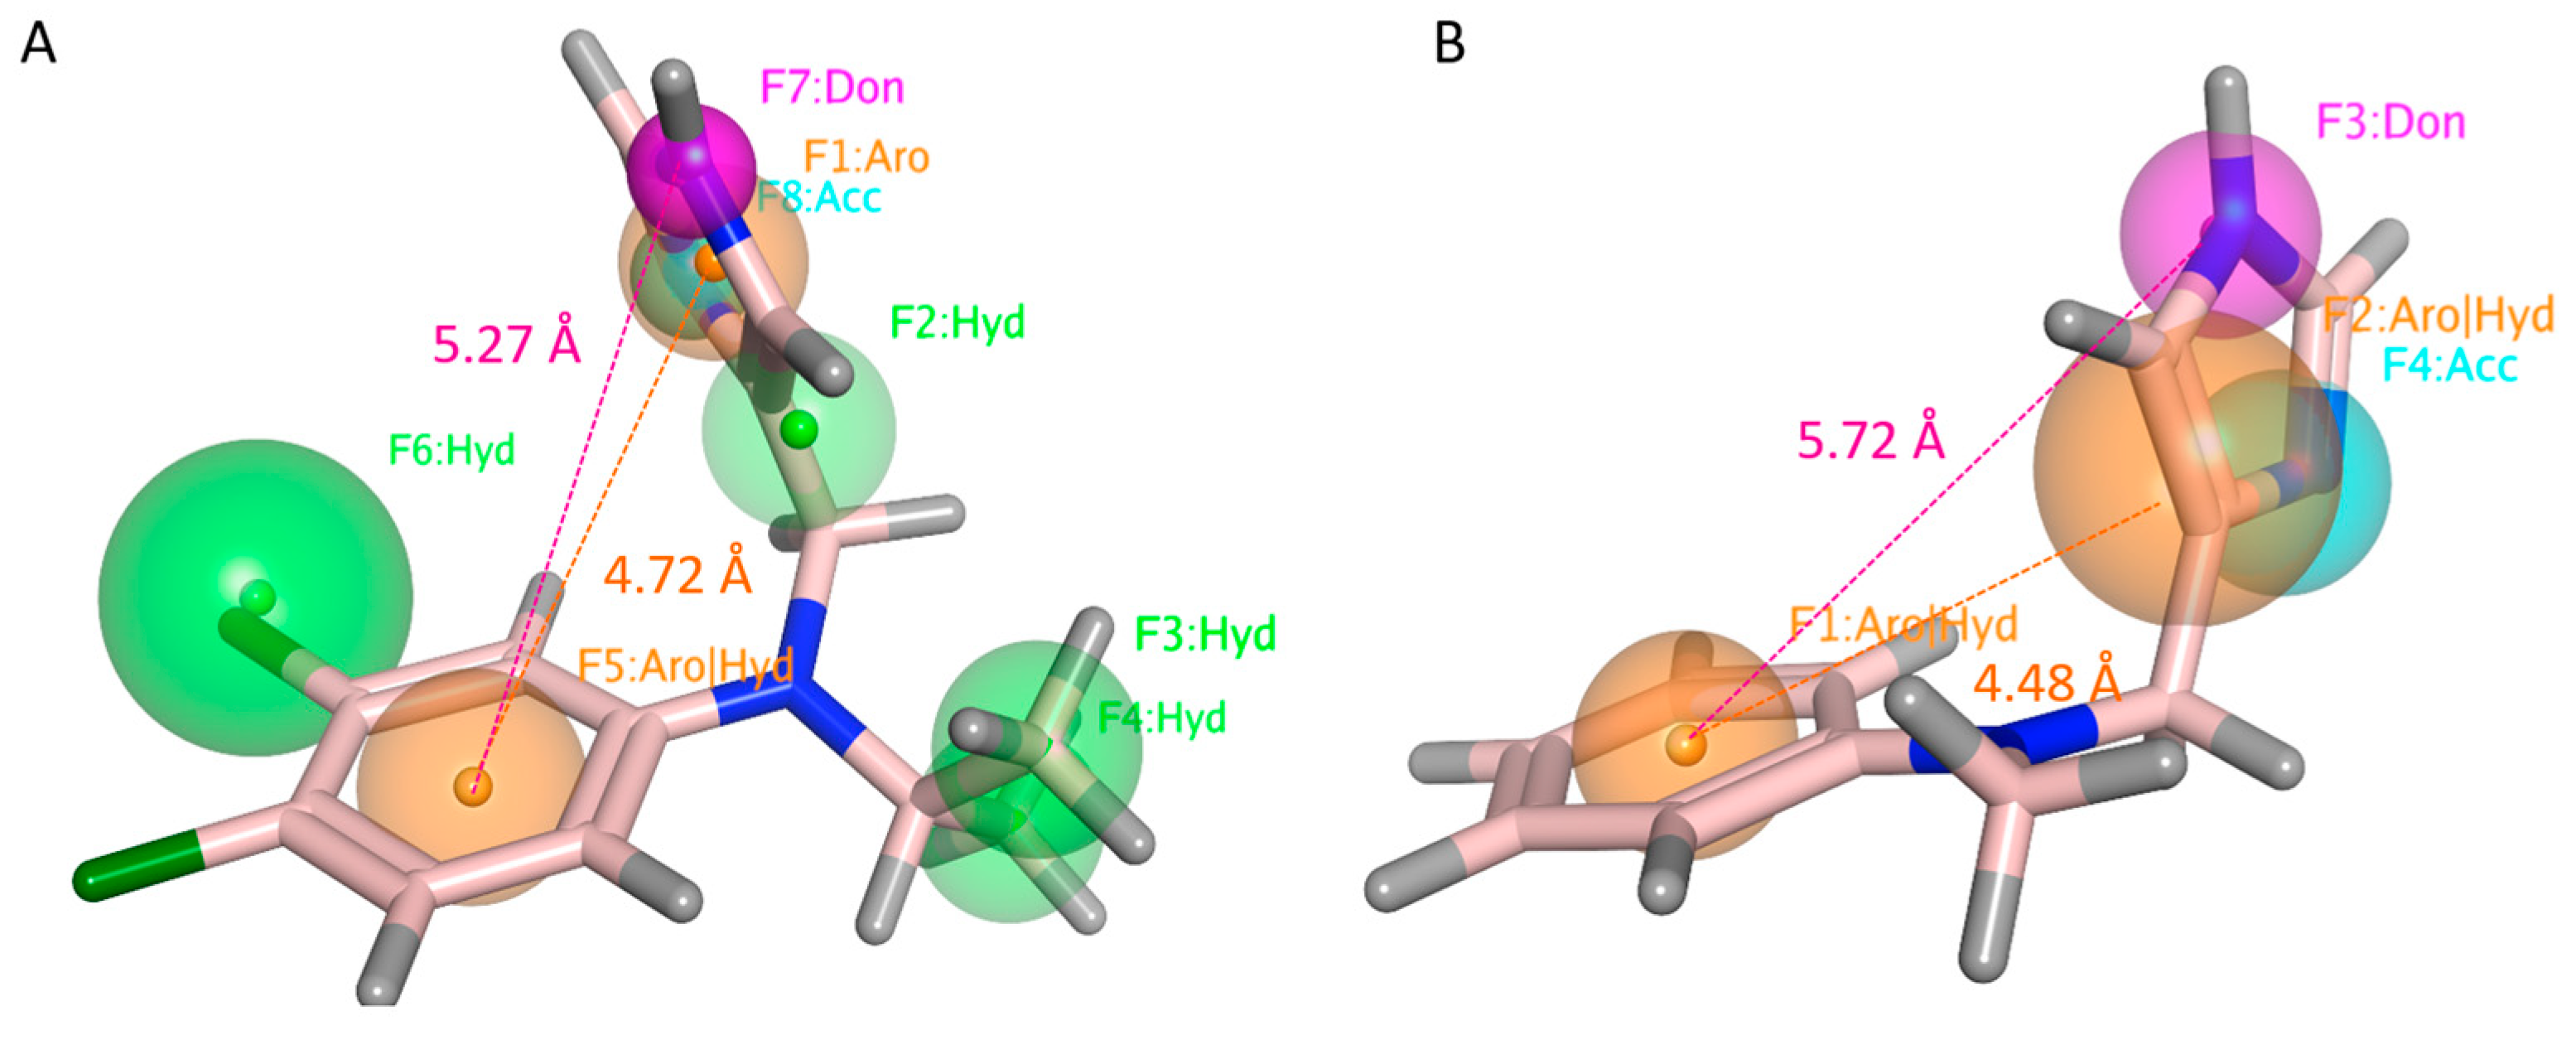
2.3.3. Pharmacophore Modeling

As a perspective of the molecular docking results and the QSAR analyses, the rational design of hydrophobic structures is expected to turn in dual acting hTAAR1 and α2-ADR derivatives while the introduction of polar moieties with a moderate number of positive-charged centers would allow more selective hTAAR1 ligands to be designed. Conversely, enrichment of positive-charged moieties onto the hydrophobic main core should improve the α2-ADR agonism ability. Notably, these data are in line with our previous findings concerning the TAAR1 pharmacophore model (PM), as determined on a set of oxazoline derivatives [31]. Indeed, the presence of a bulky aromatic ring tethered to a further hydrophobic core, bearing H-bonding features, was reported by us as pivotal to achieve the TAAR1-targeting ability.
On this basis, herein we reported novel PMs developed on these dual acting hTAAR1 and α2-ADR agonists, namely PM_A (hTAAR1) and PM_B (α2-ADR). PM_A included the most promising hTAAR1 agonists (pKi > 8 M) such as 12, 23-26, 30, and 34, while PM_B was derived based on the most potent α2-ADR ligands (pKi > 7.5 M), namely 5b, 12, 14, 20, and 33.
For each model, only the pharmacophore features (F) shared by all the selected compounds was reported as aromatic or hydrophobic groups (AroǀHyd) or only hydrophobic- (Hyd) or aromatic- cores (Aro), or H-bonding acceptor (Acc) or donor (Don) groups. As shown in Figure 13, compounds 25 (hTAAR1 pKi = 8.4 M) and 14 (hTAAR1 pKi = 7.75 M) were taken as reference in PM_A and PM_B because of their promising affinity values, respectively.
As regards PM_A, the presence of two aromatic or hydrophobic cores (F1:Aro and F5:AroǀHyd) is required in the imidazole/imidazoline-based TAAR1 ligand, such as 25, within a distance of 4.27 Å (Figure S8A). In detail, F1:Aro should be enriched with H-bonding features as exemplified by F7:Don and F8:Acc, placed at 2.22 Å to each other. In particular, the donor moiety is required for TAAR H-bonding via Asp103 residue. In PM_A, F7:Don should be located 5.27 Å from the terminal F5:AroǀHyd group. Interestingly, the introduction of additional hydrophobic substituents is required to gain promising hTAAR Ki values, as shown by the F2:Hyd, F3:Hyd, and F4:Hyd features. While F2:Hyd represents a flexible spacer to allow the required distances between the previously cited F1:Aro and F5:AroǀHyd, F3:Hyd and F4:Hyd guarantee a proper steric hindrance, which is thought to be beneficial to: (i) interact with the hTAAR1 hydrophobic cavity and (ii) to oblige the agonist positioning towards a “Y-shape” folded conformation, as it is in the case of other GPCRs ligands [61]. In the case of the hTAAR1 PM_A, F3:Hyd and F4:Hyd are placed 4.83 Å and 5.58 Å from F1:Aro and 4.70 Å, 4.92 Å from F5:AroǀHyd.
Among the aforementioned features, the choice of two terminal aromatic/hydrophobic features in tandem with H-bonding moieties is maintained to allow the a2-ADR binding ability (Figure S8B). Accordingly, the α2-ADR ligand exhibits two aromatic or hydrophobic features (F1:AroǀHyd and F2:AroǀHyd) placed at 4.48 Å to each other, as shown by the agonist 14 imidazole and phenyl rings, being the F3:Don and F4:Acc nearby (2.19 Å). The required F3:Don feature achieving polar contacts with Asp113 is located 5.72 Å far from F1:AroǀHyd.
Bearing in mind this information, the α2-ADR agonist guanfacine (EC50 ~ 25.1 nM [62]) underwent biological evaluation as a putative dual acting agent, also targeting hTAAR1. The drug guanabenz, already known as an α2-ADR (EC50 ~ 16.32 nM [63]) and mTAAR1 agonist (EC50 = 90 nM [64]), was also tested at hTAAR1 for comparative purposes. Indeed, both the two compounds fulfilled the previously mentioned minimum qualitative criteria to achieve hTAAR1 and/or α2-ADR binding ability (see the chemical structure in Figure 13). While the dicloro-substituted phenyl ring of the two compounds guarantees the proper ligand folding, the terminal positively charged moiety should support the dual acting ability of the compounds.
Details of the following in vitro/in vivo assays are reported as follows.

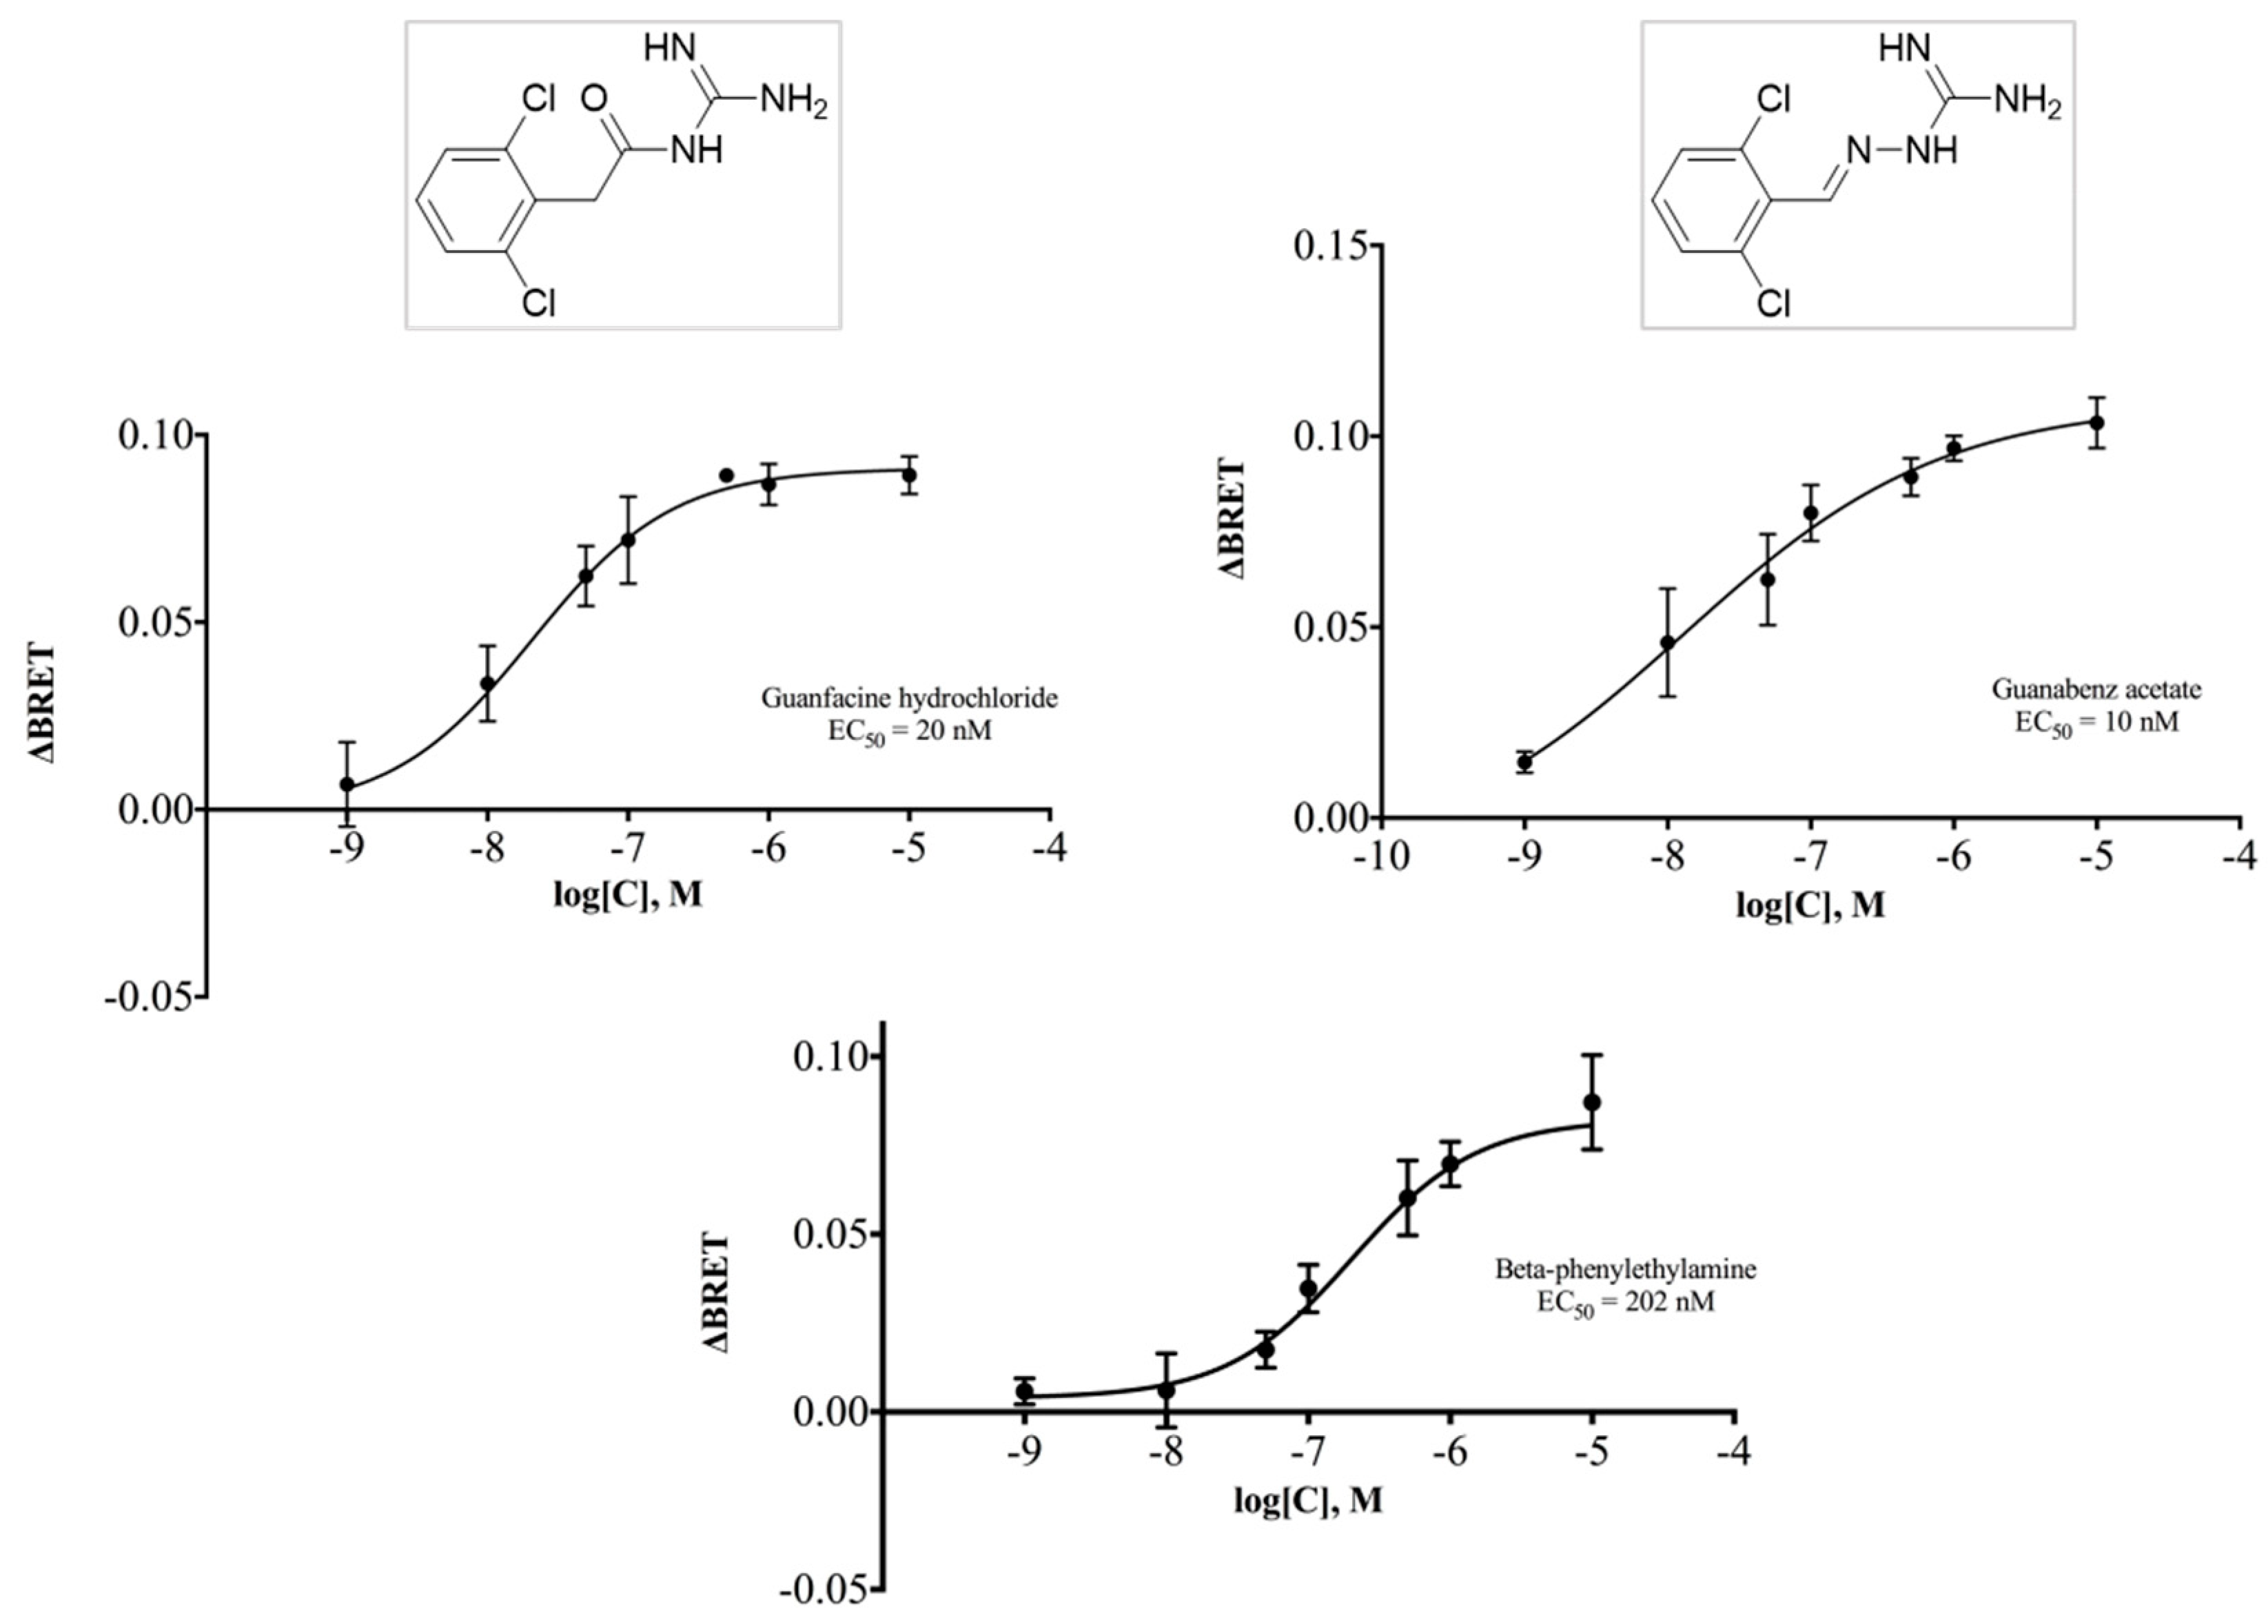
2.4. Guanfacine and Guanabenz Are TAAR1 Agonists

hTAAR1 is coupled to stimulatory G proteins and thus its activation induces an increase in the cAMP production. We measured the potential activity of guanfacine and guanabenz by using a BRET-based assay [65] in which HEK293 cells were transfected with hTAAR1, or the empty vector as control, and the cAMP BRET biosensor. The standard TAAR1 agonist β-PEA was used as a reference compound, as in our tests it also increased cAMP through TAAR1 activation (EC50 = 202 nM). A dose-response experiment was performed using concentrations ranging from 1 nM to 10 μM to calculate the corresponding EC50 and the Emax values. Both guanfacine and guanabenz displayed an Emax > 85% at hTAAR1, thus acting as full agonists (Figure 14) with similar EC50 in the low nanomolar range (guanfacine EC50 = 20 nM; guanabenz EC50 = 10 nM, see Figure 14).
Guanabenz was already described as a partial agonist at mTAAR1 (EC50 = 7 nM) and chimeric receptor cTAAR1 (EC50 = 25 nM), as a more responsive model of hTAAR1, in which the N-terminal, C-terminal, and third intracellular loop sequences of the human ortholog were replaced by the corresponding mouse sequences [66]. Successively, Lam et al. [64] observed the full agonist activity of guanabenz at mTAAR1 (EC50 = 90 nM), using a BRET cAMP reporter. Our data also validate the potent agonist activity of guanabenz at hTAAR1. The interest in guanabenz has been growing again due to its beneficial effects, not only in the circulatory system as a full agonist at the α2A-adrenoceptor, but also in other pharmacological settings. Recently, it showed a weight-reducing effect and the attenuation of some metabolic parameters in obese rats [63,67,68]. Activation of TAAR1 was found to provide beneficial effects on glucose control [69] and body weight in animal models of type 2 diabetes and obesity by incretin-like effects [70]. TAAR1/Gαs-mediated signaling pathways that promote insulin secretion, demonstrated an improvement in pancreatic β-cell function and proliferation [69]. Therefore, further investigations are warranted as a chance to bridge the gap between the beneficial influence of guanabenz on metabolic disturbances and its TAAR1-targeting ability.
It should be emphasized that both guanfacine and guanabenz caused the increase in the cAMP levels in cells co-transfected with hTAAR1 and the cAMP sensor, while activation of the α2-ADR-dependent signaling should have caused the opposite effect. This multidirectional action on cAMP levels should be considered when effects of drugs acting through both TA-AR1 and α2-ADR are evaluated.

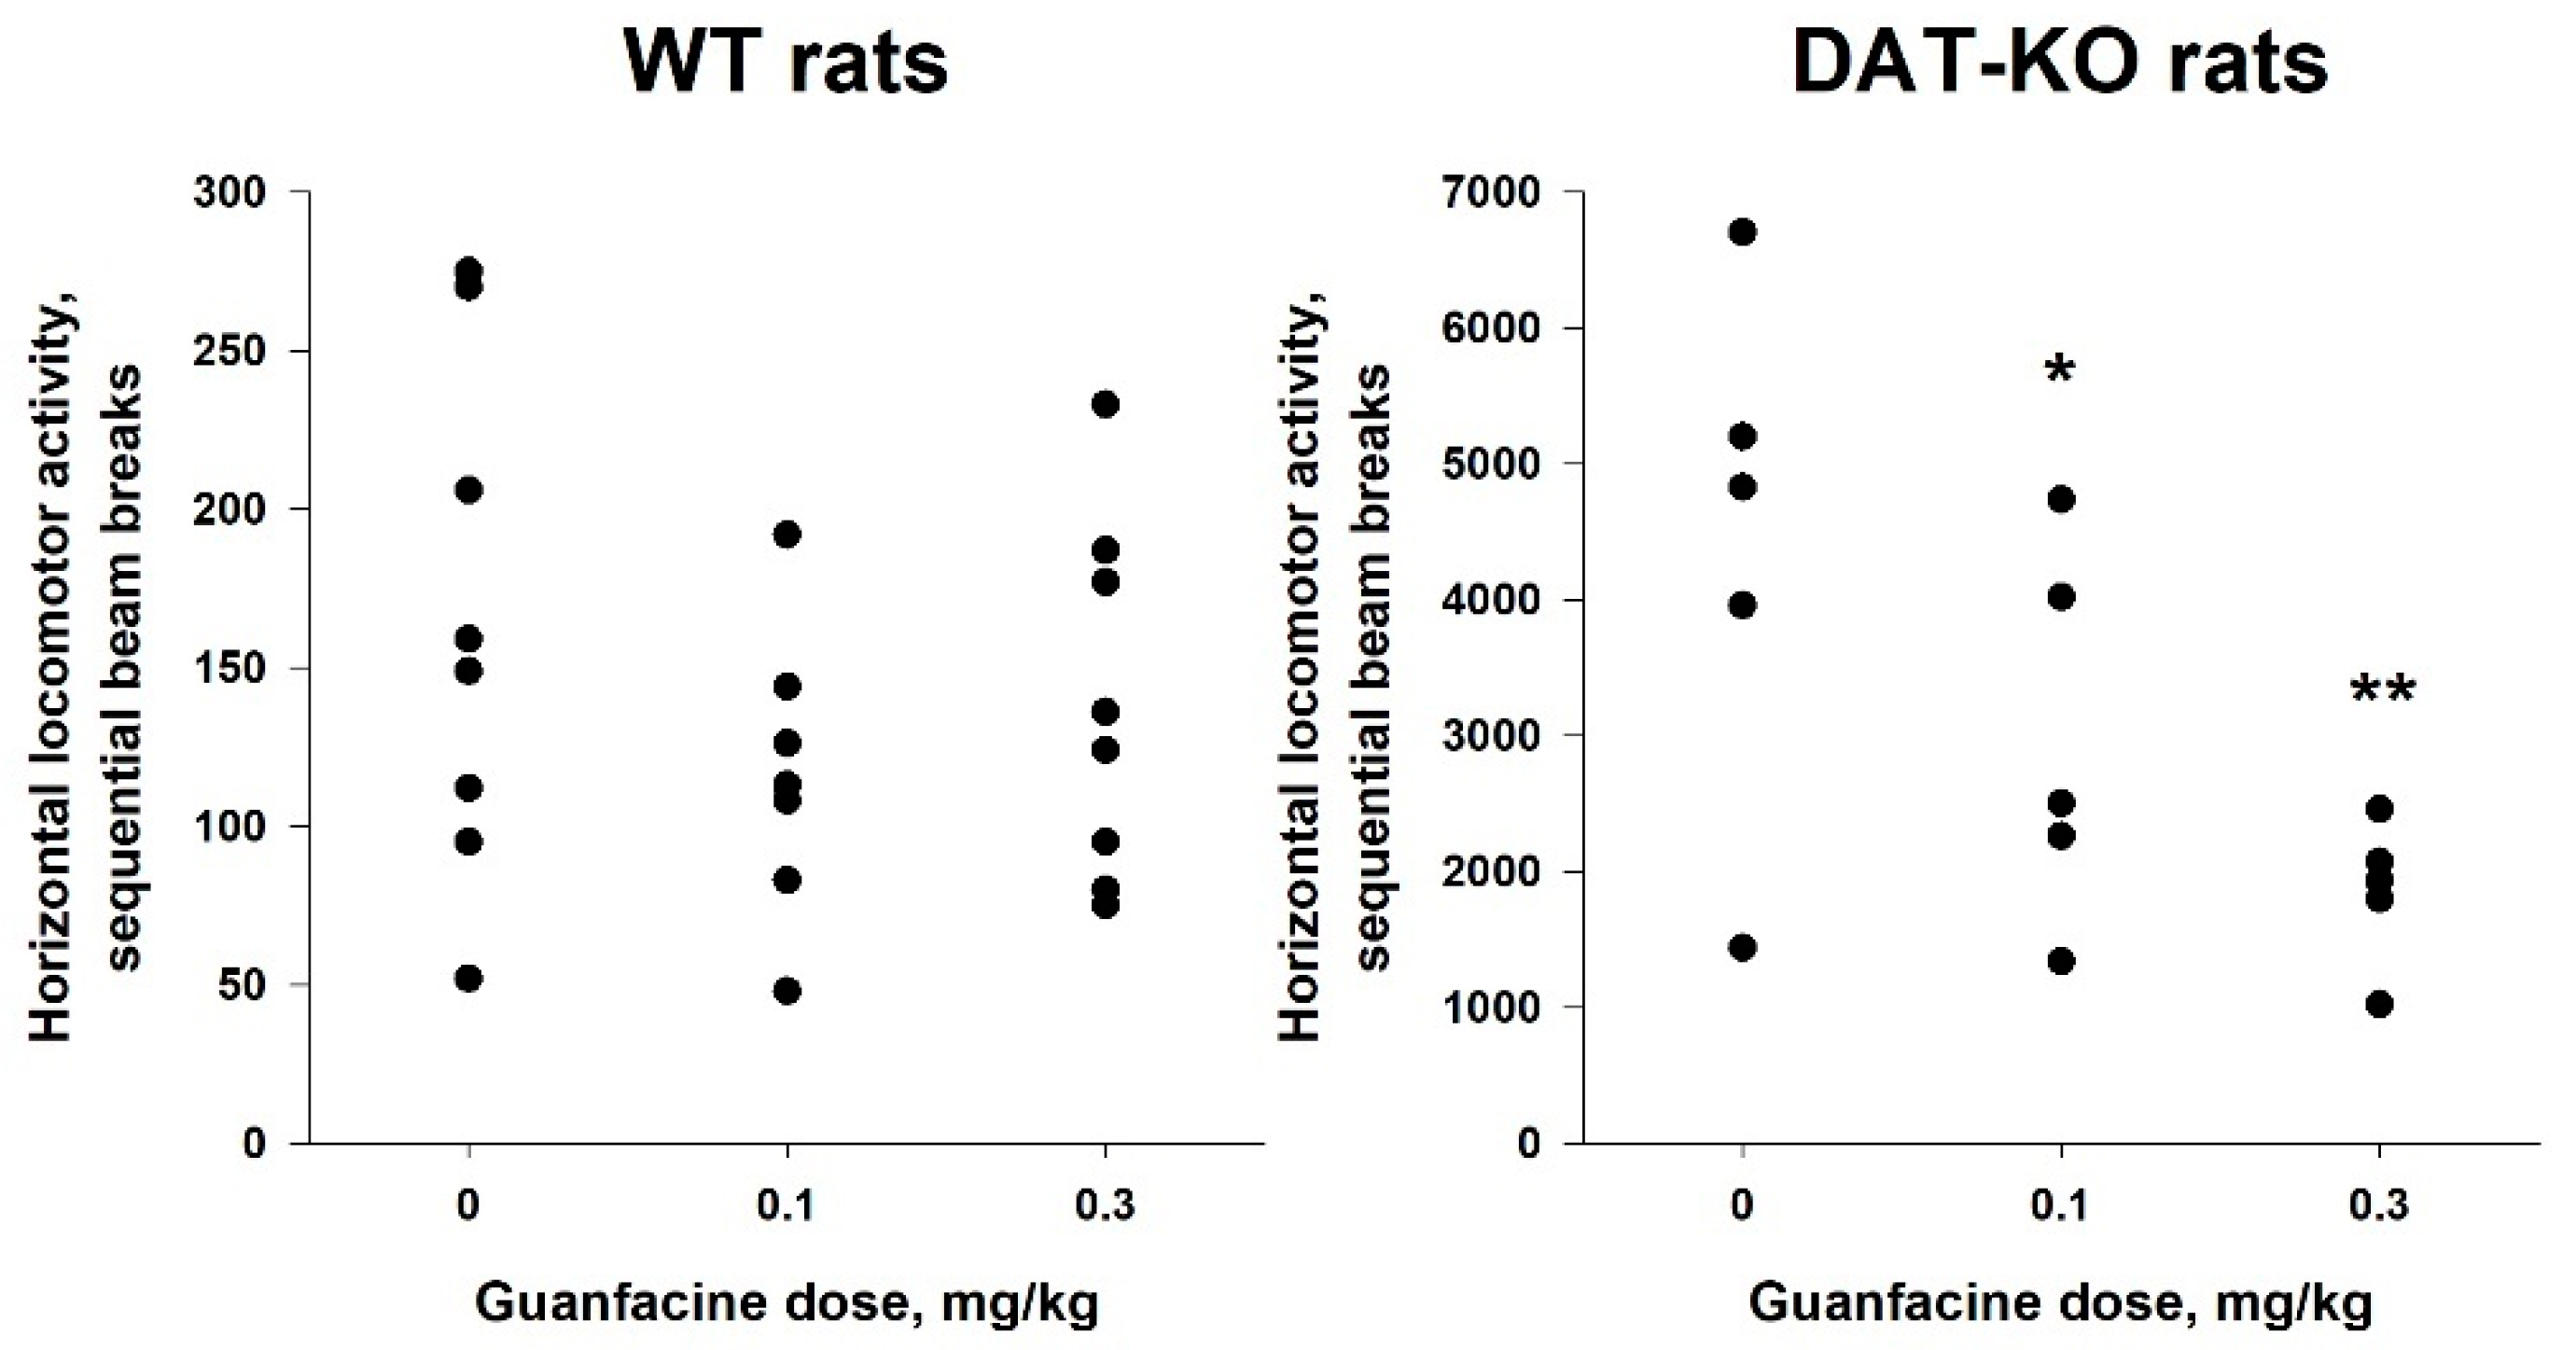
2.5. Administration of Guanfacine Resulted in Decrease in Locomotor Activity of DAT-KO Rats

To evaluate the in vivo pharmacological effect of guanfacine, we used a rodent model of hyperdopaminergia, the dopamine transporter knockout (DAT-KO) rats, that also mimics some phenotypic aspect of ADHD and has certain predictive validity for the search of novel pharmacological agents to control hyperactivity and cognitive processes in patients with this disease [71,72]. In fact, guanfacine demonstrated significant positive effects in tests aimed at evaluating cognitive dysfunction of DAT-KO rats [73]. All TAAR1 agonists tested so far in DAT-KO animals also showed an inhibitory effect on spontaneous dopamine-dependent hyperactivity of these mutants [71]. Thus, the effect of guanfacine on hyperactivity of DAT-KO rats was evaluated.
Results are presented on Figure 15. In strict concordance with previous works [71], DAT-KO rats demonstrated higher levels of locomotor activity than their WT littermates (4425.6 ± 868.67 vs. 164.8 ± 28.53; the U-test: p < 0.01). We used the mixed ANOVA (the within-subject factors ‘5-min bin’ (1–12) and ‘dose’ (0.0; 0.1; 0.3 mg/kg), the between-subject factor ‘mutation’ (‘WT’; ‘KO’); the random factor ‘rat #’) on rank-transformed data to analyze results. The pretreatment with guanfacine resulted in a decrease in locomotor activity (the effect of factor ‘dose’: F(2,220) = 11.32, p < 0.001). Locomotor activity of the rats decreased from the 1st to the 12th bin (the effect of factor ‘5-min bin’: F(11,51) = 2.51, p = 0.01). The lack of DAT was associated with an increased level of locomotor activity (the effect of factor ‘mutation’: F(1,11) = 222.94, p < 0.001). The mixed ANOVA revealed the statistically significant effect of interaction of the factors ‘dose’ and ‘mutation’ (F(2,220) = 8.45, p < 0.001) but not the factors ‘dose’, ‘mutation’, and ‘5-min bin’ (F(22,41) = 0.58, p = 0.92). We used Bonferroni’s test for post hoc comparisons. As presented in the figure, the pairwise comparisons revealed that guanfacine treatment was associated with decreased locomotor activity in DAT-KO (0.3 vs. 0.0 mg/kg: p < 0.001; 0.3 vs. 0.0 mg/kg: p = 0.02) but not in WT rats (0.3 vs. 0.0 mg/kg: p = 1.0; 0.1 vs. 0.0 mg/kg: p = 0.12). While the contribution of the α2-ADR-mediated action of guanfacine to this effect cannot be fully excluded, these data support a general concept of TAAR1 agonism counteracting excessive dopamine function [3,71].

3. Materials and Methods

3.1. Ligand and Protein Preparation

Each compound was built, parameterized (AM1 partial charges as the calculation method), and energy minimized within Molecular Operating Environment software (MOE) [54] (Energy Minimize tool) using the MMFF94x forcefield of MOE and RMS (root mean square) gradient equal to 0.0001, with the root mean square gradient being the norm of the gradient times the square root of the number of (unfixed) atoms. This allowed a single low-energy conformation to be produced for each ligand. For each compound, the protonated conformation was taken into account based on the wash module implemented in MOE [54].
Concerning in silico protein preparation, the X-ray data of the α2-ADR receptor (PDB code = 6KUY) [50] and the AlphaFold model of hTAAR1 (AF-Q96RJ0-F1) [49] have been exploited. Both were managed thanks to the “Structure Preparation” tool from MOE 2019.01 suite. Afterward, the “Protonate3D” tool was exploited to assign the most probable protonation state to each residue while partial charges were attributed according to the AMBER10:EHT force field, as included in MOE.

3.2. Molecular Docking Studies

Molecular docking simulations at the α2-ADR receptor have been performed by means of the Dock module implemented in MOE software (2019.01 version), applying the template-based approach using the co-crystallized α2-ADR targeting ligand as a reference compound. As regards the hTAAR1 model, the corresponding ligand binding site has been determined based on superimposition to the α2-ADR protein, with the two GPCRs being aligned via Blosum62 (MOE software, 2019.01 version). This piece of information allowed the corresponding protein cavity to be derived at the superposed TAAR1 receptor and a preliminary docking run of the dual acting compound S18616 to be performed.
This was developed by applying the Alpha Triangle method and the Affinity ΔG prediction as the final scoring function. The obtained pose of the S18616 ligand at the hTAAR1 receptor was then exploited as a reference compound for the following docking studies of the imidazole- and imidazoline-based derivatives at hTAAR1, via the template-based approach. In particular, the specific applied procedure was the same as described above. Details of the template-based docking calculations as well as of the scoring functions are shown in our previous papers.

3.3. QSAR Analyses

For the development of the quantitative–structure activity relationship (QSAR) models, any compound was explored in terms of geometry and conformation energy by means of the systematic conformational search tool implemented in MOE. For details, see our previous paper [30]. QSAR models A and B have been developed by using the hTAAR1 and α2-ADR binding affinity values as dependent variables while a set of molecular descriptors have been exploited as independent ones. The two final models have been derived applying the chemoinformatic and QSAR packages of MOE, including the molecular descriptors calculation. Afterwards, 302 molecular descriptors (2D and 3D) were computed by this software, and the resulting matrix was submitted to (QSAR) analyses. A final data matrix of 45 objects (compounds/molecules) and 302 rows (molecular descriptors) was obtained. The chemometric package PARVUS [74] was applied to handle such information, in particular for checking the constant predictors, splitting the data into training and test sets, and selecting the most informative molecular descriptors in order to develop two independent QSAR models for TAAR1 pKi and α2 pKi, as described in detail below [55].
First of all, the CHECK module implemented in PARVUS was used for checking the constancy of variables in 5 cancellation groups, and 283 molecular descriptors were retained after elimination of the constant predictors. All the derivatives herein explored have been divided in a training set, for models A and B generation, and in a test set, for the two models’ validation. In particular, the Kennard–Stone duplex design [56] was used in order to split the data into representative training and test sets; this algorithm was applied using the first 8 principal components of the autoscaled data, considering 85% of the total variance. Then, 31 molecules were selected for the training set, and 14 molecules were assigned to the test set (30% of the total molecules).
Iterative stepwise elimination PLS (ISEPLS) [75] was then applied as a variable selection method in order to evaluate the relevance of the selected predictors with regard to the possibility of predicting the two response variables (TAAR1 pKi and α2 pKi) independently. ISE is based on the importance the predictors, defined as (Equation (3)):
z v = b v s v v = 1 V b v s v
where bv is the regression coefficient and sv the standard deviation of the descriptor v. In each elimination cycle, the descriptor with the minimum importance is eliminated, and the model is computed again with the remaining predictors. The best model is selected on the basis of the predictive ability in cross validation. The two final models for TAAR1 pKi and α2 pKi retained 10 and 11 relevant descriptors, respectively.
More details about the selected descriptors are shown as follows: (i) Surface area, volume, and shape descriptors depend on the structure connectivity and conformation (dimensions are measured in Å), and the vsurf descriptors are similar to the VolSurf descriptors [76]. (ii) Subdivided surface areas are based on an approximate accessible van der Waals surface area (in Å2) calculation for each atom, vi along with some other atomic property, pi. The vi are calculated using a connection table approximation. Each descriptor in a series is defined to be the sum of the vi over all atoms i such that pi is in a specified range (a,b).
For the corresponding description, Li denotes the contribution to logP(o/w) for atom i as calculated in the SlogP descriptor [59]. Ri denotes the contribution to molar refractivity for atom i as calculated in the SMR descriptor [59]. The ranges were determined by the percentile subdivision over a large collection of compounds. (iii) Partial charge descriptors; depending on the partial charge of each atom of a chemical structure, require calculation of those partial charges. Partial charges from forcefields can be used by energy minimizing the database structures (which will store the charges) and then using the Q_ variant of the descriptors. Let qi denote the partial charge of atom i as defined above. Let vi be the van der Waals surface area (Å2) of atom i (as calculated by a connection table approximation). (iv) Conformation dependent charge descriptors depend upon the stored partial charges of the molecules and their conformations. Accessible surface area refers to the water accessible surface (in Å2) area using a probe radius of 1.4 Å. Let qi denote the partial charge of atom i. (v) Potential energy descriptors use the MOE potential energy model to calculate energetic quantities (in kcal/mol) from stored 3D conformations. (vi) Adjacency and distance matrix descriptors; being the adjacency matrix, M, of a chemical structure defined by the elements [Mij] where Mij is one if atoms i and j are bonded and zero otherwise. The distance matrix, D, of a chemical structure is defined by the elements [Dij] where Dij is the length of the shortest path from atoms i to j; zero is used if atoms i and j are not part of the same connected component. Petitjean [77] defines the eccentricity of a vertex to be the longest path from that vertex to any other vertex in the graph. The graph radius is the smallest vertex eccentricity in the graph, and the graph diameter as the largest vertex eccentricity. These values are calculated using the distance matrix and are used for several descriptors described below. (vii) Pharmacophore feature descriptors consider only the heavy atoms of a molecule and assign a type to each atom. That is, hydrogens are suppressed during the calculation. (viii) Subdivided surface areas, including descriptors based on an approximate accessible van der Waals surface area (in Å2) calculation for each atom, vi along with some other atomic property, pi. The vi are calculated using a connection table approximation. Each descriptor in a series is defined to be the sum of the vi over all atoms i such that pi is in a specified range (a,b).
Li denotes the contribution to logP(o/w) for atom i as calculated in the SlogP descriptor [59]. Ri denotes the contribution to molar refractivity for atom i as calculated in the SMR descriptor [59]. The ranges were determined by the percentile subdivision over a large collection of compounds. PLS regression was performed on these two reduced data matrices, and the results were obtained in terms of predictive ability of the biological data (TAAR1 pKi and α2 pKi). Regarding test set compounds, the predictive ability of the two models A and B was expressed as r2pred by applying the following equation Equation (4):
r2pred = (SD-PRESS)/SD
where SD is the sum of the squared deviations between the biological activities of the test set molecules and the mean activity of the training set compounds, and PRESS is the sum of the squared deviation between the observed and the predicted activities of the test set compounds.
Then, the development of the two pharmacophore models PM_A and PM_B have been performed by means of the pharmacophore search module implemented in the MOE software (2019.01 version), starting from the alignment of the selected hTAAR1 agonists (pKi > 8 M) 12, 23-26, 30, and 34, and the α2-ADR ligands (pKi > 7.5 M), 5b, 12, 14, 20, and 33, respectively. For each model, only the pharmacophore features (F) shared by all the selected compounds have been reported, as aromatic or hydrophobic groups (AroǀHyd) or only hydrophobic- Hyd) or aromatic-cores (Aro), or H-bonding acceptor (Acc) or donor (Don) groups.
Details of the pharmacophore search module have been previously reported by us [31]. This kind of analysis is described in the literature as a useful approach to guide the design of novel bioactive compounds [78,79,80].

3.4. Reagents

Guanfacine hydrochloride and guanabenz acetate are commercially available (Sigma-Aldrich, Milan, Italy or St. Louis, MO, USA). Cell culture reagents and buffers were from Gibco (Thermo Fisher Scientific, New York, NY, USA) or Invitrogen (Thermo Fisher Scientific, Carlsbad, CA, USA) and Sigma-Aldrich (Milan, Italy). Coelenterazine h was purchased from Promega (Milan, Italy). Plasmid containing the cDNA for hTAAR1 was a generous gift from Hoffman-La Roche.

3.5. Cell Culture and BRET Experiment

Human embryonic kidney 293 cells (HEK293T; ATCC CRL-11268) were maintained in Dulbecco’s Modified Eagle’s medium (DMEM; Gibco-Thermo Fisher Scientific, New York, NY, USA) supplemented with 10% (v/v) of FBS, 2 mM l-glutamine, and 0.05 mg/mL of gentamicin (both from Gibco) at 37 °C in a humidified atmosphere at 95% air and 5% CO2. Transient transfections were performed 24 h after cell seeding using the Lipofectamine reagent 2000 protocol (Invitrogen-Thermo Fisher Scientific, Carlsbad, USA). Then, 5 µg of hTAAR1 and 4 µg of cAMP biosensor protein (EPAC) encoding plasmids (the latter based on pcDNA3 core vector [59]) for each milliliter of transfection mix were used. For the BRET experiments, the cells were plated 6 h after transfection in poly-D-lysine coated 96-well white opaque microplates (Corning, New York, NY, USA) at a density of 7 × 10⁴ cells per well in phenol red free Minimum Essential Medium (MEM; Gibco-Thermo Fisher Scientific, New York, NY, USA) containing 2% of FBS, 10 mM HEPES buffering agent, and 2 mM L-glutamine (all from Gibco-Thermo Fisher Scientific, New York, NY, USA). The cells were then cultured for an additional 24 h.
The BRET experiment was conducted as already described [65]. Briefly, for time course experiments, the plate was read immediately after the addition of the agonist and for approximately 20 min. All the experiments were conducted in the presence of the phosphodiesterase inhibitor 3-isobutyl-1-methylxanthine (IBMX; Sigma-Aldrich, St. Louis, MO, USA) at the final concentration of 200 µM. Readings were collected using a Tecan Infinite instrument that allows the sequential integration of the signals detected in the 465 to 505 nm and 515 to 555 nm windows using filters with the appropriate band pass and by using iControl software. The acceptor/donor ratio was then calculated.
All the compounds were dissolved in dimethyl sulfoxide (DMSO; Sigma-Aldrich, St. Louis, MO, USA) and tested at the final concentration of 10 μM. Beta-phenylethylamine (Sigma-Aldrich, St. Louis, MO, USA) at the final concentration of 10 µM was applied as a positive control. To confirm specificity of positive responses, parallel screening on cells not transfected with the TAAR1-encoding vector was carried out. For compounds considered active, separate dose-response experiments were performed in order to calculate the EC50 values. Curves were fitted using a non-linear regression and one site specific binding with GraphPad Prism 6 (GraphPad Software). Data are representative of 4–5 independent experiments and are expressed as means, SD < 10%.

3.6. Subjects

Female rats with a loss-of-function mutation of the dopamine transporter gene (DAT-KO, n = 6) and their wild type (WT, n = 8) littermates were derived from the previously described rat strain [71]. One rat was excluded from the 3rd test because of illness-induced weight loss. All used animals were drug and test naïve before the start of experiments and were housed under a 12 h/12 h light/dark cycle (lights on at 08:00 h) at 21 ± 2 °C and 50 ± 20% humidity at the animal facility of Valdman Institute of pharmacology. Animals were housed in groups of siblings (3–5 per TIV (rats) or TIII cage (Tecniplast, Varese, Italy)). During the experiments, animals had free access to filtered (“AQUAPHOR”, Saint Petersburg, Russia) tap water and standard laboratory rat chow (receipt ΠK 120-1, KKZ “Laboratorkorm”, Moscow, Russia). The cages, corn cob bedding (“KKZ ‘Zolotoy pochatok’” LLC, Voronezh, Russia), and water bottles were changed once a week.
All tests were performed during the light period of the light/dark cycle. Experimental protocols were approved by the Local Animal Care and Use committee (First Pavlov State Saint Petersburg Medical University, #100_ИΦ1_012017/3_900 and #100_ИΦ1_012019/21_300).

3.7. Locomotor Activity Measurement

The study was performed in the apparatus ‘Actometer’ described in detail before [81]. We used the number of ambulation (sequential beam breaks) to estimate the horizontal locomotor activity of animals. We performed tests with guanfacine in the rats using a within-subjects design. Before guanfacine or vehicle injection (dose order based on Latin Square design), the rats were habituated to the activity monitor for 30 min. Following the injection, the locomotor activity of the animals was recorded for an additional 60 min divided in 12 intervals of 5-min each.

3.8. Statistical Analysis

Alpha was set at 0.05. All statistical analyses were performed using IBM SPSS Statistics 21 (IBM, Armonk, New York, NY, USA). We chose non-parametric methods to analyze results because tests for normality are not able to work properly in cases of small (n less than 40) sample sizes.

4. Conclusions

Molecular docking studies combined with QSAR analyses allowed us to investigate the main requirements turning in putative selective TAAR1 or α2-ADR ligands. In particular, the pivotal role showed by a proper folded conformation interacting with TAAR1 is confirmed by the high number of aromatic residues included in the hTAAR1 pocket, if compared to that of α2-ADR. This piece of information turns in preferred aromatic scaffolds for the TAAR1 agonism, as also confirmed by the QSAR studies. Indeed, most of the descriptors involved in model A (TAAR1 binding ability) rather than those of model B (α2-ADR binding ability) were clustered as conformer-dependent descriptors. Comparing the two models, hTAAR1 and α2-ADR binding affinity values increase in the presence of polar ligands (via DipoleY parameter) and positively charged moieties (Q_VSA_PNEG), respectively. On the other hand, the presence of an overall hydrophobic structure is in any case encouraged. The development of specific pharmacophore models (PM_A and PM_B) allowed us to interpret the main features to be included in future hTAAR1/α2-ADR ligands. On this qualitative information, the compound guanfacine was explored as the putative dual acting hTAAR1/α2-ADR ligand. Guanfacine was demonstrated to potently agonize the hTAAR1 receptor at the same rank of α2-ADR, as also observed for the reference drug guanabenz. From a biological standpoint, the here disclosed dual agonism activity of guanfacine could represent a suitable tool for deepening the pharmacology of TAAR1 and its fine interconnection with the α2-adrenergic system; from the medicinal chemistry point of view, guanfacine arises as an interesting template molecule for further structural variations with an attempt to develop selective TAAR1 agonists. Despite this centrally active α2-ADR drug being known for over 50 years, a better understanding of its biological multifunctional profile and potential application in novel therapeutic areas remains an intriguing matter, necessitating subsequent investigation.

Supplementary Materials

The following supporting information can be downloaded at: https://www.mdpi.com/article/10.3390/ph16111632/s1, Figure S1. Pairwise Percentage Residue Identity (PPRI) and Similarity values as obtained by the hTAAR1 (shown as green ribbon) and α2-ADR (shown as gold ribbon) superposition. Figure S2. Superimposition of the hTAAR1 model and of the X-ray data about α2-ADR (left); the corresponding RMSD values are also reported (right). Figure S3. Alignment of the hTAAR1 and α2-ADR protein sequence. Figure S4. Full-view of the dual hTAAR1 (green) and α2-ADR (cyan) agonist S18616 at the whole proteins. Ligand volume is highlighted in light brown. Figure S5. Docking positioning of 37 (C atom; magenta) at the hTAAR1 binding site. The most important residues involved in the agonist binding are labelled. Figure S6. Docking positioning of 53 (C atom; magenta) at the hTAAR1 binding site (A) and of 51 at the α2-ADR cavity (B). The most important residues involved in the agonist binding are labelled. Figure S7. Schematic representation of the opposite role played by the Q_VSA_FHYD descriptor, shared by both models A and B, to influence the compound (hTAAR1 and a2-ADR) binding affinity values. Compounds are represented as dots. Table S1. Five top scored docking positioning of 5a-5e, 6a-6e, 11-54 and the reference agonist S18616 at the hTAAR1 (MOE software). The predicted ΔG value of each protein-ligand complex has been reported, as calculated in terms of final scoring function (S, as Kcal/mol). Table S2. Five top scored docking positioning of 5a-5e, 6a-6e, 11-54 and the reference agonist S18616 at the α2-ADR (MOE software). The predicted ΔG value of each protein-ligand complex has been reported, as calculated in terms of final scoring function (S, as Kcal/mol). Table S3. Chemical structure of the dual acting hTAAR1 and α2ADR ligands. The corresponding binding affinity values are also reported. Table S4. The predicted (Pred. pKi) and experimental (Exp. pKi) hTAAR1 binding affinity values of the compounds (Comp.) herein explored are reported, in tandem with the collected descriptors. The compounds included in the test set are underlined along the first column. Table S5. The predicted (Pred. pKi) and experimental (Exp. pKi) α2-ADR binding affinity values of the compounds (Comp.) herein explored are reported, in tandem with the collected descriptors. The compounds included in the test set are underlined along the first column.

Author Contributions

Conceptualization, M.T. and E.C.; methodology and validation, M.T., E.C. and R.R.G.; software, E.C.; investigation, V.F., B.C., M.C., E.K., A.S.G., I.S., A.S. and S.E.; resources, M.T., E.C. and R.R.G.; writing—original draft preparation, M.T. and E.C.; writing—review and editing, M.T., E.C., S.E., I.S. and R.R.G.; visualization, V.F. and B.C.; supervision, M.T., E.C. and R.R.G.; project administration, M.T. All authors have read and agreed to the published version of the manuscript.

Funding

This work was financially supported by the University of Genoa. R.R.G. and E.K. were supported by the Russian Science Foundation [19-75-30008-P].

Institutional Review Board Statement

Experimental protocols were approved on 27 February 2018 by the local Animal Care and Use committee (Pavlov Medical University, #100_Φ1_012017/3_900).

Data Availability Statement

Data is contained within the article.

Acknowledgments

Figure 2 created with Biorender.com. Figure 3: Molecular graphics and analyses performed with UCSF Chimera, developed by the Resource for Biocomputing, Visualization, and Informatics at the University of California, San Francisco, with support from NIH P41-GM103311.

Conflicts of Interest

The authors declare no conflict of interest.

References

  1. Rutigliano, G.; Accorroni, A.; Zucchi, R. The Case for TAAR1 as a Modulator of Central Nervous System Function. Front. Pharmacol. 2017, 8, 987. [Google Scholar] [CrossRef] [PubMed]
  2. Barnes, D.A.; Hoener, M.C.; Moore, C.S.; Berry, M.D. TAAR1 Regulates Purinergic-Induced TNF Secretion from Peripheral, But Not CNS-Resident, Macrophages. J. Neuroimmune Pharmacol. 2023, 18, 100–111. [Google Scholar] [CrossRef] [PubMed]
  3. Halff, E.F.; Rutigliano, G.; Garcia-Hidalgo, A.; Howes, O.D. Trace Amine-Associated Receptor 1 (TAAR1) Agonism as a New Treatment Strategy for Schizophrenia and Related Disorders. Trends Neurosci. 2023, 46, 60–74. [Google Scholar] [CrossRef]
  4. Zhai, L.; Xiao, H.; Lin, C.; Wong, H.L.X.; Lam, Y.Y.; Gong, M.; Wu, G.; Ning, Z.; Huang, C.; Zhang, Y.; et al. Gut Microbiota-Derived Tryptamine and Phenethylamine Impair Insulin Sensitivity in Metabolic Syndrome and Irritable Bowel Syndrome. Nat. Commun. 2023, 14, 4986. [Google Scholar] [CrossRef]
  5. Liu, H.; Zheng, Y.; Wang, Y.; Wang, Y.; He, X.; Xu, P.; Huang, S.; Yuan, Q.; Zhang, X.; Wang, L.; et al. Recognition of Methamphetamine and Other Amines by Trace Amine Receptor TAAR1. Nature 2023. [Google Scholar] [CrossRef] [PubMed]
  6. Wu, R.; Li, J.-X. Potential of Ligands for Trace Amine-Associated Receptor 1 (TAAR1) in the Management of Substance Use Disorders. CNS Drugs 2021, 35, 1239–1248. [Google Scholar] [CrossRef] [PubMed]
  7. Alnefeesi, Y.; Tamura, J.K.; Lui, L.M.W.; Jawad, M.Y.; Ceban, F.; Ling, S.; Nasri, F.; Rosenblat, J.D.; McIntyre, R.S. Trace Amine-Associated Receptor 1 (TAAR1): Potential Application in Mood Disorders: A Systematic Review. Neurosci. Biobehav. Rev. 2021, 131, 192–210. [Google Scholar] [CrossRef] [PubMed]
  8. Raony, Í.; Domith, I.; Lourenco, M.V.; Paes-de-Carvalho, R.; Pandolfo, P. Trace Amine-Associated Receptor 1 Modulates Motor Hyperactivity, Cognition, and Anxiety-like Behavior in an Animal Model of ADHD. Prog. Neuro-Psychopharmacol. Biol. Psychiatry 2022, 117, 110555. [Google Scholar] [CrossRef]
  9. Sakanoue, W.; Yokoyama, T.; Hirakawa, M.; Maesawa, S.; Sato, K.; Saino, T. 3-Iodothyronamine, a Trace Amine-Associated Receptor Agonist, Regulates Intracellular Ca2+ Increases via CaMK II through Epac2 in Rat Cerebral Arterioles. Biomed. Res. 2023, 44, 219–232. [Google Scholar] [CrossRef]
  10. Decker, A.M.; Brackeen, M.F.; Mohammadkhani, A.; Kormos, C.M.; Hesk, D.; Borgland, S.L.; Blough, B.E. Identification of a Potent Human Trace Amine-Associated Receptor 1 Antagonist. ACS Chem. Neurosci. 2022, 13, 1082–1095. [Google Scholar] [CrossRef]
  11. Bugda Gwilt, K.; González, D.P.; Olliffe, N.; Oller, H.; Hoffing, R.; Puzan, M.; El Aidy, S.; Miller, G.M. Actions of Trace Amines in the Brain-Gut-Microbiome Axis via Trace Amine-Associated Receptor-1 (TAAR1). Cell. Mol. Neurobiol. 2020, 40, 191–201. [Google Scholar] [CrossRef] [PubMed]
  12. Perini, F.; Nazimek, J.M.; Mckie, S.; Capitão, L.P.; Scaife, J.; Pal, D.; Browning, M.; Dawson, G.R.; Nishikawa, H.; Campbell, U.; et al. Effects of Ulotaront on Brain Circuits of Reward, Working Memory, and Emotion Processing in Healthy Volunteers with High or Low Schizotypy. Schizophrenia 2023, 9, 49. [Google Scholar] [CrossRef] [PubMed]
  13. Ågren, R.; Betari, N.; Saarinen, M.; Zeberg, H.; Svenningsson, P.; Sahlholm, K. In Vitro Comparison of Ulotaront (SEP-363856) and Ralmitaront (RO6889450): Two TAAR1 Agonist Candidate Antipsychotics. Int. J. Neuropsychopharmacol. 2023, 26, 599–606. [Google Scholar] [CrossRef]
  14. Tonelli, M.; Cichero, E. Trace Amine Associated Receptor 1 (TAAR1) Modulators: A Patent Review (2010-Present). Expert. Opin. Ther. Pat. 2020, 30, 137–145. [Google Scholar] [CrossRef]
  15. Frycz, B.A.; Nowicka, K.; Konopka, A.; Hoener, M.C.; Bulska, E.; Kaczmarek, L.; Stefaniuk, M. Activation of Trace Amine-Associated Receptor 1 (TAAR1) Transiently Reduces Alcohol Drinking in Socially Housed Mice. Addict. Biol. 2023, 28, e13285. [Google Scholar] [CrossRef] [PubMed]
  16. Grinchii, D.; Hoener, M.C.; Khoury, T.; Dekhtiarenko, R.; Nejati Bervanlou, R.; Jezova, D.; Dremencov, E. Effects of Acute and Chronic Administration of Trace Amine-Associated Receptor 1 (TAAR1) Ligands on in Vivo Excitability of Central Monoamine-Secreting Neurons in Rats. Mol. Psychiatry 2022, 27, 4861–4868. [Google Scholar] [CrossRef] [PubMed]
  17. Dorotenko, A.; Tur, M.; Dolgorukova, A.; Bortnikov, N.; Belozertseva, I.V.; Zvartau, E.E.; Gainetdinov, R.R.; Sukhanov, I. The Action of TAAR1 Agonist RO5263397 on Executive Functions in Rats. Cell. Mol. Neurobiol. 2020, 40, 215–228. [Google Scholar] [CrossRef] [PubMed]
  18. Wu, R.; Liu, J.; Wang, K.; Huang, Y.; Zhang, Y.; Li, J.-X. Effects of a Trace Amine-Associated Receptor 1 Agonist RO 5263397 on Ethanol-Induced Behavioral Sensitization. Behav. Brain Res. 2020, 390, 112641. [Google Scholar] [CrossRef]
  19. Polini, B.; Ricardi, C.; Bertolini, A.; Carnicelli, V.; Rutigliano, G.; Saponaro, F.; Zucchi, R.; Chiellini, G. T1AM/TAAR1 System Reduces Inflammatory Response and β-Amyloid Toxicity in Human Microglial HMC3 Cell Line. Int. J. Mol. Sci. 2023, 24, 11569. [Google Scholar] [CrossRef]
  20. Kane, J.M. A New Treatment Paradigm: Targeting Trace Amine-Associated Receptor 1 (TAAR1) in Schizophrenia. J. Clin. Psychopharmacol. 2022, 42, S1–S13. [Google Scholar] [CrossRef]
  21. Dedic, N.; Dworak, H.; Zeni, C.; Rutigliano, G.; Howes, O.D. Therapeutic Potential of TAAR1 Agonists in Schizophrenia: Evidence from Preclinical Models and Clinical Studies. Int. J. Mol. Sci. 2021, 22, 13185. [Google Scholar] [CrossRef] [PubMed]
  22. Kantrowitz, J.T. Trace Amine-Associated Receptor 1 as a Target for the Development of New Antipsychotics: Current Status of Research and Future Directions. CNS Drugs 2021, 35, 1153–1161. [Google Scholar] [CrossRef]
  23. Dedic, N.; Jones, P.G.; Hopkins, S.C.; Lew, R.; Shao, L.; Campbell, J.E.; Spear, K.L.; Large, T.H.; Campbell, U.C.; Hanania, T.; et al. SEP-363856, a Novel Psychotropic Agent with a Unique, Non-D2 Receptor Mechanism of Action. J. Pharmacol. Exp. Ther. 2019, 371, 1–14. [Google Scholar] [CrossRef] [PubMed]
  24. Dodd, S.; Carvalho, A.F.; Puri, B.K.; Maes, M.; Bortolasci, C.C.; Morris, G.; Berk, M. Trace Amine-Associated Receptor 1 (TAAR1): A New Drug Target for Psychiatry? Neurosci. Biobehav. Rev. 2021, 120, 537–541. [Google Scholar] [CrossRef]
  25. Achtyes, E.D.; Hopkins, S.C.; Dedic, N.; Dworak, H.; Zeni, C.; Koblan, K. Ulotaront: Review of Preliminary Evidence for the Efficacy and Safety of a TAAR1 Agonist in Schizophrenia. Eur. Arch. Psychiatry Clin. Neurosci. 2023, 273, 1543–1556. [Google Scholar] [CrossRef]
  26. Koblan, K.S.; Kent, J.; Hopkins, S.C.; Krystal, J.H.; Cheng, H.; Goldman, R.; Loebel, A. A Non-D2-Receptor-Binding Drug for the Treatment of Schizophrenia. N. Engl. J. Med. 2020, 382, 1497–1506. [Google Scholar] [CrossRef]
  27. Højlund, M.; Correll, C.U. Ulotaront: A TAAR1/5-HT1A Agonist in Clinical Development for the Treatment of Schizophrenia. Expert Opin. Investig. Drugs 2022, 31, 1279–1290. [Google Scholar] [CrossRef] [PubMed]
  28. Hart, M.E.; Suchland, K.L.; Miyakawa, M.; Bunzow, J.R.; Grandy, D.K.; Scanlan, T.S. Trace Amine-Associated Receptor Agonists: Synthesis and Evaluation of Thyronamines and Related Analogues. J. Med. Chem. 2006, 49, 1101–1112. [Google Scholar] [CrossRef] [PubMed]
  29. Tonelli, M.; Espinoza, S.; Gainetdinov, R.R.; Cichero, E. Novel Biguanide-Based Derivatives Scouted as TAAR1 Agonists: Synthesis, Biological Evaluation, ADME Prediction and Molecular Docking Studies. Eur. J. Med. Chem. 2017, 127, 781–792. [Google Scholar] [CrossRef]
  30. Guariento, S.; Tonelli, M.; Espinoza, S.; Gerasimov, A.S.; Gainetdinov, R.R.; Cichero, E. Rational Design, Chemical Synthesis and Biological Evaluation of Novel Biguanides Exploring Species-Specificity Responsiveness of TAAR1 Agonists. Eur. J. Med. Chem. 2018, 146, 171–184. [Google Scholar] [CrossRef]
  31. Francesconi, V.; Cichero, E.; Kanov, E.V.; Laurini, E.; Pricl, S.; Gainetdinov, R.R.; Tonelli, M. Novel 1-Amidino-4-Phenylpiperazines as Potent Agonists at Human TAAR1 Receptor: Rational Design, Synthesis, Biological Evaluation and Molecular Docking Studies. Pharmaceuticals 2020, 13, 391. [Google Scholar] [CrossRef]
  32. Cichero, E.; Tonelli, M. Targeting Species-Specific Trace Amine-Associated Receptor 1 Ligands: To Date Perspective of the Rational Drug Design Process. Future Med. Chem. 2017, 9, 1507–1527. [Google Scholar] [CrossRef]
  33. Xu, Z.; Li, Q. TAAR Agonists. Cell. Mol. Neurobiol. 2020, 40, 257–272. [Google Scholar] [CrossRef] [PubMed]
  34. Millan, M.J.; Dekeyne, A.; Newman-Tancredi, A.; Cussac, D.; Audinot, V.; Milligan, G.; Duqueyroix, D.; Girardon, S.; Mullot, J.; Boutin, J.A.; et al. S18616, a Highly Potent, Spiroimidazoline Agonist at Alpha(2)-Adrenoceptors: I. Receptor Profile, Antinociceptive and Hypothermic Actions in Comparison with Dexmedetomidine and Clonidine. J. Pharmacol. Exp. Ther. 2000, 295, 1192–1205. [Google Scholar] [PubMed]
  35. Galley, G.; Stalder, H.; Goergler, A.; Hoener, M.C.; Norcross, R.D. Optimisation of Imidazole Compounds as Selective TAAR1 Agonists: Discovery of RO5073012. Bioorganic Med. Chem. Lett. 2012, 22, 5244–5248. [Google Scholar] [CrossRef]
  36. Galley, G.; Beurier, A.; Décoret, G.; Goergler, A.; Hutter, R.; Mohr, S.; Pähler, A.; Schmid, P.; Türck, D.; Unger, R.; et al. Discovery and Characterization of 2-Aminooxazolines as Highly Potent, Selective, and Orally Active TAAR1 Agonists. ACS Med. Chem. Lett. 2016, 7, 192–197. [Google Scholar] [CrossRef]
  37. Childress, A.; Hoo-Cardiel, A.; Lang, P. Evaluation of the Current Data on Guanfacine Extended Release for the Treatment of ADHD in Children and Adolescents. Expert Opin. Pharmacother. 2020, 21, 417–426. [Google Scholar] [CrossRef] [PubMed]
  38. Ota, T.; Yamamuro, K.; Okazaki, K.; Kishimoto, T. Evaluating Guanfacine Hydrochloride in the Treatment of Attention Deficit Hyperactivity Disorder (ADHD) in Adult Patients: Design, Development and Place in Therapy. Drug Des. Dev. Ther. 2021, 15, 1965–1969. [Google Scholar] [CrossRef]
  39. Galvez-Contreras, A.Y.; Vargas-de la Cruz, I.; Beltran-Navarro, B.; Gonzalez-Castaneda, R.E.; Gonzalez-Perez, O. Therapeutic Approaches for ADHD by Developmental Stage and Clinical Presentation. Int. J. Environ. Res. Public Health 2022, 19, 12880. [Google Scholar] [CrossRef] [PubMed]
  40. Rizzo, R.; Martino, D. Guanfacine for the Treatment of Attention Deficit Hyperactivity Disorder in Children and Adolescents. Expert Rev. Neurother. 2015, 15, 347–354. [Google Scholar] [CrossRef] [PubMed]
  41. Black, B.T.; Soden, S.E.; Kearns, G.L.; Jones, B.L. Clinical and Pharmacologic Considerations for Guanfacine Use in Very Young Children. J. Child Adolesc. Psychopharmacol. 2016, 26, 498–504. [Google Scholar] [CrossRef]
  42. Alamo, C.; López-Muñoz, F.; Sánchez-García, J. Mechanism of Action of Guanfacine: A Postsynaptic Differential Approach to the Treatment of Attention Deficit Hyperactivity Disorder (Adhd). Actas Esp. Psiquiatr. 2016, 44, 107–112. [Google Scholar]
  43. Ramos, B.P.; Arnsten, A.F.T. Adrenergic Pharmacology and Cognition: Focus on the Prefrontal Cortex. Pharmacol. Ther. 2007, 113, 523–536. [Google Scholar] [CrossRef] [PubMed]
  44. Arnsten, A.F.T.; Jin, L.E. Guanfacine for the Treatment of Cognitive Disorders: A Century of Discoveries at Yale. Yale J. Biol. Med. 2012, 85, 45–58, PMCID:PMC3313539. [Google Scholar] [PubMed]
  45. Arnsten, A.F.T. Guanfacine’s Mechanism of Action in Treating Prefrontal Cortical Disorders: Successful Translation across Species. Neurobiol. Learn. Mem. 2020, 176, 107327. [Google Scholar] [CrossRef]
  46. Fox, H.; Sofuoglu, M.; Sinha, R. Guanfacine Enhances Inhibitory Control and Attentional Shifting in Early Abstinent Cocaine-Dependent Individuals. J. Psychopharmacol. 2015, 29, 312–323. [Google Scholar] [CrossRef]
  47. Franowicz, J.S.; Kessler, L.E.; Borja, C.M.D.; Kobilka, B.K.; Limbird, L.E.; Arnsten, A.F.T. Mutation of the alpha2A-Adrenoceptor Impairs Working Memory Performance and Annuls Cognitive Enhancement by Guanfacine. J. Neurosci. 2002, 22, 8771–8777. [Google Scholar] [CrossRef]
  48. Jumper, J.; Evans, R.; Pritzel, A.; Green, T.; Figurnov, M.; Ronneberger, O.; Tunyasuvunakool, K.; Bates, R.; Žídek, A.; Potapenko, A.; et al. Highly Accurate Protein Structure Prediction with AlphaFold. Nature 2021, 596, 583–589. [Google Scholar] [CrossRef]
  49. Varadi, M.; Anyango, S.; Deshpande, M.; Nair, S.; Natassia, C.; Yordanova, G.; Yuan, D.; Stroe, O.; Wood, G.; Laydon, A.; et al. AlphaFold Protein Structure Database: Massively Expanding the Structural Coverage of Protein-Sequence Space with High-Accuracy Models. Nucleic Acids Res. 2022, 50, D439–D444. [Google Scholar] [CrossRef]
  50. Qu, L.; Zhou, Q.T.; Wu, D.; Zhao, S.W. Crystal Structure of the alpha2A Adrenergic Receptor in Complex with a Partial Agonist. Available online: https://www.rcsb.org/structure/6KUY (accessed on 4 December 2019).
  51. Pettersen, E.F.; Goddard, T.D.; Huang, C.C.; Couch, G.S.; Greenblatt, D.M.; Meng, E.C.; Ferrin, T.E. UCSF Chimera--a Visualization System for Exploratory Research and Analysis. J. Comput. Chem. 2004, 25, 1605–1612. [Google Scholar] [CrossRef]
  52. The PyMOL Molecular Graphics System. Version 2.5.2. Schrödinger, LLC: New York, NY, USA, 2020.
  53. Wang, Y.-L.; Li, J.-Y.; Shi, X.-X.; Wang, Z.; Hao, G.-F.; Yang, G.-F. Web-Based Quantitative Structure—Activity Relationship Resources Facilitate Effective Drug Discovery. Top. Curr. Chem. 2021, 379, 37. [Google Scholar] [CrossRef]
  54. Molecular Operating Environment (MOE); Chemical Computing Group ULC: Montreal, QC, Canada, 2021.
  55. Righetti, G.; Casale, M.; Liessi, N.; Tasso, B.; Salis, A.; Tonelli, M.; Millo, E.; Pedemonte, N.; Fossa, P.; Cichero, E. Molecular Docking and QSAR Studies as Computational Tools Exploring the Rescue Ability of F508del CFTR Correctors. Int. J. Mol. Sci. 2020, 21, 8084. [Google Scholar] [CrossRef]
  56. Kennard, R.W.; Stone, L.A. Computer Aided Design of Experiments. Technometrics 1969, 11, 137–148. [Google Scholar] [CrossRef]
  57. Forina, M.; Boggia, R.; Mosti, L.; Fossa, P. Zupan’s Descriptors in QSAR Applied to the Study of a New Class of Cardiotonic Agents. Farmaco 1997, 52, 411–419. [Google Scholar] [PubMed]
  58. Stanton, D.T.; Jurs, P.C. Development and Use of Charged Partial Surface Area Structural Descriptors in Computer-Assisted Quantitative Structure-Property Relationship Studies. Anal. Chem. 1990, 62, 2323–2329. [Google Scholar] [CrossRef]
  59. Wildman, S.A.; Crippen, G.M. Prediction of Physicochemical Parameters by Atomic Contributions. J. Chem. Inf. Comput. Sci. 1999, 39, 868–873. [Google Scholar] [CrossRef]
  60. Balaban, A.T. Highly Discriminating Distance-Based Topological Index. Chem. Phys. Lett. 1982, 89, 399–404. [Google Scholar] [CrossRef]
  61. Moro, S.; Bacilieri, M.; Cacciari, B.; Bolcato, C.; Cusan, C.; Pastorin, G.; Klotz, K.-N.; Spalluto, G. The Application of a 3D-QSAR (autoMEP/PLS) Approach as an Efficient Pharmacodynamic-Driven Filtering Method for Small-Sized Virtual Library: Application to a Lead Optimization of a Human A3 Adenosine Receptor Antagonist. Bioorganic Med. Chem. 2006, 14, 4923–4932. [Google Scholar] [CrossRef] [PubMed]
  62. Dudek, M.; Knutelska, J.; Bednarski, M.; Nowiński, L.; Zygmunt, M.; Mordyl, B.; Głuch-Lutwin, M.; Kazek, G.; Sapa, J.; Pytka, K. A Comparison of the Anorectic Effect and Safety of the Alpha2-Adrenoceptor Ligands Guanfacine and Yohimbine in Rats with Diet-Induced Obesity. PLoS ONE 2015, 10, e0141327. [Google Scholar] [CrossRef]
  63. Kotańska, M.; Marcinkowska, M.; Kuder, K.J.; Walczak, M.; Bednarski, M.; Siwek, A.; Kołaczkowski, M. Metabolic and Cardiovascular Benefits and Risks of 4-Hydroxy Guanabenz Hydrochloride: A2-Adrenoceptor and Trace Amine-Associated Receptor 1 Ligand. Pharmacol. Rep. 2023, 75, 1211–1229. [Google Scholar] [CrossRef]
  64. Lam, V.M.; Rodríguez, D.; Zhang, T.; Koh, E.J.; Carlsson, J.; Salahpour, A. Discovery of Trace Amine-Associated Receptor 1 Ligands by Molecular Docking Screening against a Homology Model. MedChemComm 2015, 6, 2216–2223. [Google Scholar] [CrossRef]
  65. Espinoza, S.; Masri, B.; Salahpour, A.; Gainetdinov, R.R. BRET Approaches to Characterize Dopamine and TAAR1 Receptor Pharmacology and Signaling. Methods Mol. Biol. 2013, 964, 107–122. [Google Scholar] [CrossRef]
  66. Hu, L.A.; Zhou, T.; Ahn, J.; Wang, S.; Zhou, J.; Hu, Y.; Liu, Q. Human and Mouse Trace Amine-Associated Receptor 1 Have Distinct Pharmacology towards Endogenous Monoamines and Imidazoline Receptor Ligands. Biochem. J. 2009, 424, 39–45. [Google Scholar] [CrossRef] [PubMed]
  67. Yoshino, S.; Iwasaki, Y.; Matsumoto, S.; Satoh, T.; Ozawa, A.; Yamada, E.; Kakizaki, S.; Trejo, J.A.O.; Uchiyama, Y.; Yamada, M.; et al. Administration of Small-Molecule Guanabenz Acetate Attenuates Fatty Liver and Hyperglycemia Associated with Obesity. Sci. Rep. 2020, 10, 13671. [Google Scholar] [CrossRef]
  68. Kotańska, M.; Knutelska, J.; Nicosia, N.; Mika, K.; Szafarz, M. Guanabenz-an Old Drug with a Potential to Decrease Obesity. Naunyn-Schmiedeberg–s Arch. Pharmacol. 2022, 395, 963–974. [Google Scholar] [CrossRef] [PubMed]
  69. Michael, E.S.; Covic, L.; Kuliopulos, A. Trace Amine-Associated Receptor 1 (TAAR1) Promotes Anti-Diabetic Signaling in Insulin-Secreting Cells. J. Biol. Chem. 2019, 294, 4401–4411. [Google Scholar] [CrossRef] [PubMed]
  70. Raab, S.; Wang, H.; Uhles, S.; Cole, N.; Alvarez-Sanchez, R.; Künnecke, B.; Ullmer, C.; Matile, H.; Bedoucha, M.; Norcross, R.D.; et al. Incretin-like Effects of Small Molecule Trace Amine-Associated Receptor 1 Agonists. Mol. Metab. 2016, 5, 47–56. [Google Scholar] [CrossRef]
  71. Leo, D.; Sukhanov, I.; Zoratto, F.; Illiano, P.; Caffino, L.; Sanna, F.; Messa, G.; Emanuele, M.; Esposito, A.; Dorofeikova, M.; et al. Pronounced Hyperactivity, Cognitive Dysfunctions, and BDNF Dysregulation in Dopamine Transporter Knock-out Rats. J. Neurosci. 2018, 38, 1959–1972. [Google Scholar] [CrossRef]
  72. Savchenko, A.; Targa, G.; Fesenko, Z.; Leo, D.; Gainetdinov, R.R.; Sukhanov, I. Dopamine Transporter Deficient Rodents: Perspectives and Limitations for Neuroscience. Biomolecules 2023, 13, 806. [Google Scholar] [CrossRef]
  73. Kurzina, N.; Belskaya, A.; Gromova, A.; Ignashchenkova, A.; Gainetdinov, R.R.; Volnova, A. Modulation of Spatial Memory Deficit and Hyperactivity in Dopamine Transporter Knockout Rats via α2A-Adrenoceptors. Front. Psychiatry 2022, 13, 851296. [Google Scholar] [CrossRef]
  74. V-PARVUS 2010. An Extendable Package of Programs for Explorative Data Analysis, Classification and Regression Analysis. Dip Chimica e Tecnologie Farmaceutiche, University of Genova. Available online: https://iris.unige.it/handle/11567/242687 (accessed on 23 September 2023).
  75. Boggia, R.; Forina, M.; Fossa, P.; Mosti, L. Chemometric Study and Validation Strategies in the Structure-Activity Relationships of New Cardiotonic Agents. Quant. Struct. Act. Relat. 1997, 16, 201–213. [Google Scholar] [CrossRef]
  76. Cruciani, G.; Crivori, P.; Carrupt, P.-A.; Testa, B. Molecular Fields in Quantitative Structure–Permeation Relationships: The VolSurf Approach. J. Mol. Struct. THEOCHEM 2000, 503, 17–30. [Google Scholar] [CrossRef]
  77. Petitjean, M. Applications of the Radius-Diameter Diagram to the Classification of Topological and Geometrical Shapes of Chemical Compounds. J. Chem. Inf. Comput. Sci. 1992, 32, 331–337. [Google Scholar] [CrossRef]
  78. Wolber, G.; Seidel, T.; Bendix, F.; Langer, T. Molecule-Pharmacophore Superpositioning and Pattern Matching in Computational Drug Design. Drug Discov. Today 2008, 13, 23–29. [Google Scholar] [CrossRef]
  79. Khalid, S.; Hanif, R.; Jabeen, I.; Mansoor, Q.; Ismail, M. Pharmacophore Modeling for Identification of Anti-IGF-1R Drugs and in-Vitro Validation of Fulvestrant as a Potential Inhibitor. PLoS ONE 2018, 13, e0196312. [Google Scholar] [CrossRef]
  80. Haidar, S.; Bouaziz, Z.; Marminon, C.; Laitinen, T.; Poso, A.; Le Borgne, M.; Jose, J. Development of Pharmacophore Model for Indeno[1,2-b]Indoles as Human Protein Kinase CK2 Inhibitors and Database Mining. Pharmaceuticals 2017, 10, 8. [Google Scholar] [CrossRef]
  81. Sukhanov, I.; Dorofeikova, M.; Dolgorukova, A.; Dorotenko, A.; Gainetdinov, R.R. Trace Amine-Associated Receptor 1 Modulates the Locomotor and Sensitization Effects of Nicotine. Front. Pharmacol. 2018, 9, 329. [Google Scholar] [CrossRef]
Figure 1. Chemical structure and biological activity of the reference dual acting TAAR1 and α2-ADR ligand S18616. Representative examples of TAAR1 or α2-ADR selective imidazoline and imidazole derivatives [35].
Pharmaceuticals 16 01632 g001
Figure 2. Workflow of the present study: a combination approach through molecular modeling studies and biological assays.
Pharmaceuticals 16 01632 g002
Figure 3. Docking mode of S18616 (C atom; magenta) at the hTAAR1 (A,B) and α2-ADR (C,D) binding site. A perspective of the ligand volume (light brown) and of the protein cavity is depicted in (A) and (C), respectively. The most important residues involved in the agonist binding are labelled (B,D). A and C representations have been performed via Chimera 1.16 [51], while the ligand-protein contacts have been explored by means of PyMol software 2.5.2—Incentive Product Copyright (C) Schrodinger, LLC [52].
Pharmaceuticals 16 01632 g003
Figure 4. Docking pose of compound 5a (C atom; magenta) within the hTAAR1 (A) and α2-ADR (B) binding sites. The most important residues involved in the agonist binding are labelled. Ligand-protein contacts have been explored by means of PyMol software 2.5.2—Incentive Product Copyright (C) Schrodinger, LLC [52].
Pharmaceuticals 16 01632 g004
Figure 5. Docking pose of compound 6a (C atom; magenta) within the hTAAR1 (A) and α2-ADR (B) binding sites. The most important residues involved in the agonist binding are labelled. Ligand-protein contacts have been explored by means of PyMol software 2.5.2—Incentive Product Copyright (C) Schrodinger, LLC [52].
Pharmaceuticals 16 01632 g005
Figure 6. Docking pose of compound 5c (C atom; magenta) within the hTAAR1 (A) and α2-ADR (B) binding sites. The most important residues involved in the agonist binding are labelled. Ligand-protein contacts have been explored by means of PyMol software 2.5.2—Incentive Product Copyright (C) Schrodinger, LLC [52].
Pharmaceuticals 16 01632 g006
Figure 7. Docking mode of 6c (C atom; magenta) at the hTAAR1 (A) and at the α2-ADR (B) binding site. The most important residues involved in the agonist binding are labelled. Ligand-protein contacts have been explored by means of PyMol software 2.5.2—Incentive Product Copyright (C) Schrodinger, LLC [52].
Pharmaceuticals 16 01632 g007
Figure 8. Docking positioning of 16 (C atom; magenta) at the hTAAR1 binding site (A) and of 18 at the α2-ADR cavity (B). The most important residues involved in the agonist binding are labelled. Ligand-protein contacts have been explored by means of PyMol software 2.5.2—Incentive Product Copyright (C) Schrodinger, LLC [52].
Pharmaceuticals 16 01632 g008
Figure 9. Docking mode of 24 (C atom; magenta) at the hTAAR1 (A) and at the α2-ADR (B) binding site. The most important residues involved in the agonist binding are labelled. Ligand-protein contacts have been explored by means of PyMol software 2.5.2—Incentive Product Copyright (C) Schrodinger, LLC [52].
Pharmaceuticals 16 01632 g009
Figure 10. Distribution of the predicted (Pred. hTAAR1 pKi) versus the experimental (Exp. hTAAR1 pKi) hTAAR1 binding affinity featured by the training set (A) and test set derivatives (B). Compounds are represented as dots.
Pharmaceuticals 16 01632 g010
Figure 11. Distribution of the predicted (Pred. α2-ADR pKi) versus the experimental (Exp. α2-ADR pKi) α2-ADR binding affinity featured by the training set (A) and test set derivatives (B). Compounds are represented as dots.
Pharmaceuticals 16 01632 g011
Figure 12. Schematic representation of the importance played by the DipoleY and Q_VSA_PNEG descriptors to influence the compound (hTAAR1 and α2-ADR) binding affinity values. The two descriptors are endowed by the highest RI values in model (A,B), respectively. Compounds are represented as dots.
Pharmaceuticals 16 01632 g012
Figure 13. PM_A (hTAAR1 targeting ability) (A) and PM_B (α2-ADR targeting ability) (B) as featured by the dataset compounds. The most relevant features (F) are represented as colored spheres and classified as related to aromatic or hydrophobic groups (AroǀHyd) or only hydrophobic- (Hyd) or aromatic- cores (Aro), or to H-bonding acceptor (Acc) or donor (Don) groups. Compounds 25 (C atom; light pink) and 14 (C atom; light pink) were taken as representative of the dataset in PM_A and PM_B, respectively. Distance among the recurrent features shared by both PM_A and PM_B are reported.
Pharmaceuticals 16 01632 g013
Figure 14. The functional activity at hTAAR1 of guanfacine, guanabenz, and β-PEA presented as concentration-dependent curves.
Pharmaceuticals 16 01632 g014
Figure 15. Action of guanfacine (0.1 and 0.3 mg/kg, i/p) on locomotor activity of WT and DAT-KO rats. ** p < 0.01, * p < 0.05 (Bonferroni’s test) vs. the vehicle-treated animals.
Pharmaceuticals 16 01632 g015
Table 1. Comparison of the hTAAR and α2-ADR as based on the alignment of the two proteins (Figure S3). Residues 3.5 Å far from the 6KUY co-crystallized ligand are listed.
ProteinCorresponding Residues
6KUYAsp113Val114Cys117Ile190Ser204
hTAAR1Asp103Ile104Ser107Val184Ser198
6KUYTrp387Phe390Phe391Phe412Tyr416
hTAAR1Trp264Phe267Phe268Ile290Tyr294
Table 2. List of the selected descriptors in tandem with the related type, series, and relative importance index (RI). Negatively related descriptors are shown in italics.
Molecular Descriptor CodeDescriptor ClassDescriptionDescriptor TypeRelative Importance (RI)
DipoleY3D-VThe y component of the dipole moment (external coordinates).Conformation
Dependent Charge Descriptors
1.00000
SlogP_VSA42D-IISum of vi such that Li is in (0.1, 0.15].Subdivided Surface Areas0.810513
DCASA3D-VAbsolute value of the difference between CASA+ (Positive charge weighted surface area, ASA+ times max {qi > 0}) and CASA- (Negative charge weighted surface area, ASA- times max {qi < 0}). [58]Conformation
Dependent Charge Descriptors
0.582248
E3D-IValue of the potential energy. The state of all term enable flags will be honored (in addition to the term weights). This means that the current potential setup accurately reflects what will be calculated.Potential Energy Descriptors0.435867
vsurf_IW53D-IIIHydrophilic integy moment (8 descriptors)Surface Area, Volume and Shape Descriptors0.344589
DipoleZ3D-VThe z component of the dipole moment (external coordinates).Conformation
Dependent Charge Descriptors
0.325382
Q_VSA_FHYD2D-VFractional hydrophobic van der Waals surface area. This is the sum of the vi such that |qi| is less than or equal to 0.2 divided by the total surface area. The vi are calculated using a connection table approximation.Partial Charge
Descriptors
0.31853
vsurf_EDmin13D-IIILowest hydrophobic energy (3 descriptors)Surface Area, Volume and Shape Descriptors0.29631
Q_RPC-2D-VRelative negative partial charge: the smallest negative qi divided by the sum of the negative qi. Q_RPC- is identical to RPC- which has been retained for compatibility.Partial Charge Descriptors0.061043
GCUT_SMR_02D-VIIThe GCUT descriptors using atomic contribution to molar refractivity (using the Wildman and Crippen SMR method) [59] instead of partial charge.Adjacency and
Distance Matrix
Descriptors
0.027644
Table 3. List of the selected descriptors, in tandem with the related type, series, and relative importance index (RI). Negatively related descriptors are shown in italics.
Molecular Descriptor CodeDescriptor ClassDescriptionDescriptor TypeRelative Importance (RI)
Q_VSA_PNEG2D-VFractional negative van der Waals surface area. This is the sum of the vi such that qi is negative divided by the total surface area. The vi are calculated using a connection table approximation.Partial Charge
Descriptors
1.000000
Q_VSA_POL2D-VTotal positive van der Waals surface area. This is the sum of the vi such that qi is non-negative. The vi are calculated using a connection table approximation.Partial Charge
Descriptors
0.795835
SlogP_VSA32D-IISum of vi such that Li is in (0,0.1].Subdivided Surface Areas0.195358
vsurf_ID73D-IIIHydrophobic integy moment (8 descriptors)Surface Area,
Volume and Shape Descriptors
0.156047
vsa_other2D-VIApproximation to the sum of VDW surface areas (Å2) of atoms typed as “other”.Pharmacophore Feature Descriptors0.102077
vsurf_IW43D-IIIHydrophilic integy moment (8 descriptors)Surface Area,
Volume and Shape Descriptors
0.1005
E_tor3D-ITorsion (proper and improper) potential energy. In the Potential Setup panel, the term enable (Bonded) flag is ignored, but the term weight is applied.Potential Energy Descriptors0.098422
balabanJ2D-VIIBalaban’s connectivity topological index [60].Adjacency and
Distance Matrix
Descriptors
0.085904
vsurf_ID13D-IIIHydrophobic integy moment (8 descriptors)Surface Area,
Volume and Shape
Descriptors
0.022599
GCUT_SMR_12D-VIIThe GCUT descriptors using atomic contribution to molar refractivity (using the Wildman and Crippen SMR method) instead of partial charge.Adjacency and
Distance Matrix
Descriptors
0.005108
Q_VSA_FHYD2D-VFractional hydrophobic van der Waals surface area. This is the sum of the vi such that |qi| is less than or equal to 0.2 divided by the total surface area. The vi are calculated using a connection table approximation.Partial Charge
Descriptors
0.001779
Disclaimer/Publisher’s Note: The statements, opinions and data contained in all publications are solely those of the individual author(s) and contributor(s) and not of MDPI and/or the editor(s). MDPI and/or the editor(s) disclaim responsibility for any injury to people or property resulting from any ideas, methods, instructions or products referred to in the content.

